

Effects of Plot Design on Estimating Tree Species Richness and Species Diversity

Abstract
:1. Introduction
2. Materials and Methods
2.1. Study Site
2.2. Data
2.3. Methods
2.3.1. Plot Design
2.3.2. Species Richness
2.3.3. Species Diversity
2.3.4. Simulation and Analysis Methods
3. Results
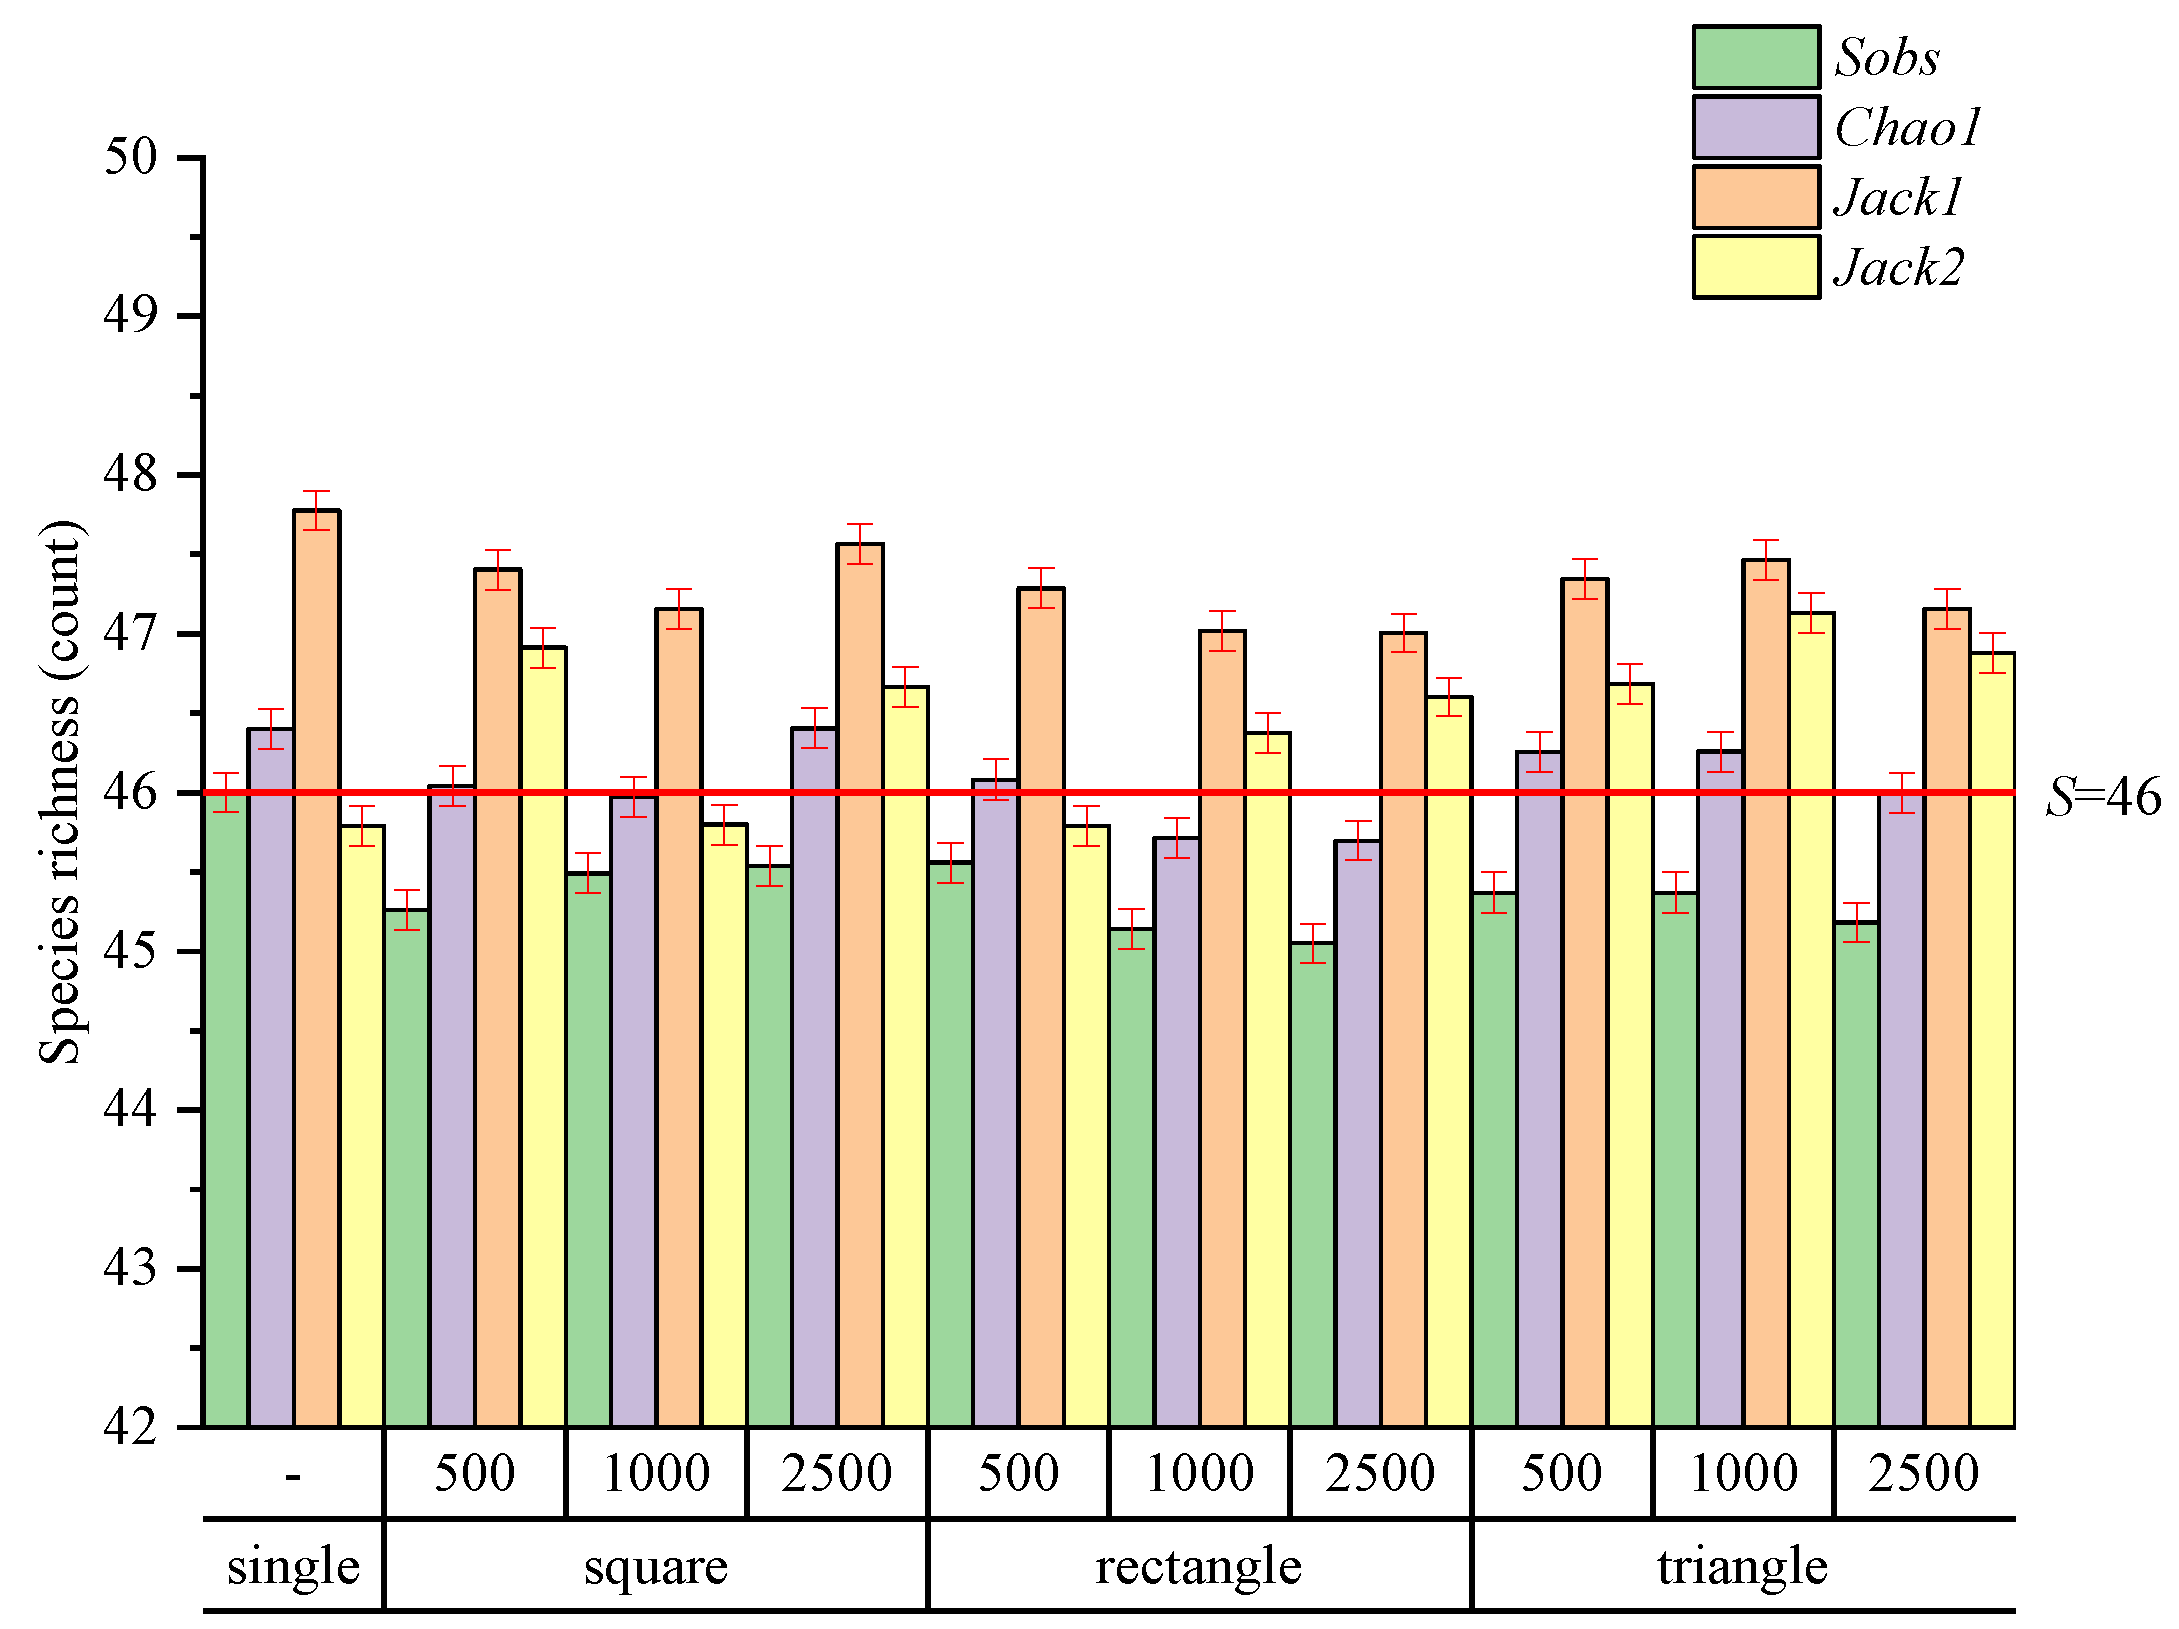
3.1. Species Richness
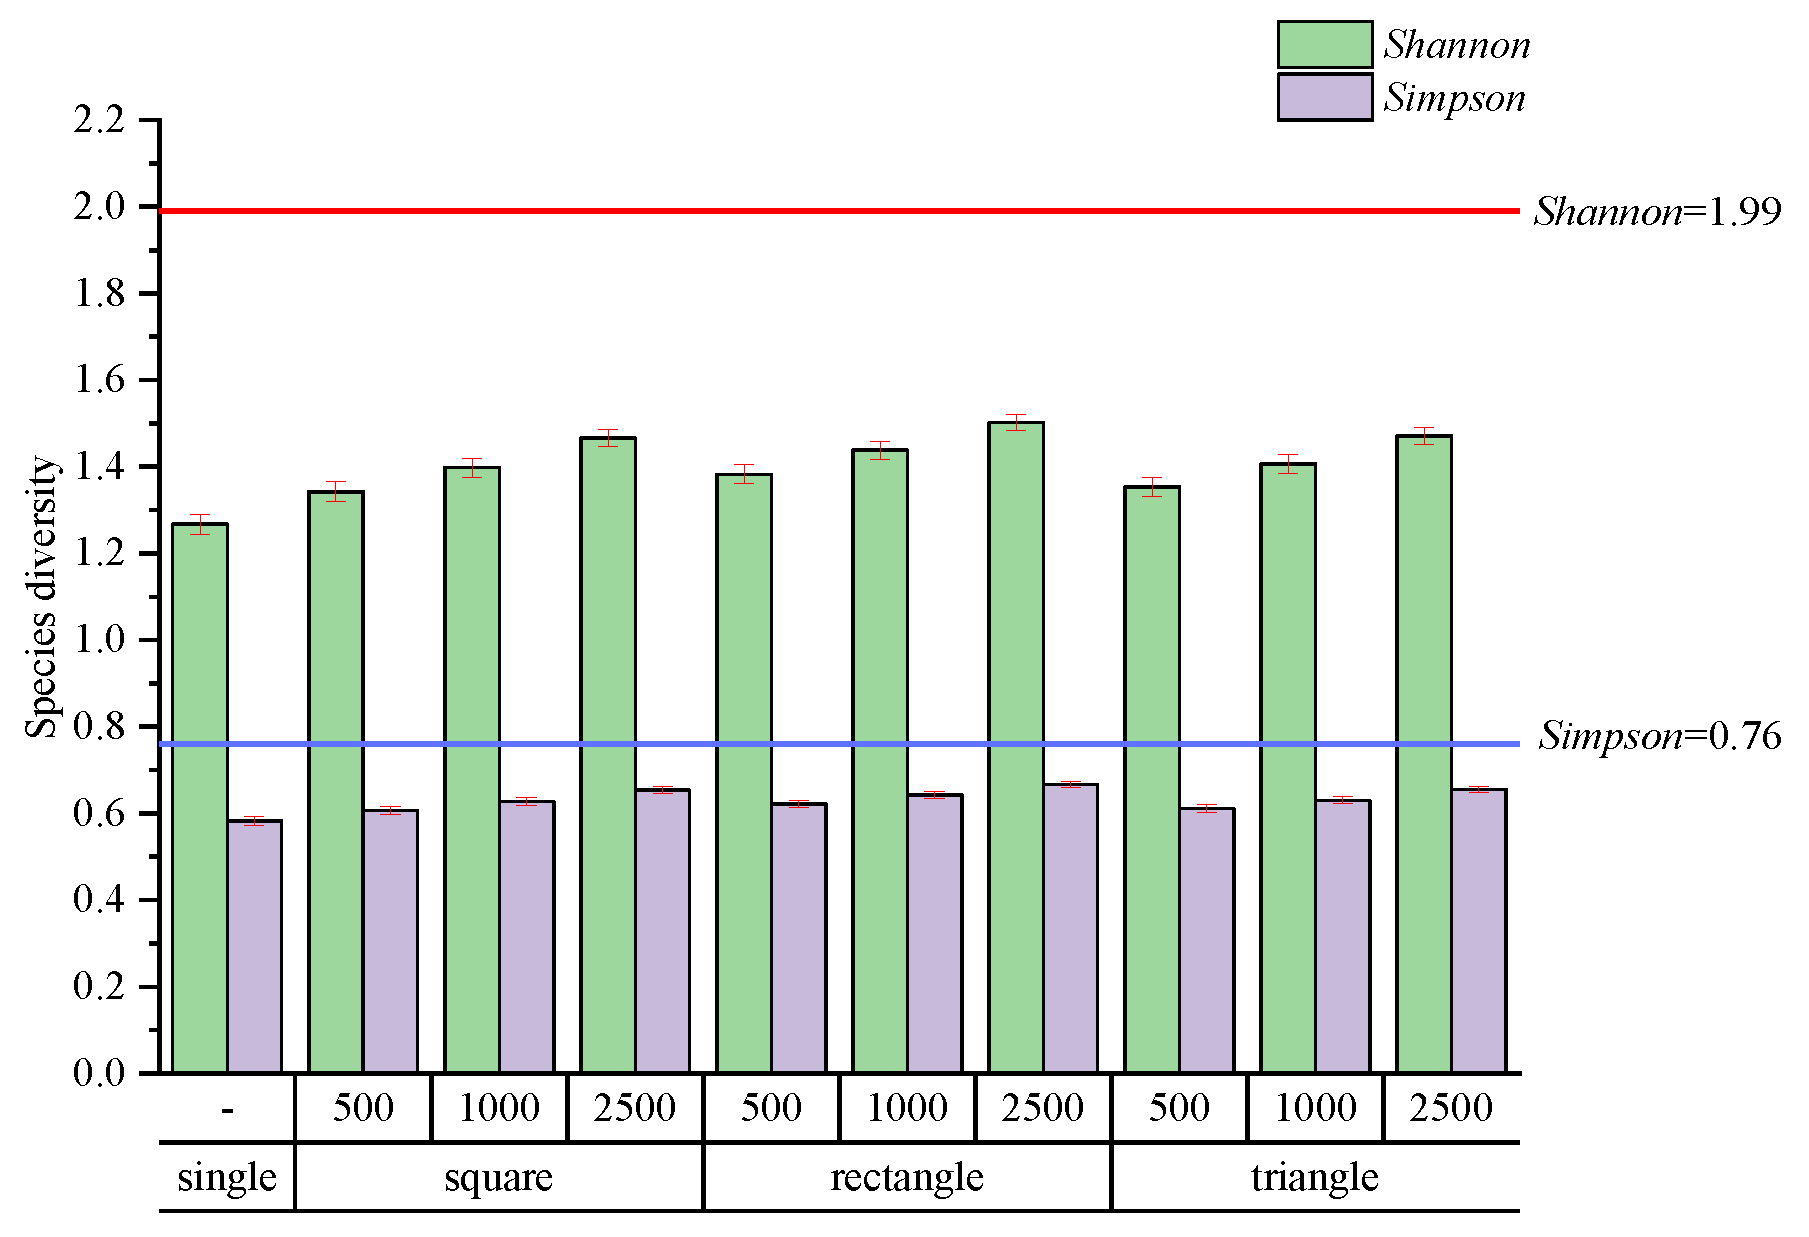
3.2. Species Diversity
4. Discussion
4.1. Effect of Plot Design on Sampling Performance
4.2. Study Limitations and Future Perspectives
5. Conclusions
Author Contributions
Funding
Institutional Review Board Statement
Informed Consent Statement
Data Availability Statement
Acknowledgments
Conflicts of Interest
References
- Xie, S. Philosophical Thinking and Analysing on the Practice of China’s Forest Resouces Classification Management. Ph.D. Thesis, Beijing Forestry University, Beijing, China, 2006. [Google Scholar]
- Crow, T.R.; Buckley, D.S.; Nauertz, E.A.; Zasada, J.C. Effects of management on the composition and structure of northern hardwood forests in Upper Michigan. For. Sci. 2002, 48, 129–145. [Google Scholar]
- Larson, B.C. Thoughts on the development of new, appropriate measures of complexity. In Complex Stand Structures and Associated Dynamics: Measurement Indices and Modelling; Ontario Forest Research Institute: Sault Ste. Marie, ON, Canada, 2007; p. 54. [Google Scholar]
- Bonan, G.B. Forests and climate change: Forcings, feedbacks, and the climate benefits of forests. Science 2008, 320, 1444–1449. [Google Scholar] [CrossRef] [Green Version]
- Chiarucci, A.; Bacaro, G.; Scheiner, S.M. Old and new challenges in using species diversity for assessing biodiversity. Philos. Trans. R. Soc. Lond. B Biol. Sci. 2011, 366, 2426–2437. [Google Scholar] [CrossRef] [Green Version]
- Yang, Y. A Study on Quantity and Sampling Optimization of Wetland Plant Species Diversity Based on UAVRS. Master’s Thesis, Jiangxi Normal University, Nanchang, China, 2020. [Google Scholar]
- Wang, K.; Wang, C.; Feng, X.; Wu, X.; Fu, B. Research progress on the relationship between biodiversity and ecosystem multifuctionality. Acta Ecol. Sin. 2022, 42, 13. [Google Scholar]
- Haas, S.E.; Hooten, M.B.; Rizzo, D.M.; Meentemeyer, R.K. Forest species diversity reduces disease risk in a generalist plant pathogen invasion. Ecol. Lett. 2011, 14, 1108–1116. [Google Scholar] [CrossRef] [PubMed]
- Fan, X.; Zhang, B.; Fan, C. Effects of species diversity and structural diversity on productivity in different succession stages of typical natural forest in Changbai Mountains of northeastern China. J. Beijing For. Univ. 2021, 43, 1–8. [Google Scholar]
- Lei, X.; Wang, W.; Peng, C. Relationships between stand growth and structural diversity in spruce-dominated forests in New Brunswick, Canada. Can. J. For. Res. 2009, 39, 1835–1847. [Google Scholar] [CrossRef] [Green Version]
- Huang, L.; Yu, Y.; An, X.; Yu, L.; Xue, Y. Leaf functional traits, species diversity and functional diversity of plant community in Tiankeng forests. Acta Ecol. Sin. 2022, 42, 1–12. [Google Scholar]
- Liang, J.; Crowther, T.W.; Picard, N.; Wiser, S.; Zhou, M.; Alberti, G.; Schulze, E.-D.; McGuire, A.D.; Bozzato, F.; Pretzsch, H. Positive biodiversity-productivity relationship predominant in global forests. Science 2016, 354, aaf8957. [Google Scholar] [CrossRef] [Green Version]
- Zhu, J.; Wu, A.; Zou, S.; Xiong, X.; Liu, S.; Chu, G.; Zhang, Q.; Liu, J.; Tang, X.; Yan, J.; et al. Relationships between tree diversity and biomass/productivity and their influence factors in a lower subtropical evergreen broad-leaved forest. Biodivers. Sci. 2021, 29, 1435–1446. [Google Scholar] [CrossRef]
- Pan, C.; Shi, R. Sustainable forest management: From timber to biodiversity. J. Beijing For. Univ. 2006, 6, 133–138. [Google Scholar]
- Bastow Wilson, J.; Lee, W.G.; Mark, A.F. Species diversity in relation to ultramafic substrate and to altitude in southwestern New Zealand. Vegetatio 1990, 86, 15–20. [Google Scholar] [CrossRef]
- Tilman, D.; Downing, J.A. Biodiversity and stability in grasslands. Nature 1994, 367, 363–365. [Google Scholar] [CrossRef]
- Pedro, M.S.; Rammer, W.; Seidl, R. Tree species diversity mitigates disturbance impacts on the forest carbon cycle. Oecologia 2015, 177, 619–630. [Google Scholar] [CrossRef]
- Kant, S. The marginal cost of structural diversity of mixed uneven-aged hard maple forests. Can. J. For. Res. 2002, 32, 616–628. [Google Scholar] [CrossRef]
- Li, L.; Wang, J. Spatial sampling model of geographic data. Prog. Nat. Sci. 2002, 12, 99–102. [Google Scholar]
- Shi, J.; Lei, Y.; Zhao, T. Research progress in sampling survey techniques of forest resources. For. Res. 2009, 22, 101–108. [Google Scholar]
- Sun, H.; Lin, H.; Shi, J.; Mo, D.; Zhu, G.; Zang, Z. Comparative study of remote sensing sampling technique in national forest inventory of Hunan provinc. J. Cent. South Univ. For. Technol. 2010, 30, 26–31. [Google Scholar] [CrossRef]
- Quon, C.; Lam, T.-Y.; Lin, H.-T. Designing cluster plots for sampling local plant species composition for biodiversity management. For. Syst. 2020, 29, e002. [Google Scholar] [CrossRef]
- Lin, H.-T.; Lam, T.Y.; von Gadow, K.; Kershaw, J.A. Effects of nested plot designs on assessing stand attributes, species diversity, and spatial forest structures. For. Ecol. Manag. 2020, 457, 117658. [Google Scholar] [CrossRef]
- West, P. Tamm review: Sampling to estimate the frequency distribution of tree diameters or ages across large forest areas. For. Ecol. Manag. 2021, 488, 118939. [Google Scholar] [CrossRef]
- Carrer, M.; Castagneri, D.; Popa, I.; Pividori, M.; Lingua, E. Tree spatial patterns and stand attributes in temperate forests: The importance of plot size, sampling design, and null model. For. Ecol. Manag. 2018, 407, 125–134. [Google Scholar] [CrossRef]
- Peck, J.; Zenner, E. Structure area curves in Eastern Hardwoods: Implications for minimum plot sizes to capture spatially explicit structure indices. Ann. For. Sci. 2021, 78, 16. [Google Scholar] [CrossRef]
- Wagner, F.; Rutishauser, E.; Blanc, L.; Herault, B. Effects of plot size and census interval on descriptors of forest structure and dynamics. Biotropica 2010, 42, 664–671. [Google Scholar] [CrossRef]
- Metcalfe, D.; Meir, P.; Aragao, L.E.O.; da Costa, A.; Almeida, S.; Braga, A.; Gonçalves, P.; Athaydes, J.; Malhi, Y.; Williams, M. Sample sizes for estimating key ecosystem characteristics in a tropical terra firme rainforest. For. Ecol. Manag. 2008, 255, 558–566. [Google Scholar] [CrossRef]
- Lin, D.; Lai, J.; Mi, X.; Ren, H.; Ma, K. Spatial variation in community structure of a subtropical evergreen broad-leaved forest: Implications for sampling design. Chin. Sci. Bull. 2013, 58, 1181–1186. [Google Scholar] [CrossRef] [Green Version]
- Gray, A. Monitoring stand structure in mature coastal Douglas-fir forests: Effect of plot size. For. Ecol. Manag. 2003, 175, 1–16. [Google Scholar] [CrossRef]
- Yang, T.-R.; Lam, T.Y.; Su, S.-H. A simulation study on the effects of plot size and shape on sampling plant species composition for biodiversity management. J. Sustain. For. 2019, 38, 116–129. [Google Scholar] [CrossRef]
- Gimaret-Carpentier, C.; Pélissier, R.; Pascal, J.P.; Houllier, F. Sampling strategies for the assessment of tree species diversity. J. Veg. Sci. 1998, 9, 161–172. [Google Scholar] [CrossRef]
- Yim, J.-S.; Shin, M.-Y.; Son, Y.; Kleinn, C. Cluster plot optimization for a large area forest resource inventory in Korea. For. Sci. Technol. 2015, 11, 139–146. [Google Scholar] [CrossRef]
- Bowering, R.; Wigle, R.; Padgett, T.; Adams, B.; Cote, D.; Wiersma, Y.F. Searching for rare species: A comparison of Floristic Habitat Sampling and Adaptive Cluster Sampling for detecting and estimating abundance. For. Ecol. Manag. 2018, 407, 1–8. [Google Scholar] [CrossRef]
- Thompson, S.K. Sampling; John Wiley & Sons: Hoboken, NJ, USA, 2012; Volume 755. [Google Scholar]
- Li, Z.; Chen, W.; Wei, J.; Kirim, M.; Zhang, Y.; Zhang, S.; Wang, X. Tree-ring growth responses of Liaodong Oak (Quercus wutaishanica) to climate in the Beijing Dongling Mountain of China. Acta Ecol. Sin. 2021, 41, 27–37. [Google Scholar]
- Gu, H.; Li, J.; Qi, G.; Wang, S. Species spatial distributions in a warm-temperate deciduous broad-leaved forest in China. J. For. Res. 2020, 31, 1187–1194. [Google Scholar] [CrossRef]
- Ding, Z.; Xu, G.; Zhang, S.; Zhang, Y.; Ma, K. Altitudinal pattern of soil fauna-plant interaction in Dongling Mountain, Beijing. Acta Ecol. Sin. 2022, 42, 2741–2750. [Google Scholar]
- Liu, H.; Li, L.; Sang, W. Species composition and community structure of the Donglingshan forest dynamic plot in a warm temperate deciduous broad-leaved secondary forest, China. Biodivers. Sci. 2011, 19, 232–242. [Google Scholar]
- Shi, X.; Yu, D.; Sun, W.; Wang, H.; Zhao, Q.; Gong, Z. Reference datum for Chinese and American soil classification Systems: A reference between soil classes and American soil classes. Chin. Sci. Bull. 2004, 13, 1299–1303. [Google Scholar]
- Gu, Y.; Lv, X.; Tao, Q.; Yu, Z.; Wang, L.; Li, Y. Effects of temperature and precipitation on litter decomposition in Donglingshan Mountain broad-leaved forest. Quat. Sci. 2021, 41, 1156–1168. [Google Scholar]
- Kleinn, C.; Corrales, L.; Morales, D. Forest area in Costa Rica: A comparative study of tropical forest cover estimates over time. Environ. Monit. Assess. 2002, 73, 17–40. [Google Scholar] [CrossRef]
- Güler, B.; Jentsch, A.; Apostolova, I.; Bartha, S.; Bloor, J.M.; Campetella, G.; Canullo, R.; Házi, J.; Kreyling, J.; Pottier, J. How plot shape and spatial arrangement affect plant species richness counts: Implications for sampling design and rarefaction analyses. J. Veg. Sci. 2016, 27, 692–703. [Google Scholar] [CrossRef] [Green Version]
- Yang, F. Study on Sampling Scheme Based on Annual Monitoring of Circular Cluster Plot Stock. Master’s Thesis, Beijing Forestry University, Beijing, China, 2017. [Google Scholar]
- Lei, X.; Hong, L.; Lu, Y.; Tang, M. Design of ground sample for national forest resources inventory. World For. Res. 2008, 21, 35–40. [Google Scholar] [CrossRef]
- Tomppo, E.; Gschwantner, T.; Lawrence, M.; McRoberts, R.E.; Gabler, K.; Schadauer, K.; Vidal, C.; Lanz, A.; Ståhl, G.; Cienciala, E. National forest inventories. In Pathways for Common Reporting; European Science Foundation: Strasbourg, France, 2010; Volume 1, pp. 541–553. [Google Scholar]
- Bechtold, W.A.; Patterson, P.L. The Enhanced Forest Inventory and Analysis Program—National Sampling Design and Estimation Procedures; USDA Forest Service, Southern Research Station: Asheville, NC, USA, 2005; Volume 80.
- Magurran, A. Measuring Biological Diversity, 1st ed.; Blackwell: Oxford, UK, 2004; 264p. [Google Scholar]
- Zahl, S. Jackknifing an index of diversity. Ecology 1977, 58, 907–913. [Google Scholar] [CrossRef]
- Chao, A. Nonparametric estimation of the number of classes in a population. Scand. J. Stat. 1984, 11, 265–270. [Google Scholar]
- Burnham, K.P.; Overton, W.S. Estimation of the size of a closed population when capture probabilities vary among animals. Biometrika 1978, 65, 625–633. [Google Scholar] [CrossRef]
- Simpson, E.H. Measurement of diversity. Nature 1949, 163, 688. [Google Scholar] [CrossRef]
- Shannon, C.E. A mathematical theory of communication. Bell Syst. Tech. J. 1948, 27, 379–423. [Google Scholar] [CrossRef] [Green Version]
- Valentine, H.T.; Ducey, M.J.; Gove, J.H.; Lanz, A.; Affleck, D.L. Corrections for cluster-plot slop. For. Sci. 2006, 52, 55–66. [Google Scholar]
- Green, R.H.; Young, R.C. Sampling to detect rare species. Ecol. Appl. 1993, 3, 351–356. [Google Scholar] [CrossRef]
- Ye, W.; Ma, K.; Ma, K.; Sang, W.; Gao, X. Studies on Plant Community Diversity in Dongling Mountain, Beijing, China IX. The Influence of Scale on α-diversity. Acta Ecol. Sin. 1998, 18, 12–16. [Google Scholar]
- Seidler, T.G.; Plotkin, J.B. Seed dispersal and spatial pattern in tropical trees. PLoS Biol. 2006, 4, e344. [Google Scholar] [CrossRef]
- Ma, F.; Wang, S.; Feng, J.; Sang, W. Spatial distribution patterns of snag and standing trees in a warm temperate deciduous broad-leaved forest in Dongling Mountain, Beijing. Acta Ecol. Sin. 2018, 38, 5717–5725. [Google Scholar]
- Kleinn, C. Comparison of the performance of line sampling to other forms of cluster sampling. For. Ecol. Manag. 1994, 68, 365–373. [Google Scholar] [CrossRef]
- Kleinn, C. Ein Vergleich der Effizienz von verschiedenen Clusterformen in forstlichen Großrauminventuren. Forstwiss. Cent. Ver. Tharandter Forstl. Jahrb. 1996, 115, 378–390. [Google Scholar] [CrossRef]
- Condit, R.; Hubbell, S.P.; Lafrankie, J.V.; Sukumar, R.; Manokaran, N.; Ashton, F.P.S. Species-area and species-individual relationships for tropical trees: A comparison of three 50-ha plots. J. Ecol. 1996, 84, 549–562. [Google Scholar] [CrossRef] [Green Version]
- Chazdon, R.L.; Colwell, R.; Denslow, J.; Guariguata, M. Statistical methods for estimating species richness of woody regeneration in primary and secondary rain forests of northeastern Costa Rica. Man Biosph. 1998, 20, 285–309. [Google Scholar]
- Smith, E.P.; van Belle, G. Nonparametric estimation of species richness. Biometrics 1984, 40, 119–129. [Google Scholar] [CrossRef] [Green Version]
- Liu, C.; Ma, K.; Yu, S.; Wang, W. Plant Community Diversity in Dongling Mountain, Beijing, China Ⅵ. Estimation of The Numbers of Species in Several Types of Plant Communities. Acta Ecol. Sin. 1998, 18, 138–150. [Google Scholar]
- Lande, R. Statistics and partitioning of species diversity, and similarity among multiple communities. Oikos 1996, 76, 5–13. [Google Scholar] [CrossRef]
- Heltshe, J.F.; Forrester, N.E. Estimating species richness using the jackknife procedure. Biometrics 1983, 39, 1–11. [Google Scholar] [CrossRef]
- Pitkänen, S. The use of diversity indices to assess the diversity of vegetation in managed boreal forests. For. Ecol. Manag. 1998, 112, 121–137. [Google Scholar] [CrossRef]
- Meng, J.; Li, S.; Wang, W.; Liu, Q.; Xie, S.; Ma, W. Estimation of forest structural diversity using the spectral and textural information derived from SPOT-5 satellite images. Remote Sens. 2016, 8, 125. [Google Scholar] [CrossRef] [Green Version]
- Hui, G. The Neighbourhood Partten: A New Structure Parameter for Describing Distribution of Forest Tree Position. Sci. Silvae Sin. 1999, 35, 37–42. [Google Scholar]
- Bettinger, P.; Tang, M. Tree-level harvest optimization for structure-based forest management based on the species mingling index. Forests 2015, 6, 1121–1144. [Google Scholar] [CrossRef]
- Ozdemir, I.; Karnieli, A. Predicting forest structural parameters using the image texture derived from WorldView-2 multispectral imagery in a dryland forest, Israel. Int. J. Appl. Earth Obs. Geoinf. 2011, 13, 701–710. [Google Scholar] [CrossRef]
- Pommerening, A. Approaches to quantifying forest structures. For. Int. J. For. Res. 2002, 75, 305–324. [Google Scholar] [CrossRef]


| Family | Genera | Species | Relative Frequency (%) |
|---|---|---|---|
| Adoxaceae | Sambucus | Sambucus williamsii | 0.0123 |
| Araliaceae | Eleutherococcus | Eleutherococcus senticosus | 0.0062 |
| Betulaceae | Betula | Betula chinensis | 0.0062 |
| Betula dahurica | 14.8132 | ||
| Betula platyphylla | 4.4803 | ||
| Corylus | Corylus mandshurica | 0.2400 | |
| Caprifoliaceae | Abelia | Zabelia biflora | 2.3448 |
| Lonicera | Lonicera hispida | 0.0246 | |
| Lonicera chrysantha | 0.0308 | ||
| Cornaceae | Cornus | Cornus bretschneideri | 0.2216 |
| Ericaceae | Rhododendron | Rhododendron micranthum | 0.1292 |
| Rhododendron mucronulatum | 0.0246 | ||
| Fagaceae | Quercus | Quercus mongolica | 27.0417 |
| Hydrangeaceae | Deutzia | Deutzia parviflora | 0.0123 |
| Hydrangea | Hydrangea bretschneideri | 0.5354 | |
| Juglandaceae | Juglans | Juglans mandshurica | 3.1140 |
| Lamiaceae | Vitex | Vitex negundo | 0.0062 |
| Malvaceae | Tilia | Tilia amurensis | 0.1723 |
| Tilia mandshurica | 1.5755 | ||
| Tilia mongolica | 2.0494 | ||
| Tilia tuan | 0.0369 | ||
| Oleaceae | Fraxinus | Fraxinus bungeana | 0.2216 |
| Fraxinus chinensis | 4.0002 | ||
| Syringa | Syringa reticulata | 0.0615 | |
| Syringa tomentella | 1.0955 | ||
| Pinaceae | Larix | Larix gmelinii | 0.7139 |
| Rhamnaceae | Rhamnus | Rhamnus davurica | 1.3601 |
| Rhamnus globosa | 0.0492 | ||
| Rhamnus parvifolia | 0.1108 | ||
| Rosaceae | Malus | Malus baccata | 0.0800 |
| Padus | Prunus padus | 0.1477 | |
| Prunus | Prunus davidiana | 0.8431 | |
| Prunus sibirica | 0.0985 | ||
| Sorbus | Sorbus discolor | 3.4648 | |
| Spiraea | Spiraea dasyantha | 0.0062 | |
| Salicaceae | Populus | Populus cathayana | 0.9970 |
| Populus davidiana | 8.3205 | ||
| Populus tomentosa | 0.0185 | ||
| Salix | Salix babylonica | 0.0369 | |
| Salix caprea | 0.0062 | ||
| Salix pseudotangii | 0.0985 | ||
| Salix schwerinii | 0.8801 | ||
| Sapindaceae | Acer | Acer pictum | 15.4533 |
| Ulmaceae | Ulmus | Ulmus laciniata | 0.9416 |
| Ulmus macrocarpa | 2.0247 | ||
| Ulmus pumila | 2.0924 |
| Plot Design | p-Value | |||||
|---|---|---|---|---|---|---|
| PCONFIG | SCONFIG | EGROUND (m2) | Sobs | Chao1 | Jack1 | Jack2 |
| cluster | square | 500 | <0.001 *** | 0.0258 * | 0.0132 * | 0.0156 * |
| rectangle | 500 | <0.001 *** | 0.0204 * | 0.0819 ** | 0.0286 * | |
| triangle | 500 | <0.001 *** | 0.0416 * | 0.0532 | 0.0182 * | |
| square | 1000 | <0.001 *** | 0.0115 * | 0.0501 | 0.0149 * | |
| rectangle | 1000 | <0.001 *** | 0.0039 ** | 0.0034 ** | 0.0018 ** | |
| triangle | 1000 | <0.001 *** | 0.0128 * | 0.0474 * | 0.0276 * | |
| square | 2500 | <0.001 *** | 0.0115 * | 0.0227 * | 0.0076 ** | |
| rectangle | 2500 | <0.001 *** | 0.0247 * | 0.0445 * | 0.0340 * | |
| triangle | 2500 | <0.001 *** | 0.0114 * | 0.0134 * | 0.0011 ** | |
| Plot Design | Efficiency (Species Richness) | ||||
|---|---|---|---|---|---|
| SCONFIG | EGROUND (m2) | Sobs | Chao1 | Jack1 | Jack2 |
| square | 500 | 0.930 | 0.902 | 0.796 | 1.035 |
| rectangle | 500 | 0.899 | 0.894 | 0.802 | 1.051 |
| triangle | 500 | 0.921 | 0.891 | 0.801 | 0.971 |
| square | 1000 | 0.887 | 0.888 | 0.797 | 1.038 |
| rectangle | 1000 | 0.860 | 0.854 | 0.763 | 0.869 |
| triangle | 1000 | 0.880 | 0.850 | 0.762 | 0.869 |
| square | 2500 | 0.842 | 0.820 | 0.740 | 0.925 |
| rectangle | 2500 | 0.797 | 0.787 | 0.706 | 0.781 |
| triangle | 2500 | 0.830 | 0.812 | 0.732 | 0.802 |
| Plot Design | p-Value | |||
|---|---|---|---|---|
| PCONFIG | SCONFIG | EGROUND (m2) | Shannon | Simpson |
| cluster | square | 500 | 0.0031 ** | <0.001 *** |
| rectangle | 500 | 0.1230 | 0.0084 ** | |
| triangle | 500 | 0.0075 ** | <0.001 *** | |
| square | 1000 | 0.0324 | 0.0340 * | |
| rectangle | 1000 | 0.0439 | 0.0567 | |
| triangle | 1000 | 0.0500 | 0.0753 | |
| square | 2500 | 0.0477 * | 0.4074 | |
| rectangle | 2500 | <0.001 *** | 0.0106 * | |
| triangle | 2500 | 0.0233 * | 0.3073 | |
| Plot Design | Efficiency (Species Diversity) | ||
|---|---|---|---|
| SCONFIG | EGROUND (m2) | Shannon | Simpson |
| square | 500 | 0.918 | 0.902 |
| rectangle | 500 | 0.860 | 0.830 |
| triangle | 500 | 0.903 | 0.883 |
| square | 1000 | 0.839 | 0.804 |
| rectangle | 1000 | 0.775 | 0.727 |
| triangle | 1000 | 0.829 | 0.794 |
| square | 2500 | 0.730 | 0.673 |
| rectangle | 2500 | 0.662 | 0.598 |
| triangle | 2500 | 0.723 | 0.669 |
Publisher’s Note: MDPI stays neutral with regard to jurisdictional claims in published maps and institutional affiliations. |
© 2022 by the authors. Licensee MDPI, Basel, Switzerland. This article is an open access article distributed under the terms and conditions of the Creative Commons Attribution (CC BY) license (https://creativecommons.org/licenses/by/4.0/).
Share and Cite
Zhao, C.; Zhu, Y.; Meng, J. Effects of Plot Design on Estimating Tree Species Richness and Species Diversity. Forests 2022, 13, 2003. https://doi.org/10.3390/f13122003
Zhao C, Zhu Y, Meng J. Effects of Plot Design on Estimating Tree Species Richness and Species Diversity. Forests. 2022; 13(12):2003. https://doi.org/10.3390/f13122003
Chicago/Turabian StyleZhao, Chenhao, Yan Zhu, and Jinghui Meng. 2022. "Effects of Plot Design on Estimating Tree Species Richness and Species Diversity" Forests 13, no. 12: 2003. https://doi.org/10.3390/f13122003
APA StyleZhao, C., Zhu, Y., & Meng, J. (2022). Effects of Plot Design on Estimating Tree Species Richness and Species Diversity. Forests, 13(12), 2003. https://doi.org/10.3390/f13122003