Abstract
Previous studies have shown that climatic and anthropogenic factors influence the variations in the stable isotope signature of tree materials in an urban ecosystem. However, the responses of urban trees to various anthropogenic and precipitation interventions are unclear. To fill the research gap, the isotopic composition (δ15N and δ18O) and total nitrogen content of the soil-plant system of urban forests were measured, focusing on typical urban tree species (Populus tomentosa and Ficus virens). The research was done under various land uses in China’s Beijing and Shenzhen megacities (with different humidity conditions). The linear mixed-effect model revealed that the δ15N values in the leaves of roadside Ficus virens were significantly higher than those in urban park sites, away from the road (δ15N difference = 7.2‰). In contrast, Populus tomentosa leaves exhibited a non-significant difference (δ15N difference = −1.8‰). Further regression analysis revealed that the variations in δ15N in tree leaves could be attributed to the proximity to highways, suggesting the influence of vehicle exhaust on δ15N values in roadside trees. The linear mixed-effect model also revealed δ18O values significantly higher in Populus tomentosa leaves than in Ficus virens leaves. To assess the influence of humidity conditions on δ18O values in the leaves, the ratio of the atmospheric and intercellular vapor pressures (ea/ei) of tree canopies was estimated. The result revealed that the ea/ei of Ficus virens was significantly higher than for Populus tomentosa, ascribed to the variation in the humidity conditions of the two megacities. These results highlight that urban trees can potentially serve as bioindicators for atmospheric pollution and humidity. Our findings highlight the ecophysiological responses of urban forests related to N and O as they vary according to traffic exhaust and relative humidity. Consequently, they are potentially valuable indicators of urban atmospheric contamination, forming a nature-based solution for citizen welfare improvement.
1. Introduction
Megacities in China are confronted with severe environmental problems arising from heavy transportation, industrial activities, and population movement [1,2]. Human-induced primary air pollutants (such as particulate matter (PM), nitrogen oxides (NOx), and ground-level ozone (O3)) are the major contributors to atmospheric pollution in many Chinese cities [3,4,5,6]. Roadside environments have become major hotspots for atmosphere pollution induced by traffic-derived NOx in megacity centers and on the outskirts [7,8,9,10]. Using green infrastructures to mitigate atmospheric pollution is widely recognized as a cost-effective and nature-based solution [11,12]. Usually, urban forests, community green spaces, and roadside trees can absorb anthropogenic nitrogen through stomatal absorption and canopy uptake [13,14]. Therefore, the characteristics of the natural pool of stable N isotopes (15N) in the urban tree canopy can be referred to as trance anthropogenic nitrogen input [14,15]. This is because 15N integrates the stable N isotopic signature with its sources, indicating an anthropic source and its fractionation against the heavier 15N isotope during the N transformation, assimilation, and remobilization [16,17,18,19]. Some studies have focused on several nitrogen sources (i.e., soil nitrogen, air-derived nitrogen) absorbed by urban trees, demonstrating the 15N signal of nitrogen pools (δ15N) in tree canopies as a multi-source mixed system [20,21].
Isotope fractionation effects influence the N isotopic composition of various sources. For example, the NOx or NO3− in a dry deposition is characterized by high δ15N values due to the isotopic exchange between nitric oxide (NO) and nitrogen dioxide (NO2), thereby causing the enrichment of heavier 15N atoms [22,23]. On the contrary, automobile exhaust-derived NOx shows lower and negative δ15N values, owing to the kinetic isotope fractionation that occurs during the NO thermal production in the combustion chambers of vehicular engines [24]. Influenced by air-derived nitrogen sources (such as NOx), the δ15N values of urban tree leaves may shift towards the δ15N signature of air-derived sources [23,25,26]. However, recent studies conducted in several Chinese cities detected fluctuations in δ15N values of roadside leaves [21,27]. Furthermore, studies have found that the climatic factors explained more variations in the δ15N of plants along the transect than the edaphic factors [28]. However, these studies failed to clarify the impact of heterogeneity of local meteorological conditions and the functional traits of tree species on δ15N variation in the various study regions [9,29]. Therefore, more in situ studies and multi-isotope techniques should be conducted in different regions of China to explore the influence of air-derived nitrogen in roadside plant systems.
Measuring the N isotope dynamics with other elements’ isotopes has been a relevant methodology for indicating the main drivers of N enrichment in the plant-soil systems for urban forests. It also demonstrates the effect of ambient air pollution on tree species [30], including the measurement of C and N isotopes [16,31] and O and N isotopes [20,27]. A previous study found that the climatic and edaphic variables explained 52.4% and 31.2% of the variation in plant δ15N, respectively [28]. Moreover, climatic factors can also influence the isotopic compositions of 18O in plants, since the discrimination against heavier 18O during water transportation and stomata movement is influenced by several climatic factors [32,33,34]. If the tree canopies are assumed to be aerodynamic with the ambient environment, the δ18O values of tree samples may signal the relative humidity (RH) [35]. Several researchers have proposed a model that assumes that the isotopic signal of 18O in the leaf water pool is a single and well-mixed system. In this system, the degree of leaf water enrichment is dependent on the ratio of the atmospheric and intercellular vapor pressures (ea/ei). The ea/ei can be approximated by the RH if tree canopies are aerodynamic with an ambient environment [36,37]. Several studies have shown evidence that RH has a significant relationship with δ18O in tree cellulose [36,38]. Therefore, δ18O may potentially indicate the local RH.
Research on urban trees among cities in various climatic zones is currently insufficient. To better understand the influence of climate and traffic conditions on urban trees, this study selected two megacities with different climatic conditions in China: Beijing and Shenzhen. The air quality in these cities is influenced by heavy traffic-related nitrogen emissions, hindering the sustainable improvement of the atmospheric environment [39,40,41]. Previous studies have revealed that roadside plants’ element or isotopic composition is influenced by local transportation [20]. However, it remains unclear whether the N and O isotopic compositions of the tree-soil system of urban trees and their responses to traffic nitrogen pollution would vary in other cities with different climatic conditions. This study aimed to fill the research gap in element isotope measurements across cities, thus contributing to the limited information on δ15N and δ18O measurements in urban forests. This research conducted an in situ study on δ15N and δ18O of tree-soil systems in roadside urban trees in Beijing and Shenzhen. Several hypotheses were formulated and tested by comparing the isotopic composition of the leaves and soils: (1) The isotopic composition of urban trees in Beijing and Shenzhen may differ due to the differences in the local meteorological conditions and functional traits of tree species; (2) The local vehicular fleet significantly affects the isotopic composition and TN content of roadside trees, i.e., the δ value of trees near the highway may exhibit higher isotopic composition of vehicular exhaust. (3) The δ18O value of tree leaves could reflect the RH of the local ambient environment.
2. Materials and Methods
2.1. Study Area
This study was conducted in the urban area of two megacities in China: Beijing and Shenzhen (Figure 1A). Beijing is located northwest of the North China Plain (115°25′−117°30′ E, 39°26′−41°03′ N, mean elevation = 44 m). The climate of Beijing is typical continental monsoon, with a monthly average temperature of 21 °C and precipitation of 62 mm in Summer. The major air pollutants in Beijing are particulate matter (PM), ozone (O3), and NOx [42]. Shenzhen is located in southern China (113°46′–114°37′ E, 22°27′–22°52′ N, mean elevation = 70 m). Its climate is humid subtropical, with a monthly average temperature of 28 °C and precipitation of 177 mm in summer. The major air pollutants in Shenzhen are O3 and NOx [43]. Table 1 provides more detailed information about the cities.
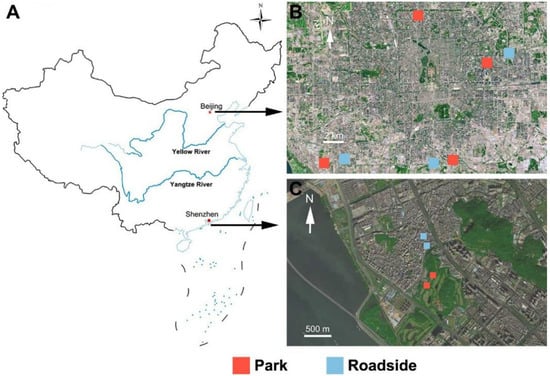
Figure 1.
(A) Location of Beijing and Shenzhen. (B) An aerial view of Beijing showing the sampling sites. (C) An aerial view of Shenzhen showing the sampling sites (Notes: Blue squares represent the sampling sites in greenbelts adjacent to a highway. Red squares represent the sampling sites in urban parks).

Table 1.
Detailed information on Beijing and Shenzhen (Note: Data are averages obtained from the local municipal environment bulletins).
2.2. Sampling Design
Sampling was conducted in two types of green lands in summer (September–October 2021) based on the urban forest structure. One site was on roadside green belts, while the other was in the urban parks, far away from local vehicular influence. Following the selection criteria described, seven and four sampling sites were selected in Beijing and Shenzhen, respectively (Table 2). Populus tomentosa, a major urban greening tree species in Beijing [44], was sampled. In Shenzhen, Ficus virens was selected due to its widespread availability [45]. During sampling, three to five healthy trees were selected at each sampling site. 80–200 g of fresh leaves were collected from each tree.
Table 2.
Detailed information on the sampling sites.
Four to seven soil samples (5–30 cm) were collected at each site using a 10 cm diameter soil drill. Finally, 21 P. tomentosa leaf samples and 32 soil samples were collected in Beijing, while 16 F. virens leaf samples and 22 soil samples were collected in Shenzhen (Table 2). The sampling site distribution is depicted in Figure 1B,C.
2.3. Stable Isotope and Total Nitrogen Content
All leaves were cleaned using an ultrasonic cleaning machine for 10 min before analysis. The leaves were then dried at 70 °C for 24 h. The dry leaves were then ground to pass through a 200-mesh sieve. The soil samples were passed through a 1.7 mm sieve to remove small rocks and debris. These samples were then air-dried at 18 °C for seven days. All of the soil samples were ground and sieved through a 200 mm-mesh sieve.
The samples’ stable isotope composition was determined using an elemental analyzer (FLASH 200, Thermo Fisher Scientific, Waltham, MA, USA) operated in continuous-flow mode and connected to an isotope mass spectrometer (Delta V Advantage, Thermo Fisher Scientific, Waltham, MA, USA). Approximately 1.300 mg of plant samples and 0.255 mg of soil samples were used for the isotopic analysis. The δ value indicates the isotope ratio of each sample relative to the standard:
where R is the molar ratio of heavy or light isotopes, and δX is the isotopic composition (δ15N and δ18O) of the samples. The δ15N values were recorded relative to air (δ15N = 0‰) and calibrated using a laboratory wheat flour standard (δ15N = 2.85 ± 0.17‰). The δ18O values were recorded relative to Vienna standard mean ocean water (VSMOW) and calibrated using the USGS32 (Potassium Nitrate) international standard (δ18O = 25.7 ± 0.4‰). The measuring precision was ±0.2‰ for δ15N and ±0.3‰ for δ18O.
Approximately 7.500 mg of leaf samples and 30.000 mg of soil samples were used to determine the total nitrogen content (TN), measured by an elemental analyzer (Vario EL III, Elementar, Hanau, Germany).
2.4. Estimating ea/ei
The 18O composition of the whole leaf tissue was determined by the isotopic composition of soil water, enrichment effect of leaf water due to transpiration, and the fractionation effect of biochemical synthesis of organic matter [46]. The degree of leaf water enrichment is partly influenced by the ratio of atmospheric and intercellular vapor pressure (ea and ei). ea/ei can be approximated by ambient relative humidity (RH) if tree canopies are assumed as aerodynamically coupled to the ambient environment. Such an assumption hints that the 18O signal of leaf organic matter can reflect the RH of the ambient environment. The δ18O values of whole leaf tissue can be described by the following model [46]:
To determine ea/ei, Equation (2) was solved as follows:
Table 3 summarizes the parameters used in Equations (2) and (3). A correction factor f (0 < f < 1) was added to the equations, reflecting the dampening effect of leaf water δ18O signal due to the heterogeneity of leaf water and the exchange of oxygen atoms of sucrose with stem water [46]. To determine the trend of ea/ei based on changes in f, a group of f values was used in Equation (3).
Table 3.
Summary of parameters in Equations (2) and (3). (Note: a: for Beijing samples. b: for Shenzhen samples).
2.5. Statistical Analysis
To compare the differences in δ values and TN between two types of greenland, several linear mixed-effect models were built to detect the influence of green land types. Then, a pairwise test estimated any significant difference in δ values and TN between the land types. To test the influence of vehicular fleet, the distance of the highway from the sites was extracted from the Gaode online map platform (https://www.amap.com/ (accessed on 1 September 2021)). Then, a linear regression model estimated the coefficients of highway distance. The normality of model residuals and heteroscedasticity of model error were checked before interpreting the models.
All statistical analyses were performed using the R language environment [49]. The R package ‘lme4′ built the linear mixed-effect model [50]. Regression diagnoses were performed by using the ‘performance’ package [51]. All statistical graphs were generated by ‘ggplot2′ and ‘cowplot’ packages [52,53].
3. Results
3.1. Isotopic Composition and Total Nitrogen Content
The mean δ15N of P. tomentosa leaves was 3.05 ± 2.22‰ (Table 4), while that of the soil samples below the canopy was 7.75 ± 1.72‰, which was significantly higher than the leaf samples. However, no significant differences were found for F. virens and the soil samples in Shenzhen. The mean δ18O value of P. tomentosa and F. virens was 33.75 ± 1.45‰ and 24.95 ± 2.09‰, respectively. The δ18O values in all soil samples were significantly lower than those found in the leaves in both megacities. Generally, the TN content of the soils was considerably lower than those of the leaves.
Table 4.
Descriptive statistics of the plant and soil samples’ data (Note: a: Beijing samples. b: Shenzhen samples).
The difference in isotopic compositions (δ15N and δ18O) and TN content of samples located in different green lands were estimated by linear mixed models (Figure 2 and Figure 3). For the difference in δ15N in P. tomentosa leaves and soil samples, the results revealed lower mean δ15N values in the sites close to the urban park (Figure 2A, park) than those adjacent to the highway (Figure 2A, roadside). The δ15N values in urban park site soils were lower than those on the roadside. The δ15N values in leaf and soil samples in Shenzhen showed a similar trend. The δ15N in leaf and soil samples showed significantly lower values in the sites close to the urban park (differences of leaf samples = −7.2‰, p < 0.01, differences of soil samples = −3.2‰, p < 0.01). The different trends in δ18O values in leaves and soils were inconsistent between the cities. For Beijing samples, the δ18O values of P. tomentosa leaves and soil in the urban park were lower than those in the roadside green land. For those samples in Shenzhen, the δ18O values of leaves from urban park sites were higher than those from roadside sites. However, the opposite trend was observed in the soil samples. Generally, the differences in δ18O values in all sample types were insignificant (Figure 2B, p > 0.05).
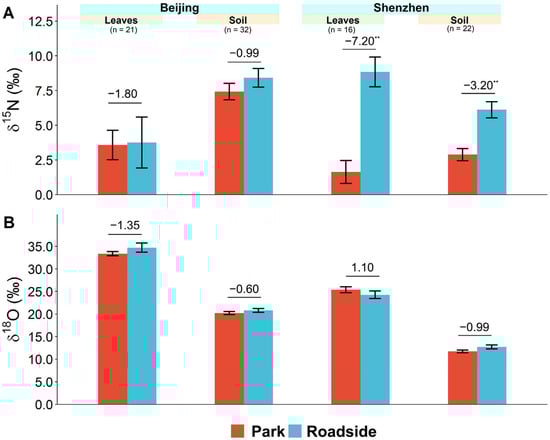
Figure 2.
Differences in stable isotopic compositions ((A) δ15N and (B) δ18O) of urban trees in the green lands (Note: The numbers and asterisk above the bars indicate the mean value differences. Significance of differences: ** for p < 0.01. Error bars indicate the 95% confidence interval of the means).

Figure 3.
Differences in TN content of urban trees in the green lands (Note: The numbers and asterisk above the bar indicate the mean value differences. Significance of differences: * for p < 0.05. Error bars indicate the upper 95% confidence interval of the means).
We observed consistent trends in the differences between the cities’ TN values (Figure 3). For Beijing, the mean TN in P. tomentosa leaves and soil in the urban park sites was lower than that of samples from roadside sites, but the differences were insignificant. The linear mixed model revealed significant differences in TN of F. virens leaves in Shenzhen (Figure 3, differences of leaf samples = −0.83%, p < 0.05), albeit no significant differences with the soil samples.
3.2. Effect of the Vehicular Fleet on the Isotopic Composition and TN Content
The linear regression model tested the effect of vehicular fleet on the isotopic values (δ15N and δ18O) and TN content. The δ15N of leaf samples exhibited a significant negative correlation with highway distance (Figure 4A). For the δ15N value in P. tomentosa samples, the δ15N value decreased by 0.08‰ for every 1 m increase in distance from the highway. Road traffic significantly influenced the δ15N value in P. tomentosa leaves, and the linear regression model explained 28% of the variation. A similar negative correlation was found in the δ15N value in F. virens leaves. The linear regression model revealed that the δ15N value decreased by 0.02‰ for every 1 m increase in distance from the highway. The distance explained 59% of variation in δ15N value to the highway. However, no significant correlation existed between highway distance and the δ18O value of the leaves (Figure 4B). The variation of the δ18O value explained by the linear regression models was low (R2P.tomentosa = 0.01, R2F.virens = 0.03).
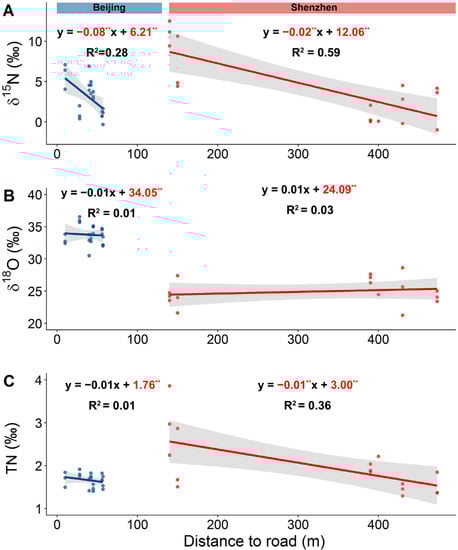
Figure 4.
Relationship between highway distance and (A) δ15N, (B) δ18O, and (C) TN of urban tree leaves. (Note: The coefficients of the linear regression model are displayed above the regression line. The shaded area represents a 95% confidence interval of the fitted value. The significant coefficients of the linear regression are marked in red. Significance of coefficients: ** for p < 0.01).
The vehicular fleet also affected the TN in the leaves (Figure 4C). The linear regression model indicated that TN in F. virens leaves in Shenzhen correlated significantly and negatively with highway distance. The regression model explains that the TN decreased by 0.01% for every 1 m increase in highway distance and 36% variation in TN. We observed a similar negative trend in TN in P. tomentosa leaves (Beijing), but the variation explained by the model was very low (R2P.tomentosa = 0.01).
3.3. ea/ei of Trees in Two Cities
The ea/ei of P. tomentosa and F. virens canopies are obtained using Equation (3) and the parameters in Table 3. The δ18O values for P. tomentosa ranged from 30.5–36.5‰, while that for F. virens was 21.2–28.6‰. To study the effect of varying f, Equation (3) was solved for f = 0.5–1.0 for P. tomentosa and 0.4–1.0 for F. virens. We did not evaluate Equation (3) for f < 0.4 or 0.5 because lower f values would yield a negative ea/ei. Figure 5a,b displays the results obtained after solving Equation (3). The slope and intercept of lines depend on f for the tree species; lower f values tend to yield a lower ea/ei. Under the same f value, the ea/ei of P. tomentosa was always lower than the ea/ei of F. virens. For example, for f = 0.7, the ea/ei for P. tomentosa and F. virens cover the range of 0.07–0.31 and 0.39–0.68, respectively.
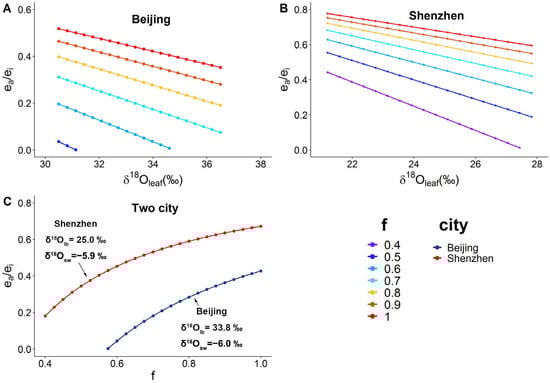
Figure 5.
The relationship between δ18O in leaves and ea/ei under different values of (A) P. tomentosa leaves in Beijing, (B) F. virens leaves in Shenzhen. (C) Compared ea/ei between the two cities. The text in the figure shows the mean δ18O values, in source water and leaves, used in Equation (3).
To compare the differences in ea/ei between the cities, the ea/ei were solved for the mean δ18O value in leaves and soil water. Figure 5C shows the trend of ea/ei. The ea/ei in Beijing and Shenzhen covers 0.01–0.43 and 0.18–0.67, respectively, showing that that of Beijing was significantly lower than Shenzhen’s (Wilcoxon rank sum test, W = 52, p < 0.001). This observation could be reasonable for the differences in RH and climate between the two megacities.
Figure 6 shows the ea/ei values under the green land types. The ea/ei of P. tomentosa in urban park sites covers 0.01–0.44, while that on the roadside sites covers 0.01–0.41. The difference in the ea/ei of the two green land types was insignificant (Wilcoxon rank sum test, W = 342, p = 0.577). Contrasting ea/ei trends under different types of green land exist in Shenzhen. For urban park sites, the ea/ei covers 0.15–0.66. Similarly, the ea/ei of the roadside samples ranged from 0.23 to 0.69, which is higher than that of the urban park sites. No significant difference in ea/ei exists between the two types of green land (Wilcoxon rank sum test, W = 251, p = 0.239).

Figure 6.
Relationship between δ18O in leaves and ea/ei under different green land types (A) P. tomentosa leaves in Beijing (B) F. virens leaves in Shenzhen. The ea/ei was calculated based on mean δ18O values in source water and leaves. The text in the figure shows the mean δ18O values in the leaves under different green land types used in Equation (3).
4. Discussion
4.1. Variation of Foliar δ15N Values in Two Cities
This study measured the δ15N of the leaves in two China megacities (Table 4). A recent study in a similar climate zone reported that δ15N values in the Populus tremuloides leaves were 2.82 ± 1.76‰, similar to our current result [15]. Elsewhere, another study also reported the δ15N values of the subtropical urban forests in the center of Sao Paulo, Brazil as 2.66 ± 1.27‰, similar to those of F. virens values in Shenzhen’s park sites covered by subtropical urban forests [16].
Table 4 shows that the δ15N in Beijing’s P. tomentosa leaves was lower than that found in Shenzhen’s F. virens. As higher vascular plants, P. tomentosa and F. virens mainly utilize nitrogen from the soil. Therefore, the δ15N values in their leaves display the influence of soil nitrogen [54]. Interestingly, the soil δ15N values in Beijing were significantly higher than in Shenzhen (Student’s t-test, t = 6.517, p < 0.001). One possible reason for this inconsistent trend is the variation in the 15N abundance in the different plant species [55]. Non-environmental factors, such as plant species, can influence trees’ 15N composition. Previous studies have found that the difference in δ15N values of different plant species can be >3.20‰ [56].
4.2. Influences of Green Land Type and Vehicular Fleet
Our study found that the δ15N value in leaves varies between two types of green land (Figure 2A). The post-hoc comparison of linear mixed models revealed that the δ15N in F. virens leaves collected from urban park sites was significantly lower than that collected from the roadside (Figure 2A, Shenzhen). We also found that TN content in F. virens leaves from urban park sites were significantly lower than in the leaves collected from the roadside (Figure 3, Shenzhen). Several studies have found that the vegetation’ s δ15N and TN contents tend to increase by vehicular exhaust or fossil fuel combustion sources, as found in Shenzhen [15,16,21]. However, we did not observe such results in P. tomentosa leaves in Beijing (Figure 2A, Beijing).
The δ15N values in leaves showed the influence of traffic exhaust in this study, exhibiting a significantly negative correlation with distance to the highway in both cities. However, the correlation between δ18O and highway distance was insignificant in both cities (Figure 4A,B). Several recent studies conducted in near-road environments have found a similar correlation between plant δ15N and highway distance [25,26,57]. This correlation can be explained by the isotopic characteristics of 15N in nitrogen deposition and vehicular exhaust. Figure 4A also displayed that the slope of the regression line in Beijing is smaller than that of Shenzhen. The different RH conditions in the two cities could explain the difference in the decrease trends of δ15N. In Shenzhen, the foliar uptake of NOx by tree leaves under high RH condition is significantly influenced by summer wet deposition characterized with lower isotopic signatures [58]. Therefore, the isotopic signal of leaves may be partially masked by the δ15N characteristics of wet deposition. Besides, the dispersion and deposition of NOx may have potential influences on foliar δ15N. Several studies have demonstrated that the wind speed near tree canopy may influence the deposition velocity and dispersion distance of atmospheric pollutants [59,60]. However, in this case, similar wind speeds during the sampling period were supposed to have limited effects on foliar δ15N, which should be addressed by future works. Figure 7A compares the isotopic signature of potential nitrogen sources and leaves in this study. The measured NOx in the dry deposition in the roadside environment tends to be positive [61,62]. Therefore, trees adjacent to the road were influenced by the positive δ15N air-borne nitrogen source, resulting in an increase of δ15N for the leaves along the roadside.
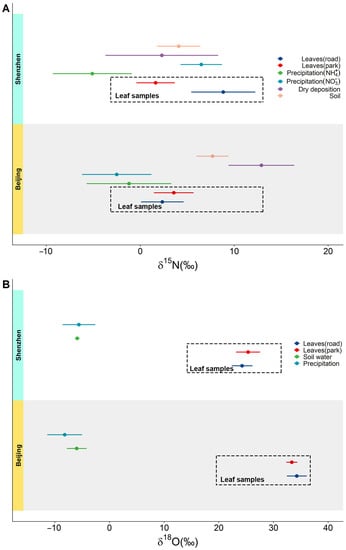
Figure 7.
Comparison of the isotopic signal of leaves and potential sources: (A) δ15N in leaves and potential nitrogen sources; (B) δ18O in leaves and potential water sources. (Note: Mean values and standard deviation are shown as error bars. Data sources: precipitation [47,63,64,65], dry deposition [9], soil (current study), leaves (current study), and soil water [47,48]).
Although the δ15N values in tree leaves are a useful bioindicator of atmospheric nitrogen pollution in the urban environment, several cautions are needed. First, higher vascular plants mainly absorb nitrogen from soils. Therefore, the isotopic signal of leaves may be masked by the δ15N characteristics of soil and the discrimination effect for heavier 15N during the assimilation of organic nitrogen through the glutamine synthetase-glutamate synthase (GS-GOGAT) pathway [17,66]. In this study, the δ15N in P. tomentosa was significantly lower than in the soil samples, which is explained by the discrimination effect during nitrogen assimilation. Such an effect may mask the influence of anthropogenic nitrogen sources with higher δ15N values [66]. Secondly, the heterogeneity of the isotopic composition of nitrogen sources in different regions may diminish leaves’ reliability as bioindicators. Several studies have reported that trees can absorb nitrogen in wet deposition through the canopy uptake route. Therefore, the isotopic precipitation signal may affect foliar δ15N [14,67]. We collected the leaf samples during the rainy season in Shenzhen. In contrast, there was less precipitation during the sampling period in Beijing. Although a significant influence of vehicle exhaust was detected in this study, the NO3- in the precipitation with similar isotopic composition may partially mask the foliar δ15N signal [61,62].
Some reports have reported correlations between leaves’ TN content and atmospheric nitrogen deposition [25,57,68]. In this study, two plant species’ TN content negatively correlated with highway distance. However, we found only one significant relationship between leaf TN and vehicular fleet in F. virens in Shenzhen (Figure 3 and Figure 4c). The different sampling strategies in the two cities could explain the difference in the response of the two tree species to the vehicular fleet. In Beijing, the distance to the highway was much narrower than in Shenzhen. Therefore, the influence of vehicular fleets may not be significant at this distance. More research is needed to better understand the relationship between leaf TN content and vehicular exhaust.
4.3. Influence of Relative Humidity
The δ18O of the leaves was measured in two Chinese megacities (Table 4). The foliar δ18O of P. tomentosa in Beijing was significantly higher than the foliar δ18O of F. virens in Shenzhen (Wilcoxon rank sum test, W = 0, p < 0.001). The significant difference in the foliar δ18O of the two tree species revealed a difference in the cities’ relative humidity. Evaporation enriches heavier 18O atoms at evaporation sites because heavier H218O diffuses slower than normal H216O [35,36]. On the other hand, the degree of 18O enrichment is negatively correlated with the ratio of atmospheric and intercellular vapor pressures (ea/ei) [46]. Therefore, the low RH in the ambient environment would result in higher foliar δ18O due to an increase in 18O enrichment at the evaporation site [16,46].
To further investigate the relationship between δ18O and RH, we evaluated the ea/ei of the two tree species by applying Equation (3). The ea/ei range was determined by a sequence of dampening effect factor f. The model evaluation results showed that the average ea/ei of F. virens in Shenzhen was significantly higher than in Beijing (Figure 5). It is consistent with the prediction of theory model and the RH conditions in the summer of the two cities (RH in Shenzhen = 76%; RH in Beijing = 51%).
The influence of RH on plant’s δ18O has been widely studied [36,38]. However, some other studies also showed that RH does not significantly correlate with δ18O [69,70]. The inconsistency in those results suggests that the assumption of the Craig-Gordon model should be noted in the model evaluation. One of the confounding factors that may mask the RH signal is the dampening effect of leaf water heterogeneity. In some deep root trees that mainly utilize deep soil water or groundwater, the 18O signal in the soil water (δ18Osw) may largely contribute to the variation in foliar δ18O, resulting in a weak correlation between RH and foliar δ18O [71]. Although Equation (3) added a correction factor f to summarize the dampening effect [46], and such a simple correction factor may not accurately reflect the impact of water heterogeneity in leaf water transpiration. The other confounding factor is the variation of δ18Osw in different regions. As Equation (3) describes, the δ18Osw positively relates to the foliar δ18O. Furthermore, comparing the 18O composition of soil water and precipitation in Shenzhen and Beijing showed no significant difference between the cities (Figure 7B). Therefore, the influence of variation in δ18Osw in this study should be assumed to be minimal.
4.4. Limitations and Future Studies
This study measured the isotopic composition and TN content in P. tomentosa and F. virens in two cities. Although this study preliminarily revealed the influence of vehicular fleet and RH condition on the isotopic composition of trees, some limitations still needs to be addressed in future research. Here, we compared the isotopic composition of tree leaves in 11 sampling sites. Therefore, more sampling sites should be included in future studies to better represent the variation of isotopic composition in different green land types. Also, this study evaluated Equation (3) to obtain the ea/ei of the trees and compared the differences in the ea/ei of the two cities under different RH conditions. Moreover, the leaf water heterogeneity and variation of δ18O in source water may mask the RH signal in leaf δ18O (Section 4.3). To improve the model’s accuracy, the isotopic composition of water sources of urban trees should be determined (e.g., precipitation, artificial watering, soil water, etc.). On the other hand, several studies have combined δ18O and δ13C to reveal a more accurate influence of the RH signal on leaves [46], and this should be considered in future research. In addition, regional-specific irrigation methods would be taken to prevent pollution and facilitate tree growth in these two cities with different climate zones [72,73]. In this case, the isotopic signature of irrigation water may vary and influence the foliar δ18O. Thus, the effect of irrigation strategies, as well as isotopic signatures of irrigation water, should be considered in future research.
This study has applied the isotope method to reveal anthropogenic nitrogen (vehicle exhaust)’s impact and RH condition on urban trees. We agree that this method can be used in ecological management in urban areas. For example, measuring the δ15N composition of leaves of urban trees may help monitor local nitrogen deposition. Besides, leaves’ δ18O could reflect historical RH conditions to detect the cooling and humidification effects of urban ecosystem services. This study provides some useful information for future studies to improve the quantitation precision of botanical nitrogen pollution purification. It improves on previous local case studies in Beijing and Shenzhen that relied merely on the i-Tree Eco model [39,74].
5. Conclusions
We applied the isotopic method of 15N and 18O to understand the effects of vehicular fleet and RH conditions on typical urban tree species (P. tomentosa and F. virens) in two megacities, Beijing and Shenzhen. The hypothesis that the isotopic composition of tree leaves varies in two megacities was observed, which addressed that the δ15N and δ18O in the leaves of roadside trees were influenced by vehicle exhaust. Moreover, the isotopic compositions and TN in the leaves near the highway shift towards those of vehicle exhaust, partially confirmed in Shenzhen. Besides, the variations of foliar δ18O and ea/ei were mostly consistent with RH conditions in the cities, supporting the third hypothesis. The new insights on the variations in isotopic compositions in this study will interest urban policymakers involved with the ecological management of the urban ecosystem. Consequently, the foliar isotopic composition (δ15N and δ18O) can be a useful indicator of urban atmospheric contamination for forming a nature-based solution for improved citizen welfare.
Author Contributions
Conceptualization, C.G. and C.X.; Data curation, C.G. and C.X.; Formal analysis, C.G.; Funding acquisition, C.X.; Methodology, C.G. and C.X.; Project administration, C.X.; Resources, C.X. and Z.O.; Supervision, C.X. and Z.O.; Visualization, C.G. and C.X.; Writing—original draft, C.G.; Writing—review & editing, C.G. and C.X. All authors have read and agreed to the published version of the manuscript.
Funding
This research was funded by National Natural Science Foundation of China, grant number 42101290.
Institutional Review Board Statement
Not applicable.
Informed Consent Statement
Not applicable.
Data Availability Statement
The data presented in this study are available on request from the corresponding author. The data are not publicly available due to the copyright of relevant data in the article belonging to the research group rather than to individuals.
Conflicts of Interest
The authors declare that they have no known competing financial interests or personal relationships that could have appeared to influence the work reported in this paper.
References
- Han, L.; Zhou, W.; Li, W.; Qian, Y. Urbanization strategy and environmental changes: An insight with relationship between population change and fine particulate pollution. Sci. Total Environ. 2018, 642, 789–799. [Google Scholar] [CrossRef] [PubMed]
- Han, X.L.; Naeher, L.P. A review of traffic-related air pollution exposure assessment studies in the developing world. Environ. Int. 2006, 32, 106–120. [Google Scholar] [CrossRef] [PubMed]
- Chan, C.K.; Yao, X. Air pollution in mega cities in China. Atmos. Environ. 2008, 42, 1–42. [Google Scholar] [CrossRef]
- Fang, M.; Chan, C.K.; Yao, X.H. Managing air quality in a rapidly developing nation: China. Atmos. Environ. 2016, 43, 79–86. [Google Scholar] [CrossRef]
- Marlier, M.E.; Jina, A.S.; Kinney, P.L.; DeFries, R.S. Extreme air pollution in global megacities. Current Climate Change Reports 2016, 2, 15–27. [Google Scholar] [CrossRef]
- Xian, C.; Zhang, X.; Zhang, J.; Fan, Y.; Zheng, H.; Salzman, J.; Ouyang, Z. Recent patterns of anthropogenic reactive nitrogen emissions with urbanization in China: Dynamics, major problems, and potential solutions. Sci. Total Environ. 2019, 656, 1071–1081. [Google Scholar] [CrossRef]
- Xu, M.; Sbihi, H.; Pan, X.; Brauer, M. Local variation of PM2.5 and NO2 concentrations within metropolitan Beijing. Atmos. Environ. 2019, 200, 254–263. [Google Scholar] [CrossRef]
- Yli-Pelkonen, V.; Viippola, V.; Kotze, D.J.; Setala, H. Impacts of urban roadside forest patches on NO2 concentrations. Atmos. Environ. 2020, 232, 117584. [Google Scholar] [CrossRef]
- Zong, Z.; Tan, Y.; Wang, X.; Tian, C.; Li, J.; Fang, Y.; Chen, Y.; Cui, S.; Zhang, G. Dual-modelling-based source apportionment of NOx in five Chinese megacities: Providing the isotopic footprint from 2013 to 2014. Environ. Int. 2020, 137, 105592. [Google Scholar] [CrossRef]
- Sayegh, A.; Tate, J.E.; Ropkins, K. Understanding how roadside concentrations of NOx are influenced by the background levels, traffic density, and meteorological conditions using Boosted Regression Trees. Atmos. Environ. 2016, 127, 163–175. [Google Scholar] [CrossRef]
- Selmi, W.; Weber, C.; Rivière, E.; Blond, N.; Mehdi, L.; Nowak, D. Air pollution removal by trees in public green spaces in Strasbourg city, France. Urban For. Urban Green. 2016, 17, 192–201. [Google Scholar] [CrossRef]
- Nowak, D.J.; Hirabayashi, S.; Bodine, A.; Greenfield, E. Tree and forest effects on air quality and human health in the United States. Environ. Pollut. 2014, 193, 119–129. [Google Scholar] [CrossRef]
- Chaparro-Suarez, I.G.; Meixner, F.X.; Kesselmeier, J. Nitrogen dioxide (NO2) uptake by vegetation controlled by atmospheric concentrations and plant stomatal aperture. Atmos. Environ. 2011, 45, 5742–5750. [Google Scholar] [CrossRef]
- Ferraretto, D.; Nair, R.; Shah, N.W.; Reay, D.; Mencuccini, M.; Spencer, M.; Heal, K.V. Forest canopy nitrogen uptake can supply entire foliar demand. Funct. Ecol. 2022, 36, 933–949. [Google Scholar] [CrossRef]
- Cobley, L.A.E. Pataki, D.E. Vehicle emissions and fertilizer impact the leaf chemistry of urban trees in Salt Lake Valley, UT. Environ. Pollut. 2019, 254, 112984. [Google Scholar] [CrossRef]
- Pereira, M.A.G.; Domingos, M.; da Silva, E.A.; Aragaki, S.; Ramon, M.; Camargo, P.D.B.; Ferreira, M.L. Isotopic composition (d(13)C and d(15)N) in the soil-plant system of subtropical urban forests. Sci. Total Environ. 2022, 851, 158052. [Google Scholar] [CrossRef]
- Evans, R.D. Physiological mechanisms influencing plant nitrogen isotope composition. Trends Plant Sci. 2001, 6, 121–126. [Google Scholar] [CrossRef]
- Werner, R.A.; Schmidt, H.L. The in vivo nitrogen isotope discrimination among organic plant compounds. Phytochemistry 2002, 61, 465–484. [Google Scholar] [CrossRef]
- Seidel, F.; Lopez, M.L.L.; Celi, L.; Bonifacio, E.; Oikawa, A.; Yamanaka, T. N isotope fractionation in tree tissues during N reabsorption and remobilization in Fagus crenata Blume. Forests 2019, 10, 330. [Google Scholar] [CrossRef]
- Gong, C.; Xian, C.; Cui, B.; He, G.; Wei, M.; Zhang, Z.; Ouyang, Z. Estimating NOx removal capacity of urban trees using stable isotope method: A case study of Beijing, China. Environ. Pollut. 2021, 290, 118004. [Google Scholar] [CrossRef]
- Xu, Y.; Xiao, H.; Wu, D. Traffic-related dustfall and NOx, but not NH3, seriously affect nitrogen isotopic compositions in soil and plant tissues near the roadside. Environ. Pollut. 2019, 249, 655–665. [Google Scholar] [CrossRef] [PubMed]
- Felix, J.D.; Elliott, E.M. Isotopic composition of passively collected nitrogen dioxide emissions: Vehicle, soil and livestock source signatures. Atmos. Environ. 2014, 92, 359–366. [Google Scholar] [CrossRef]
- Redling, K.; Elliott, E.; Bain, D.; Sherwell, J. Highway contributions to reactive nitrogen deposition: Tracing the fate of vehicular NOx using stable isotopes and plant biomonitors. Biogeochemistry 2013, 116, 261–274. [Google Scholar] [CrossRef]
- Walters, W.W.; Goodwin, S.R.; Michalski, G. Nitrogen stable isotope composition (delta15N) of vehicle-emitted NOx. Environ. Sci. Technol. 2015, 49, 2278–2285. [Google Scholar] [CrossRef] [PubMed]
- Laffray, X.; Rose, C.; Garrec, J.-P. Biomonitoring of traffic-related nitrogen oxides in the Maurienne valley (Savoie, France), using purple moor grass growth parameters and leaf N-15/N-14 ratio. Environ. Pollut. 2010, 158, 1652–1660. [Google Scholar] [CrossRef]
- Guerrieri, M.; Siegwolf, R.; Saurer, M.; Jäggi, M.; Cherubini, P.; Ripullone, F.; Borghetti, M. Impact of different nitrogen emission sources on tree physiology as assessed by a triple stable isotope approach. Atmos. Environ. 2009, 43, 410–418. [Google Scholar] [CrossRef]
- Gong, C.; Xian, C.; Su, Y.; Ouyang, Z. Estimating the nitrogen source apportionment of Sophora japonica in roadside green spaces using stable isotope. Sci. Total Environ. 2019, 689, 1348–1357. [Google Scholar] [CrossRef]
- Liu, X.; Wang, T.; Su, Q. Relative importance of climatic and edaphic factors as drivers of plant delta N-15 along a longitudinal transect. Ecosyst. Health Sustain. 2022, 8, 2071766. [Google Scholar] [CrossRef]
- Zong, Z.; Tan, Y.; Wang, X.; Tian, C.; Fang, Y.; Chen, Y.; Fang, Y.; Han, G.; Li, J.; Zhang, G. Assessment and quantification of NOx sources at a regional background site in North China: Comparative results from a Bayesian isotopic mixing model and a positive matrix factorization model. Environ. Pollut. 2018, 242, 1379–1386. [Google Scholar] [CrossRef]
- Wuytack, T.; Samson, R.; Wuyts, K.; Adriaenssens, S.; Kardel, F.; Verheyen, K. Do leaf characteristics of White Willow (Salix alba L.), Northern Red Oak (Quercus rubra L.), and Scots Pine (Pinus sylvestris L.) respond differently to ambient air pollution and other environmental stressors? Water Air Soil Pollut. 2013, 224, 1635. [Google Scholar] [CrossRef]
- Veselkin, D.; Kuyantseva, N.; Mumber, A.; Molchanova, D.; Kiseleva, D. delta N-15 in birch and pine leaves in the vicinity of a large copper smelter indicating a change in the conditions of their soil nutrition. Forests 2022, 13, 1299. [Google Scholar] [CrossRef]
- Wang, K.; Liu, X.; Zeng, X.; Xu, G.; Zhang, L.; Li, C. Stable nitrogen isotope in tree rings: Progresses, problems and prospects. Acta Geogr. Sin. 2021, 76, 1193–1205. [Google Scholar]
- Sidorova, O.V.; Siegwolf, R.T.W.; Myglan, V.; Ovchinnikov, D.V.; Shishov, V.V.; Helle, G.; Loader, N.J.; Saurer, M. The application of tree-rings and stable isotopes for reconstructions of climate conditions in the Russian Altai. Clim. Chang. 2013, 120, 153–167. [Google Scholar] [CrossRef]
- Churakova, O.V.; Fonti, M.V.; Barinov, V.V.; Zharkov, M.S.; Taynik, A.V.; Trushkina, T.V.; Kirdyanov, A.V.; Arzac, A.; Saurer, M. Towards the third millennium changes in Siberian triple tree-ring stable isotopes. Forests 2022, 13, 934. [Google Scholar] [CrossRef]
- Barbour, M.M.; Farquhar, G.D. Relative humidity- and ABA-induced variation in carbon and oxygen isotope ratios of cotton leaves. Plant Cell Environ. 2000, 23, 473–485. [Google Scholar] [CrossRef]
- Farquhar, G.D.; Cernusak, L.A.; Barnes, B. Heavy water fractionation during transpiration. Plant Physiol. 2007, 143, 11–18. [Google Scholar] [CrossRef]
- Horita, J.; Rozanski, K.; Cohen, S. Isotope effects in the evaporation of water: A status report of the Craig–Gordon model. Isot. Environ. Health Stud. 2008, 44, 23–49. [Google Scholar] [CrossRef]
- Lorrey, A.M.; Brookman, T.H.; Evans, M.N.; Fauchereau, N.C.; Macinnis-Ng, C.; Barbour, M.M.; Criscitiello, A.; Eischeid, G.; Fowler, A.M.; Horton, T.W.; et al. Stable oxygen isotope signatures of early season wood in New Zealand kauri (Agathis australis) tree rings: Prospects for palaeoclimate reconstruction. Dendrochronologia 2016, 40, 50–63. [Google Scholar] [CrossRef]
- Gong, C.; Xian, C.; Ouyang, Z. Assessment of NO2 Purification by Urban Forests Based on the i-Tree Eco Model: Case Study in Beijing, China. Forests 2022, 13, 369. [Google Scholar] [CrossRef]
- Xian, C.; Ouyang, Z.; Lu, F.; Xiao, Y.; Li, Y. Quantitative evaluation of reactive nitrogen emissions with urbanization: A case study in Beijing megacity, China. Environ. Sci. Pollut. Res. 2016, 23, 17689–17701. [Google Scholar] [CrossRef]
- Xian, C.; Wu, T.; Lu, F.; Zhang, J.; Gong, C.; Ouyang, Z. The nitrogen footprints of China’s major urban agglomerations: Understanding regional challenges to advance sustainable development. Environ. Res. Lett. 2022, 17, 045020. [Google Scholar] [CrossRef]
- Zhang, Z.Y.; Guan, H.; Xiao, H.; Liang, Y.; Zheng, N.; Luo, L.; Liu, C.; Fang, X.; Xiao, H. Oxidation and sources of atmospheric NOx during winter in Beijing based on delta O-18-delta N-15 space of particulate nitrate. Environ. Pollut. 2021, 276, 116708. [Google Scholar] [CrossRef] [PubMed]
- Gao, L.; Tang, L.; Hou, H.; Wang, Y.; Mai, Y.; He, W.; Wang, W.; Su, H. The spatial-temporal distribution of air pollution and its relationship with landscape pattern in Shenzhen. Acta Ecol. Sin. 2021, 41, 8758–8770. [Google Scholar]
- Yang, J.; McBride, J.; Zhou, J.; Sun, Z. The urban forest in Beijing and its role in air pollution reduction. Urban For. Urban Green. 2005, 3, 65–78. [Google Scholar] [CrossRef]
- Su, C.; Cai, W.; Han, B.; Li, X.; Jiang, N.; Ouyang, Z. A study on the characteristics of the dominant vegetation species in Shenzhen based on a rapid-census method. Acta Ecol. Sin. 2020, 40, 8516–8527. [Google Scholar]
- Saurer, M.; Aellen, K.; Siegwolf, R. Correlating delta C-13 and delta O-18 in cellulose of trees. Plant Cell Environ. 1997, 20, 1543–1550. [Google Scholar] [CrossRef]
- Liu, Z.; Jia, G.; Yu, X.; Lu, W.; Zhang, J. Water use by broadleaved tree species in response to changes in precipitation in a mountainous area of Beijing. Agric. Ecosyst. Environ. 2018, 251, 132–140. [Google Scholar] [CrossRef]
- Wang, Z.; Zhao, X.; Pang, Y.; Li, S.; Long, Y.; Gao, L.; Zhang, K.; Chen, J.; Ji, Z. Spatial and seasonal geochemical and stable isotopic characteristics of groundwater associated with flow system and source identification in Liuxi River catchment. Environ. Chem. 2017, 36, 2701–2710. [Google Scholar]
- R Core Team. R: A Language and Environment for Statistical Computing. Available online: https://cran.r-project.org/ (accessed on 30 November 2022).
- Bates, D.; Maechler, M.; Bolker, B.M.; Walker, S.C. Fitting linear mixed-effects models using lme4. J. Stat. Softw. 2015, 67, 48. [Google Scholar] [CrossRef]
- Performance: Assessment of Regression Models Performance. Available online: https://cran.r-project.org/web/packages/performance/index.html (accessed on 30 November 2022).
- Wickham, H. ggplot2: Elegant Graphics for Data Analysis; Springer: New York, NY, USA, 2016. [Google Scholar]
- Cowplot: Streamlined Plot Theme and Plot Annotations for ‘ggplot2’. Available online: https://cran.r-project.org/web/packages/cowplot/index.html (accessed on 30 November 2022).
- Dettenmaier, E.M.; Doucette, W.J.; Bugbee, B. Chemical hydrophobicity and uptake by plant roots. Environ. Sci. Technol. 2008, 43, 324–329. [Google Scholar] [CrossRef]
- Liu, X.; Wang, G. Measurements of nitrogen isotope composition of plants and surface soils along the altitudinal transect of the eastern slope of Mount Gongga in southwest China. Rapid Commun. Mass Spectrom. 2010, 24, 3063–3071. [Google Scholar] [CrossRef]
- Kahmen, A.; Wanek, W.; Buchmann, N. Foliar delta(15)N values characterize soil N cycling and reflect nitrate or ammonium preference of plants along a temperate grassland gradient. Oecologia 2008, 156, 861–870. [Google Scholar] [CrossRef]
- Bermejo-Orduna, R.; McBride, J.R.; Shiraishi, K.; Elustondo, D.; Lasheras, E.; Santamaría, J.M. Biomonitoring of traffic-related nitrogen pollution using Letharia vulpina (L.) Hue in the Sierra Nevada, California. Sci. Total Environ. 2014, 490, 205–212. [Google Scholar] [CrossRef]
- Nanus, L.; Campbell, D.H.; Lehmann, C.M.B.; Mast, M.A. Spatial and temporal variation in sources of atmospheric nitrogen deposition in the Rocky Mountains using nitrogen isotopes. Atmos. Environ. 2018, 176, 110–119. [Google Scholar] [CrossRef]
- Escobedo, F.J.; Nowak, D.J. Spatial heterogeneity and air pollution removal by an urban forest. Landsc. Urban Plan. 2009, 90, 102–110. [Google Scholar] [CrossRef]
- Jeanjean, A.P.R.; Hinchliffe, G.; McMullan, W.A.; Monks, P.S.; Leigh, R.J. A CFD study on the effectiveness of trees to disperse road traffic emissions at a city scale. Atmos. Environ. 2015, 120, 205–212. [Google Scholar] [CrossRef]
- Elliott, E.M.; Kendall, C.; Boyer, E.W.; Burns, D.A.; Lear, G.G.; Golden, H.E.; Harlin, K.; Bytnerowicz, A.; Butler, T.J.; Glatz, R. Dual nitrate isotopes in dry deposition: Utility for partitioning NOx source contributions to landscape nitrogen deposition. J. Geophys. Res. Biogeosci. 2009, 114, G04020. [Google Scholar] [CrossRef]
- Elliott, E.M.; Yu, Z.; Cole, A.S.; Coughlin, J.G. Isotopic advances in understanding reactive nitrogen deposition and atmospheric processing. Sci. Total Environ. 2019, 662, 393–403. [Google Scholar] [CrossRef]
- Kalcsits, L.A.; Guy, R.D. Whole-plant and organ-level nitrogen isotope discrimination indicates modification of partitioning of assimilation, fluxes and allocation of nitrogen in knockout lines of Arabidopsis thaliana. Physiol. Plant. 2013, 149, 249–259. [Google Scholar] [CrossRef]
- Hu, Y.T.; Zhao, P.; Niu, J.; Sun, Z.; Zhu, L.; Ni, G. Canopy stomatal uptake of NOX, SO2 and O3 by mature urban plantations based on sap flow measurement. Atmos. Environ. 2016, 125, 165–177. [Google Scholar] [CrossRef]
- Manninen, S.; Sassi, M.K.; Loven, K. Effects of nitrogen oxides on ground vegetation, Pleurozium schreberi and the soil beneath it in urban forests. Ecol. Indic. 2013, 24, 485–493. [Google Scholar] [CrossRef]
- Song, X.; Barbour, M.M.; Saurer, M.; Helliker, B.R. Examining the large-scale convergence of photosynthesis-weighted tree leaf temperatures through stable oxygen isotope analysis of multiple data sets. New Phytol. 2011, 192, 912–924. [Google Scholar] [CrossRef] [PubMed]
- Cheesman, A.W.; Cernusak, L.A. Infidelity in the outback: Climate signal recorded in Delta O-18 of leaf but not branch cellulose of eucalypts across an Australian aridity gradient. Tree Physiol. 2017, 37, 554–564. [Google Scholar] [CrossRef] [PubMed]
- Ladvocat Cintra, B.B.; Gloor, M.; Boom, A.; Schöngart, J.; Locosselli, G.M.; Brienen, R. Contrasting controls on tree ring isotope variation for Amazon floodplain and terra firme trees. Tree Physiol. 2019, 39, 845–860. [Google Scholar] [CrossRef] [PubMed]
- Zhang, Y.; Liu, X.J.; Fangmeier, A.; Goulding, K.T.W.; Zhang, F.S. Nitrogen inputs and isotopes in precipitation in the North China Plain. Atmos. Environ. 2008, 42, 1436–1448. [Google Scholar] [CrossRef]
- Jia, G.; Chen, F. Monthly variations in nitrogen isotopes of ammonium and nitrate in wet deposition at Guangzhou, south China. Atmos. Environ. 2010, 44, 2309–2315. [Google Scholar] [CrossRef]
- Xie, L.; Wei, G.; Deng, W.; Zhao, X. Daily delta O-18 and delta D of precipitations from 2007 to 2009 in Guangzhou, South China: Implications for changes of moisture sources. J. Hydrol. 2011, 400, 477–489. [Google Scholar] [CrossRef]
- Liu, W.H.; Zhao, J.Z.; Ouyang, Z.Y.; Soderlund, L.; Liu, G.H. Impacts of sewage irrigation on heavy metal distribution and contamination in Beijing, China. Environ. Int. 2005, 31, 805–812. [Google Scholar] [CrossRef]
- Xu, C.; Lu, C.; Sun, Q. Impact of climate change on irrigation water requirement of wheat growth-A case study of the Beijing-Tianjin-Hebei region in China. Urban Clim. 2021, 39. [Google Scholar] [CrossRef]
- Wu, J.; Wang, Y.; Qiu, S.; Peng, J. Using the modified i-Tree Eco model to quantify air pollution removal by urban vegetation. Sci. Total Environ. 2019, 688, 673–683. [Google Scholar] [CrossRef]
Publisher’s Note: MDPI stays neutral with regard to jurisdictional claims in published maps and institutional affiliations. |
© 2022 by the authors. Licensee MDPI, Basel, Switzerland. This article is an open access article distributed under the terms and conditions of the Creative Commons Attribution (CC BY) license (https://creativecommons.org/licenses/by/4.0/).