Article

Differential Responses of Soil Respiration and Its Components to Nitrogen Application in Urban Forests

1
College of Forestry and Landscape Architecture, Anhui Agricultural University, Hefei 230036, China
2
College of Biology and the Environment, Nanjing Forestry University, Nanjing 210037, China
*
Author to whom correspondence should be addressed.
Forests 2022, 13(12), 2064; https://doi.org/10.3390/f13122064
Submission received: 6 November 2022 / Revised: 25 November 2022 / Accepted: 2 December 2022 / Published: 4 December 2022
(This article belongs to the Section Forest Soil)

Abstract

:
Understanding the impacts of nitrogen (N) deposition on soil respiration (Rs) and its components (autotrophic respiration (Ra) and heterotrophic respiration (Rh)) in urban forests is crucial for predicting the soil carbon dioxide (CO2) emission and evaluating carbon (C) budget in changing environments. In this study, a three-year-long field manipulation experiment was conducted in two urban forests to assess the effect of N application at three rates (0, 50, and 100 kg N·ha−1·year−1) on Rs components. N application did not alter the seasonal dynamics of Rs and its components. Rs and its components showed nonlinear responses to N application; both Rs and Rh increased in year 1 of N application but decreased in year 3. The Ra/Rs ratio increased by 21% in the low N (50 kg N·ha−1·year−1) plots. The mechanism varied across the years of N application; soil temperature and moisture substantially influenced Ra and Rh under N application. Our results indicated that increasing atmospheric N deposition may inhibit soil CO2 emission, and a higher proportion of soil C is released due to root activities. Interannual variations in temperature and rainfall may help predict the efflux of soil CO2 in urban forests in response to atmospheric N deposition.

Graphical Abstract

1. Introduction

Over the past few decades, the levels of atmospheric nitrogen (N) deposition have substantially increased due to anthropogenic activities; by 2030, these levels are expected to increase by 50%–100% [1,2]. Increased atmospheric N deposition may strongly influence soil carbon (C) flux, particularly soil respiration (Rs) [3,4], which is the second-largest source of C released from soil to the atmosphere (emission rate, 68–90 Pg C year−1) [5]. Thus, even a small amount of C released through Rs may have a considerable impact on atmospheric carbon dioxide (CO2) levels [2]. Consequently, various field studies, model-based studies, and meta-analyses have been conducted to evaluate the effects of N deposition on Rs. However, the reported responses of Rs to N deposition have been inconsistent, ranging from Rs promotion [6,7] to Rs inhibition [8,9] to nonresponse [10,11]. Thus, predicting the terrestrial C cycle is difficult, which further contributes to the uncertainty regarding the effects of climate change in the future. Due to the importance of Rs in the ecological process of C cycling in forest soils, understanding the magnitude of Rs response and the underlying mechanisms is essential [12].
The problems in predicting Rs response to N deposition originate primarily from the two distinct components of Rs—autotrophic respiration (Ra, the C efflux of vegetation roots and mycorrhiza) and heterotrophic respiration (Rh, the decomposition of soil organic matter by microorganisms). Ra is strongly influenced by the products of aboveground vegetation photosynthesis, whereas Rh is primarily associated with the availability of soil organic matter [13,14,15]. Studies have revealed that N application markedly increases the rate of Rh in subtropical forests [16] by increasing microbial biomass and facilitating microbial enrichment (fungal and bacterial communities) [17,18,19]. At <25 °C, N application has been demonstrated to considerably reduce Rh by 8.89% [5]. This reduction has been associated with decreased soil pH, reduced microbial biomass in soil, and inhibited extracellular enzyme activities after N application [20]. N application markedly increases vegetation and root activity, thus increasing Ra compared with Rh [21,22,23]; this, in turn, increases the contribution of Ra to Rs [24,25,26]. However, N application reduced Ra by 19.6% in one study and by 23.6% in another [27,28]; this was primarily attributed to the reduction in fine root biomass due to N application. The inconsistencies are attributable to the differential sensitivities of microbial activities and plant roots to N application [29,30].
Recently, rapid urbanization has resulted in increased atmospheric N deposition in urban forests [31,32], which may disrupt the stoichiometric balance of soil nutrient elements (C/N and N/P) in urban ecosystems. Volatilization, denitrification, and leaching may reduce the availability of soil N, thus limiting soil N in urban forests. Therefore, the feedback response of Rs to increased N deposition appears to be highly sensitive in urban forests. Urban biogenic CO2 fluxes may help quantify the effects of urban areas on the global C budget [33,34]. Thus far, the seasonal dynamics and primary drivers of Rs and the contribution of roots, litter, and soil microorganisms to Rs have been studied in few urban ecosystems [35,36,37]. However, most of the aforementioned studies were limited either spatially or temporally, lacking any forecasting regarding the increase in N deposition. Thus, the mechanisms underlying the effects of N deposition on Rs and its components remain elusive; in addition, the factors influencing Rs in urban forests remain unclear.
Considering the diverse responses of Ra and Rh to N enrichment [6,38], we conducted a field experiment to evaluate the effects of N application on Rs and its components in two urban forests. The specific objectives were to estimate the response of Rs and its components to different rates of N application in urban forests, elucidate how the combination of Ra and Rh affects Rs under N application, and identify the mechanism influencing Rs and its components. Our hypotheses were as follows: (1) Rs would increase after the initial N application; (2) the reduction in Rh after N application would be higher than that in Ra, which would reduce the Rh/Rs ratio; (3) soil temperature and moisture would be the predominant factors influencing Rs and its components under N application.

2. Materials and Methods

2.1. Study Site

The study area is located in Hefei, Anhui Province, China (117°11′–117°22′ E and 31°48′–31°58′ N). Hefei has a subtropical humid monsoon climate with four distinct seasons. During the study period (3 years), the annual mean values of temperature, precipitation, frost-free period, and sunshine hours were 17.5 °C, 992 mm, 237 days, and 1850 h, respectively.
Two urban forests in Hefei were selected as the study sites: a periurban forest (Shushan Forest Park; area, 1003.01 hm2) and an outskirt forest (Zipengshan National Forest Park; area, 1002.47 hm2) (Figure 1). The two forests have similar site characteristics (Table 1), relatively complete forest structures, low human interference, and yellow brown soil. In these forests, sawtooth oak (Quercus acutissima Carruth.) was the predominant tree species. The understory vegetation comprised rhododendron (Rhododendron simsii), weeping Forsythia (Forsythia suspensa), goldenbell flower (F. viridissima), and pteridophytes.

2.2. Experimental Design

In June 2018, experimental plots were set up using the random block experimental design method. To eliminate the influence of trees, stands of Q. acutissima were selected as experimental plots. All stands had similar ages and topographies (altitudes and slopes). The heights, diameters, and canopy closures of plots were almost similar (Table 1).
To evaluate the effects of N deposition on Rs, the experimental plots were subjected to N deposition at three rates: control (CK; 0 kg N·ha−1·year−1), low N (LN; 50 kg N·ha−1·year−1), and high N (HN; 100 kg N·ha−1·year−1). The concentrations were selected by referring to the observed atmospheric N deposition rate in the study area and the predicted normal increase in N levels [39,40,41]. Three replicates were used for each application rate, and a total of 18 plots (size, 20 m × 20 m) were randomly established in the two study sites. A buffer zone of at least 10 m was maintained between two adjacent plots, and polyvinyl chloride (PVC) sheet piles were placed around the plots as permanent plot markers. Ammonium nitrate (NH4NO3) fertilizer was dissolved in 20 L of pure water; this solution was used for N application. One-sixth of the amount of the fertilizer for each application rate was sprayed on the plots by using a portable sprayer every 2 months. The CK plots received only water. The methods and concentrations used for the N deposition experiments performed in the present study were based on the observed atmospheric N deposition in this area and the results of an N application gradient experiment performed in subtropical zonal forests [39,40].

2.3. Evaluation of Rs and Its Components

To determine Rs, five PVC respiration rings (inner diameter, 10 cm; height, 9 cm; and space between two rings, 2–4 m) were inserted into a soil depth of 4 cm in each experimental plot. Rh was measured using the trench method, and Ra was calculated by subtracting Rh from Rs [42]. Considering the interference of trench excavation and the decomposition of dead roots, the trenches were dug 1 year before evaluation. A few days before evaluation, litter and surface vegetation were removed from the PVC rings to minimize disturbance.
Rs and its components were measured using an Rs meter (LI-8100; Li-Cor Inc., Lincoln, NE, USA). This 3-year study was conducted from June 2018 to May 2021, and each year was further divided into four different seasons based on tree phenology: mid-growing season (June–August), late growing season (September–November), non-growing season (December–February), and early growing season (March–May). The measurements were taken on clear and cloudless days between 8:00 and 18:00, and growth periods were evaluated for 8 or 9 days. ST and SW at a depth of 10 cm adjacent to each PVC collar were measured using a portable temperature and moisture probe equipped with Li-8100.

2.4. Sampling and Analysis of Soil

Soil samples were collected during Rs evaluation. From each plot, a total of five soil samples were randomly collected (collection depth, 0–10 cm) using a soil auger (diameter, 3.5 cm). Then, the soil samples were thoroughly mixed to ensure homogeneity and transported to our laboratory; a portable incubator set at 5 °C was used for sample transport. Subsequently, fine roots and small stones were removed using a 2 mm sieve. Next, the soil samples were divided into two equal portions. One portion was used to evaluate various soil activity indices, and the other half was air-dried to determine the levels of total N (TN), total C (TC), and soil pH.
The levels of TN and TC were measured using an elemental analyzer (EA 3000, Vector, Italy), and soil pH was measured in a soil:water (1:2.5) suspension by using a pH meter (Extech EC 500). Furthermore, total dissolved N (TDN) was extracted using 0.5 mol L−1 potassium sulfate, and the levels of TDN were measured using a total organic carbon analyzer (Multi N/C 3100, Jena, Germany). Ammonium N (NH4+-N) and nitrate N (NO3-N) were extracted using 1 mol L−1 potassium chloride solution, and their levels were measured using a flow injection analyzer (FIAstar 5000, FOSS, Denmark) [43]. The levels of microbial biomass C (MBC) and microbial biomass N (MBN) were evaluated through chloroform fumigation extraction [44]. All experiments were completed within a week of sample collection.

2.5. Statistical Analysis

All data were tested for homogeneity of variance and normal distribution, and nonparametric methods were used if the assumptions were not met. One-way analysis of variance (ANOVA) was used to determine the annual changes in Rs rate and various biotic and abiotic factors with N application. Repeated measures ANOVA was used to investigate the effects of season or year, N application, and their interactions with Rs and its components. A generalized linear mixed-effects model was used to analyze the responses of various soil factors to N application.
A random forest algorithm [45] was used to assess the relative importance of biotic and abiotic factors for Rs and its components. The increase in mean squared error was evaluated to assess the importance of each driver of Rs and its components. Random forest modeling was performed using the “randomForest” package in R (version 4.1.2, R Corm Team) [46]. The p values for the importance of each control factor were examined using the R package rfPermute [47].
Structural equation modeling (SEM) was performed using SPSS Amos (version 23.0; IBM Amos Development Corporation, Chicago, IL, USA). SEM was used to analyze the direct and indirect factors influencing Rs and its components. The variables used in the model were significant factors identified through random forest analysis. The overall goodness of model fit was ensured through various tests, such as chi-squared test/degree of freedom, comparative fit index, goodness of fit index fit, and root mean square error of approximation. Data were processed using SPSS (version 26.0; SPSS Institute, Chicago, IL, USA). Statistical significance was set at p < 0.05. All figures were drawn using Origin 2021.

3. Results

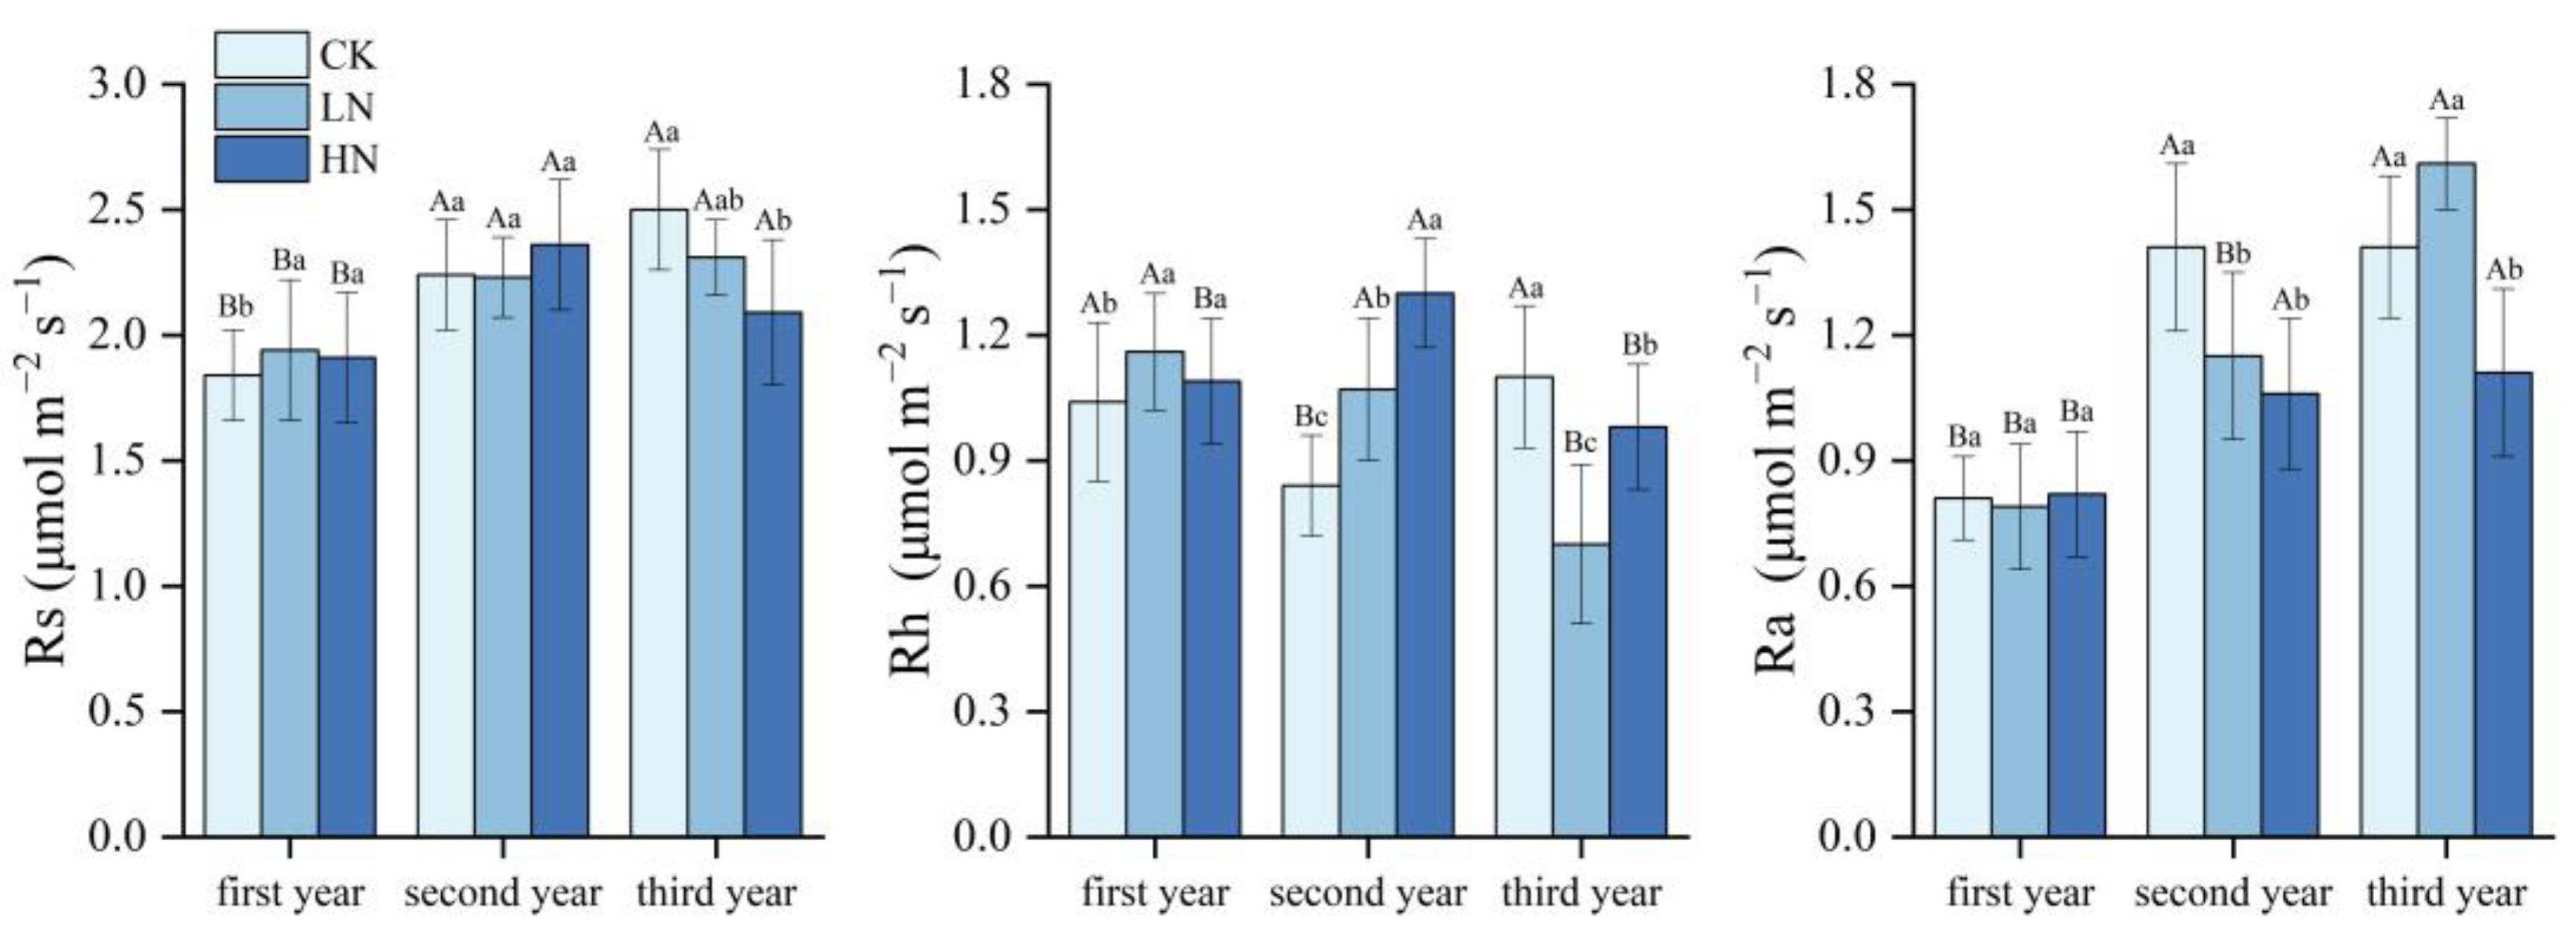
3.1. Effects of N Application on Rs and Its Components

Rs and its components exhibited prominent seasonal patterns, and the highest values were recorded in the mid-growing season (Figure 2). Both year and N application exerted substantial effects on Rs and its components. We noted a strong interactive effect by the year and N application on Ra and Rh (Table 2). In addition, we observed prominent annual effects by the seasons on Rs and its components (Table 2).
N application exerted different effects on Rs and its components (Table 2; Figure 3). In year 1, compared with the findings noted in the CK plots, Rs and Rh increased by 5.4% and 11.6%, respectively, in the LN plots; however, Ra remained unchanged in the LN and HN plots (p < 0.05). Similarly in year 2, N application significantly increased Rh by 28.1% and 55.3%, respectively, in the LN and HN plots but significantly reduced Ra by 33.0% in the HN plots, compared with the findings in the CK plots (p < 0.05). In year 3, compared with the CK plots, N application considerably reduced Rs by 16.4% in the HN plots and Rh by 57.4% and 12.2%, respectively, in the LN and HN plots; by contrast, Ra was increased by 14.2% in the LN plots and reduced by 21.3% in the HN plots (p < 0.05). N application increased the Ra/Rs ratio from 38% in year 1 to 59% in year 3 in the LN plots during the study period (Figure 4).

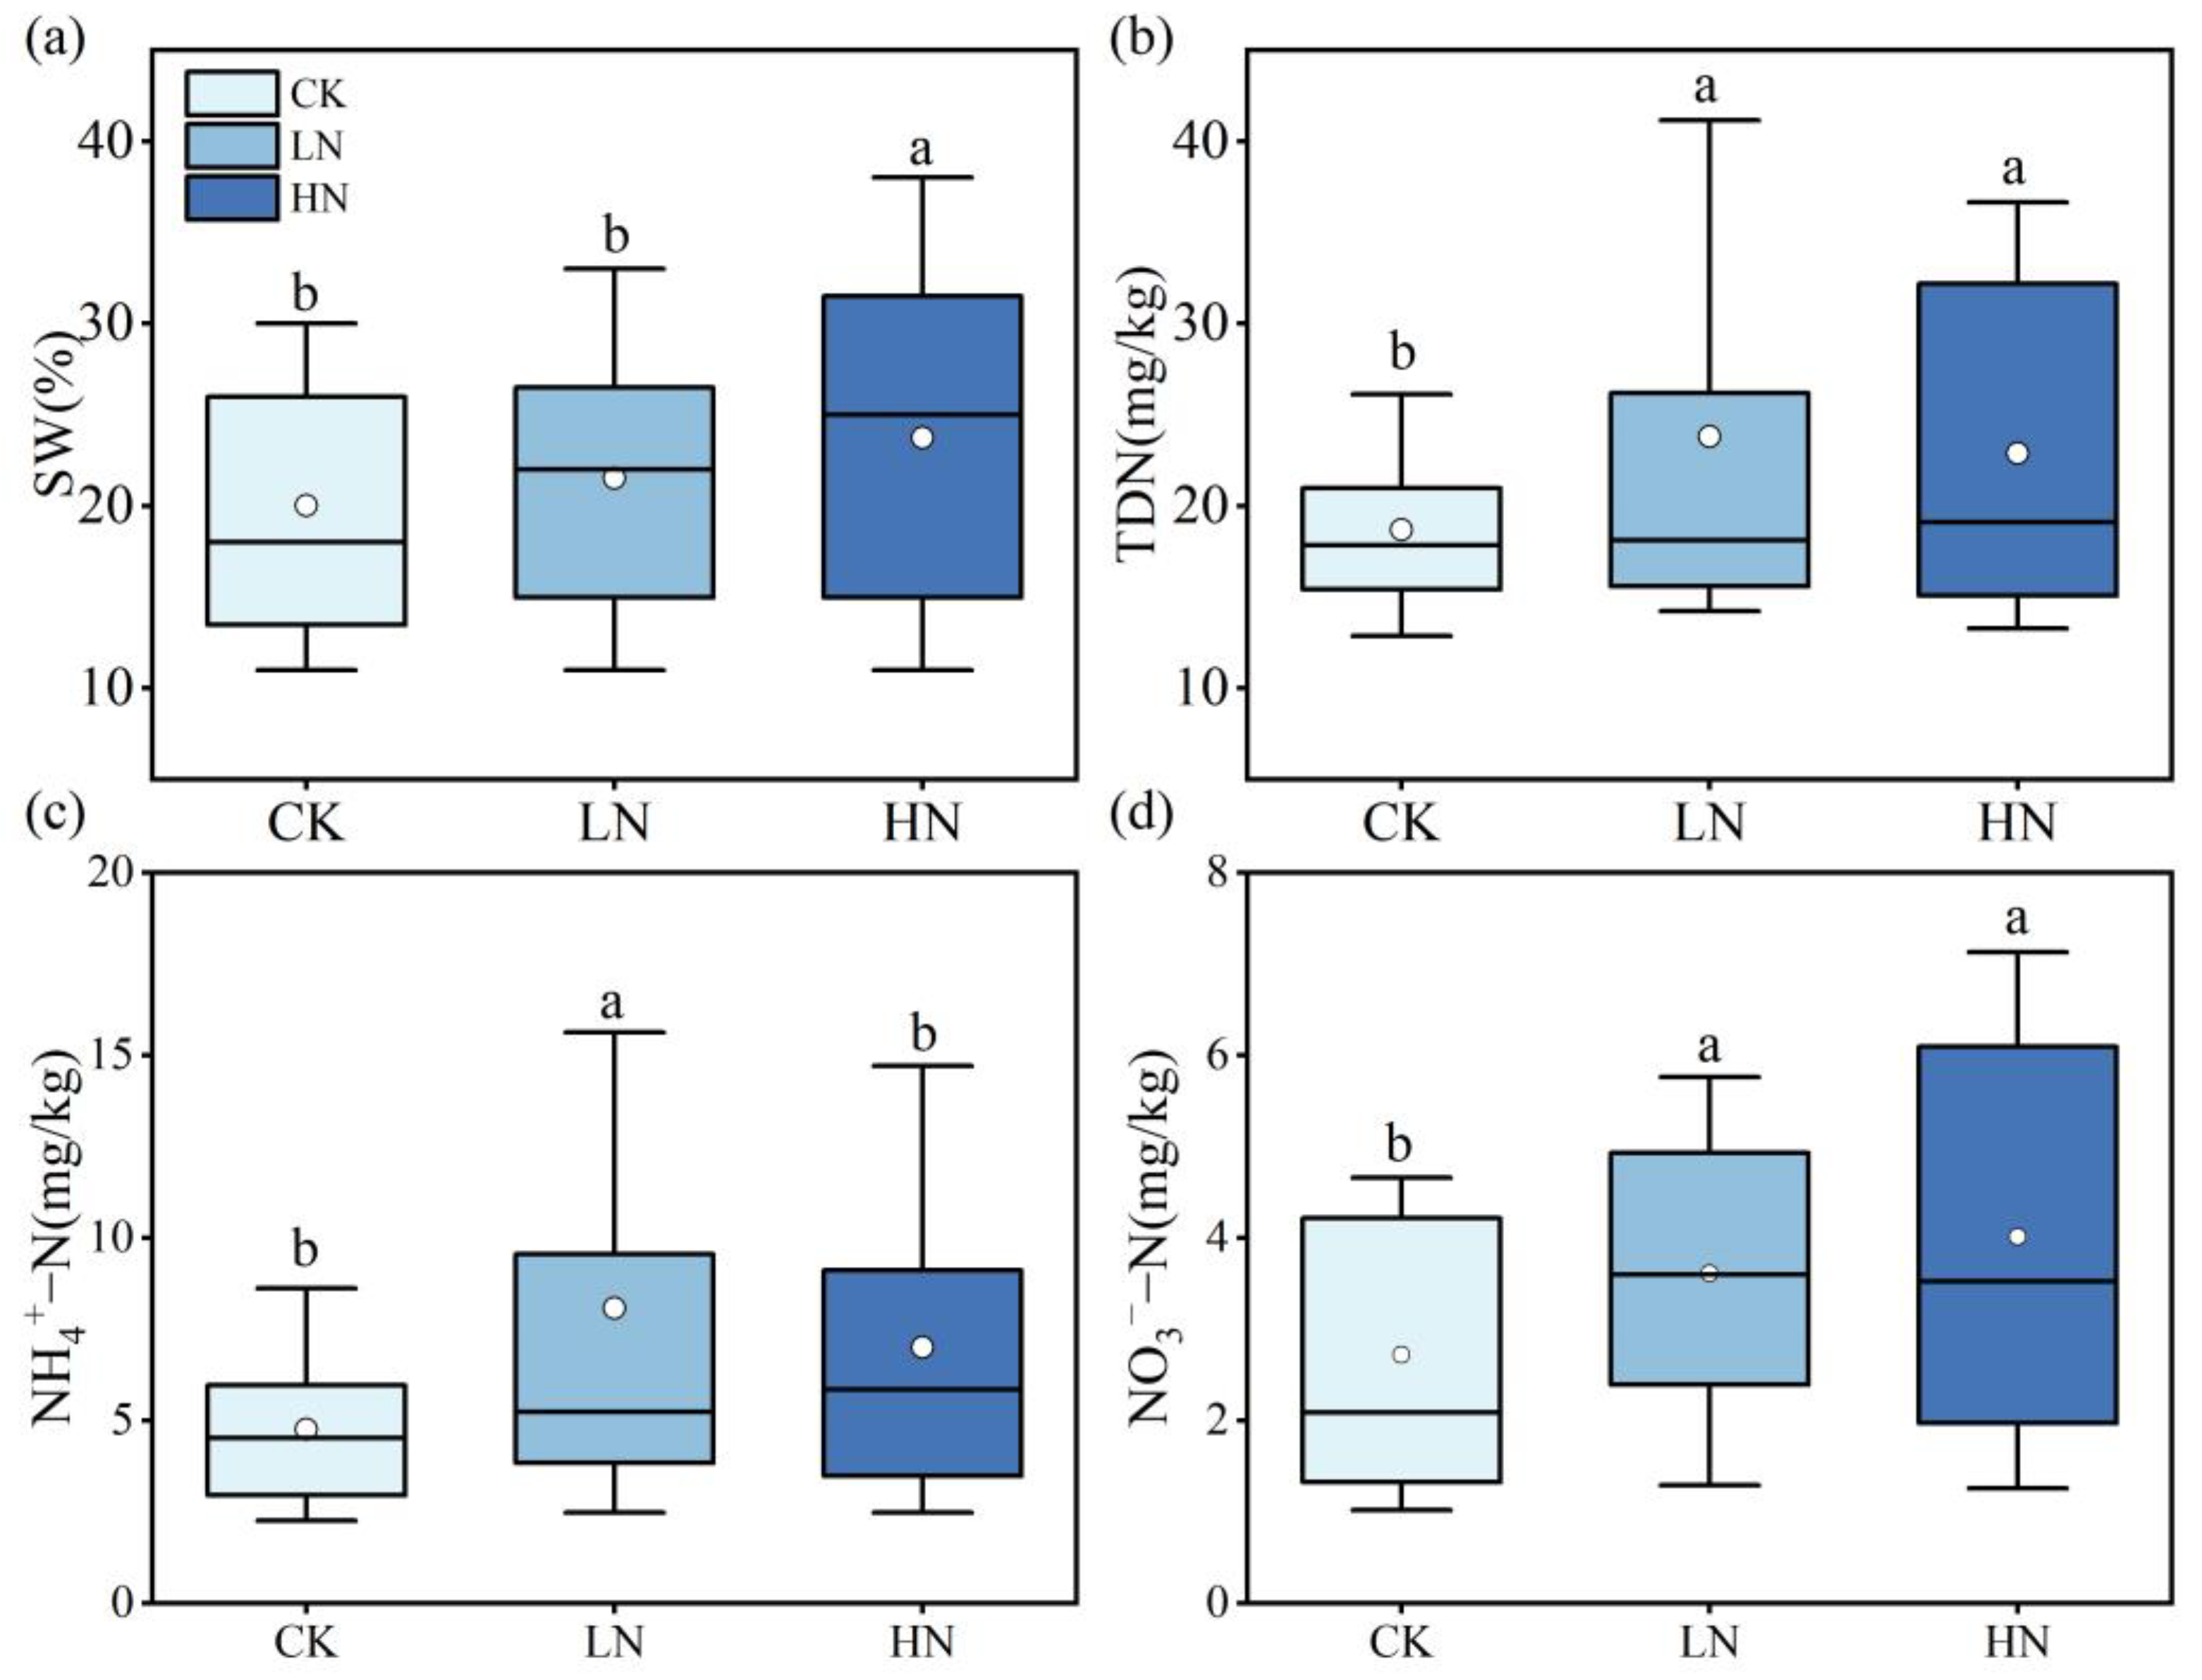
3.2. Changes in the Soil Factors after N Application

The year considerably affected both biotic and abiotic factors during the study period, and N application markedly influenced SW, NH4+-N, NO3-N, and TDN (all p < 0.05) (Table 3; Figure 5). We also noted a significant (p < 0.05) interactive effect of the year and N application on SW (Table 3).
N application significantly increased ST in the HN plots every year (p < 0.05). In year 1, ST increased by 5.3%, from 16.48 °C in the CK plots to 17.35 °C in the HN plots (Table S1). SW significantly decreased in the HN plots by 36.4% and 14.3% in years 2 and 3, respectively, compared with the corresponding values in the CK plots (both p < 0.05; Table S1). N application considerably influenced soil TDN, particularly in the HN plots (Figure 5). Compared with the findings in the CK plots, TDN was significantly increased by 37.2% and 30.3%in years 2 and 3, respectively, in the HN plots (both p < 0.05; Table S1). In the HN plots, N application significantly increased the levels of soil NH4+-N by 22.5%, 45.6%, and 52.0% in years 1, 2, and 3, respectively (all p < 0.05; Figure 4; Table S1). Similarly, the levels of NO3-N were significantly increased by 42.1% and 69.0% in the HN plots in years 2 and 3, respectively (p < 0.05; Table S1); however, no differences were noted in these levels between the findings obtained in year 1 and the baseline data. In the HN plots, N enrichment significantly decreased the levels of MBN by 16.9%, 10.4%, and 24.6% in years 1, 2, and 3, respectively (all p < 0.05; Table S1).

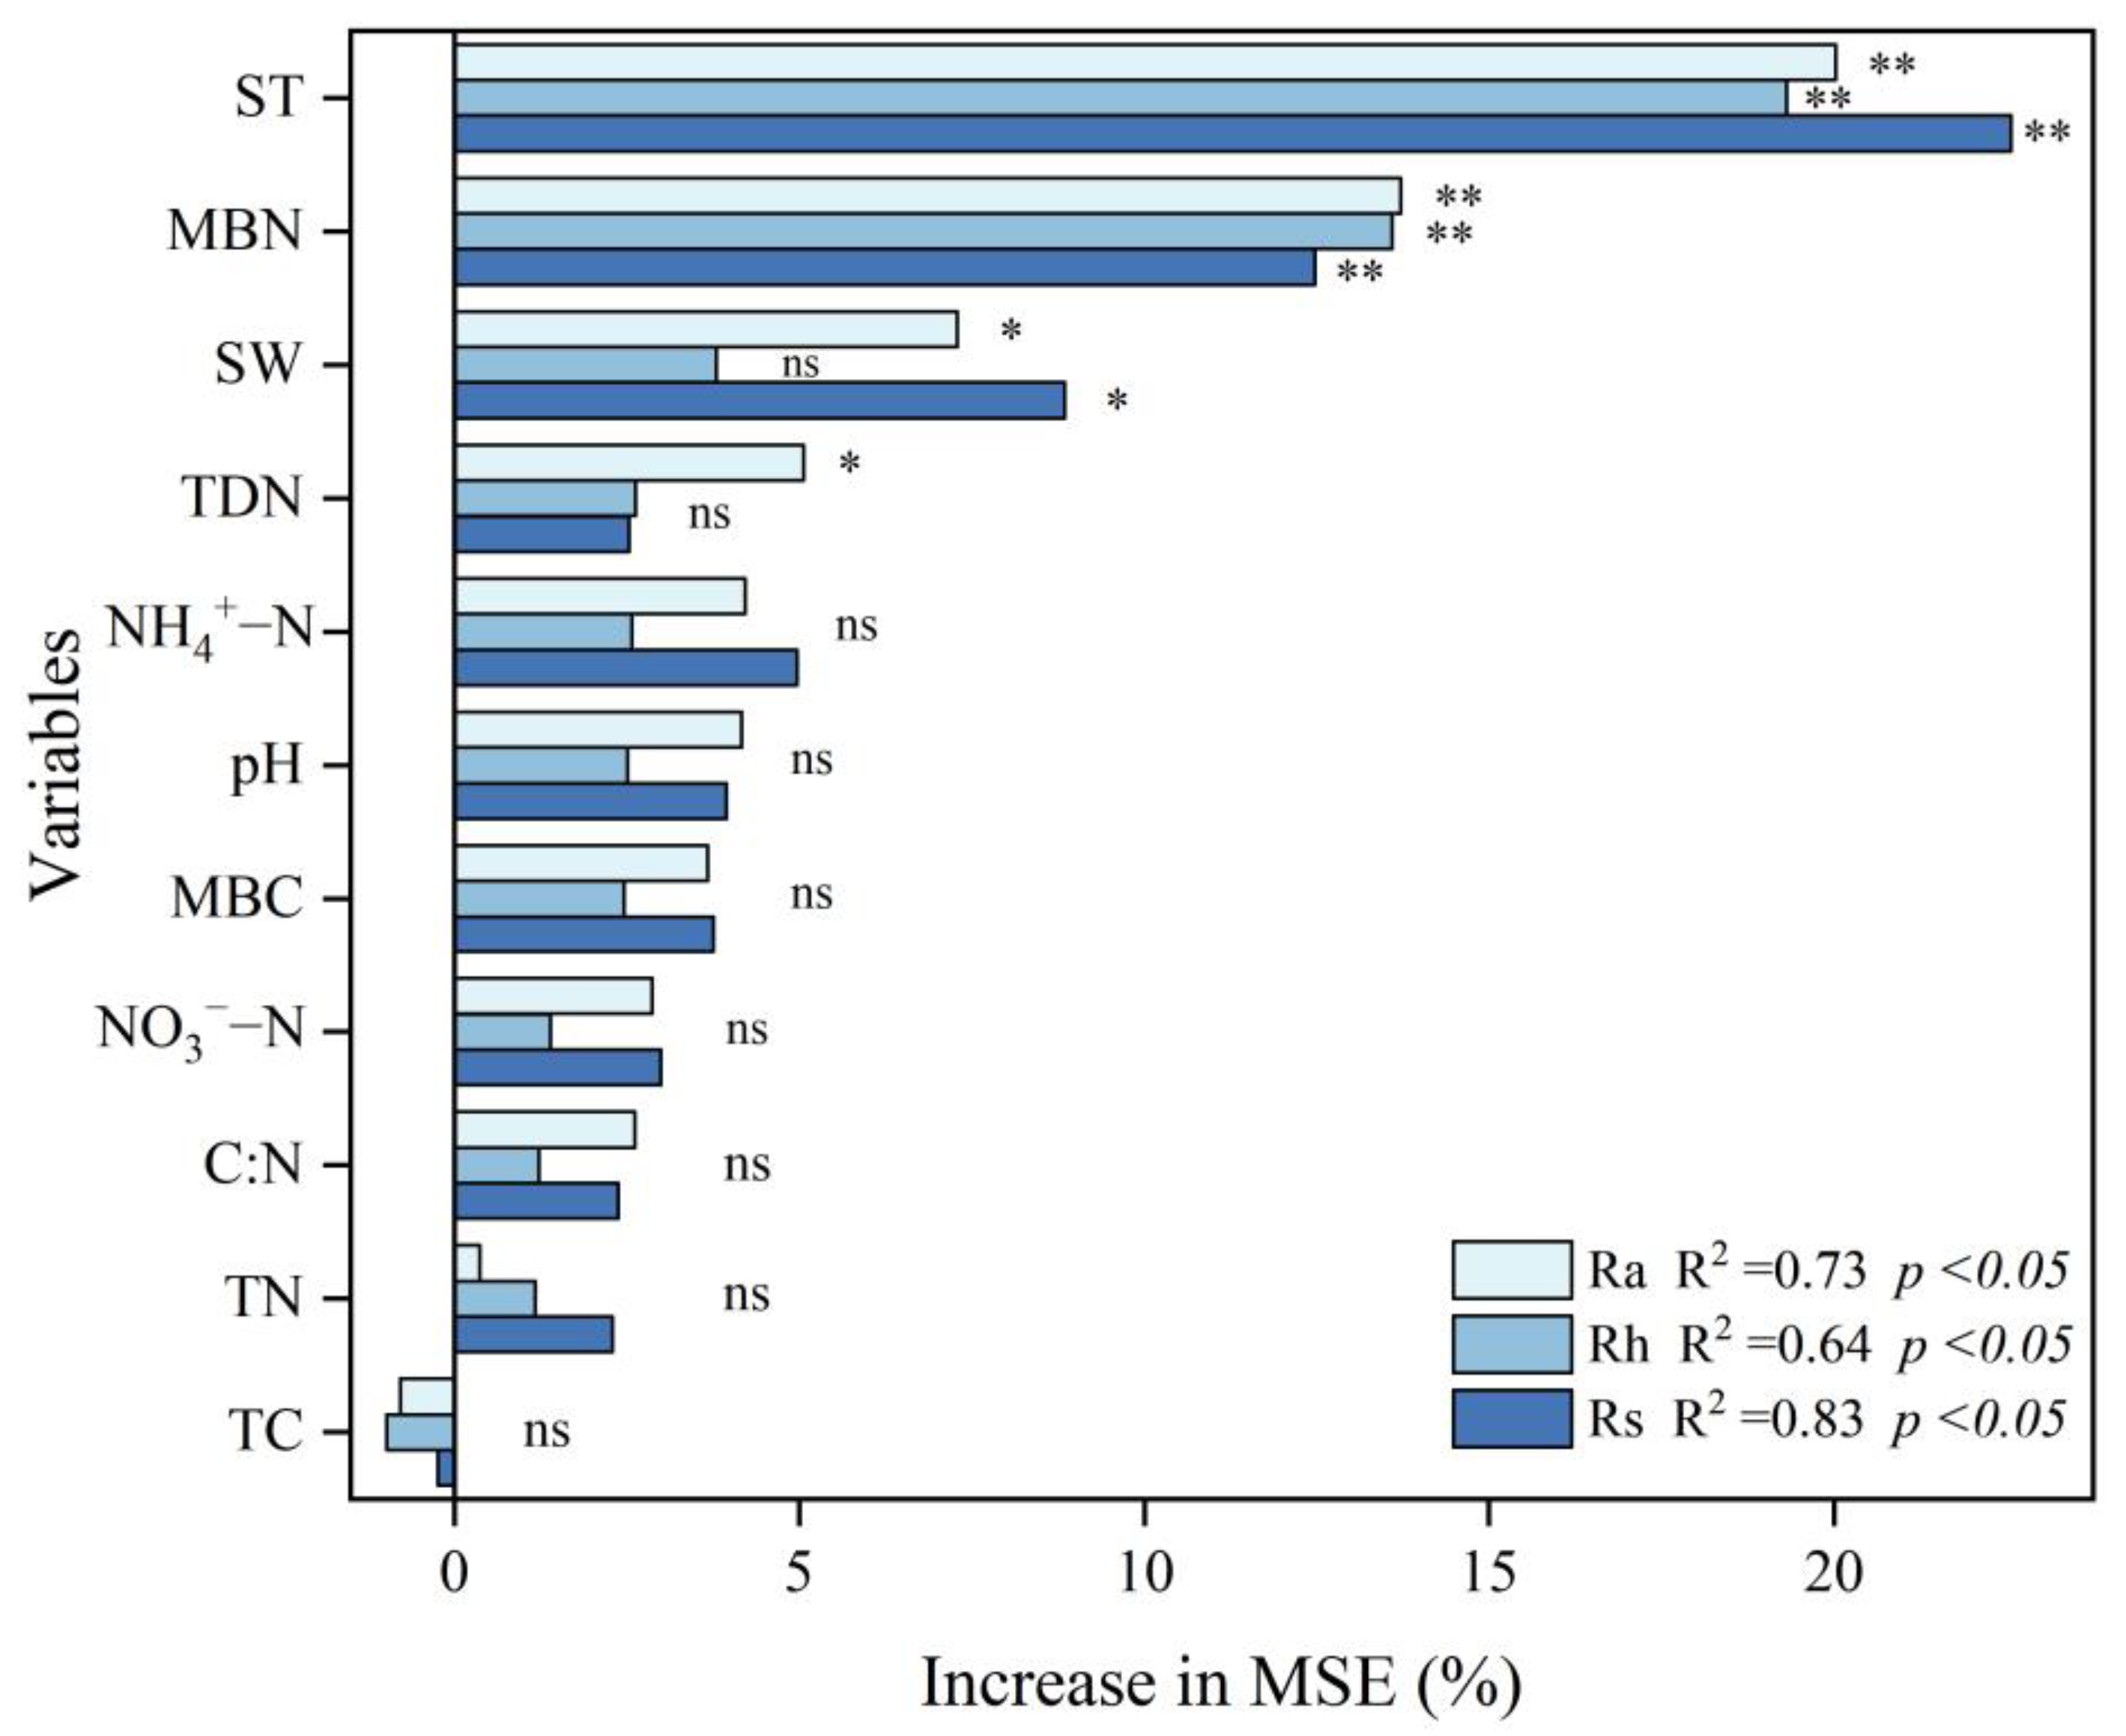
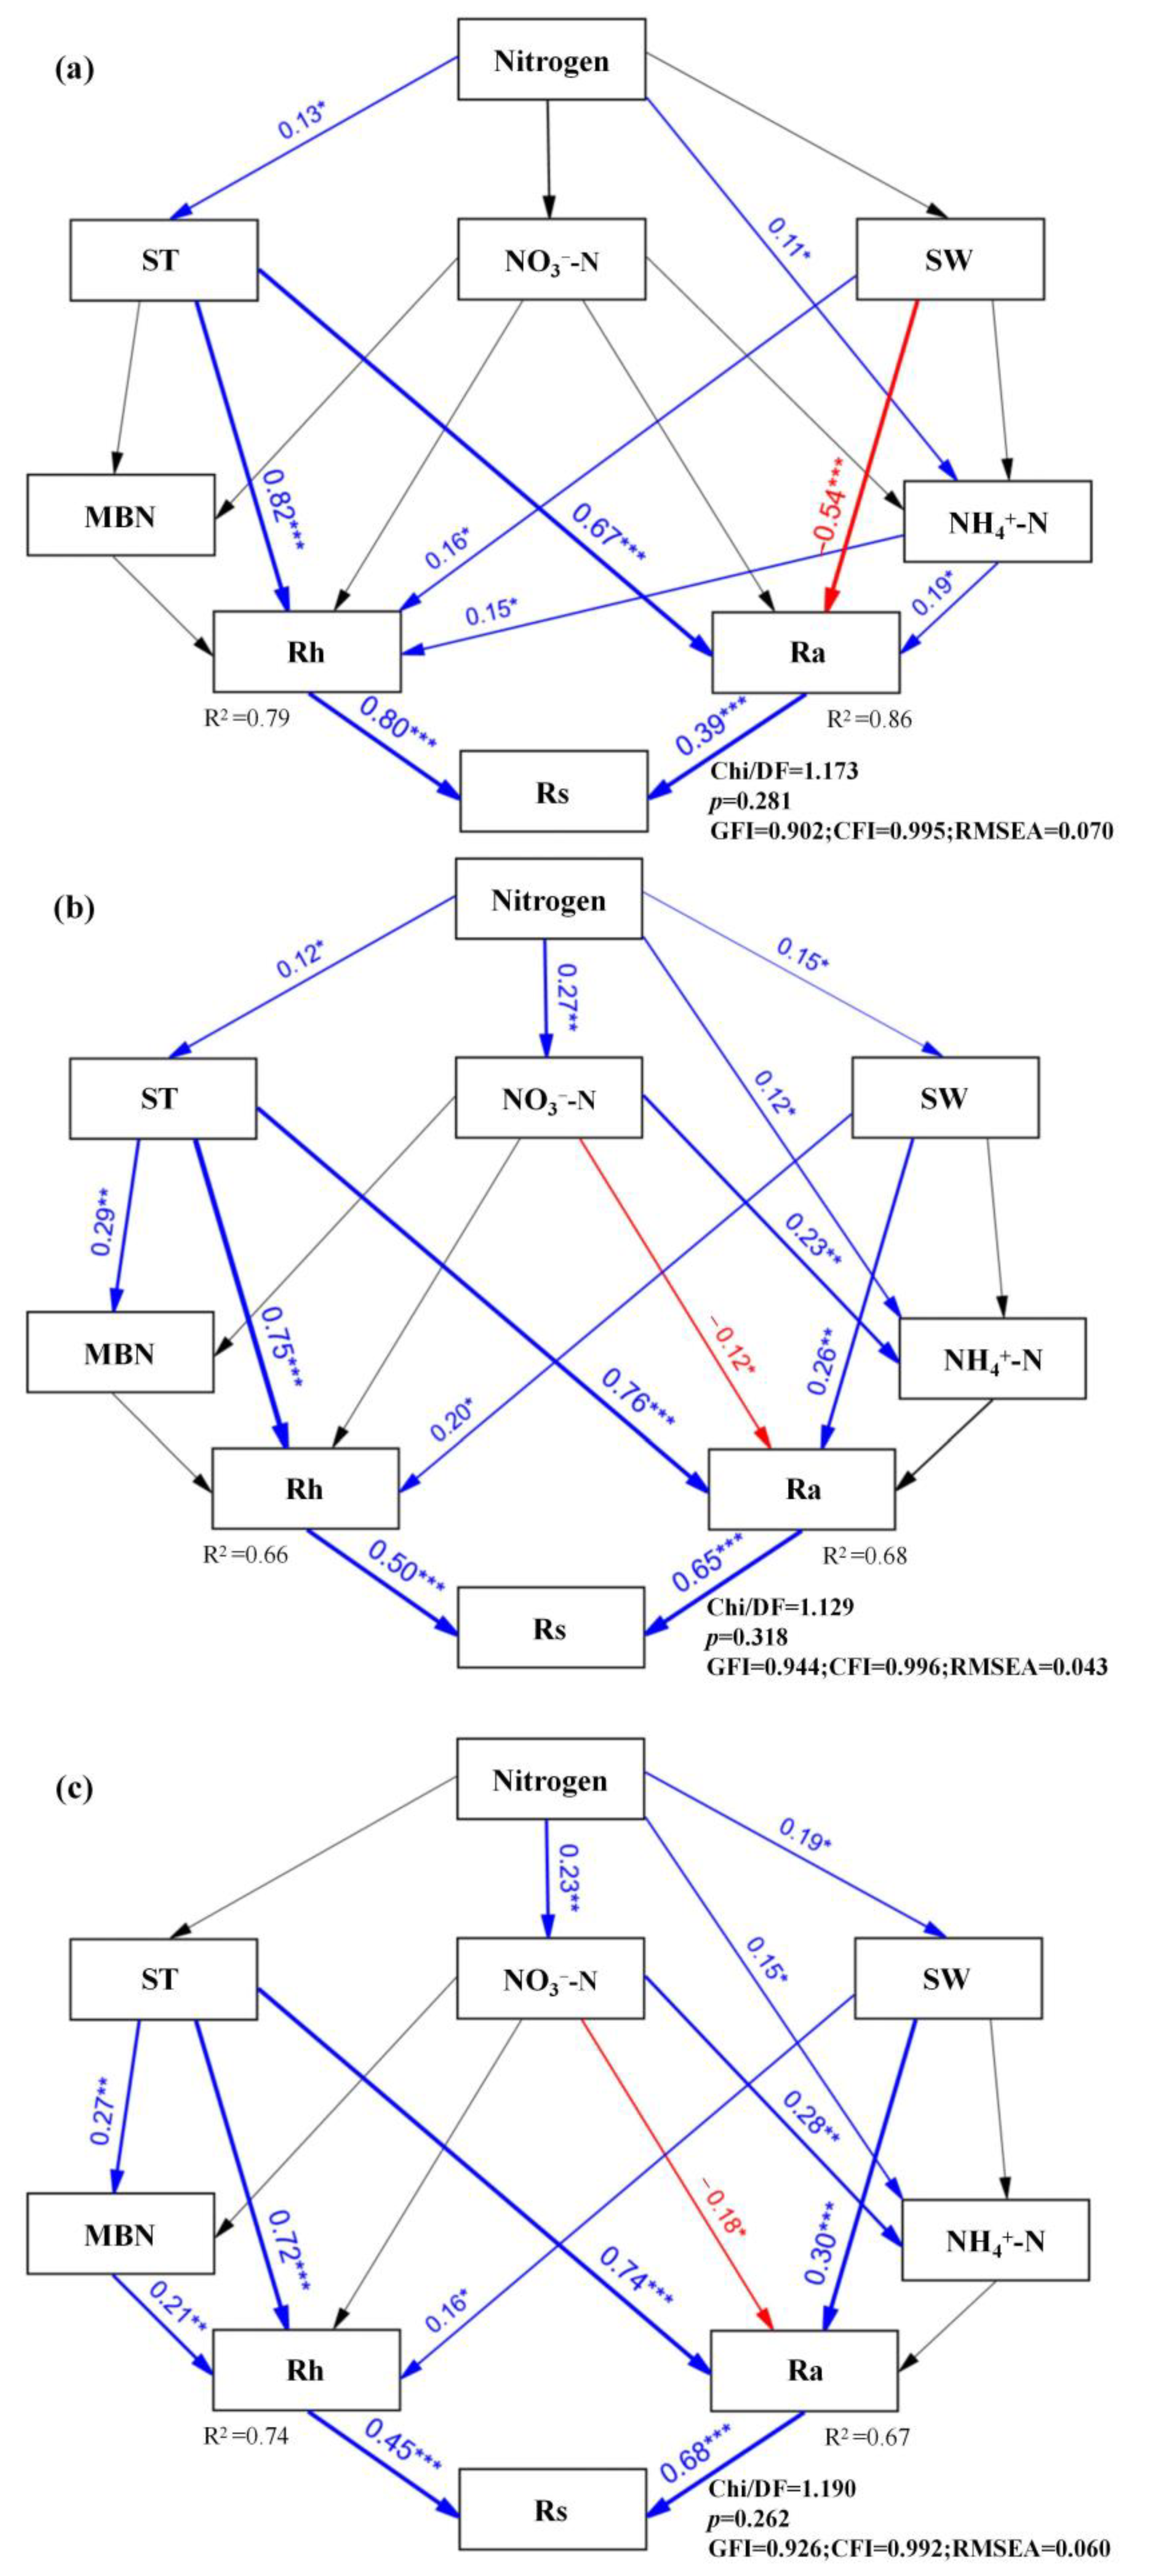
3.3. Factors Influencing Rs and Its Components

Using random forest analysis, we identified ST, MBN, and SW to be the predominant predictors of Rs (p < 0.05; Figure 6). ST and MBN were also found to be the key predictors of Rh (p < 0.05; Figure 6). By contrast, ST, MBN, SW, and TDN were the predominant predictors of Ra (p < 0.05; Figure 6). The results of random forest analysis explained 83%, 64%, and 73% of the total variances in Rs, Rh, and Ra, respectively.
The SEM results revealed that under N application Rs and its components were markedly influenced by ST and SW during the study period (p < 0.05; Figure 7). In year 1, Rh was positively regulated by ST and SW, whereas Ra was positively regulated by ST but negatively regulated by SW. The levels of NH4+-N directly influenced Rh and Ra (p < 0.05; Figure 7a). In year 2, Ra and Rh were positively regulated by ST and SW; under the increase in N addition, NO3-N negatively influenced Ra (p < 0.05; Figure 7b). Furthermore, as the N application experiment continued in year 3, ST, SW, and NO3-N regulated Ra; although SW directly influenced Rh, the effects were relatively weak. Notably, ST maintained its direct and indirect effects on Rh by influencing MBN accumulation (p < 0.05; Figure 7c). Over the 3 years, the variance in the Rs could be predominantly explained by both Ra and Rh.

4. Discussion

4.1. Dynamics of Rs and Its Components

Rs and its components exhibited similar seasonal variations, and N application exerted no prominent effects on these variations. Seasonal variations occur in Rs and its components primarily due to climatic factors [48]. Similar to the findings of the aforementioned study, the trends of variations in Rs and its components in our study were consistent with changing ST (Figure 2 and Figure S1).
In year 1, Rs and its components increased slightly after N application, which supported our hypothesis 1. However, in the following years, the rates of Rs decreased. This result might be because of the initial levels of N in soil. N application increases the rates of Rs and its components in N-limited ecosystems [49] but decreases these rates in N-rich ecosystems [50]. Excessive application of N may inhibit soil microbial and root activities, thus exerting pronounced negative effects on Rs and its components [51,52,53]. Our findings corroborate those of relevant studies, particularly those conducted in high N application plots. This suggests that the near-future rates of atmospheric N deposition may not lead to a substantial increase in the release of soil C to the atmosphere in urban forests. Long-term multilevel simulated N application experiments are necessary to investigate the subtle responses of Rs and its components to N deposition and predict soil C sequestration in response to increasing N deposition.
In the present study, the reduction in Rh due to N application was more prominent than the reduction in Ra. This difference increased the Ra/Rs ratio (Figure 4), which supports our hypothesis 2. Our findings are consistent with those of an earlier study indicating that N application markedly reduces Rh, resulting in a reduced contribution of Rh to Rs in subtropical broadleaf forests [28]. In semi-arid grassland ecosystems, the negative effects of N application on Rh are stronger than its positive effects on Ra, which substantially increases the Ra/Rs ratio [54]. By contrast, an experimental study conducted in an alpine grassland ecosystem revealed that N application considerably reduced Ra, thus increasing the Rh/Rs ratio [55]. The increased Ra/Rs ratio due to considerable changes in Rh under N application may help predict soil C sequestration. The large Ra/Rs ratios under N application indicate that the proportion of soil C released due to root activities is higher than that released due to microbial decomposition; this contributes to the destabilization of the soil C pool.

4.2. Factors Influencing Rs and Its Components

Rs is primarily related to the respiration of soil microorganisms and plant roots; therefore, these two components determine the response of Rs to N application [56]. In the present study, the predominant soil factors influencing Rs and its components varied across the years of N application. Rs and its components were considerably affected by ST and SW, which is consistent with our hypothesis 3.
ST was identified to be the predominant factors influencing Rh during the study period. ST influences the activity of soil microorganisms, and the active nutrients required for the growth of soil microorganisms are sensitive to the changes in ST; therefore, small changes in ST strongly influence the activity and quantity of soil microorganisms [57,58], which in turn affect Rh. Furthermore, SW substantially influenced Rh throughout the study period. Suitable SW contributes to the transport of organic matters to the pore space in soil; soil microorganisms use these organic matters as a substrate for growth [39]. In year 1 of our study, the accumulation of NH4+-N due to N application increased Rh; this might be because increased levels of NH4+-N promote the activity of ammonifying bacteria [59]. Continual N application inhibited Rh in year 3; this was primarily because the increase in N accumulation reduced the levels of MBN, thus inhibiting Rh (Table S1; Figure 7). Consistent with our study, a study conducted in warm-temperate forests revealed that high rates of N application reduce the volumes of soil microbial biomass, thus inhibiting Rh [60]. N application reduces the levels of C utilization [61] and cellulase activity [62] of soil microbes and may also lead to the formation of compounds that are not easily degraded by soil microorganisms [63]. Thus, Rh tends to decrease after N application.
During the study period, ST and SW markedly influenced Ra. ST was identified to be predominant factor influencing Ra. ST is essential for vegetation growth, which explains its influence on vegetation growth and root metabolism [40]. Furthermore, Ra is largely dependent on the levels of C assimilated through the photosynthesis of aboveground vegetation; C has a short residence time and is sensitive to temperature changes [64,65]. High levels of SW may increase soil permeability and facilitate air transport to the pore space of soil, thus increasing oxygen flow for the growth of plant roots in soil [66], which in turn affects Ra. In year 1, Ra exhibited a nonsignificant response to N application; this was likely because of the antagonism between the positive effects of ST and NH4+-N and the negative effects of SW on Ra under N application (Table S1; Figure 7). In years 2 and 3 of N application, Ra decreased considerably due to the negative effects of increased levels of NO3-N because of N accumulation in soil (Figure 5 and Figure 7). NO3-N is mineral N that can be directly absorbed and utilized by plants; this mineral plays a key role in the growth and development of plants [67,68]. However, when the level of NO3-N in soil is too high to be absorbed, it hinders the transport of organic matters by aboveground vegetation to the underground system for photosynthesis, which results in decreased root activity [69]. This further shortens the lifespan of vegetation roots [70], ultimately reducing Ra.
In the present study, the primary soil factors influencing Rs and its components varied across the years of N application. Different regulating factors may be responsible for the large differences noted in the response patterns of Rs and its components to N application in different years and may explain why these responses varied across ecosystems. These findings improve our understanding of soil sequestration, the C–N coupling cycle, and the feedback of soil C with the increase in atmospheric N deposition.

5. Conclusions

Soil C flux in urban forests is the central focus of studies in the field of urban ecology. In the present study, we simulated the effects of increased N deposition on Rs in urban forests, which verifies the fact that urban ecosystem is an N-limited ecosystem. In the following year, Rs and its components exhibited no linear responses to N application, which indicates that the regulatory capacity of urban ecosystems is weak. However, long-term experiments are required to determine the response patterns. The negative effects of N application were stronger on Rh than on Ra, which increased the Ra/Rs ratio from 38% in year 1 to 59% in year 3 in the LN plots. This indicates that a high proportion of soil C is released due to root activities. These findings may help elucidate the mechanism underlying the feedback response of soil C to increasing N deposition. The components of Rs exhibited varying responses to N application, which were mediated through different pathways. Furthermore, soil temperature and moisture substantially influenced Rs and its components under N application during the study period, indicating that interannual variations in temperature and rainfall can help predict the efflux of soil CO2 in urban forests in response to atmospheric N deposition.
The findings of the present study expand the knowledge regarding the effects of N application on Rs in urban forests. This study serves as a reference for authorities engaged in city planning that uses urban forests as an essential component to achieve C neutrality goals. Future studies are warranted to elucidate the precise mechanisms underlying the aforementioned effects. Increasing the N application gradient appears to be an effective approach for determining the response patterns of plant roots and soil microorganisms to N application.

Supplementary Materials

The following supporting information can be downloaded at: https://www.mdpi.com/article/10.3390/f13122064/s1. Figure S1: Dynamic changes in soil temperature (ST) after nitrogen application at various rates. Data are presented in terms of mean ± standard deviation values; Table S1: Annual evaluation (average amounts) of soil properties after simulated nitrogen application during the study period.

Author Contributions

Conceptualization, B.P.; Software, B.P. and Z.D.; Formal analysis, B.P.; Investigation, B.P., Z.D. and L.B.; Resources, X.X.; Data curation, L.B.; Writing—original draft, B.P.; Visualization, B.P.; Supervision, X.T.; Project administration, X.T.; Funding acquisition, X.T. and Y.Y. All authors have read and agreed to the published version of the manuscript.

Funding

This research was supported by the National Natural Science Foundation of China (31700631), the Natural Science Research Project of University in Anhui Province (KJ2021ZD0017), and the National Key Research and Development Program of China (Grant No. 2021YFD2201304).

Data Availability Statement

Not applicable.

Acknowledgments

Special thanks are expressed to Liu Feng and Ding Guowei for their assistance with the field monitoring and laboratory analysis. We also gratefully acknowledge the journal’s editors and anonymous reviewers for their constructive comments.

Conflicts of Interest

The authors declare no conflict of interest.

References

  1. Galloway, J.N.; Townsend, A.R.; Erisman, J.W.; Bekunda, M.; Cai, Z.; Freney, J.R.; Martinelli, L.A.; Seitzinger, S.P.; Sutton, M.A. Transformation of the Nitrogen Cycle: Recent Trends, Questions, and Potential Solutions. Science 2008, 320, 889–892. [Google Scholar] [CrossRef] [PubMed] [Green Version]
  2. Li, Q.; Song, X.Z.; Chang, S.X.; Peng, C.H.; Xiao, W.F.; Zhang, J.B.; Xiang, W.H.; Li, Y.; Wang, W.F. Nitrogen depositions increase soil respiration and decrease temperature sensitivity in a Moso bamboo forest. Agric. For. Meteorol. 2019, 268, 48–54. [Google Scholar] [CrossRef]
  3. Luo, Q.P.; Gong, J.R.; Zhai, Z.W.; Pan, Y.; Liu, M.; Xu, S.; Wang, Y.H.; Yang, L.L.; Baoyin, T.-T. The responses of soil respiration to nitrogen addition in a temperate grassland in northern China. Sci. Total Environ. 2016, 569–570, 1466–1477. [Google Scholar] [CrossRef]
  4. Xiao, H.B.; Shi, Z.H.; Li, Z.W.; Wang, L.; Chen, J.; Wang, J. Responses of soil respiration and its temperature sensitivity to nitrogen addition: A meta-analysis in China. Appl. Soil Ecol. 2020, 18, 103484. [Google Scholar] [CrossRef]
  5. Liu, H.M.; Zhou, G.Y.; Bai, S.H.; Song, J.J.; Shang, Y.J.; He, M.; Wang, X.H.; Zheng, Z.M. Differential response of soil respiration to nitrogen and phosphorus addition in a highly phosphorus-limited subtropical forest, China. For. Ecol. Manag. 2019, 448, 499–508. [Google Scholar] [CrossRef]
  6. Zhou, L.Y.; Zhou, X.H.; Zhang, B.C.; Lu, M.; Luo, Y.Q.; Liu, L.L.; Li, B. Different responses of soil respiration and its components to nitrogen addition among biomes: A meta-analysis. Glob. Chang. Biol. 2014, 20, 2332–2343. [Google Scholar] [CrossRef]
  7. Zhou, L.Y.; Zhou, X.H.; Shao, J.J.; Nie, Y.Y.; He, Y.H.; Jiang, L.L.; Wu, Z.T.; Hosseini, B.S. Interactive effects of global change factors on soil respiration and its components: A meta-analysis. Glob. Chang. Biol. 2016, 22, 3157–3169. [Google Scholar] [CrossRef] [PubMed]
  8. Devaraju, N.; Bala, G.; Caldeira, K.; Nemani, R. A model based investigation of the relative importance of CO2-fertilization, climate warming, nitrogen deposition and land use change on the global terrestrial carbon uptake in the historical period. Clim. Dyn. 2016, 47, 173–190. [Google Scholar] [CrossRef]
  9. Janssens, I.A.; Dieleman, W.; Luyssaert, S.; Subke, J.-A.; Reichstein, M.; Ceulemans, R.; Ciais, P.; Dolman, A.J.; Grace, J.; Matteucci, G. Reduction of forest soil respiration in response to nitrogen deposition. Nat. Geosci. 2010, 3, 315–322. [Google Scholar] [CrossRef]
  10. Liu, L.L.; Greaver, T.L. A global perspective on belowground carbon dynamics under nitrogen enrichment. Ecol. Lett. 2010, 13, 819–828. [Google Scholar] [CrossRef] [PubMed]
  11. Zhong, Y.Q.W.; Yan, W.M.; Shangguan, Z.Q. The effects of nitrogen enrichment on soil CO2 fluxes depending on temperature and soil properties. Glob. Ecol. Biogeogr. 2016, 25, 475–488. [Google Scholar] [CrossRef]
  12. Du, E.Z.; de Vries, W.; Han, W.X.; Liu, X.J.; Yan, Z.B.; Jiang, Y. Imbalanced phosphorus and nitrogen deposition in China’s forests. Atmos. Chem. Phys. 2016, 16, 8571–8579. [Google Scholar] [CrossRef] [Green Version]
  13. Chen, P.; Zhao, B.; Yan, Z.C.; Yang, L.; Zhao, X.H.; Zhang, C.Y. Short-term response of soil respiration to simulated nitrogen deposition in a Pinus tabulaeformis plantation on Taiyue Mountain, China. Acta Ecol. Sin. 2018, 38, 8184–8193. [Google Scholar] [CrossRef]
  14. Li, C.B.; Peng, Y.F.; Nie, X.Q.; Yang, Y.H.; Yang, L.C.; Li, F.; Fang, K.; Xiao, Y.M.; Zhou, G.Y. Differential responses of heterotrophic and autotrophic respiration to nitrogen addition and precipitation changes in a Tibetan alpine steppe. Sci. Rep. 2018, 8, 16546. [Google Scholar] [CrossRef] [Green Version]
  15. Xu, L.; Shi, Y.J.; Fang, H.Y.; Zhou, G.M.; Xu, X.J.; Zhou, Y.F.; Tao, J.X.; Ji, B.Y.; Xu, J.; Li, C.; et al. Vegetation carbon stocks driven by canopy density and forest age in subtropical forest ecosystems. Sci. Total Environ. 2018, 631–632, 619–626. [Google Scholar] [CrossRef]
  16. Yu, S.Q.; Chen, Y.Q.; Zhao, J.; Fu, S.L.; Li, Z.A.; Xia, H.P.; Zhou, L.X. Temperature sensitivity of total soil respiration and its heterotrophic and autotrophic components in six vegetation types of subtropical China. Sci. Total Environ. 2017, 607–608, 160–167. [Google Scholar] [CrossRef] [PubMed]
  17. Fang, C.; Li, F.M.; Pei, J.Y.; Ren, J.; Gong, Y.H.; Yuan, Z.Q.; Ke, W.B.; Zheng, Y.; Bai, X.K.; Ye, J.-S. Impacts of warming and nitrogen addition on soil autotrophic and heterotrophic respiration in a semi-arid environment. Agric. For. Meteorol. 2017, 248, 449–457. [Google Scholar] [CrossRef]
  18. Peng, Y.F.; Li, F.; Zhou, G.Y.; Fang, K.; Zhang, D.Y.; Li, C.B.; Yang, G.B.; Wang, G.Q.; Wang, J.; Mohammat, A.; et al. Nonlinear response of soil respiration to increasing nitrogen additions in a Tibetan alpine steppe. Environ. Res. Lett. 2017, 12, 024018. [Google Scholar] [CrossRef]
  19. Spohn, M.; Pötsch, E.M.; Eichorst, S.A.; Woebken, D.; Wanek, W.; Richter, A. Soil microbial carbon use efficiency and biomass turnover in a long-term fertilization experiment in a temperate grassland. Soil Biol. Biochem. 2016, 97, 168–175. [Google Scholar] [CrossRef]
  20. Ma, S.H.; Chen, G.P.; Tian, D.; Du, E.Z.; Xiao, W.; Jiang, L.; Zhou, Z.; Zhu, J.L.; He, H.B.; Zhu, B.; et al. Effects of seven-year nitrogen and phosphorus additions on soil microbial community structures and residues in a tropical forest in Hainan Island, China. Geoderma 2020, 361, 114034. [Google Scholar] [CrossRef]
  21. Peng, Y.F.; Guo, D.L.; Yang, Y.H. Global patterns of root dynamics under nitrogen enrichment. Glob. Ecol. Biogeogr. 2016, 26, 102–114. [Google Scholar] [CrossRef]
  22. Tu, L.H.; Dai, H.Z.; Hu, T.X.; Zhang, J.; Luo, S.H. Effect of simulated nitrogen deposition on soil respiration of poly-green hybrid bamboo forest in Yuping area, west China. Chin. J. Appl. Ecol. 2011, 22, 829–836. [Google Scholar] [CrossRef]
  23. Zhang, C.P.; Niu, D.C.; Hall, S.J.; Wen, H.Y.; Li, X.D.; Fu, H.; Wan, C.G.; Elser, J.J. Effects of simulated nitrogen deposition on soil respiration components and their temperature sensitivities in a semiarid grassland. Soil Biol. Biochem. 2014, 75, 113–123. [Google Scholar] [CrossRef]
  24. Li, X.D.; Zhang, C.Q.; Fu, H.; Guo, D.; Song, X.R.; Wan, C.Q.; Ren, J.Z. Grazing exclusion alters soil microbial respiration, root respiration and the soil carbon balance in grasslands of the Loess Plateau, northern China. Soil Sci. Plant Nutr. 2013, 59, 877–887. [Google Scholar] [CrossRef] [Green Version]
  25. Riggs, C.E.; Hobbie, S.E.; Bach, E.M.; Hofmockel, K.S.; Kazanski, C.E. Nitrogen addition changes grassland soil organic matter decomposition. Biogeochemistry 2015, 125, 203–219. [Google Scholar] [CrossRef]
  26. Zeng, W.J.; Zhang, J.Y.; Wang, W. Strong root respiration response to nitrogen and phosphorus addition in nitrogen-limited temperate forests. Sci. Total Environ. 2018, 642, 646–655. [Google Scholar] [CrossRef] [PubMed]
  27. Wang, Q.K.; Li, Y.P.; Zhang, F.Y.; He, T.X. Short-term nitrogen fertilization decrease root and microbial respiration in a young Cunninghamia lanceolata plantation. J. Plant Ecol. 2015, 39, 1166–1175. [Google Scholar] [CrossRef] [Green Version]
  28. Wang, Q.K.; Zhang, W.D.; Sun, T.; Chen, L.C.; Pang, X.Y.; Wang, Y.P.; Xiao, F.M. N and P fertilization reduced soil autotrophic and heterotrophic respiration in a young Cunninghamia lanceolata forest. Agric. For. Meteorol. 2017, 232, 66–73. [Google Scholar] [CrossRef]
  29. Li, J.M.; Ding, W.X.; Cai, Z.C. Effects of nitrogen fertilization on soil respiration during maize growth season. Chin. J. Appl. Ecol. 2010, 21, 2025–2030. [Google Scholar] [CrossRef]
  30. Tomotsune, M.; Yoshitake, S.; Watanabe, S.; Hiroshi, K. Separation of root and heterotrophic respiration within soil respiration by trenching, root biomass regression, and root excising methods in a cool-temperate deciduous forest in Japan. Ecol. Res. 2013, 28, 259–269. [Google Scholar] [CrossRef]
  31. Fu, R.X.; Xu, X.N.; Yu, Y.C.; Zhang, Y.B.; Sun, Z.L.; Tao, X. Forest soil respiration response to increasing nitrogen deposition along an urban-rural gradient. Glob. Ecol. Conserv. 2021, 27, e01575. [Google Scholar] [CrossRef]
  32. Zhang, X.Y.; Li, Y.; Ning, C.; Zheng, W.; Zhao, D.Y.; Li, Z.Q.; Yan, W.D. Litter Management as a Key Factor Relieves Soil Respiration Decay in an Urban-Adjacent Camphor Forest under a Short-Term Nitrogen Increment. Forests 2020, 11, 216. [Google Scholar] [CrossRef] [Green Version]
  33. Goncharova, O.; Matyshak, G.; Udovenko, M.; Semenyuk, O.; Epstein, H.; Bobrik, A. Temporal dynamics, drivers, and components of soil respiration in urban forest ecosystems. Catena 2020, 185, 104299. [Google Scholar] [CrossRef]
  34. Tian, P.; Liu, S.G.; Zhao, X.C.; Sun, Z.L.; Yao, X.; Niu, S.L.; Crowther, T.W.; Wang, Q.K. Past climate conditions predict the influence of nitrogen enrichment on the temperature sensitivity of soil respiration. Commun. Earth Environ. 2021, 2, 251. [Google Scholar] [CrossRef]
  35. Chen, Y.J.; Day, S.D.; Shrestha, R.K.; Strahm, B.D.; Wiseman, P.E. Influence of urban land development and soil rehabilitation on soil-atmosphere greenhouse gas fluxes. Geoderma 2014, 226–227, 348–353. [Google Scholar] [CrossRef]
  36. Du, E.Z.; Fenn, M.E.; De Vries, W.; Ok, Y.S. Atmospheric nitrogen deposition to global forests: Status, impacts and management options. Environ. Pollut. 2019, 250, 1044–1048. [Google Scholar] [CrossRef]
  37. Shchepeleva, A.S.; Vasenev, V.I.; Mazirov, I.M.; Vasenev, I.I.; Prokhorov, I.S.; Gosse, D.D. Changes of soil organic carbon stocks and CO2 emissions at the early stages of urban turf grasses’ development. Urban Ecosyst. 2017, 20, 309–321. [Google Scholar] [CrossRef]
  38. Dai, Y.Z.; Wang, H.L.; Chen, M.Y.; Wang, D.D.; Cao, X.Q.; Chu, B.Y.; Xu, X.N. Response of soil bacterial communities to nitrogen and phosphorus additions in an age-sequence of subtropical forests. iForest 2021, 14, 71–79. [Google Scholar] [CrossRef]
  39. Gao, Q.; Hasselquist, N.J.; Palmroth, S.; Zheng, Z.M.; You, W.H. Short-term response of soil respiration to nitrogen fertilization in a subtropical evergreen forest. Soil Biol. Biochem. 2014, 76, 297–300. [Google Scholar] [CrossRef]
  40. Liu, X.J.; Zhang, Y.; Han, W.X.; Tang, A.; Shen, J.L.; Cui, Z.L.; Vitousek, P.; Erisman, J.W.; Goulding, K.; Christie, P.; et al. Enhanced nitrogen deposition over China. Nature 2013, 494, 459–462. [Google Scholar] [CrossRef] [PubMed]
  41. Yang, D.W.; Xu, W.; Tang, A.H.; Lu, L.; Liu, X.J. Inorganic nitrogen wet deposition in eastern China Comparison of different land use-based monitoring sites in north and south regions. Chin. J. Appl. Ecol. 2016, 27, 3205–3212. [Google Scholar] [CrossRef]
  42. Johnson, D.; Geisinger, D.; Walker, R.; Newman, J.; Vose, J.; Elliot, K.; Ball, T. Soil pCO2, soil respiration, and root activity in CO2 fumigated and nitrogen-fertilized ponderosa pine. Plant Soil 1994, 165, 129–138. [Google Scholar] [CrossRef]
  43. Zhang, P.J.; Li, L.Q.; Pan, G.X.; Ren, J.C. Soil quality changes in land degradation as indicated by soil chemical, biochemical and microbiological properties in a karst area of southwest Guizhou, China. Environ. Geol. 2006, 51, 609–619. [Google Scholar] [CrossRef]
  44. Liu, S.; Wang, C. Spatio-temporal patterns of soil microbial biomass carbon and nitrogen in five temperate forest ecosystems. Acta. Ecol. Sin. 2010, 30, 3135–3143. [Google Scholar]
  45. Breiman, L. Random forests. Mach. Learn. 2001, 45, 5–32. [Google Scholar] [CrossRef] [Green Version]
  46. R Core Team. R: A Language and Environment for Statistical Computing; R Foundation for Statistical Computing: Vienna, Austria, 2015; Available online: https://www.R-project.org/ (accessed on 5 March 2021).
  47. Archer, E. Estimate Permutation p-Values for Importance Metrics, R Package Version 1.5.2; Robert Gentleman; MA, USA; 2013. Available online: https://cran.r-project.org/web/packages/rfPermute/index.html/ (accessed on 8 April 2022).
  48. Liu, H.; Zang, R.G.; Chen, H.Y.H. Effects of grazing on photosynthetic features and soil respiration of rangelands in the Tianshan Mountains of Northwest China. Sci. Rep. 2016, 6, 30087. [Google Scholar] [CrossRef] [Green Version]
  49. Bowden, R.D.; Davidson, E.D.; Savage, K.; Chris, A.; Paul, S. Chronic nitrogen additions reduce total soil respiration and microbial respiration intemperate forest soils at the Harvard Forest. For. Ecol. Manag. 2004, 196, 43–56. [Google Scholar] [CrossRef]
  50. Yan, T.; Qu, T.T.; Sun, Z.Z.; Dybzinski, R.; Chen, A.P.; Yao, X.C.; Zeng, H.; Piao, S.L. Negative effect of nitrogen addition on soil respiration dependent on stand age: Evidence from a 7-year field study of larch plantations in northern China. Agric. For. Meteorol. 2018, 262, 24–33. [Google Scholar] [CrossRef]
  51. Shao, R.X.; Deng, L.; Yang, Q.H.; Shangguan, Z.P. Nitrogen fertilization increase soil carbon dioxide efflux of winter wheat field: A case study in Northwest China. Soil Tillage Res. 2014, 143, 164–171. [Google Scholar] [CrossRef]
  52. Vicca, S.; Bahn, M.; Estiarte, M.; van Loon, E.E.; Vargas, R.; Alberti, G.; Janssens, I.A. Can current moisture responses predict soil CO2 efflux under altered precipitation regimes? A synthesis of manipulation experiments. Biogeosciences 2014, 11, 3307–3308. [Google Scholar] [CrossRef] [Green Version]
  53. Xu, W.H.; Wan, S.Q. Water-and plant-mediated responses of soil respiration to topography, fire, and nitrogen fertilization in a semiarid grassland in northern China. Soil Biol. Biochem. 2008, 40, 679–687. [Google Scholar] [CrossRef]
  54. Chen, D.; Li, J.J.; Lan, Z.C.; Hu, S.J.; Bai, Y.F.; Niu, S.L. Soil acidification exerts a greater control on soil respiration than soil nitrogen availability in grasslands subjected to long-term nitrogen enrichment. Funct. Ecol. 2016, 30, 658–669. [Google Scholar] [CrossRef]
  55. Wang, J.S.; Song, B.; Ma, F.F.; Tian, D.S.; Li, Y.; Yan, T.; Quan, Q.; Zhang, F.Y.; Li, Z.L.; Wang, B.X.; et al. Nitrogen addition reduces soil respiration but increases the relative contribution of heterotrophic component in an alpine meadow. Funct. Ecol. 2019, 33, 2239–2253. [Google Scholar] [CrossRef]
  56. Tu, L.H.; Hu, T.X.; Zhang, J.; Li, X.W.; Hu, H.L.; Liu, L.; Xiao, Y.L. Nitrogen addition stimulates different components of soil respiration in a subtropical bamboo ecosystem. Soil Biol. Biochem. 2013, 58, 255–264. [Google Scholar] [CrossRef]
  57. Baldos, A.P.; Corre, M.D.; Veldkamp, E. Response of N cycling to nutrient inputs in forest soils across a 1000–3000 m elevation gradient in the Ecuadorian Andes. Ecology 2015, 96, 749–761. [Google Scholar] [CrossRef]
  58. Ma, Y.C.; Zhu, B.; Sun, Z.Z.; Zhao, C.; Yang, Y.; Piao, S.L. The effects of simulated nitrogen deposition on extracellular enzyme activities of litter and soil among different-aged stands of larch. J. Plant Ecol. 2014, 7, 240–249. [Google Scholar] [CrossRef] [Green Version]
  59. Liu, Y.; Xu, L.; Zheng, S.; Chen, Z.; Cao, Y.Q.; Wen, X.F.; He, N.P. Temperature sensitivity of soil microbial respiration in soils with lower substrate availability is enhanced more by labile carbon input. Soil Biol. Biochem. 2021, 154, 108148. [Google Scholar] [CrossRef]
  60. Yang, L.; Wang, J.S.; Zhao, B.; Zhao, X.H. Effects of Long-Term Nitrogen Application on Soil Respiration and Its Components in Warm-Temperate Forest of Pinus tabulaeformis. Sci. Silvae Sin. 2021, 57, 1–11. [Google Scholar] [CrossRef]
  61. Song, X.Z.; Zhou, G.M.; Gu, H.H.; Qi, L.H. Management practices amplify the effects of N deposition on leaf litter decomposition of the Moso bamboo forest. Plant Soil 2015, 395, 391–400. [Google Scholar] [CrossRef] [Green Version]
  62. Delgado-Baquerizo, M.; Eldridge, D.J.; Ochoa, V.; Gozalo, B.; Singh, B.K.; Maestre, F.T. Soil microbial communities drive the resistance of ecosystem multifunctionality to global change in drylands across the globe. Ecol. Lett. 2017, 20, 1295–1305. [Google Scholar] [CrossRef] [Green Version]
  63. Zhang, J.B.; Lv, J.H.; Li, Q.; Ying, Y.Q.; Peng, C.H.; Song, X.Z. Effects of nitrogen deposition and management practices on leaf litterfall and N and P return in a Moso bamboo forest. Biogeochemistry 2017, 134, 115–124. [Google Scholar] [CrossRef]
  64. Cui, J.; Wang, J.J.; Xu, J.; Xu, C.H.; Xu, X.N. Changes in soil bacterial communities in an evergreen broad-leaved forest in east China following 4 years of nitrogen addition. J. Soils Sediments 2017, 17, 2156–2164. [Google Scholar] [CrossRef]
  65. He, Z.; Xiong, P.F.; Jia, Z.; Zhou, J.J.; Niu, F.R.; Xu, B.C. Responses of soil respiration to rainfall depth and frequency in semiarid grassland communities. Ecohydrology 2021, 14, 2326. [Google Scholar] [CrossRef]
  66. Fernández-Alonso, M.; Díaz-Pinés, E.; Rubio, A. Drivers of soil respiration in response to nitrogen addition in a Mediterranean mountain forest. Biogeochemistry 2021, 155, 305–321. [Google Scholar] [CrossRef]
  67. Wang, Y.; Li, X.Y.; Zhang, C.C.; Wu, X.C.; Du, E.Z.; Wu, H.W.; Yang, X.F.; Wang, P.; Bai, Y.; Wu, Y.N.; et al. Responses of soil respiration to rainfall addition in a desert ecosystem: Linking physiological activities and rainfall pattern. Sci. Total Environ. 2019, 650, 3007–3016. [Google Scholar] [CrossRef]
  68. Peng, Q.; Dong, Y.S.; Qi, Y.C.; Xiao, S.S.; He, Y.T.; Ma, T. Effects of nitrogen fertilization on soil respiration in temperate grassland in Inner Mongolia, China. Environ. Earth Sci. 2011, 62, 1163–1171. [Google Scholar] [CrossRef]
  69. Boone, R.D.; Nadelhoffer, K.J.; Canary, J.D.; Kaye, J.P. Roots exert a strong influence on the temperature sensitivity of soil respiration. Nature 1998, 396, 570–572. [Google Scholar] [CrossRef]
  70. Xia, M.X.; Talhelm, A.F.; Pregitzer, K.S. Chronic nitrogen deposition influences the chemical dynamics of leaf litter and fine roots during decomposition. Soil Biol. Biochem. 2017, 112, 24–34. [Google Scholar] [CrossRef]
Figure 1. Study area in Hefei City, Anhui Province, China: (a) overview of the periurban forest; (b) overview of the outskirt forest; (c) schematic of the experimental plots (d).
Forests 13 02064 g001
Figure 2. Seasonal dynamics of soil respiration (Rs), autotrophic respiration (Ra), and heterotrophic respiration (Rh) during the study period. Data are presented in terms of mean ± standard deviation values. S1, mid-growing season; S2, late growing season; S3, non-growing season; S4, early growing season. CK, LN, and HN represent control, low, and high nitrogen applications, respectively.
Forests 13 02064 g002
Figure 3. Annual mean values of soil respiration (Rs), autotrophic respiration (Ra), and heterotrophic respiration (Rh) for N application at different rates. Data are presented in terms of mean ± standard deviation values. Different uppercase letters indicate significant differences across years for the same application rate, whereas different lowercase letters indicate significant differences across N application rates in the same year (p < 0.05). CK, LN, and HN represent control, low, and high nitrogen applications, respectively.
Forests 13 02064 g003
Figure 4. Gradual changes in the ratio of autotrophic respiration to soil respiration (Ra/Rs). Red lines indicate fitted regression, and light pink areas around the regression lines indicate 95% confidence intervals. Data are presented in terms of mean ± standard deviation values. CK, LN, and HN represent control, low, and high nitrogen applications, respectively.
Forests 13 02064 g004
Figure 5. Responses of soil moisture (SW, a), total dissolved nitrogen (TDN, b), ammonium nitrogen (NH4+-N, c), and ammonium nitrogen (NO3-N, d) to nitrogen application rates during the study period. Error bars represent 10th and 90th percentiles. Black lines and white dots within the boxplots indicate median and mean values, respectively. Different letters on top of the error bars denote significant differences among nitrogen application rates at the 0.05 level. CK, LN, and HN represent control, low, and high nitrogen applications, respectively.
Forests 13 02064 g005
Figure 6. Bar chart showing the relative contributions of the factors influencing soil respiration and its components. The importance of predictor variables was evaluated using the percentage increase in the mean squared error (%) calculated using a total of 100 runs of the random forest model. ST, soil temperature; SW, soil moisture; NH4+-N, ammonium nitrogen; NO3-N, nitrate nitrogen; TDN, total dissolved nitrogen; TN, total nitrogen; TC, total carbon; C:N, carbon:nitrogen; MBC, microbial biomass carbon; MBN, microbial biomass nitrogen. ** p < 0.01, * p < 0.05; ns indicates p > 0.05.
Forests 13 02064 g006
Figure 7. Results of the structural equation modeling performed to evaluate the direct and indirect effects of the factors influencing soil respiration and its components during the study period. Responses of soil respiration and its components to soil factors in years 1 (a), 2 (b), and 3 (c). The blue and red arrows denote significant positive and negative correlations (p < 0.05), respectively. The black lines indicate nonsignificant correlations (p > 0.05). Numbers on the arrows represent standardized path coefficients, and the widths of the arrows are proportional to the strength of the path coefficients. ST, soil temperature; SW, soil moisture; NH4+-N, ammonium nitrogen; NO3-N, nitrate nitrogen; MBN, microbial biomass nitrogen. *** p < 0.001, ** p < 0.01, * p < 0.05.
Forests 13 02064 g007
Table 1. Basic features of the experimental plots.
SiteAltitude
(m)
Slope
(degree)
Canopy Closure
(%)
Tree Height
(m)
DBH
(cm)
Age
(year)
Periurban forest12012.260.6519.7 ± 6.7622.54 ± 11.97120
Outskirt forest15817.510.6914.9 ± 1.2832.56 ± 8.08135
DBH, diameter at breast height.
Table 2. Results (F-values) of the repeated-measures analysis of variance performed to evaluate the effects of season or year, nitrogen application, and their interaction on soil respiration and its components.
YearFactorRsRhRa
First yearS117.14 ***69.08 ***48.02 ***
N2.62 *3.59 *0.36
S × N0.871.320.65
Second yearS25.31 ***23.57 ***6.79 ***
N2.4313.61 ***7.53 ***
S × N6.26 ***12.30 ***3.20**
Third yearS11.90 ***63.44 ***19.72 ***
N2.88 *10.98 ***3.21 *
S × N6.25 ***14.83 ***2.39
Whole study periodY4.23 **35.65 ***25.88 ***
N6.16 **4.93 **4.01 *
Y × N1.422.98 **6.00 ***
Rs, soil respiration; Ra, autotrophic respiration; Rh, heterotrophic respiration; S, season; Y, year; N, nitrogen application. * p < 0.05, ** p < 0.01, *** p < 0.001.
Table 3. Summary (F-values) of the generalized linear mixed-effect model used to evaluate the effects of year, nitrogen application (N), and their interactive effect on soil property and microbial biomass during the study period.
VariablesYearNYear × N
Soil physical properties
ST (°C)83.12 ***1.334.23
SW (%)36.47 ***11.51 **15.97 *
pH55.19 ***0.9610.74
Soil chemical properties
NH4+-N (mg/kg)14.15 ***16.00 **9.38
NO3-N (mg/kg)34.18 ***26.63 ***10.74
TDN (mg/kg)18.78 ***9.79 **5.62
TN (g/kg)60.84 ***4.041.46
TC (g/kg)23.29 ***2.261.61
C:N85.68 ***0.300.74
Soil microbial biomass indexes
MBC (mg/kg)10.79 *0.082.84
MBN (mg/kg)39.83 ***0.804.49
ST, soil temperature; SW, soil moisture; NH4+-N, ammonium nitrogen; NO3-N, nitrate nitrogen; TDN, total dissolved nitrogen; TN, total nitrogen; TC, total carbon; C:N, carbon:nitrogen; MBC, microbial biomass carbon; MBN, microbial biomass nitrogen. * p < 0.05, ** p < 0.01, *** p < 0.001.
Publisher’s Note: MDPI stays neutral with regard to jurisdictional claims in published maps and institutional affiliations.

