Abstract
The cold desert ecosystem of the north-western Himalaya in India’s is considered to be the most vulnerable region to climate change. In this region, Juniperus macropoda Boisser grows across an altitudinal gradient and is highly sensitive to biotic, physiographic, and climatic factors. Keeping this in view, the present study aimed at ascertaining the response of Juniperus macropoda to changing climatic conditions. To achieve the target of the study, the area (elevation ranges from 3525 to 4150 m asl) was divided into thirteen elevation ranges in the cold desert of Lahaul valley (Himachal Pradesh). The NDVI change detection map from 1994–2017 revealed an increase in the area under the vegetation in the NDVI range of 0–0.15 (240%) and 0.15–0.30 (32%), which indicated the emergence of grasses and new recruits in the area. An increase in the minimum and maximum temperature during monsoon and post-monsoon season correlated positively with the emergence of the recruits in a significant manner. Furthermore, a decline in rainfall during the monsoon period was also recorded which bears a significant positive correlation with the establishment of recruits. However, the increase in the precipitation during winter resulted in a positive effect on the emergence of recruits. The biophysical parameters, like average height, diameter as well as the average age of the dominant trees showed a declining trend with the elevation. However, the age histogram revealed that the majority of the establishment occurred around 1900 and between 1975–2010. The tree ring analysis of J. macropoda revealed that the species is shifting upward at a rate of 3.91 m year−1. Besides this, the area is experiencing the impact of climate change resulting in an increase in the area under vegetation and migration towards the higher elevation, and many species of lichens were also found to invade the bare rock.
1. Introduction
Over the last decade, global warming has become one of the most widely debated and researched topics. The past three and half decades have seen a significant rise in temperature, recording five warmest years since 2010. The year 2016 and 2020 set a new record for global average surface temperature [1]. Over the period of 1982–2006, the Himalayan ecosystem experienced a warming of 1.5 °C at an average rate of 0.06 °C year−1 [2].
Climate change has a wide range of effects, some of which are related to vegetation. The high-elevation ecosystems of the Himalayas are among the most vulnerable geographical areas on the planet, and they can be used to detect patterns of climate change on a regional scale [3]. Alpine treeline dynamics, as a core component of mountain landscape transformations, are a critical component for detecting climate-dependent ecological processes under projected global warming scenarios [4]. Furthermore, the impact of climate change can be more or less severe in high mountainous ecosystems, where tree lines are assumed to be sensitive to changes in the climate and thus useful indicators of climate change [5,6].
The Himalayas have the most extensive bioclimatic gradient in the world, and the present study is mainly focused on tree species. Trees are influenced by climate change to a greater degree than herbaceous species [7]. A study of the adaptation of plants to changes in climate revealed that trees and shrubs adapted 2–10 times slower than herbaceous plants. The longer reproductive cycle and a lower rate of genetic variation in woody plants are the main reasons for their slow adaptation to changes in climate [8]. Altitude affects the growth and development of forest stands, higher altitudes generally show low air temperature, extreme climates, strong winds, and higher rates of local warming [9,10,11,12]. Altitudinal gradients are ideal places to examine the different responses of tree growth to climate change across environmental gradients. The air temperature falls by an average of 0.6 °C per 100 m along elevation gradients [13]. Tree height and stem density change markedly with altitude and latitude [14,15,16]. Height and diameter at breast height (DBH) are two key factors of tree size, closely related to tree age and productivity. Thus, height plays a critical role in affecting the growth response to climate change.
J. macropoda Bossier, also known as the Himalayan pencil cedar, is an ecologically and economically important tree species of the cold desert ecosystem of the inner Himalayan region [17,18]. This species is found mainly in association with Caragana spp., Rhododendron companulatum D.Don, Rhododendron wightii Hook.f., Salix spp., Myricaria spp., Hippophae rhamnoides L., and Pinus wallichiana A.B.Jacks [19]. At present, species all over the world are severely degraded due to human interference, which has resulted in the degradation of their natural habitats, combined with slow growth habits and poor natural regeneration [20,21]. Furthermore, junipers produce seeds with deep dormancy [20], which adversely affects their artificial and natural regeneration programs. As a result, juniper forests require well-coordinated management programs for the restoration of pure and mixed stands. The Himalayan region is comprised of understudied tree line habitat, which is likely to respond to global warming. Due to the unique features of Himalayas [22], tree line studies need to be carried out in depth. Some useful studies on the impact of recent climate change on alpine tree species have been conducted in the Nepal Himalaya [23,24,25,26,27]; however, more research is needed to focus on this species in response to climate change, particularly in the Indian Himalayan region. The influence of climate change on alpine trees can be complicated, as different combinations of alterations in temperature and precipitation can result in different impacts and different tree species can respond differently to climate change [15]. Hitherto, no study has taken place in J. macropoda on the impact of climate change. So, the present study was carried out to address the following hypothesis: (i) The change in the upper limit of J. macropoda, and the rate of upward shift (ii)the change in NDVI value of the area concerning climate change Therefore, the objectives of the present study was to study the response of J. macropoda tree line ecotone to recent climate change; to study the tree line dynamics in Lahaul valley; to analyze the rate of an upward shift of J. macropoda in the treeline ecotone and; to analyze the change in vegetation by NDVI.
2. Material and Methods
2.1. Study Area
The J. macropoda forest stand, which is classified under group 13 (Himalayan dry temperate forests) as type 13C5 (West Himalayan dry juniper forest) [28] (Champion & Seth 1968) is located in Lahaul forest Division at a latitudinal and longitudinal range of 32°34′–32°43′ N and 77°0′–77°12′ E, respectively in the southern aspect (Figure 1). The site is characterized by silty clay loam and alkaline with an optimum calcium status, soil thickness ranging from 0.10 to 1.0 m, and a large number of gravels.
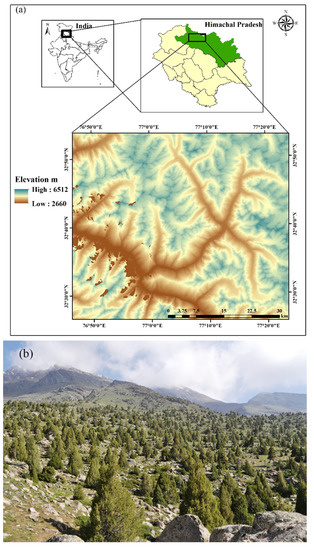
Figure 1.
(a) Map of the study area and (b) Juniperus macropoda treeline site at Lahaul valley of north-western Himalaya.
2.2. Image Analysis
Two Landsat datasets (i) 12 September 1994 (Landsat scene ID = (LT51470371994264ISP01) of Landsat 5 TM (Thematic Mapper) and (ii) 20 September 2017 (Landsat scene ID = LC81470372017263LGN00) of Landsat 8 OLI (Operational Land Imager) of same path and row (147/37) procured from the USGS Earth explorer (https://earthexplorer.usgs.gov/ accessed on 24 June 2021) for the change detection of vegetation cover of the study area. The vegetation index namely NDVI (Normalized Difference Vegetation Index) [NDVI = (NIR − Red)/(NIR + Red)] whose value ranges from −1 to +1 used for the estimation of the vegetation and non-vegetation site in the study area as well as the change in the NDVI values to depict the change. The ERDAS IMAGINE 2015 and ArcMap 10.4.1 software were used to process the datasets and preparation of the map. Additionally, the fluctuation in the NDVI value from 1994 to 2017 for the month of June was calculated using the Landsat 5, 7, and 8 spatial datasets through the Google Earth Engine interface
2.3. Sampling Procedure
For investigating tree line dynamics and the rate of shift, a transect walk was conducted towards the tree line until the last individual on the slope at its highest elevation was reached. A preliminary observation along the altitudinal gradient was conducted to select the dominant trees in the tree line area. Singh et al. [29] methodology was adopted for assessing the upward shift of J. macropoda. This study was conducted between 3500 m asl and 4150 m asl, with elevation differences of 50 m. The baseline elevation was set at 3500 m a msl because this elevation appeared to be the ecotone region or the region where the tree line begins to appear. In comparison to lower elevation ranges, the vegetation in this highly sensitive ecotone region changes. In each plot along the elevation gradient, three dominant trees (disease-free and with a good DBH based on ocular estimation) were chosen to study the rate of shift by measuring age, height, and DBH.
For the estimation of the age of J. macropoda Pressler’s increment borer was used. The core sample containing growth rings was extracted with the help of an instrument by boring the trees at breast height (1.37 m). The ages of the trees were calculated by counting the number of growth rings on the wood core sample (Figure 2b) at the core height and by adding the years required for the tree to reach that height, whereas the ages of seedlings and saplings were counted by extracting cross-sections (Figure 2a) at the collar point. Ring counting was done visually using the alignment technique to remove the false growth rings and identify the missing rings. However, such cores were negligible.
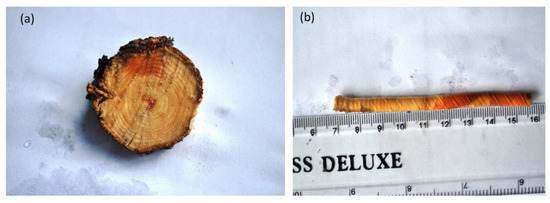
Figure 2.
(a) Tree cross-section section showing distinct growth rings, (b) Wood core sample showing distinct growth rings.
The rate of the shift in 10 years was calculated by the following equation:
where;
- Otue = Position of the oldest tree in the upper elevation
- Otle = Position of oldest tree in the lower elevation
The rate of the vegetation shift was related to temperature and precipitation in recent years. The rise in temperature over these years was associated with the rate at which the vegetation shifted to higher elevations. The rate of the shift is expressed in terms of how many metres the vegetation has shifted during the past 10 years. The temperature rose during the period studied, which may be related to the rate of the shift [29]. If we found individuals belonging to a particular age class with a uniform distribution throughout a plot, then we concluded that the vegetation had shifted towards a higher elevation.
2.4. Climatic Trends of the Study Area
The climatic data in respect of minimum temperature, maximum temperature, and rainfall (1970–2017) was collected from the IMD (Indian meteorological department) weather station located within 20 km of the study area and represented as average/total and four prevalent seasons viz., winter, post-monsoon, monsoon and pre-monsoon season. The Mann–Kendall statistics and Sen’s slope were employed using the XLSTAT 2021.3.1 [30] to examine the magnitude of the increase or decrease of different climatic variable. The long-term climatic data indicated an increasing trend of the pre-monsoon and post-monsoon season maximum temperature with a magnitude (Sen’s slope) of 0.006 and 0.012, respectively (Figure 3). However, in winter and monsoon season maximum temperature has zero and negative Sen’s slope. The contrary, minimum temperature in all four seasons had an increasing trend, particularly, with a magnitude of 0.016 in winter, 0.014 in pre-monsoon season, 0.010 in the monsoon season and 0.027 in post-monsoon season. Similarly, the average annual temperature of the study area increased with a magnitude of 0.015 (Figure 4). Simultaneously, both seasonal and total rainfall has been rising from 1970 to 2017. Sen’s slopes for winter, pre-monsoon, monsoon, post-monsoon season, and total rainfall were 0.075, 0.097, 0.103, 0.106, and 0.479, respectively.
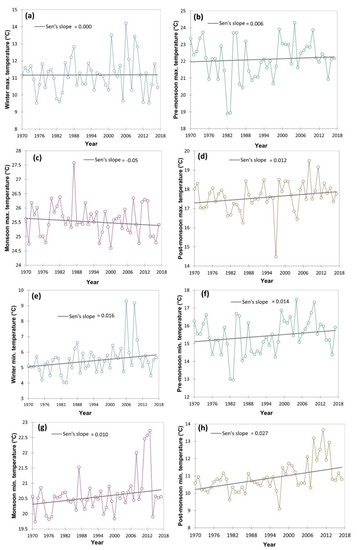
Figure 3.
Time series trend analysis of different temperature (both maximum and minimum) attribute variation from 1970–2017 including four different seasons of the year using Mann–Kendall statistics and Sen’s slope. Here: (a) winter maximum temperature (°C); (b) pre-monsoon maximum temperature (°C); (c) monsoon maximum temperature (°C); (d) post-monsoon maximum temperature (°C); (e) winter minimum temperature (°C); (f) pre-monsoon minimum temperature (°C); (g) monsoon minimum temperature (°C); (h) post-monsoon minimum temperature (°C).
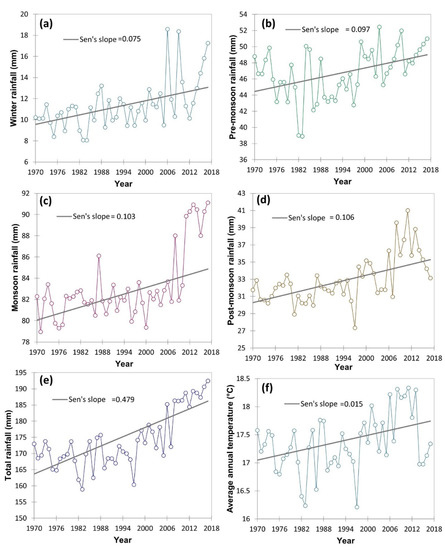
Figure 4.
Time series trend analysis of different rainfall attribute variations including average annual temperature (°C) from 1970–2017 including four different seasons of the year using Mann–Kendall statistics and Sen’s slope. Here: (a) winter rainfall (mm); (b) pre-monsoon rainfall (mm); (c) monsoon rainfall (mm); (d) post-monsoon rainfall (mm); (e) total rainfall (mm); (f) average annual temperature (°C).
2.5. Statistical Analysis
We used the best-fit regression equation (adjusted R2) to describe the relationship between various stand growth parameters by considering height, diameter, and age as the dependent variable while, altitude as an independent variable. The Pearson correlation analysis were performed to determine the climatic influence of each variable on the emergence of the recruits [31].
3. Results and Discussion
3.1. Vegetation Change in the Lahaul Valley
The change in the vegetation can be detected by monitoring the vegetation, studying the recruitment pattern in the laid-out sample plots, and reconstructing the stand age structure, through the use of the remote sensing and GIS technique [32]. The use of satellite images obtained through remote sensing satellite helps in overcoming problems imposed to direct observation of the inaccessible site [33]. The high value of NDVI indicates high vegetation density while the lower NDVI value shows the low density of vegetation. Figure 4 shows that the range of NDVI values in the 1994 image varied from −0.38 to 0.54 and in the 2017 image from −0.38 to 0.42, which indicate that from the period 1994–2017, the vegetation density decreases over the years. However, in recent years, the vegetation cover had increased and the maximum increase is recorded in the NDVI range of 0–0.15 (240%) and 0.15–0.30 (32%) (Table 1, Figure 5). It was also corroborated by the NDVI analysis for the month of June from 1994–2017 (Figure 6) where a shift in the NDVI values was recorded from 0–0.1 to 0.1–0.15 in the recent years (2014–2017), which indicate that the grasses and new recruits are emerging in the area Figure 7.

Table 1.
The NDVI value change matrix from 1994 to 2017 in the study area.
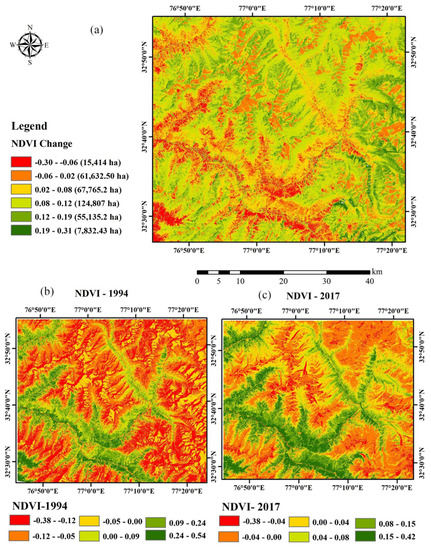
Figure 5.
Diagram showing NDVI change detection map (a) and NDVI map of 1994 (b) and 2017 (c). In (a), the redder the color, the larger the decrease of NDVI. Similarly, the greener the color, the larger the greenness change.
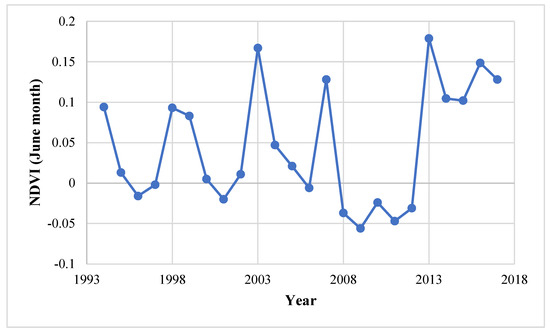
Figure 6.
NDVI trend analysis (July month) over a period of 1994–2017.
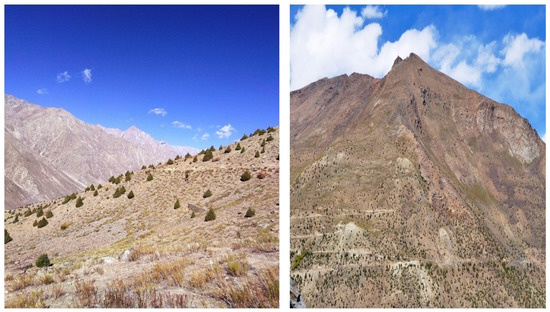
Figure 7.
Juniperus macropoda migration in Lahaul Valley.
3.2. Relationship between Diameter and Age
The relationship between J. macropoda’s age and DBH was statistically significant (F = 265.938, p < 0.0001). J. macropoda’s DBH increased with increasing age during the initial stages of establishment, but as the species matured, the increase in DBH slowed (Figure 8a). The age histogram of J. macropoda (Figure 8b) revealed that the majority of the establishment occurred around 1900 and between 1975 and 2010. When compared to mature trees, the seedlings and saplings (40 years) age histogram had relatively high frequencies. We hypothesised that the establishment of J. macropoda at higher elevations occurred in the recent decade based on tree ring analysis, which is consistent with the findings of other studies [26,34,35].
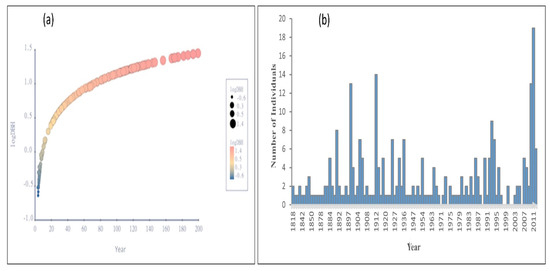
Figure 8.
(a) Age—logDBH curve of Juniperus macropoda in Lahaul Valley of Himachal Pradesh and (b) age-frequency of trees of Juniperus macropoda in Lahaul Valley of Himachal Pradesh.
3.3. Response of Regeneration to Climate Change
Simple Pearson correlation coefficients were used to know the response of J. macropoda regeneration to temporal seasonal climatic variation (Figure 9). It is evident from Figure 6 that recruitment of J. macropoda correlated positively with minimum temperature of monsoon (r = 0.79, p < 0.01) and post-monsoon (r = 0.41, p < 0.05) seasons. Similarly, the maximum temperature of monsoon season correlated positively (r = 0.41, p < 0.05) with the recruitment of J. macropoda. While no correlation existed between recruitment and any of the pre-monsoonal and winter climatic variables. This implies that a warm period during the monsoon and post-monsoon seasons helps in inducing observed regeneration in the cold environment and increased precipitation in the form of snow of the winter season provides sustain supply of moisture to them. Similarly, Korner & Paulson [36] opined that at global scale the growing season temperature at tree line plays an important role. Contrarily, Gaire et al. [26] observed that the regeneration of A. spectabilis was positively related to May-August precipitation and January–April temperature.
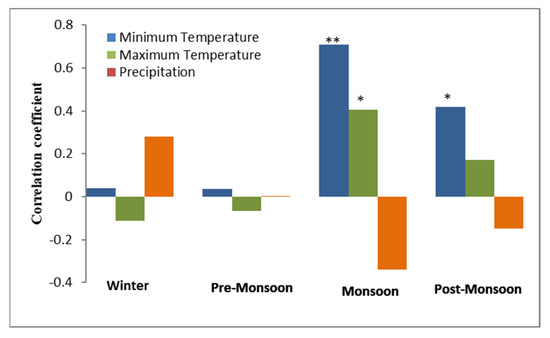
Figure 9.
Correlation coefficients of recruitment with seasonal temperature and precipitation (1980–2013). (Winter: January–Febuary, Pre-monsoon: March–May, Monsoon: June–September, Post-monsoon: October–December). * 5% significance, ** 1% significance.
3.4. Rate of Shift (m year−1)
Since 1850, the decades have become steadily warmer. The period from 1983 to 2012 was the warmest 30-year period in the Northern Hemisphere in the last 1400 years, where such an assessment is possible (with moderate confidence). From 1880 to 2012, the globally averaged combined land and ocean surface temperature data showed a warming trend of 0.85 °C (0.65 °C to 1.06 °C) [37]. Treeline ecotones form a distinct boundary [38] and are sensitive biomonitors of climate change [39]. Treeline responds to climate change positionally, composition, structurally, and [40] ascended to higher elevations.
Figure 10a,b and Figure 11 show graphic representations of the relationships between elevation/height, elevation/diameter, and elevation/age, respectively. These biophysical parameters of dominant trees were found to be decreasing with an increase in elevation. Their adjusted R2 values (0.95–0.99) indicate strong relationships. A significant relationship between elevation/height, elevation/diameter, and elevation/age implies that the treeline is advancing in response to climate change. With increasing elevation, these characteristics declined dramatically. Limiting climatic conditions at higher elevations, such as the physical effects of wind and snow, site-specific factors, physiological effects, or nutrient limitations, may explain the decrease in height and diameter along the elevation gradient. The age difference between the oldest trees at higher and lower elevations, as well as the elevation difference between each range, were used to calculate the average rate of the shift, which is expressed as a changeover yearly and decadal periods. The average rate of change in the position of J. macropoda is 39.11 m decade−1 or 3.91 m year−1 (Table 2). The shifting rate at a higher altitude of distribution was related to the seasonal climatic variables [29] of maximum temperature, minimum temperature, and precipitation. If the plots located along the altitude consist of individuals with decreasing age and also have uniform distribution then we can conclude that the vegetation shifting is taking place towards the higher altitude. At higher elevations, these factors may have a strong limiting effect on germination, height, and diameter.
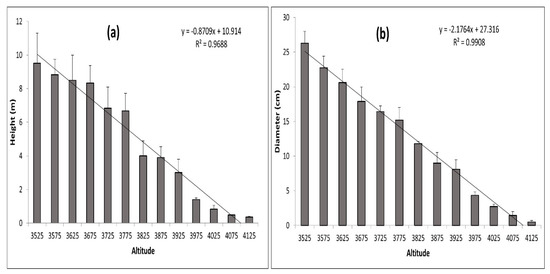
Figure 10.
Average height (cm) (a) and Average DBH (cm) (b) of Juniperus macropoda along different altitudinal gradients in Lahaul Valley of Himachal Pradesh. The error bar signifies the standard deviation.
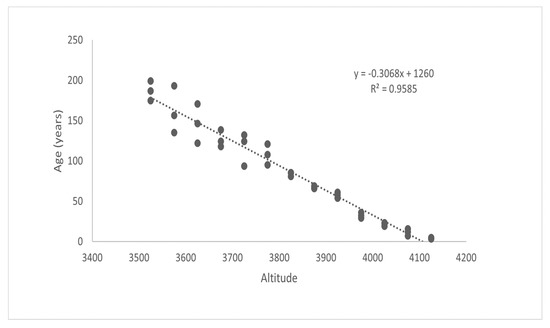
Figure 11.
Age of Juniperus macropoda along different altitudinal gradients in Lahaul Valley of Himachal Pradesh.
Table 2.
Rate of shift of Junipers macropoda in Lahaul Valley of Himachal Pradesh.
The age structure of J. macropoda at the tree line indicates that this tree species has nearly reached the expansion threshold, with the youngest species recorded at the upper elevation limit being approximately 4.25 years old. Telwala et al. [41] also observed that mountain vegetation is sensitive to climate-driven range shift. Similarly, the upward movement of tree species limit due to climate change in the Himalayan region have also been reported by Dubey et al. [29] in Pinus wallichiana A.B. Jacks (1.4–1.9 m year−1); Yadav et al. [42] in Pinus wallichiana (1.1–5.4 m year−1); Gaire et al. [26] in Abies spectablis D. Don (2.61 m year−1); Suwal [43] in A. spectabilis (3.4 m year−1). The rate of shift seems to be slightly higher when compared to the different studies done in the Himalayan region, which indicate that this region is warming at a higher rate than other parts of the Himalayas. During the investigation, many lichen species were found to invade the bare rock (Figure 12a,b), which indicates that climate change is taking place. These findings have been supported by previous research on alpine tree lines, which found an elevational shift in the first half of the twentieth century, followed by increased tree density within the high-elevation ecotone in recent decades [44,45,46]. However, the continuous establishment of seedlings in the study site has not occurred, and seedling recruitment remains episodic [47]. However, the tree line’s response to climatic warming in the alpine region is mixed [48].
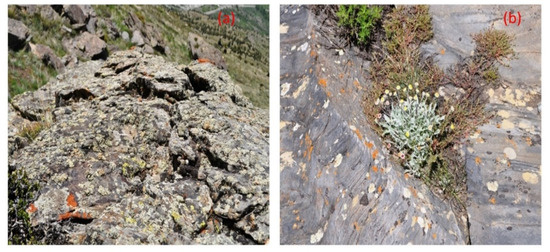
Figure 12.
(a) Appearance of number of lichen species above tree line indicating suitability of habitat for regeneration, (b) Lichen species and herbs invading bare rock above tree line.
4. Conclusions
In the study area, the long-term NDVI analysis from 1994–2017 illustrated that the average NDVI value for June month is gradually increased in recent years, especially from 2013 onwards which indicates the emergence of grasses and new recruits in the area. The biophysical parameters of age, diameter, and height of the dominant trees decreased with the increase in altitude. This happens due to the migration of the tree species to a higher altitude because of formation of the favorable conditions for their establishment during some period of time. The majority of the establishment of J. macropoda occurred around 1900 and between 1975 and 2010. This recent recruitment of J. macropoda correlated positively with the rise in the minimum temperature of the monsoon and post-monsoon seasons. Furthermore, significant variations in climatic factors over the last few decades were observed, which attributed to the vegetation shift of juniper species at a rate of 3.91 m year−1. During the investigation, many lichen species were found to invade the bare rock, which gave ample evidence that climate change has started to influence vegetation in a significant manner. However, there is a concern that the ongoing warming affecting could lead to the disappearance of pasture and a decline in the species richness in the fragile Himalayan ecosystem. Therefore, there is an urgency to develop a better understanding of the response of high-elevation plant species of the Himalayas on a larger scale.
Author Contributions
Conceptualization, methodology, validation, formal analysis, investigation, D.K., D.R.B. and G.T.A.; data curation, writing—original draft, D.K. and D.R.B.; writing—review and editing, software visualization, C.L.T., P.S. and G.T.A. All authors have read and agreed to the published version of the manuscript.
Funding
G.T.A. received funding and acknowledges Griffith Graduate Research School, the Australian Rivers Institute and School of Engineering, Griffith University, Queensland, Australia. G.T.A. funded the APC.
Data Availability Statement
Data could be provided on reasonable request from the first author.
Acknowledgments
The authors are grateful to the Head, Department of Silviculture and Agroforestry, YS Parmar University of Horticulture and Forestry, Solan (HP), India, for providing necessary facilities during the study.
Conflicts of Interest
The authors declare that they have no known competing financial interests or personal relationships that could have appeared to influence the work reported in this paper.
References
- NOAA 2021. National Centers for Environmental Information, State of the Climate: Global Climate Report for Annual 2021. Available online: https://www.ncdc.noaa.gov/sotc/global/201713 (accessed on 28 June 2022).
- Shrestha, U.B.; Gautam, S.; Bawa, K.S. Widespread climate change in the Himalayas and associated changes in local ecosystems. PLoS ONE 2012, 7, 36741. [Google Scholar] [CrossRef] [PubMed]
- Xu, J.; Grumbine, R.E.; Shrestha, A.; Eriksson, M.; Yang, X.; Wang, Y.; Wilkes, A. The melting Himalayas: Cascading effects of climate change on water, biodiversity and livelihoods. Conserv. Biol. 2009, 23, 520–530. [Google Scholar] [CrossRef] [PubMed]
- Zhang, Y.; Xu, M.; Adams, J.; Wang, X. Can landsat imagery detect tree line dyanamics? Int. J. Remote Sens. 2009, 30, 1327–1340. [Google Scholar] [CrossRef]
- Dalen, L.; Hofgaard, A. Differential regional treeline dynamics in the Scandes mountains. Arct. Antarct. Alp. Res. 2005, 37, 284–296. [Google Scholar] [CrossRef]
- Grace, J.; Berninger, F.; Nagy, L. Impacts of climate change on the tree line. Ann. Bot. 2002, 90, 537–544. [Google Scholar] [CrossRef] [PubMed]
- Bhattarai, K.R.; Vetaas, O.R. Variation in plant species richness of different life along a subtropical elevation gradient in the Himalayas, East Nepal. Glob. Ecol. Biogeogr. 2003, 12, 327–340. [Google Scholar] [CrossRef]
- Smith, S.A.; Beaulieu, J.M. Life history influences rates of climatic niche evolution in flowering plants. Biol. Sci. 2009, 276, 4345–4352. [Google Scholar] [CrossRef]
- Korner, C. Alpine Plant Life: Functional Plant Ecology of High Mountain Ecosystems; Springer: Berlin, Germany, 2003. [Google Scholar]
- Currie, D.J.; Mittelbach, G.G.; Cornell, H.W.; Field, R.; Guegan, J.F.; Hawkins, B.A.; Turner, J.R.G. Predictions and tests of climate-based hypotheses of broad-scale variation in taxonomic richness. Ecol. Lett. 2004, 7, 1121–1134. [Google Scholar] [CrossRef]
- Pepin, N.C.; Lundquist, J.D. Temperature trends at high elevations: Patterns across the globe. Geophys. Res. Lett. 2008, 35, 14701. [Google Scholar] [CrossRef]
- Rangwala, I.; Miller, J.R. Climate change in mountains: A review of elevation-dependent warming and its possible causes. Clim. Chang. 2012, 114, 527–547. [Google Scholar] [CrossRef]
- Fes, A.S. Deriving Lapse Rates of Slope Air Temperature for Meltwater Runoff Modeling in Subtropical Mountains: An Example from the Punjab Himalaya, Pakistan. Mt. Res. Dev. 1997, 17, 353–362. [Google Scholar] [CrossRef]
- Simard, M.; Pinto, N.; Fisher, J.B.; Baccini, A. Mapping forest canopy height globally with spaceborne lidar. J. Geophys. Res. 2011, 116, 4021. [Google Scholar] [CrossRef]
- Wang, X.P.; Fang, J.Y.; Tang, Z.Y.; Zhu, B. Climatic control of primary forest structure and DBH-height allometry in Northeast China. For. Ecol. Manag. 2006, 234, 264–274. [Google Scholar] [CrossRef]
- Topaloglu, E.; Ay, N.; Altun, L.; Serdar, B. Effect of altitude and aspect on various wood properties of Oriental beech (Fagus orientalis Lipsky) wood. Turk. J. Agric. For. 2016, 40, 397–406. [Google Scholar] [CrossRef]
- Kumar, D.; Bhardwaj, D.R.; Sharma, P.; Sankhyan, N.; Al-Ansari, N.; Linh, N.T.T. Population Dynamics of Juniperus macropoda Bossier Forest Ecosystem in Relation to Soil Physico-Chemical Characteristics in the Cold Desert of North-Western Himalaya. Forests 2022, 13, 1624. [Google Scholar] [CrossRef]
- Kumar, D.; Bhardwaj, D.R.; Sharma, H.; Sharma, P.; Pala, N.A. Species diversity assessment along altitudinal gradient in cold desert Juniperus forest of north-western Himalaya. Indian For. 2022, 148, 459–466. [Google Scholar] [CrossRef]
- Luna, R.K. Plantation Trees; International Book Distributor: Dehradun, India, 1995; pp. 905–906. [Google Scholar]
- Korouri, S.A.A.; Khoshnevis, M.; Matinizadeh, M. Comprehensive Studies of Juniper Species in Iran; Forest Range and Watershed Management Organization: Tehran, Iran, 2012; pp. 144–193.
- Ahani, H.; Jalilvand, H.; Hosseini, N.S.M.; Soltani, K.H.; Ghazi, M.R.; Mohammadz, H. Reproduction of Juniperus polycarpus in Khorasan Razavi, Iran. For. Sci. Pract. 2013, 15, 231–237. [Google Scholar] [CrossRef]
- Xu, J.; Grumbine, R.E. Building ecosystem resilience for climate change adaptation in the Asian highlands. Wiley Interdiscip. Rev. Clim. Chang. 2014, 5, 709–718. [Google Scholar] [CrossRef]
- Bhattacharyya, A.; Lamarche, V.C.J.; Hughes, M.K. Tree ring chronologies from Nepal. Tree Ring Bull. 1992, 52, 59–66. [Google Scholar]
- Bhuju, D.R.; Carrer, M.; Gaire, N.P.; Soraruf, L.; Riondato, R.; Salerno, F.; Maharjan, S.R. Dendroecological study of high-altitude forest at Sagarmatha National Park, Nepal. In Contemporary Research in Sagarmatha (Mt. Everest) Region; Jha, P.K., Khanal, I.P., Eds.; Nepal Academy of Science and Technology: Lalitpur, Nepal, 2010; pp. 119–130. [Google Scholar]
- Cook, E.R.; Krusicm, P.J.; Jones, P.D. Dendroclimatic signals in long tree ring chronologies from the Himalayas of Nepal. Int. J. Climatol. 2003, 23, 707–732. [Google Scholar] [CrossRef]
- Gaire, N.P.; Dhakal, Y.R.; Lekhak, H.C.; Bhuju, D.R.; Shah, S.K. Dynamics of Abies spectabilis in relation to climate change at the treeline ecotone in Langtang National Park. Nepal J. Sci. Technol. 2011, 12, 220–229. [Google Scholar] [CrossRef]
- Sano, M.; Furuta, F.; Kobayashi, O.; Sweda, T. Temperature variations since the mid-18th century for Western Nepal as reconstructed from tree-ring width and density of Abies spectabilis. Dendrochronologia 2005, 23, 83–92. [Google Scholar] [CrossRef]
- Champion, H.G.; Seth, S.K. A Revised Survey of Forests Types of India; Manager Publication Delhi: Delhi, India, 1968; 72p. [Google Scholar]
- Dubey, B.; Yadav, R.R.; Singh, J.; Chaturvedi, R. Upward shift of Himalayan pine in Western Himalayan, India. Curr. Sci. 2003, 85, 1135–1136. [Google Scholar]
- Addinsoft. XLSTAT Statistical and Data Analysis Solution; Addinsoft: Long Island, NY, USA, 2020. [Google Scholar]
- SPSS Inc. SPSS Statistics for Windows; Version 17.0; SPSS Inc.: Chicago, IL, USA, 2008. [Google Scholar]
- Bakerv, B.B.; Moseley, R.K. Advancing treeline and retreating glaciers: Implications for conservation in Yunnan, P.R. China. Arct. Antarct. Alp. Res. 2007, 39, 200–209. [Google Scholar] [CrossRef]
- Rawat, D.S. Monitoring ecosystem boundaries in the Himalaya through an ‘eye in the sky’. Curr. Sci. 2012, 102, 1352–1354. [Google Scholar]
- Liang, E.; Wang, Y.; Eckstein, D.; Luo, T. Little change in the fir tree-line position on the southeastern Tibetan Plateau after 200 years of warming. New Phytol. 2011, 190, 760–769. [Google Scholar] [CrossRef] [PubMed]
- Lv, X.; Zhang, Q.B. Asynchronous recruitment history of Abies spectabilis along an altitudinal gradient in the Mt. Everest region. J. Plant Ecol. 2012, 5, 147–156. [Google Scholar] [CrossRef]
- Korner, C.; Paulsen, J. A world-wide study of high-altitude treeline temperatures. J. Biogeogr. 2004, 31, 713–732. [Google Scholar] [CrossRef]
- Pachauri, R.K.; Allen, M.R.; Barros, V.R.; Broome, J.; Cramer, W.; Christ, R.; Church, J.A.; Clarke, L.; Dahe, Q.; Dasgupta, P.; et al. Climate Change 2014: Synthesis Report. Contribution of Working Groups I, II and III to the Fifth Assessment Report of the Intergovernmental Panel on Climate Change; IPCC: Geneva, Szwitzerland, 2014; 151p. [Google Scholar]
- Holtmeier, F.K. Mountain Timberline: Ecology, Patchiness and Dynamics; Springer Science and Business Media B.V.: Berlin/Heidelberg, Germany, 2009; Volume 36, pp. 1–4. [Google Scholar]
- Kullman, L. Tree-limits and montane forests in the Swedish Scandes: Sensitive biomonitors of climate change and variability. Ambio 1998, 27, 312–321. [Google Scholar]
- Kirdyanov, A.V.; Hagedorn, F.; Knorre, A.A.; Fedotova, E.V.; Vaganov, E.A.; Naurzbaev, M.M.; Moiseev, P.A.; Rigling, A. 20th century tree-line advance and vegetation changes along an altitudinal transect in the Putorana Mountains, northern Siberia. Boreas 2012, 41, 56–67. [Google Scholar] [CrossRef]
- Telwala, Y.; Brook, B.W.; Manis, K.; Pandit, M.K. Climate-induced elevational range shifts and increase in plant species richness in a Himalayan biodiversity epicentre. PLoS ONE 2013, 8, 57103. [Google Scholar] [CrossRef] [PubMed]
- Yadava, A.K.; Sharma, Y.K.; Dubey, B.; Singh, J.; Singh, V.; Bhutiyani, M.R.; Yadav, R.R.; Misra, K. Altitudinal treeline dynamics of Himalayan pine in western Himalaya, India. Quat. Int. 2017, 444, 44–52. [Google Scholar] [CrossRef]
- Suwal, M.K. Tree Species Line Advance of Abies spectabilis in Manaslu Conservation Area, Nepal Himalaya. Master’s Thesis, Central Department of Botany, Tribhuvan University, Kirtipur, Nepal, 2010; 84p. [Google Scholar]
- Szeics, J.M.; Macdonald, G.M. Recent white spruce dynamics at the sub-arctic alpine treeline of North-Western Canada. J. Geol. 1995, 83, 873–885. [Google Scholar]
- Camarero, J.J.; Gutierrez, E. Pace and pattern of recent treeline dynamics: Response of ecotones to climatic variability in the Spanish Pyrenees. Clim. Chang. 2004, 63, 181–200. [Google Scholar] [CrossRef]
- Vijayaprakash, V.; Ansari, A.S. Climate Change and Vegetation Shift of Abies spectabilis D. Don in the Tree Line Areas of Gwang Kharqa in Sankhuwasava District of Eastern Nepal; University of Copenhagen: København, Denmark, 2009; 57p. [Google Scholar]
- Holtmeier, F.K.; Broll, G. Treeline advance-driving processes and adverse factors. Landsc. Online 2007, 1, 1–33. [Google Scholar] [CrossRef]
- Harsch, M.A.; Hulme, P.E.; Mcglone, M.S.; Duncan, R.P. Are treelines advancing? A global meta-anlaysis treeline response to climate warming. Ecol. Lett. 2009, 12, 1040–1049. [Google Scholar] [CrossRef]


Publisher’s Note: MDPI stays neutral with regard to jurisdictional claims in published maps and institutional affiliations. |
© 2022 by the authors. Licensee MDPI, Basel, Switzerland. This article is an open access article distributed under the terms and conditions of the Creative Commons Attribution (CC BY) license (https://creativecommons.org/licenses/by/4.0/).