Article

Microclimate Drives Shelter-Seeking Behaviour in Lambing Ewes

1
School of Natural Sciences, Bangor University, Bangor LL57 2DG, UK
2
UK Centre for Ecology and Hydrology, Environment Centre Wales, Deiniol Road, Bangor LL57 2UW, UK
3
Department of Livestock & One Health, University of Liverpool, Neston CH64 7TE, UK
4
Innovis Ltd., Capel Dewi, Aberystwyth SY23 3HU, UK
*
Authors to whom correspondence should be addressed.
Forests 2022, 13(12), 2133; https://doi.org/10.3390/f13122133
Submission received: 31 October 2022 / Revised: 2 December 2022 / Accepted: 5 December 2022 / Published: 12 December 2022
(This article belongs to the Section Forest Ecology and Management)

Abstract

:
Silvopastoral agroforestry and the strategic placement of trees and hedgerows offers potential to improve livestock welfare and production efficiency through the provision of shelter in livestock farming systems. The aim of this study was to investigate the relationship between shelter-seeking behaviour of ewes during the lambing period and the microclimate influenced by landscape shelter features. Artificial and natural shelter was provided to Aberfield ewes (n = 15) on an upland sheep farm in Wales, UK, which were then continuously monitored for 14 days using global positioning system tracking devices. Modelling of microclimate influenced by topographical shelter features at the test site was used to generate a 1 m resolution wind field for geospatial statistical analysis of localised wind speed. Ewes demonstrated an increased preference for natural (3.4-fold; p < 0.01) and artificial (3.0-fold; p < 0.05) shelter zones five times the height of the shelter, compared to the exposed area of the trial site. Wind-chill and modelled local-scale wind speeds were found to have the greatest influence on shelter-seeking behaviour, with temperature and field-scale wind speed significantly influencing livestock behaviour. Mean wind-chill temperature during the trial was 3.7 °C (min −5.3 °C; max 13.1 °C), which is within the cold stress temperature threshold (−3 and 8 °C) that requires thermoregulatory strategies such as shelter-seeking behaviour. An improved understanding of the relationship between microclimate and shelter-seeking behaviour in sheep, demonstrated through the agent-based model developed in this project, shall better inform the economic incentives (e.g., reduction in lamb mortality and forage requirements) behind silvopastoral practices that benefit farm productivity, livestock welfare and the environment.

1. Introduction

Silvopastoral agroforestry is a practice that integrates trees and hedgerows into livestock farming systems [1]. These agroforestry systems are often framed as win–win scenarios that promote livestock welfare and productivity [2,3], whilst also providing environmental benefits, such as climate change mitigation, hydrological regulation and biodiversity gains [4,5].
In the UK and New Zealand, 10 to 15% of newborn lambs die each year through cold exposure [6], and extreme weather events have been documented to accelerate these losses [7]. However, a silvopasture experiment integrating hedgerow shelter into pasture, conducted in New South Wales, Australia, showed that lamb mortality in a sheltered environment was half of that in an exposed paddock [2]. More recently, the benefits of shelter provision to sheep welfare were demonstrated through a reduction in shepherding interventions, such as ewe dystocia and lamb mortality [3]. A systematic evidence synthesis of the productivity and environmental impacts of temperate agroforestry and ruminant livestock identified only 14 articles in both the grey and peer-reviewed literature [8], suggesting that the scientific evidence-base around livestock productivity and welfare in silvopasture is poorly understood.
Sheep (Ovies aries) maintain homeostasis through metabolic heat production, with a narrow range of ambient temperature (i.e., 8 to 18 °C) known as the thermocomfort zone (TCZ). Ambient temperatures outside of the TCZ and between −3 and 24 °C are defined as the thermoneutral zone (TNZ) [9], where sheep exhibit shelter-seeking behaviour. Beyond the TNZ, regulatory changes in metabolic heat production (e.g., thermogenesis via shivering) occur to meet the physiological demands of cold stress. This effect is amplified by weather variables such as wind speed, low temperatures that when combined, produce colder than still air conditions (i.e., wind-chill) and rain, which reduces the insulating properties of sheep fleeces [10,11,12]. Consequently, newborn lambs can be vulnerable to death from hypothermia when still covered in amniotic fluid, or born at a low weight, which reduces the thermoregulatory capability of the animal [13].
In inclement weather, it is well known that sheep seek the sheltered zone created by windbreaks [14], which lie in the eddy of the upwardly deflected air and can persist up to a distance of 14 times the height of the shelter [15]. The effect of shelter establishment on local-scale microclimate varies according to the topography and aspect of the field, and environmental conditions change spatially and temporally [16]. The extent of shelter is also affected by physical characteristics of the windbreak, such as the porosity, height and depth [17]. Whilst a substantial body of evidence exists to describe the physical effects of windbreaks on microclimate, few studies have explored the utilisation of windbreak shelter by livestock in agroforestry systems [18].
Early research into British hill sheep (Scottish Blackface ewes) established an increased likelihood of shelter-seeking behaviour in progressively worsening weather, with a change in ewe behaviour in wind speeds above 11 m s−1 and when temperature was below freezing [14]. Additional factors that affect shelter-seeking behaviour include the phase of the production cycle [19], whether sheep were recently shorn [20,21], anthropogenic disturbance (e.g., road noise and human proximity) [22] and predation threat [23]. Research regarding the utilisation of shelter by sheep has largely focused on Merino ewes in Australasian systems, where shelter-seeking behaviour has been demonstrated through the use of Global Positioning System (GPS) collars [15,19]. Despite GPS devices being used in approximately half of all on-animal sensor sheep research [24], there has been limited application of GPS systems in the investigation of shelter utilisation by sheep [18], with none to date in a British context.
Recent reviews of the effect of windbreaks on livestock production highlighted the importance of understanding livestock response to shelter in various environmental conditions, noting a particular lack of research focused on natural shelter, such as trees and hedgerows [25]. Here, we build on earlier work [3], using the same study site to investigate the associated drivers of shelter-seeking behaviour in Aberfield ewes. Our overarching aim was to investigate the relationship between shelter-seeking behaviour of lambing ewes and microclimate influenced by landscape shelter features. We addressed this by first establishing that shelter-seeking behaviour is being displayed by the ewes for both artificial and natural shelter; then assessing whether wind speed, temperature, and wind-chill drives shelter-seeking behaviour in ewes; and finally, investigating how landscape topography (slope) affects shelter-seeking behaviour. A greater understanding of the relationship between microclimate and shelter-seeking behaviour in sheep will improve the evidence-base to support a move towards silvopastoral agroforestry and farming practices that benefit farm productivity, livestock welfare and the environment.

2. Materials and Methods
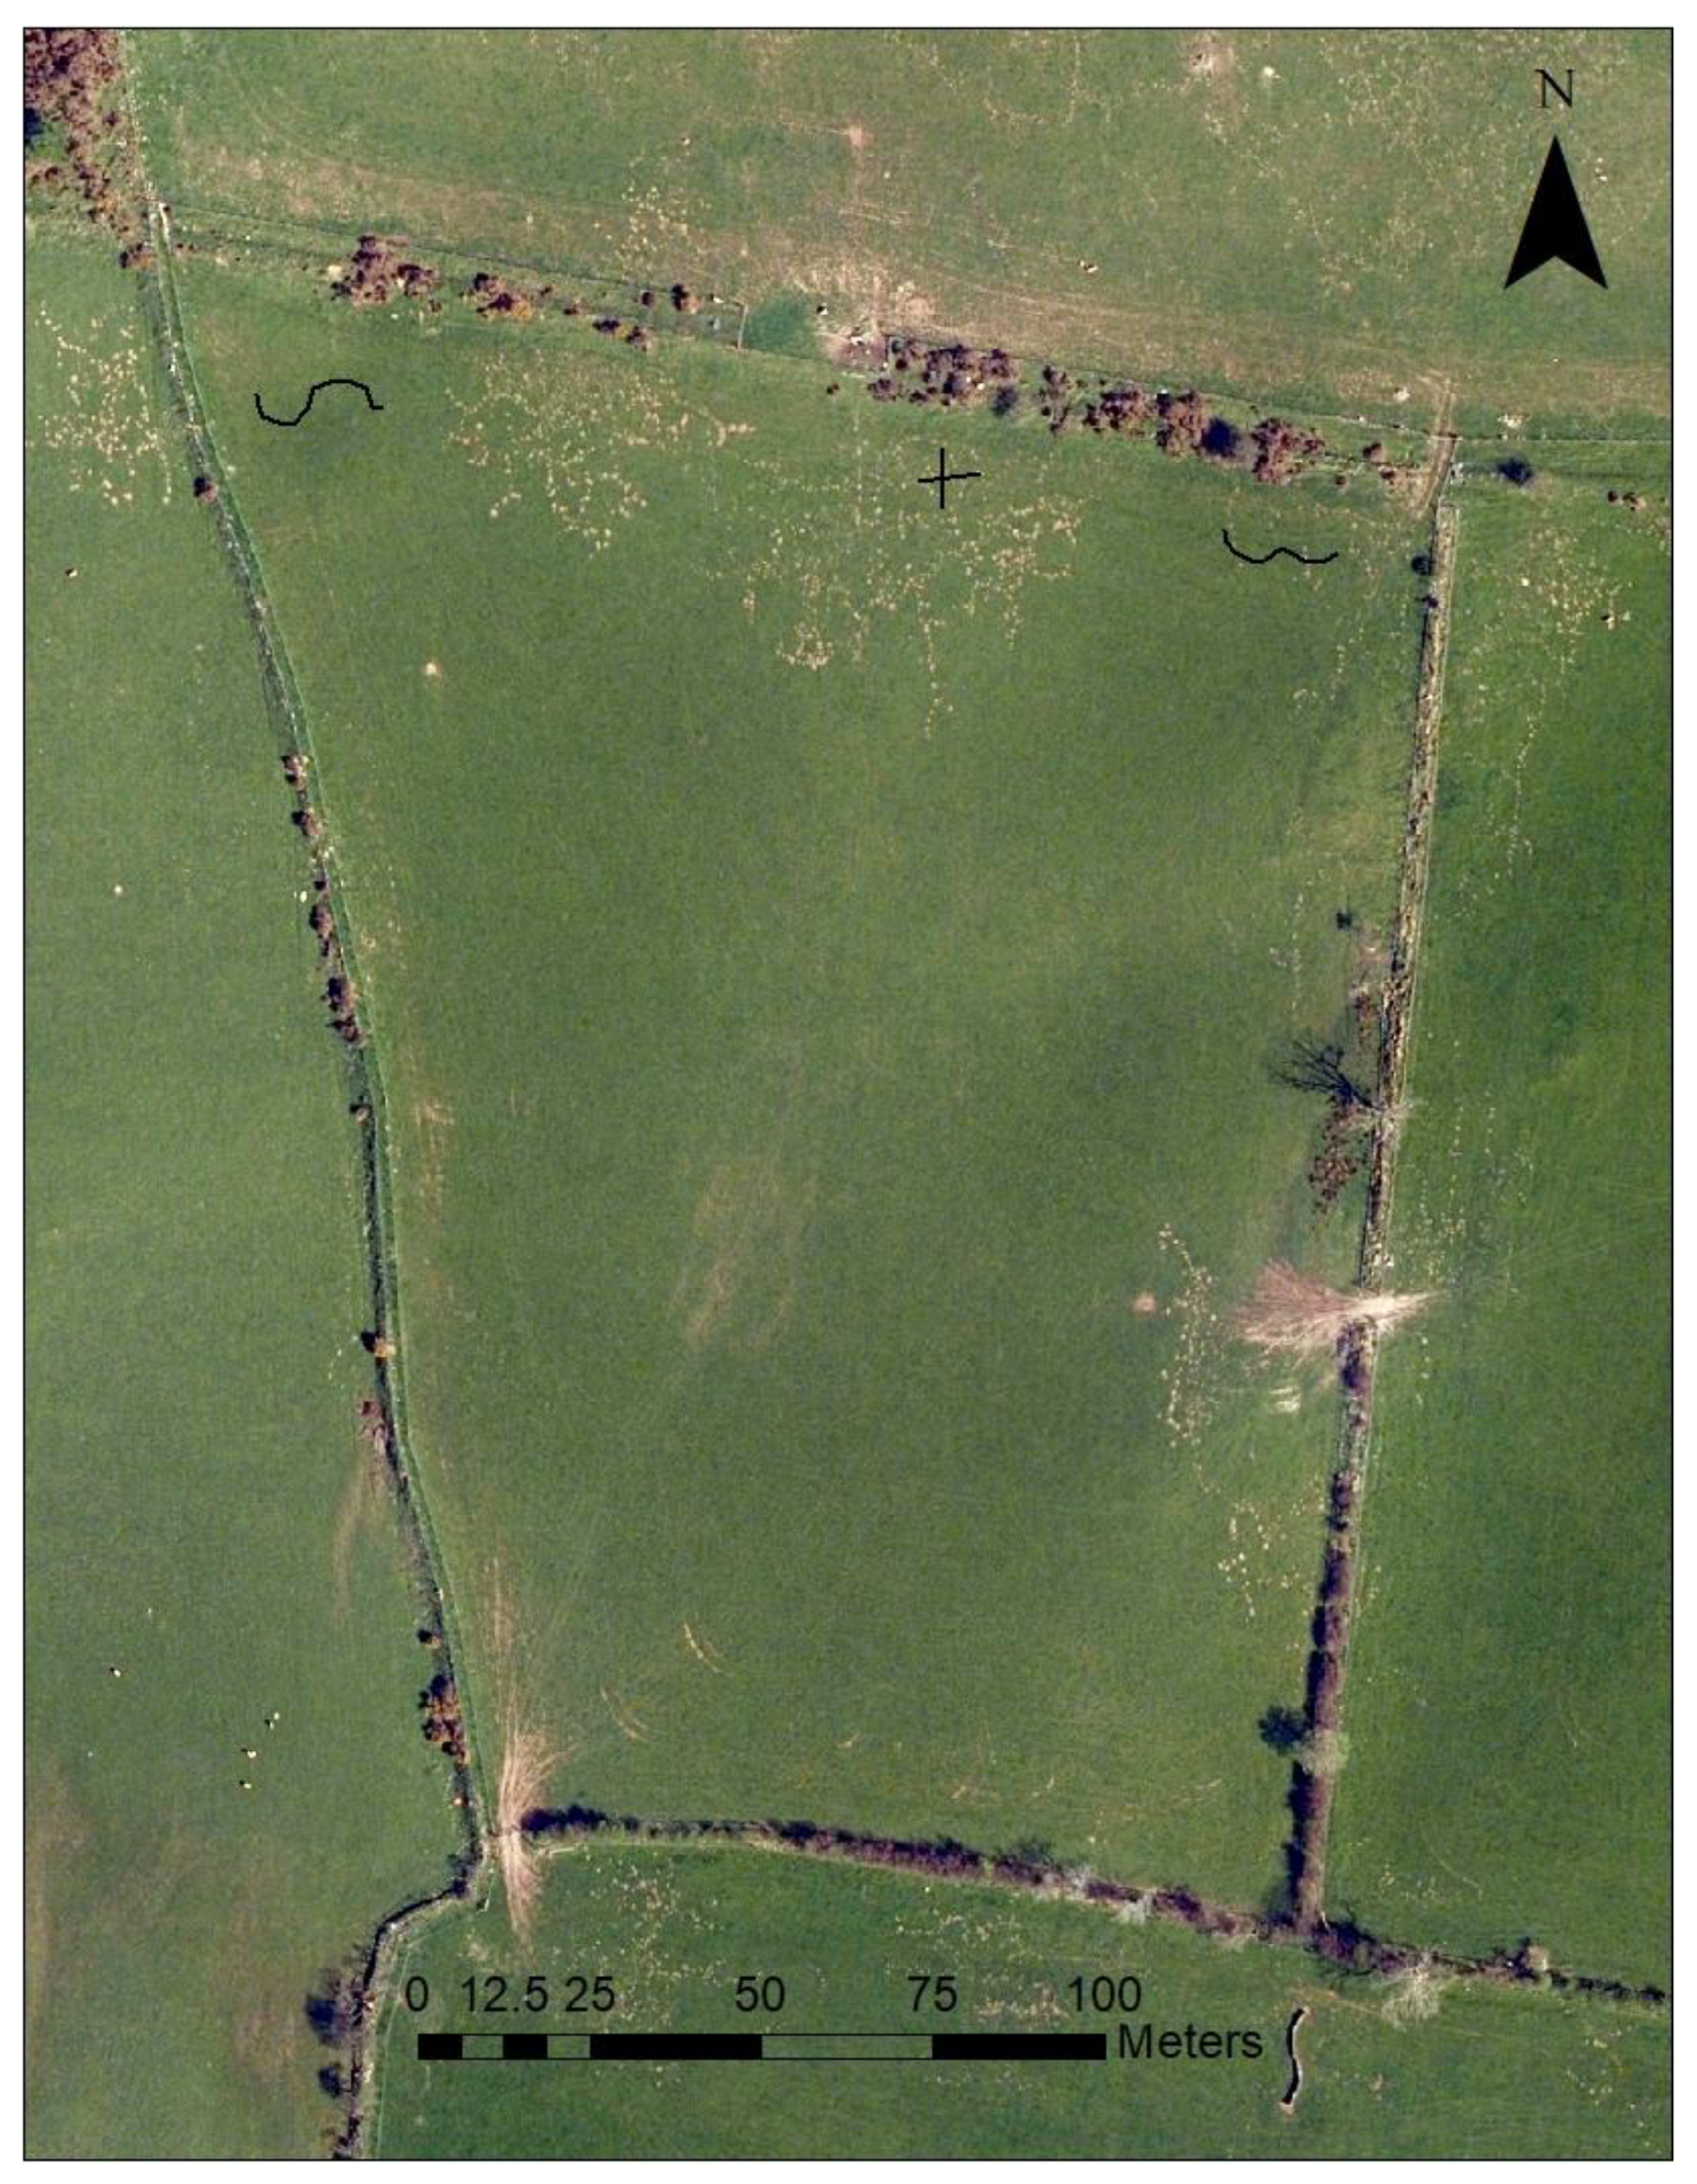
2.1. Study Site

The study was conducted at a commercial sheep farm, in Ceredigion, Wales (52.457305, −3.965332) during April 2019. In this work, data generated from an exposed ‘test’ field containing limited and broken bands of hawthorn (Crataegus monogyna) around the field margins were used (Figure 1). Contrasting shelter designs, similar to those already in use at the site and constructed from rubber tyres, were chosen to test for a preference in specific shelter designs, whilst also enabling comparison to earlier work [22]. For a detailed description of the trial field and artificial and natural shelter (Table 1), see Pritchard et al., 2021 [3].

2.2. Climate and Microclimate Parameters

To measure the ambient weather conditions, an automatic weather station (AWS; Vantage Pro 2, Davis Instruments, Hayward, CA, USA) was installed at the northern-eastern field boundary. The AWS recorded wind speed, wind direction, air temperature, rainfall and relative humidity in 30 min intervals between March and April 2019, which was a notably mild spring season (Table 2; Figure 2). A wind-chill index was calculated according to Campbell Scientific (2001) using Equation (1) where T = temperature, and WS = wind speed. The effect of the artificial shelters on wind speed was assessed using 2D WindSonic anemometers (Gill Instruments, Hampshire, UK) located on the leeward and windward sides of the shelter. As a result of the shelter, mean wind speed was reduced two-fold 0.35 m northwards of shelter 3 [3].
Wind   Chill   = 13.127 + 0.6215 T   13.947   WS 0.16 + 0.486 T   WS 0.16

2.3. Animals and GPS Collars

The individuals in this study were all Aberfield ewes (n = 15) [27], randomly selected from a reference flock with a range of ages and weights, aged between 2 and 8 years old, with a body condition score of greater than 3 (applying the 1–5 scale [28]), and an average weight of 66 kg. To track the spatial movement of individual animals with the trial, each individual was marked using spray paint to produce a coloured barcode used for visual identification (VID) and tagged with an electronic identifier (EID). A subset of six individuals were tracked using GPS devices (Gipsy 6, TechnoSmart, Rome, Italy) mounted onto lightweight collars that recorded sheep longitude and latitude in 5 min intervals throughout the study period (total 16,000 positions).

2.4. Spatial Parameters

The location of the sheep was imported into ArcMap (ArcInfo Desktop version 9.3; ESRI, Redlands, CA, USA) and overlaid onto a satellite image of the trial field (Getmapping Plc 2021). A zone of shelter influence was calculated as 2.5 and 5 times the height (2.5 H and 5 H) of the shelter [15,29] and a polygon drawn around the shelters using ArcMap to facilitate further analysis.

2.5. Modelling of the Wind Field

To model the wind field across the study site, Digital surface model (DSM) and digital terrain models (DTM) were obtained from Natural Resources Wales [30] at 1 m resolution, and a canopy height model (CHM) was derived from the difference between these models. An approximate wind field was calculated using the windcoef function from the microclima R package [31], giving the effect of topographical shelter across the study site. The output from this analysis was a raster of values of shelter ratio (the ratio of local-scale wind speed over field-scale wind speed as recorded by the weather station) on the 1 × 1 m resolution of the DSM.
The effect of the artificial and natural shelter features on this approximate wind field were manually digitised as spatial polygons in QGIS (QGI.org 2021) using satellite imagery from Google [32]. Height values were attributed to each natural shelter feature by extraction from the CHM using the zonal statistics tool and selecting the maximum value. The attributed values for height of the artificial structures were recorded in the initial study at the same site [3] (Table 1). Construction of a raster of shelter ratio values based upon the effect of these shelter structures was performed by calculating the shelter ratio at a series of 1000 random points and interpolating this result across the study site.
The shelter ratio at each point was modelled using an existing model [29] (Equation (1); Table 1) and assuming a dense vegetation (i.e., porosity of 0.36) representative of the gorse (Ulex europaeus) typically found at the field site. Interpolation of the wind field was performed using universal kriging with the krige function from the gstat R package [33,34]. The construction of the shelter ratio wind field raster was repeated by iterating over 16 compass directions (N, NNE, NE, NEE, etc.). Finally, to calculate the local-scale wind speed variable for use in hotspot analysis, each field-scale wind speed record value (measured by the AWS) in the ewe GPS-weather dataset was multiplied by the grid cell shelter ratio corresponding to the recorded location and wind direction.

2.6. Statistical Analysis

Four approaches were used to assess the shelter-seeking behaviour of ewes: (i) Preference Index (PI) was used to establish if sheep displayed a preference for sheltered areas; (ii) Moran’s I was used to investigate spatial autocorrelation (i.e., overall clustered or dispersed pattern) for the input variables temperature, wind-chill and wind speed; (iii) hotspot analysis identified if significant spatial clusters of cold and hotspots of temperature, wind speed and wind-chill existed; (iv) Pearson spatial correlation testing slope as an explanatory variable of the hot/colds spots discovered during the hotspot analysis. All statistical analyses and figures were completed and constructed with R (R Core Team 2020; RStudio version 1.1.463 (Boston, MA, USA), packages: tidyverse [35], ggplot2 [36]) and ArcMap (version 10.8.1; ESRI, CA, USA) with p < 0.05 used as the limit for statistical significance.

2.6.1. Preference Index

A PI value was calculated according to the methodology established in previous work [37] (Equation (2) to establish if sheep exhibited a preference for sheltered or exposed areas (a value > 1 indicated a preference for that site):
PI   = Proportion   of   time   spent   in   area   of   interest   Proportion   of   area   relative   to   entire   area   available  
For each of the shelters and exposed areas, the ‘count points in polygon’ from the ArcMap toolbox was used to count the total time (number of 5 min interval points) for each sheep in each area. This total (frequency) was then divided by the total frequency for each sheep. The same polygons were used to calculate exact area of each region and total site, using the field calculator function in ArcMap.
Significant difference in PI between sheltered and exposed areas was tested using a one-factor ANOVA with shelter zones as factors and PI as independent variables. PI data were assessed for normality using the Shapiro–Wilk test and homogeneity of variance using Barlett’s test. Due to the violation of the assumption of equal variances, an ANOVA with Welch’s correction was used.

2.6.2. Spatial Autocorrelation Moran’s I

Global Moran’s I statistic was used to investigate the spatial autocorrelation (e.g., overall clustered or dispersed pattern) for input variables, temperature, wind-chill and local and field-scale wind-speed. A positive Moran’s I statistic (Moran’s Index, on a scale of 0–1) indicates a clustering of high/low values, i.e., clustering of sheep positions when temperature was warmer or colder. The calculation applied for spatial analysis in ArcGIS is documented by ESRI [38].

2.6.3. Hotspot (Getis-Ord Gi*) Analysis

Weather data were restructured to match the 5 min intervals of the GPS data, and GPS data were cleaned by excluding anomalous data points that lay outside the study area. This final weather and GPS dataset was then overlaid onto a 10 m × 10 m grid, which was merged using the ‘merge’ tool in ArcMap to provide a 10 m stratification of the GPS-weather dataset. Further temporal stratification was achieved using ArcMap’s filter and split functions, to divide these data into 8 h windows, which was then used for hotspot analysis.
Presence of statistically significant spatial clusters of cold and hotspots for temperature, wind-speed and wind-chill, was determined using the hotspot analysis (Getis-Ord Gi* [39]) function of ArcMap. The Gi* statistic relates a z score for each of the polygons of the stratified 10 m grid with a large positive z score relating to a hotspot and a large negative z score showing a coldspot. Scores are segregated into Gi* bins, with each bin representing varying degrees of confidence in statistical significance.

2.6.4. Parameters Applied in Moran’s I and Hotspot Analysis

To select the appropriate conceptualisation of spatial relationships and neighbour distance band, the ‘incremental spatial autocorrelation’ tool, in the analysing patterns toolkit in ArcMap, was used to investigate spatial clustering at set distances. Distances were tested at 5 m intervals between 1–100 m for input variables wind-chill, wind-speed and temperature. To ensure the minimum number of neighbours for each feature, a 10 m distance band was selected for testing both spatial autocorrelation and the presence of hot/coldspots.
An inverse-distance method conceptualisation of spatial relationships was chosen for both spatial autocorrelation and hotspot analyses, due to the potential greater likelihood of nearby features (sheep positions) to be interactive and effect each other, with Euclidian distance used. Likewise, due to the potential for spatial dependency in the GPS point data, the False Discovery Rate (FDR) correction was applied during the hotspot analysis, which acts by reducing the critical z-scores and p-values.

2.6.5. Spatial Correlation of Slope and Hotspot Analysis

To compare the explanation of microclimate-driven shelter-seeking behaviour with an alternative hypothesis of ewe clustering determined by slope of terrain, correlations were performed between the raster of z values from the hotspot analysis, selecting only data records where the wind direction was the modal value southeast, and the shelter ratio raster for this wind direction and the terrain slope raster respectively. Each of the raster inputs were resampled on the same resolution as the raster of z scores, and vectors of the respective rasters’ values taken as the arguments for the cor.test function in R.

2.7. Agent-Based Model

An agent-based model (ABM) was constructed using NetLogo [40] to illustrate the shelter-seeking behaviour of sheep using established cold stress thresholds [29]. Input parameters included the amount of shelter (represented as brown patches) and the weather conditions (temperature, wind speed and wind direction). Sheep flocking behaviour was adapted from the existing NetLogo flocking model [41]. The energy of each agent is set to a random number between 80 and 90 to simulate natural variation in animal live weight and condition. The energy of each agent is then altered depending on weather conditions and proximity to shelter where each agents’ energy is increased by 1 when it is in homeostasis within the TCZ (i.e., grazing in good weather) up to its initial value. If the agent is located near to shelter, the wind-chill temperature is effectively increased by 10 °C due to the effect of shelter. Energy is decremented by 1 when the agent is in thermogenesis experiencing wind-chill temperatures between the TCZ and TNZ (i.e., wind-chill between 8 and −3 °C) and decremented by 2 when in homeothermy (i.e., experiencing wind-chill between −10 and −32 °C). When an agent’s energy reaches 20 its colour changes to blue, followed by red as the energy reaches 10, agents ‘die’ of hypothermia and are removed when total energy reaches zero.

3. Results

3.1. Ewe Area Preference Index (PI)

Ewes demonstrated a 3.9-fold increased preference for positioning themselves within the zone of shelter influence (i.e., a distance of 2.5 H from the shelter) for shelter 1 (p < 0.05), compared with the exposed area of the trial site (Table 3). Whilst a similar increase in PI was recorded for both the natural shelter at 2.5 H (3.5-fold increase; PI = 5.11), the natural shelter did not significantly differ from the exposed area. This was also true for both artificial shelters 2 and 3 at 2.5 H. In the 5H shelter zone, the ewes displayed a 3.0-fold increased preference for shelter 1 (p < 0.05) and a 3.4-fold increased preference for the natural shelter (p < 0.01) compared to the exposed area. A lack of utilisation of the artificial shelter 3 was recorded using the 5H parametrisation, with a 7.8-fold reduction in PI compared to shelter 1 (p < 0.01).

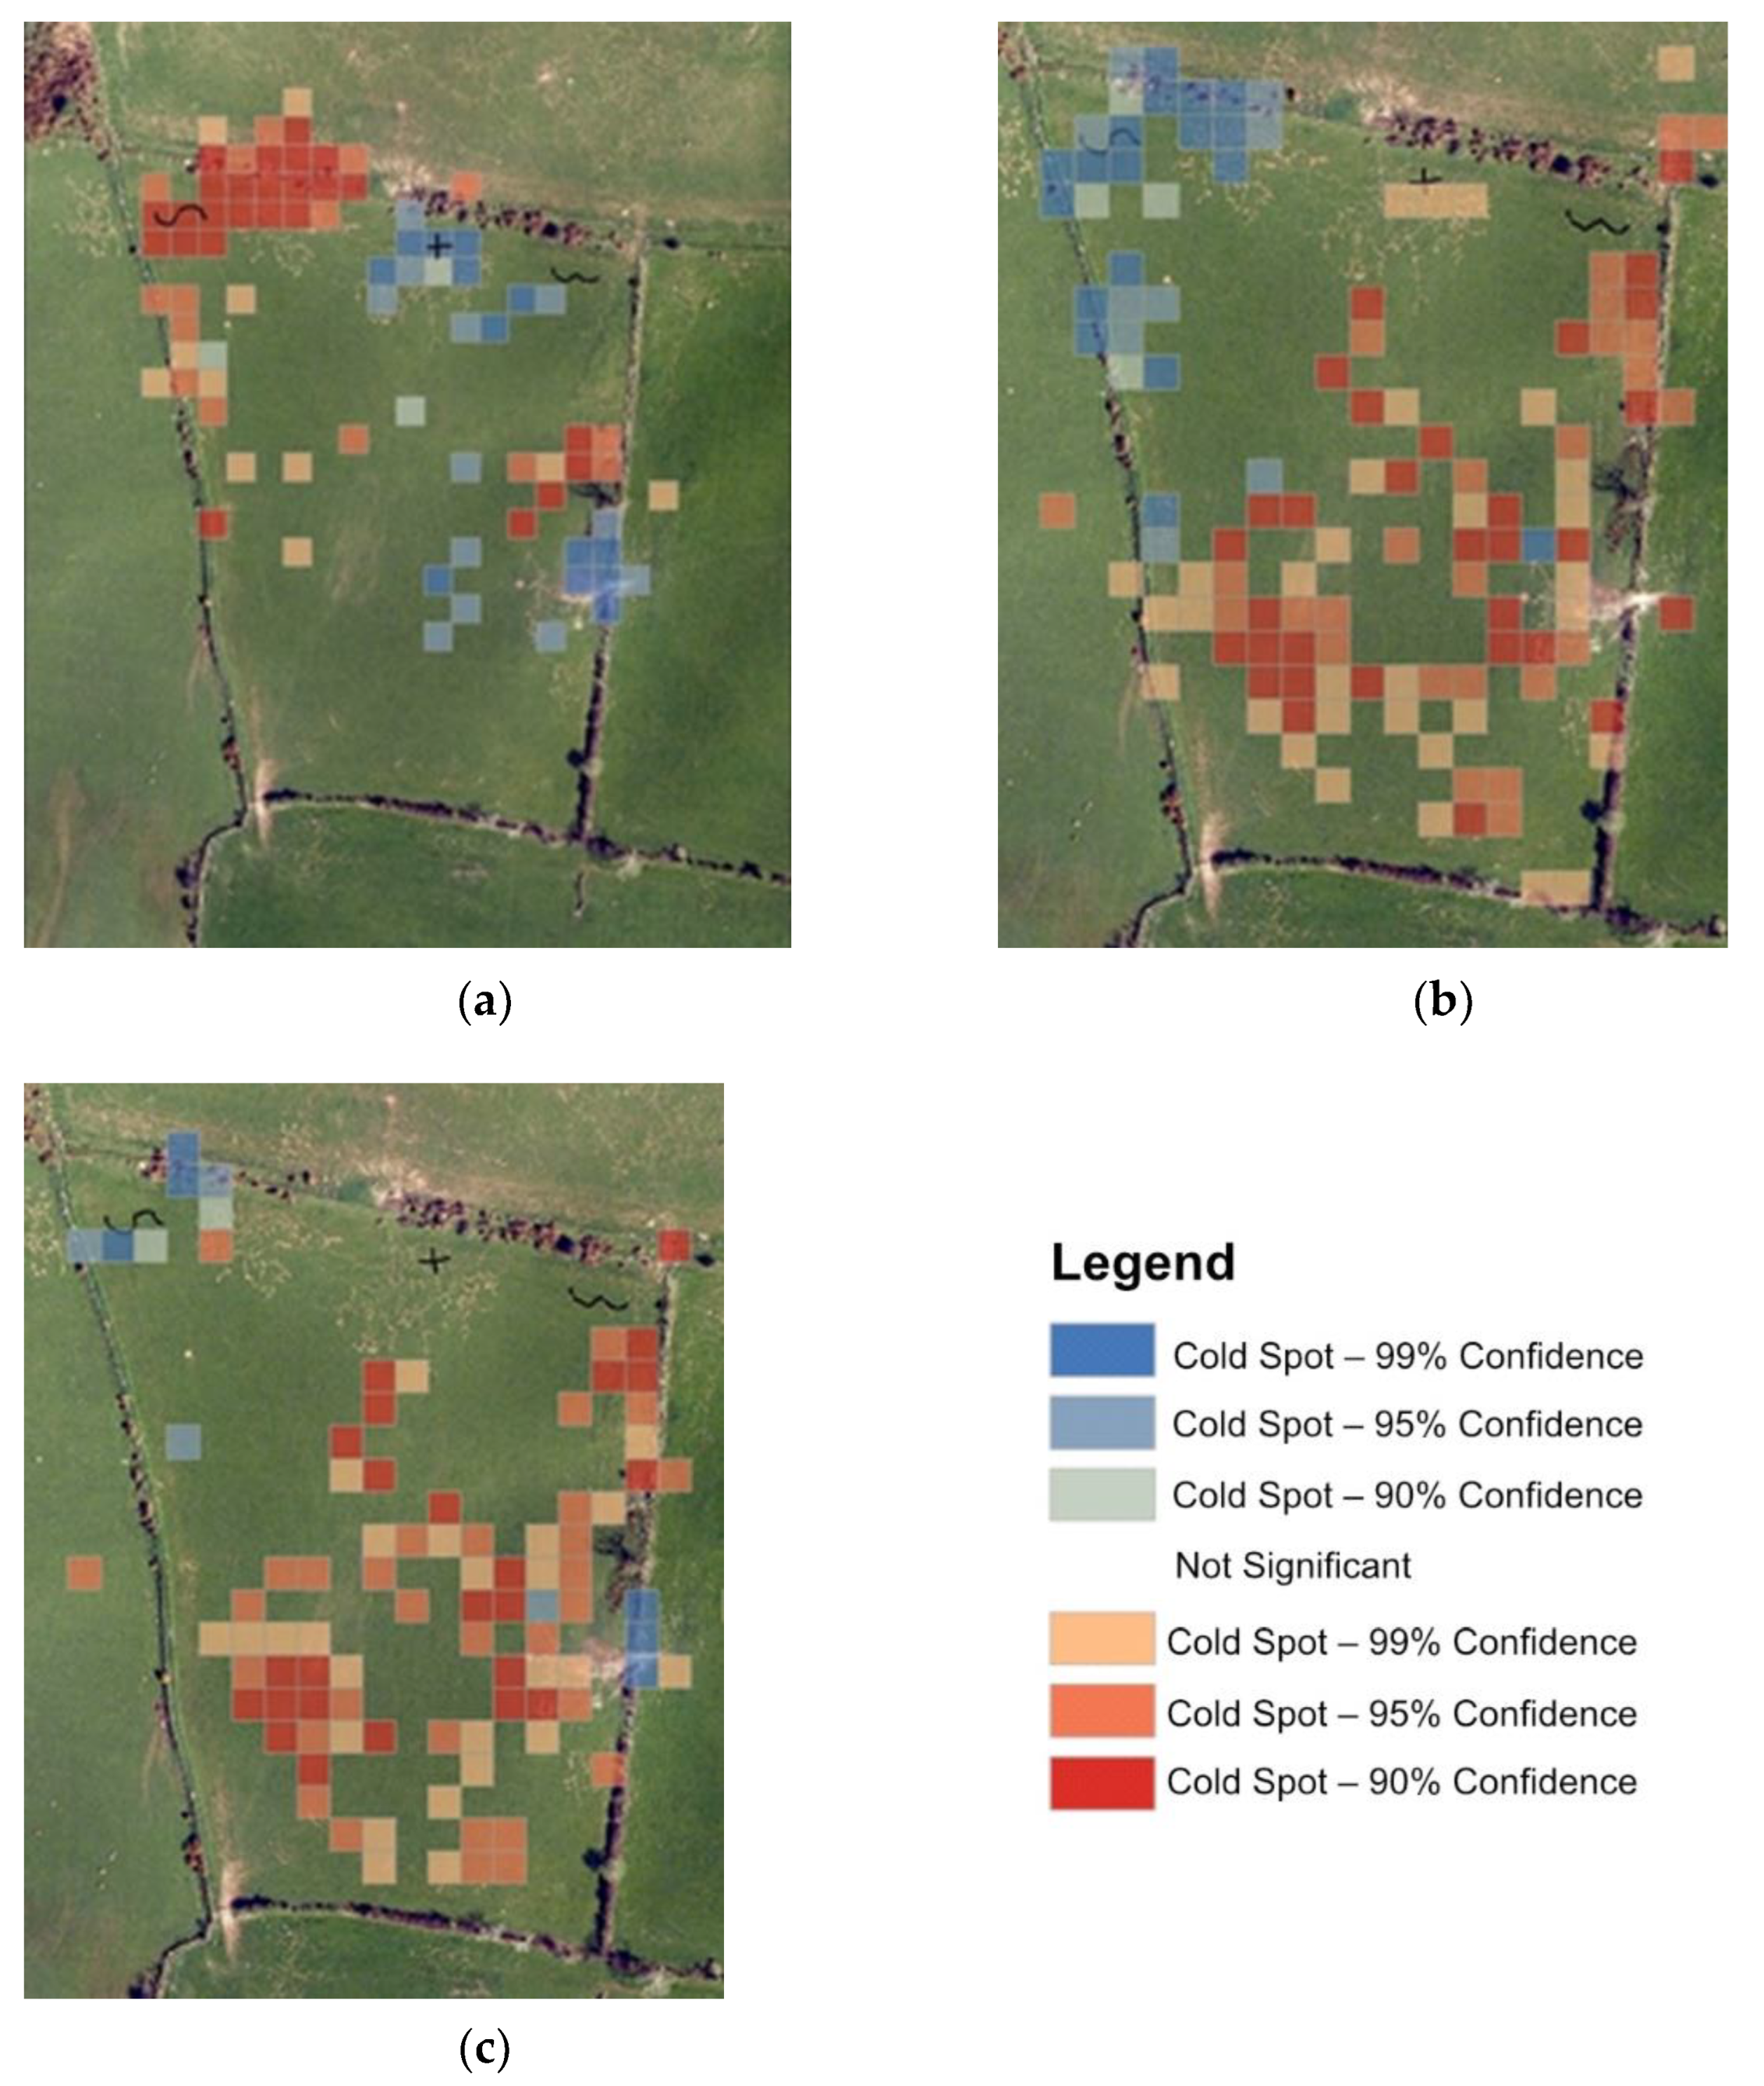
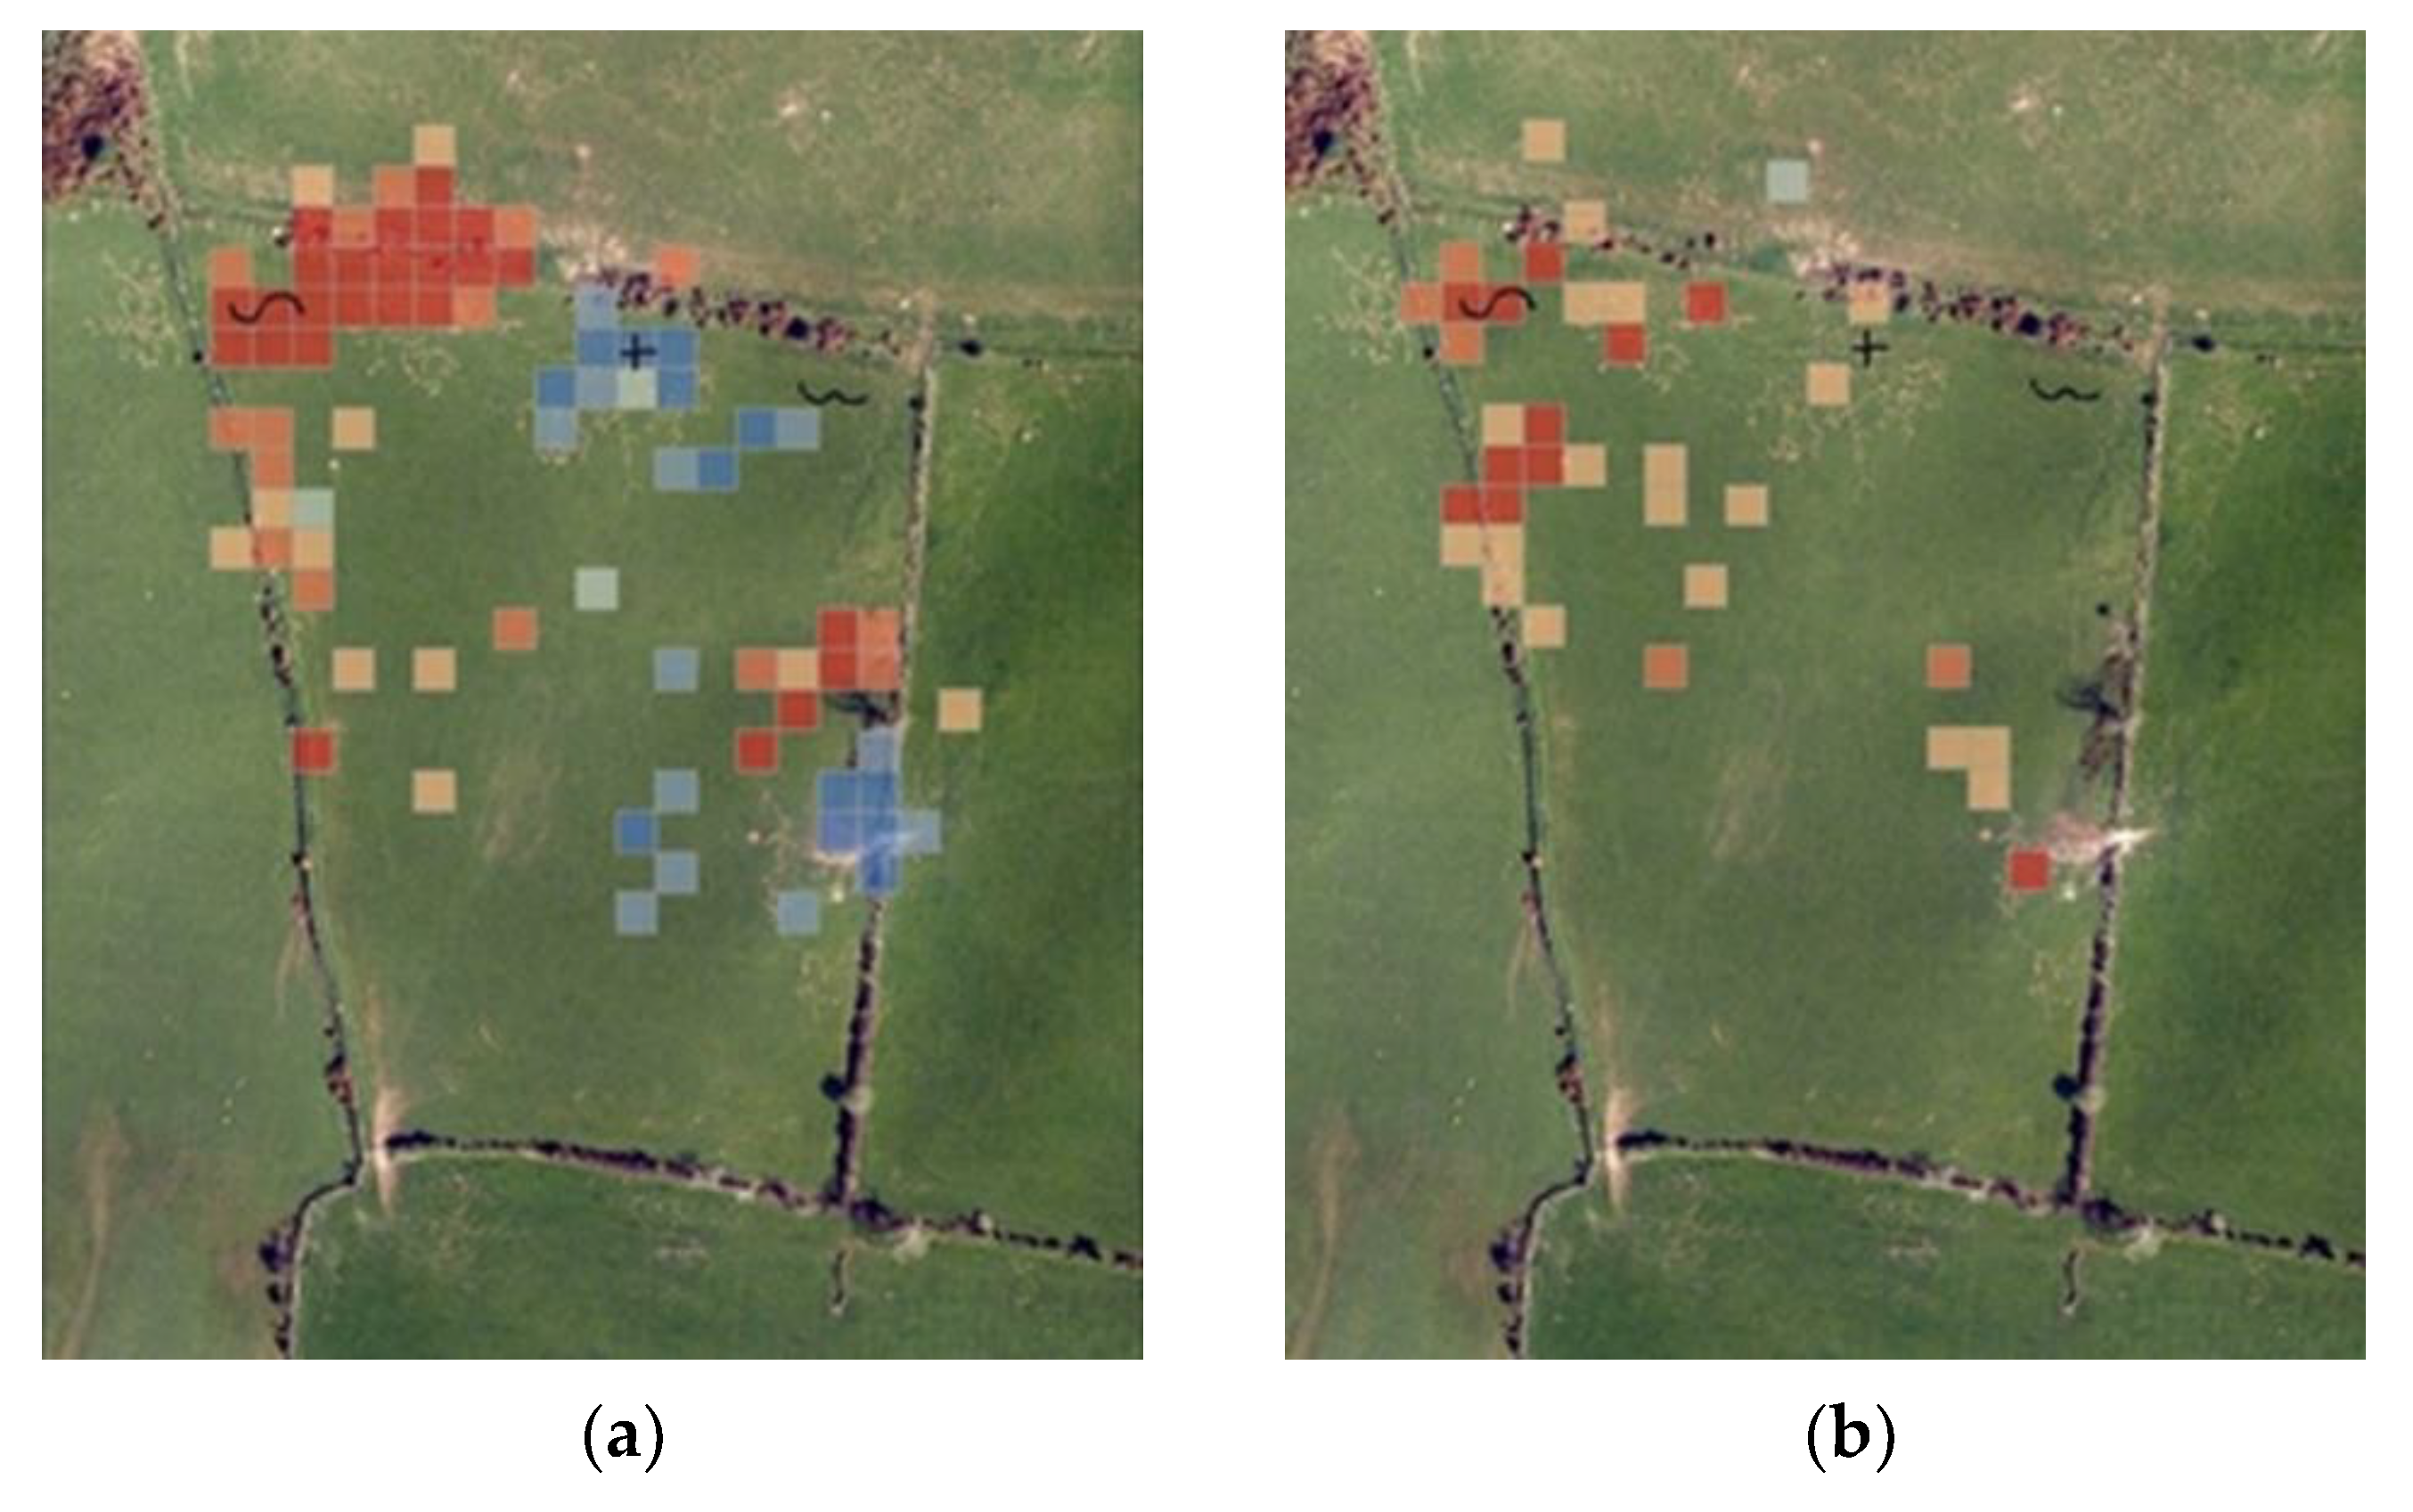
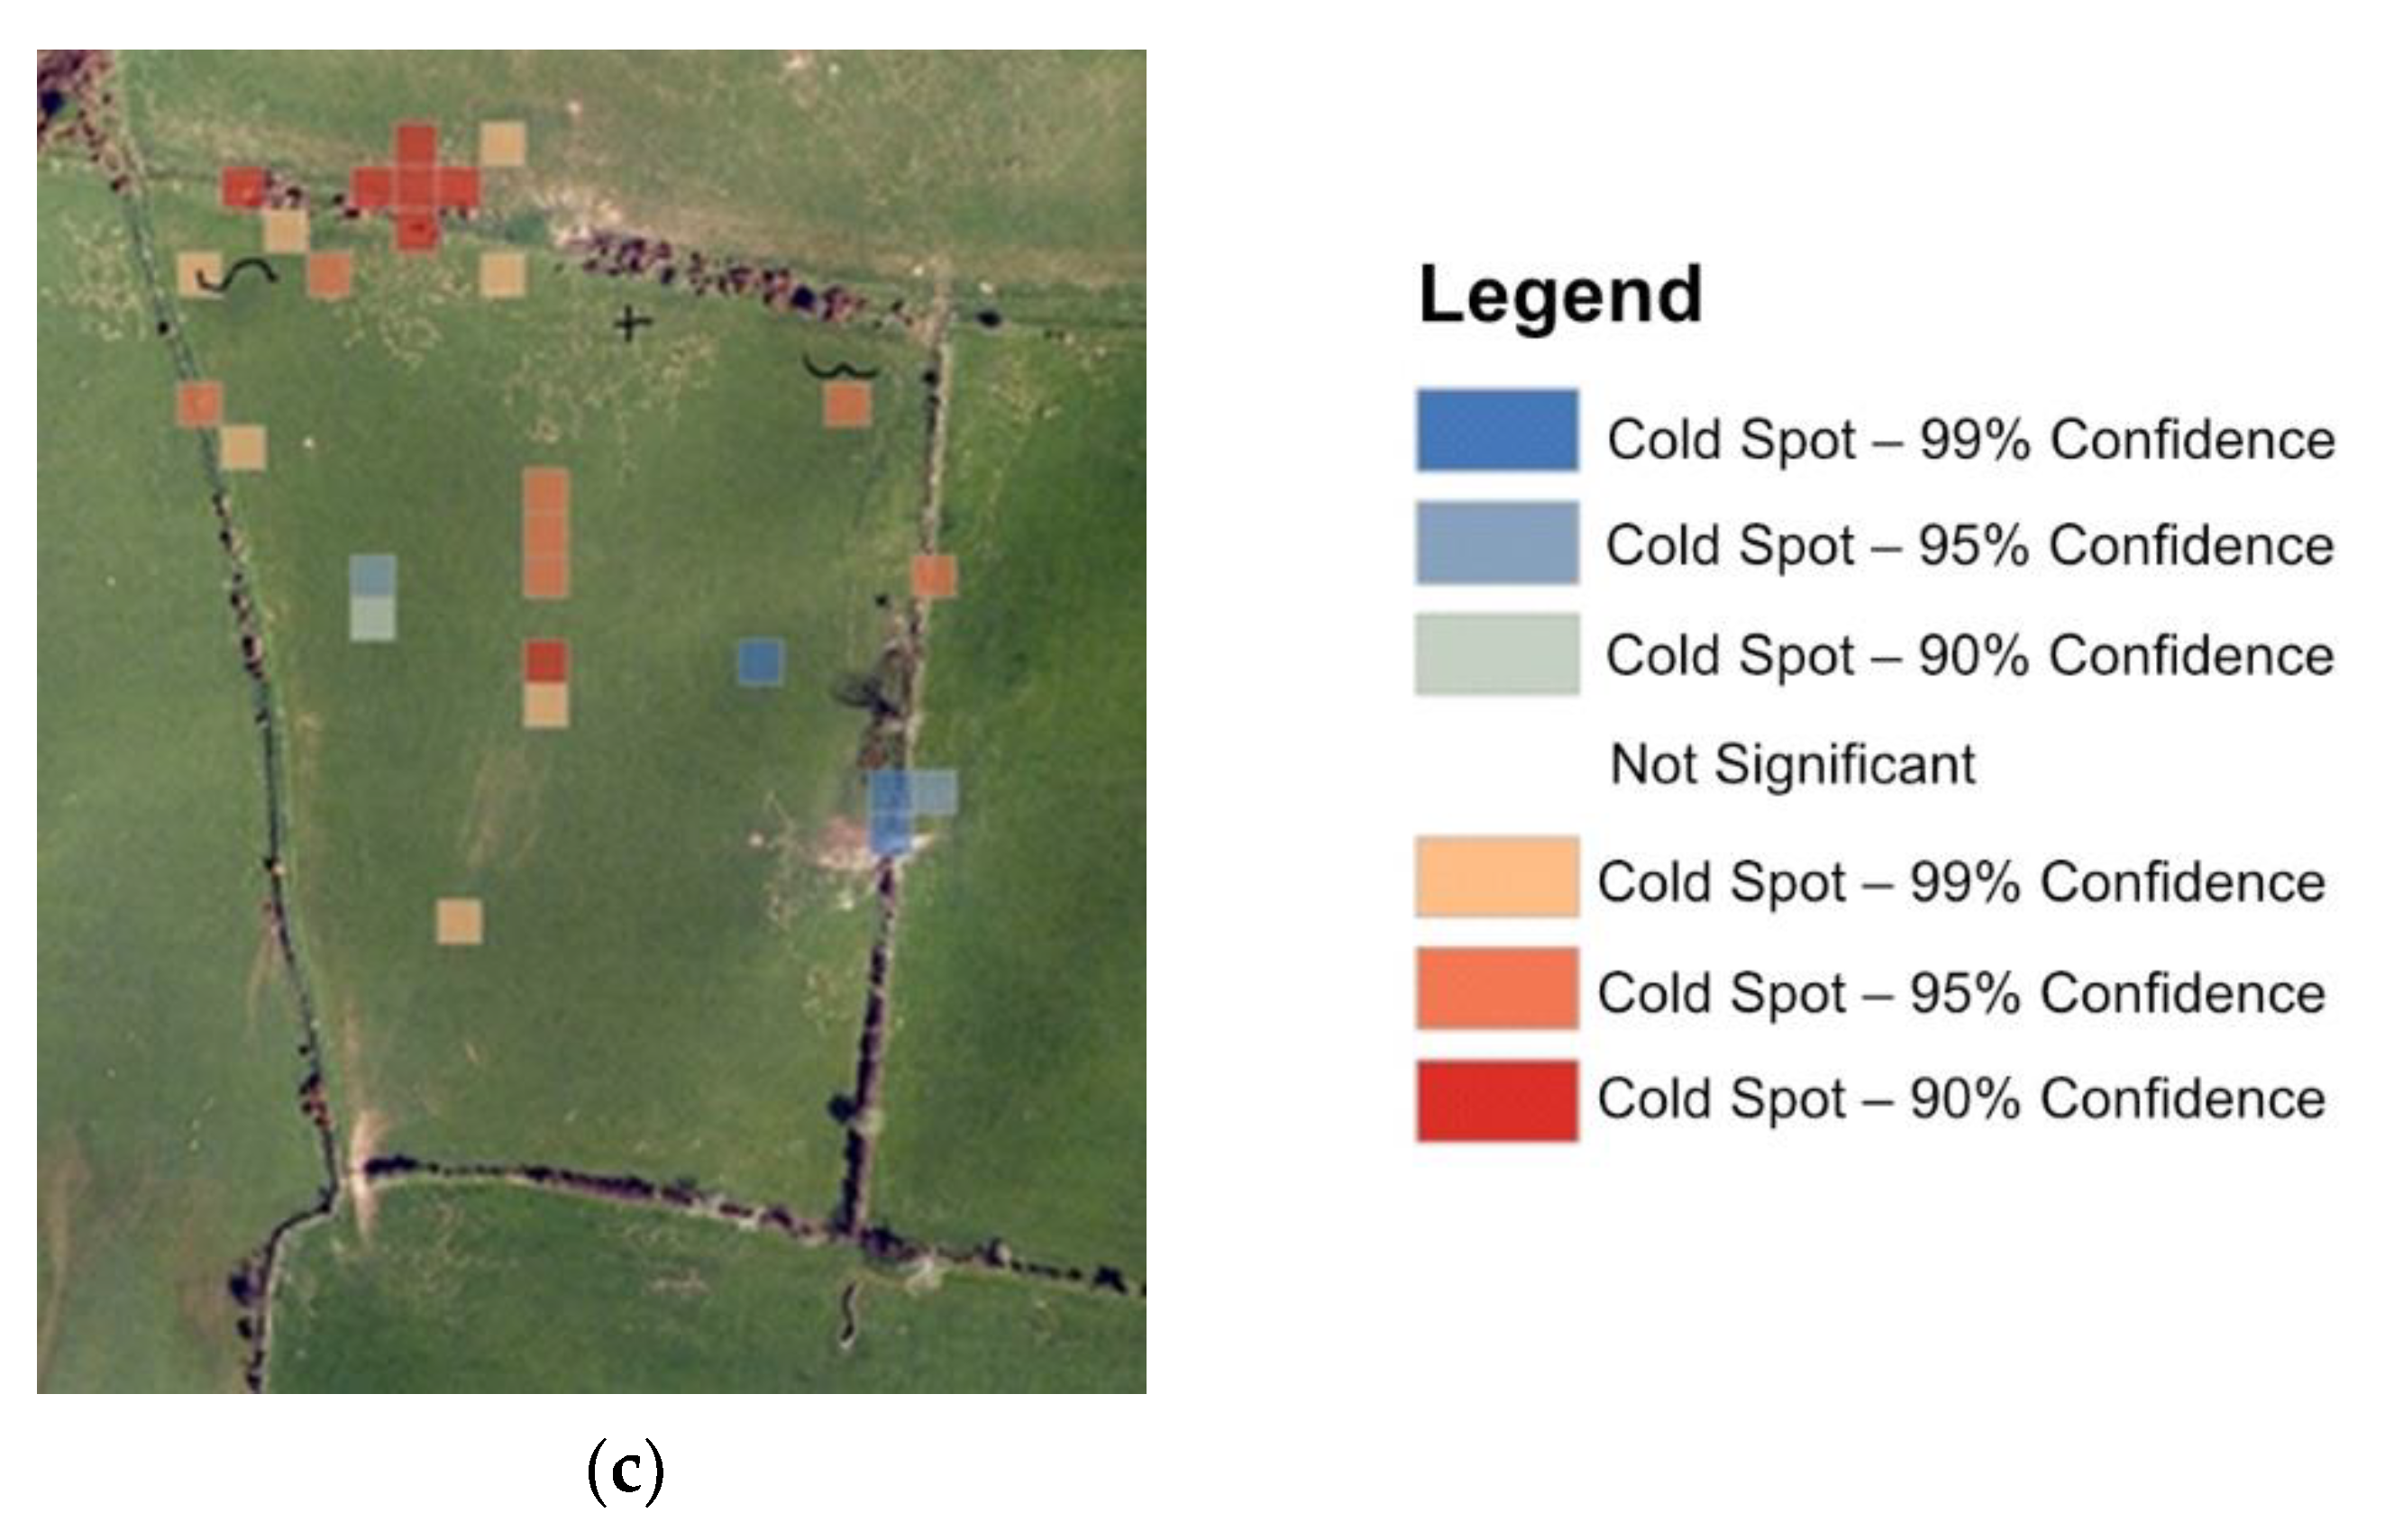
3.2. Hotspot Analysis (Getis-Ord Gi*)

Application of Getis-Ord statistics revealed the presence of significant hot and coldspots for all three weather variables analysed (Figure 3), with a clustering of high values for wind speed and low values for both temperature and wind-chill (p < 0.01) in the north-western portion of the study site, surrounding artificial shelter 1 and the natural shelter. Furthermore, hotspots for both temperature and wind-chill were distributed throughout the exposed region of the field (p < 0.05), with a small cluster of low temperature coldspots on the eastern hedgerow of the field (p < 0.01). Similar coldspots on the perimeter of the field were found for wind-chill on the western boundary of the site (p < 0.01). No hot or coldspots were found to correspond to supplementary shelters 2 or 3.
Figure 3. Getis-Ord Gi* Hotspot Analysis for (a) Wind speed (b) Wind-chill (c) Temperature, a hotspot (red) for wind speed indicates a clustering in sheep locations during high winds, with a coldspot for wind-chill and temperature indicating clustering according to low wind-chill and temperatures. For the associated weather conditions during the study period see Table 2, and for z scores see Table 4.
Forests 13 02133 g003
Stratification of the GPS-weather dataset in to 8 h intervals produced a similar effect to analysis of the whole dataset, with a clustering of high values for wind speed in the north-western corner of the field, around the natural shelter and artificial shelter 1 (p < 0.01) (Figure 4a–c). However, stratification did reveal spatial clustering varied across a 24 h period, with a greater proportion of hot and coldspots present during the morning (00:00–8:00), relative to the daytime (08:00–16:00) and the evening (16:00–00:00 (Figure 4a)).
Figure 4. Getis-Ord Gi* Hotspot Analysis of wind speed during 8 h windows (a) 00:00–08:00 (b) 08:00–16:00 (c) 16:00–00:00. A hotspot (red) for wind speed indicates a clustering in sheep locations during high winds, with a coldspot indicating clustering in sheep position during low winds. For associated z scores, see Table 5.
Forests 13 02133 g004aForests 13 02133 g004b

3.3. Spatial Autocorrelation (Moran’s I)

Results of global spatial autocorrelation (Moran’s I) analysis indicated that a statistically significant clustered pattern (p < 0.01) existed for sheep locations according to temperature, wind-chill and wind speed (Table 6). This effect was consistent when the dataset was tested as a whole, or temporally stratified in to 8 h windows. The greatest degree of clustering (highest Moran’s I) during analysis of the whole dataset was recorded for localised wind speed, followed by wind-chill (Table 6). In fact, spatial autocorrelation analysis of local-scale wind speeds, which are specific to the exact position of the animal, as opposed to the field-scale wind speed recorded by the AWS, resulted in more than doubling in the Moran’s I (from 0.079 to 0.165).
Stratification of the dataset in to 8 h windows resulted in an increase in Moran’s I, which was consistent across all input weather variables, with the only anomalous exception being wind-chill during the 00:00–08:00 period. However, this effect was associated with a decrease in z-scores when compared to spatial autocorrelation for the whole dataset. Analysis of global spatial autocorrelation supports the local-scale hotspots identified through the Getis-Ord Gi* statistics (hotspot analysis), by showing a significant clustering for microclimate components across the whole study area.

3.4. Wind Field Model

The wind field documents reductions in wind speed to below 0.4 of the field-scale, weather station recorded values, with these sheltered areas being associated with the observed shelter structures (Figure 5). Greater wind speed reductions (i.e., lower values of shelter ratio) are predicted closer to natural shelter then are seen immediately adjacent to the three small artificial shelters. Further investigation of spatial correlation revealed a greater association between z score values from the hotspot analysis of wind speed and the localised wind field ratio outputs (0.21; Table 7), when compared to slope (0.05), with both explanatory variables revealing significant correlations (p < 0.01).

3.5. Agent-Based Model

The Net Logo model illustrates the potential effect of cold stress on livestock energy balance and the benefits offered by hedgerow or tree shelter provision configurable from the interface. When sheep agents are in exposed areas of the field, in wind-chill conditions outside of their TCZ, they become cold-stressed and seek shelter on the leeward side of the hedgerows or trees. Sheep energy demand increases when they experience temperatures above the TCZ, and decrements when temperature is below the TNZ. Flock health can be monitored using a line graph of average sheep agent health. In wind-chill conditions below the TCZ energy decreases, after finding shelter energy can be seen to increase due to the increase in wind-chill temperature. The benefits of shelter provision can be demonstrated by employing the same weather parameters in different scenarios, for example applying a temperature of 8 °C and wind speed of 3 m s−1, when run with and without parkland tree cover of 14% results in cold stress and colouring of the agents blue and red (Figure 6). The code used to program the agent-based model can be downloaded in the supplementary material (Code S1: ABM code).

4. Discussion

Investigation of spatial correlation of ewe position according to calculated localised wind speeds, at 1 m spatial resolution, suggests that microclimate is a major factor in influencing sheep behaviour. This is due to the doubling in Moran’s I when the localised wind speed was used instead of field-scale wind speed, which indicates that spatial clustering increases when the topographical features of the field site were accounted for by the wind field model. Indeed, if the ewes were acting independently of the shelter provided by the artificial and natural shelter features, one would expect to see no effect of integrating localised wind speeds.
Statistical analysis of preference indices revealed that ewes had a preference for the areas of natural and artificial shelter, which supports the established preference for these areas [3]. Whilst a significant difference was not recorded between two of the artificial shelters (2 and 3) and the exposed area, analysis at 2 H of the shelter, where one would predict the greatest sheltering effect, still reveals a higher preference for these shelters; see later for discussion of the influence of shelter design on preference. When considering the weather conditions experienced throughout study period, the mean temperature of 6.18 °C ± 2.91 (Table 1) lies outside of the zone of thermal comfort for adult ewes [29], and the average wind speed (3.73 m s−1 or 13.43 km h−1) exceeds the 8 km h−1 threshold of sheltering behaviour for lambing ewes [42]. Consequently, the ewes were often experiencing cold stress, creating the conditions where one could expect to see shelter-seeking behaviour occurring. These environmental parameters, in addition to the preference for sheltered areas, suggest that sheltering behaviour is being exhibited by the ewes.
Furthermore, the preferred sheltered areas are also spatially linked to the significant coldspots, identified during hotspot analysis, for both temperature and wind-chill, which surround the natural shelter, shelter 1 and sections of hedgerow. These indicate that the ewes were utilising these areas during spells of colder weather, relative to the conditions within the study period. In reverse, the large area of hotspots for wind speed identified in the northwest portion of the field, again surrounding the artificial shelter and the natural shelter, reflects a greater proportion of moments where the sheep were in this area during high winds. Again, if utilisation of the sheltered areas was occurring irrespective of microclimate, one would not expect the pattern of hot/coldspots, indicating occupation of these areas during more adverse weather conditions.
Consequently, when considering the ewe preference for sheltered areas, alongside the presence of cold/hotspots in weather variables and the increased clustering according to localised wind effects, this work concludes that shelter-seeking behaviour is being exhibited by the sheep, and that microclimatic factors are a major component in driving this behaviour.
However, it is important to consider other explanations of why the ewes may be clustering in the northwest portion of the field, irrespective of the shelter present there, particularly regarding the lack of utilisation and absence of cold/hotspots overlaying artificial shelters 2 and 3. One such factor, topography, which is known to influence surface wind speed [43], was worthy of investigation due to the presence of a plateau in the northwestern region of the test site. Application of spatial correlation assessment between slope and hotspot z-score value indicates that topography, although significant, is not an important explanatory variable, with a correlation coefficient close-to-zero. In contrast, the spatial correlation between local wind speed ratios and hotspot z-scores reveals local wind speed is correlated with the hotspots, again linking the localised wind dynamics of the site and the utilisation of sheltered areas during periods of high wind. These findings suggest that landscape topography is not driving shelter-seeking behaviour in the ewes.
There were also a small number of contradictory hot/coldspots scattered throughout the exposed region of the test site, which are of note, such as a coldspot for wind-chill. This is hypothesised to reflect the noise that could be expected within a natural experiment using animal subjects, and could be removed in future studies through more nuanced techniques such as cluster-based outlier removal, i.e., small clusters of values far from the main clusters are treated as noise and removed [44]. The cold and hotspots which are within 10–20 m of the natural and artificial shelter are likely to still be within a sheltered zone, as Baker et al. [25], notes how the wind break effect can persist up to 14 times the height of the shelter. The significant coldspot for both wind speed and temperature on the sparsely treed eastern boundary of the test site could be evidence of sheltering from the prevailing south-easterly wind, which would be in accordance with the lone tree sheltering documented in Merino sheep [18]. However, the coldspots may also be anomalous, as the location also contains a gateway to the adjacent field and farm buildings, and closer proximity to anthropogenic influence which could bias the sheep’s occupation of that area [22].
Wind-chill, being a combinatory weather variable, presents greater clusters of coldspots surrounding the sheltered areas, when compared to the analysis of temperature in isolation. Moreover, in the investigation of spatial autocorrelation for the explanatory weather variables in this study, wind-chill reported the greatest Moran’s I and the greatest clustering in sheep location according to high or low wind-chill values. Early research [14] documented how sheltering behaviour was triggered in Scottish Blackface hill sheep when wind speeds exceed 38 km h−1 and at temperatures below freezing, with little effect by other variables such as rain. Consequently, if these earlier studies had calculated wind-chill effect, it seems they would agree that wind-chill is perhaps the most important driver of shelter-seeking behaviour. These findings could illustrate how integration of individual elements of microclimate, such as wind speed and temperature to produce wind-chill, could explain a greater proportion of the microclimate induced variability in sheep behaviour. To test this hypothesis in future studies, further elements of microclimate, such as rain, could be integrated into an explanatory variable using measures such as the sheep chill index [18].
Whilst this paper argues for the importance of microclimate in determining sheep behaviour and spatial positioning, it is important to acknowledge how other temporal and spatial factors, such as social interaction, could be influencing sheep position in any one moment [45]. The presence of hotspots for temperature and wind-chill in the exposed region of the field indicates that the sheep occupy this area in warmer weather (during the spring period of this study), during which they may be displaying non-sheltering behaviour, such as grazing [46]. The temporal variability in behaviour was also recognised by the hotspot analysis of the 8 h stratification of wind speed, where the large cluster of hotspots in the 00:00–08:00 time window indicates the sheep were positioned near the natural and artificial shelter during high wind speeds. During this coldest period of the day, where the sheep are outside their TCZ, high winds shall result in greater loss of heat [9], which explains why greater clustering around the shelters is being observed. In reverse, less of an effect (smaller clusters of hotspots) was noted throughout the warmer periods of the day, when cold stress is less likely to be a determinant of sheep behaviour.
The Moran’s I for wind speed for the 00:00–08:00 time window corresponds to the hotspot analysis, rising from 0.08 for the daily index to 0.21, indicating greater clustering in sheep position according to wind speed in this period, when compared to the remainder of the day. However, this effect was not consistent for wind-chill and temperature, where clustering peaked during daylight hours (08:00–16:00). Again, this could reflect non-shelter-seeking behaviours which cause sheep to cluster, such as grazing or socialising [47], which, depending on the weather, may be more likely to occur during the day [46]. These behaviours could potentially skew any microclimate related clustering documented in the Moran’s indexes. This consideration illustrates the importance of considering shelter-seeking behaviour within a broader framework of dynamic ethological traits [48].
One such trait, predator avoidance, has been documented in domestic sheep [49], and could be influencing the ewes’ occupation of the northwestern portion of the field. As the area presents one of the highest elevation areas, it offers an optimal viewpoint to perceive predators. Furthermore, the sheep could be selecting this area due to the perceived protection from predators offered by the thicker band of gorse, which may represent a vestigial behaviour of predator avoidance-habitat selection that has been noted in non-domestic sheep (Ovis canadensis) [23,50]. However, it should be noted how the occupation of the high elevation areas could be occurring independent of predator avoidance behaviour. These influences could act in conjunction with the cold stress drivers of shelter-seeking behaviour, highlighting how microclimate alone is unlikely to be the sole determinant of this behaviour.
Furthermore, another important factor that could be driving the sheep to utilise the shelter in the northwest corner of the field is the tendency of sheep to navigate in the direction of the prevailing wind, which in this case, was south-easterly. As such, sheep could be moving with the prevailing wind into the north-western corner of the field; however, other studies have documented the opposite behaviour, with sheep navigating into the wind or not being affected by the wind direction [14,51]. A clear limitation of the study is the inability to separate this microclimate-related driver of sheep occupation of the northwest corner (wind direction), and that of microclimatic parameters such as windchill (Table 6; Figure 5), which could have been tested using field-level replication with the shelter location differing between replicates.
In addressing further limitations of this study and considering future research opportunities, whilst the number of sheep tracked in the study was similar to previous studies (e.g., n = 10 in Taylor et al. [18]), increasing both the number of subjects in the study and the number of spatial replicates through the inclusion of multiple fields of different sizes and orientations, would increase the certainty of any generalisable microclimate-driven shelter seeking behaviour being displayed. This principle also applies to the temporal scope of the study, whereby extending the time period to include more extreme weather conditions would enable more robust conclusions regarding sheep responses to microclimate, as argued by Pollard and Littlejohn [22]. One could predict that the shelter-seeking behaviour exhibited in this study could become more pronounced during winter conditions, although this would negate the use of in-lamb ewes [14]. This study was conducted on ewes during the lambing period, which enabled the collection of data related to lamb mortality, cause of death, and other shepherding issues [3], whereas GPS tracking was confined to the monitoring of ewes. GPS tracking of both ewes and lambs at high temporal and spatial resolution could provide data valuable data around mismothering, ewe–lamb interactions and shelter-seeking behaviour. Finally, future studies could place greater emphasis on the utilisation of both the windward and leeward sides of shelter, by further stratifying the data according to the wind direction, which would examine sheltering behaviour in finer resolution.
The continued usage of on-animal sensors to investigate shelter-seeking behaviours also holds promise for future research [52]. For example, GPS collars are advantageous in monitoring behaviour as they are able to record location for 24 h a day, as opposed to only during daylight hours when using visual observations [3]. Furthermore, the integration of skin temperature or posture alteration sensors with the computational approach to calculate localised wind speeds, demonstrated in this study, could provide fine resolution data on microclimate related sheep experience and condition [24]. Combining these methods with GPS technology and research demonstrating economic incentives associated with shelter provision [3], these approaches may be able to provide high resolution, breed-specific behavioural temperature thresholds for livestock species, along with economic incentives to practitioners, which will be necessary information to promote the uptake of silvopastoral interventions [25].
Given the inherently practical nature of the agroforestry research, this work aims to provide useful information to practitioners and researchers working on silvopastoral systems. For example, the iterative framework used to study this upland sheep farm could provide a useful structure for informing decisions regarding silvopastoral intervention. By first establishing a reduction in ‘shepherding problems’, associated with the shelter provision, such as lamb hypothermia, which is a key motivator of practitioners [3], then exploring the underlying drivers of the behaviour/dynamic in this work, the research has provided evidence to practitioners which can inform choice in silvopastoral intervention. This evidence-based approach shall be useful to accompany the likely increase in the application of agroforestry [8].
With regard to the efficacy of the shelter designs in providing effective protection, the drop-in time spent (PI) by shelters 2 and 3 at 5 H indicates that the sheep remained close to the tyre wall when they were sheltering. The greater concave shape of shelter 1 may have provided greater quality shelter when compared to shelters 2 and 3, which is supported by the favouring of shelter 1 at both 2.5 H and 5 H parameterisations. Given the relatively small number of sheep in this study (n = 15), the flock may have also found suitable shelter by utilising just one of the available shelters (shelter 1). The finding of a preference of the “S” shaped shelter contradicts other research [22], which found a preference for a cross “X” shaped design; however, it could be that this may reflect the microclimate dynamics of the site, rather than the shelter design per se.
The greatest preference for any area in test field was for the natural shelter, which indicates that the gorse and ditch in combination offered the best protection to the sheep. This finding is supported by the computed wind field ratios, which documented the greatest sheltering effect (greater area with lowest wind speed ratio) by the gorse and hedgerows (Figure 5). However, when applying the wind field model, it should be noted that the visual lumpiness of the shelter effect is likely to be an artefact of the point sampling used in its construction. Furthermore, the sheltering effect of some hedgerows may be reduced due to a lack of sample points, or large values of height normalised distance for any sample points. Whilst this work documented a preference for natural shelter, the variety of shelter types that are deemed suitable, as reviewed by Pollard [19], suggests that both artificial and natural shelter types can be effective, albeit without any carbon sequestration capability [53] and biodiversity benefits [4] in the former.
As the results of this study are in accordance with previously established cold stress temperature thresholds, the Net Logo model employed these parameters to trigger shelter-seeking behaviour in the agents/sheep. Whilst the ABM model is still in its first iteration, the principle of modelling cold stress in sheep to assess the utility of silvopastoral interventions could be a useful tool for practitioners. With this application in mind, possible expansion on the model could include altering the temperature thresholds to specific breeds, integrating empirical evidence on the productivity loss associated with cold stress, choosing tree planting designs to represent orchards/forestry operations, including grazing behaviour with sheep metabolism, including fodder from hedgerows for livestock and the effects of sheep density on pasture degradation with or without trees.

5. Conclusions

This work examined the microclimatic drivers of shelter-seeking behaviour in sheep, specifically investigating the influence of wind-speed, wind-chill and temperature. The 3- to 4-fold increase in the occupancy of sheltered areas, compared to exposed areas, indicates sheltering was occurring. Furthermore, coldspots and hotspots for wind-chill, temperature and wind speed illustrate how sheep were clustering around sheltered areas during cold periods with high wind. Finally, the effect of integration of local wind speed to double the Moran’s I value, indicates greater spatial clustering according to topographical wind effects of the site. Considering these three lines of evidence, this work argues that shelter-seeking behaviour is being observed in both artificial and natural shelter types. Moreover, wind speed, temperature and wind-chill are revealed to be key variables driving this behaviour, with localised wind speed and wind-chill explaining the greatest variability in sheep position. Alternate behaviours influencing the ewe’s location in any moment may include grazing, socialising, predator avoidance and wind direction driven navigation. The topography of the field was not found to be an important explanatory variable of sheltering behaviour. Further application of GPS technology over longer time periods and in a greater range of weather conditions, shall better develop our understanding of shelter-seeking behaviour in sheep and enable the refinement of the ABM developed in this work. Visualisation of the potential benefits of silvopasture can be a useful tool to inform practitioners and stakeholders to encourage uptake of agroforestry practices.

Supplementary Materials

The code used for construction of the agent based model demonstrating sheep sheltering behaviour can be downloaded at: https://www.mdpi.com/article/10.3390/f13122133/s1, Code S1: ABM code.

Author Contributions

Conceptualization, A.R.S., A.P.W., P.L.D., C.E.P., J.A.-W., S.H. and D.J.; methodology, J.A.-W., S.H. and C.E.P.; formal analysis, J.A.-W. and S.H.; visualization, S.H. and J.A.-W.; supervision, A.R.S., A.P.W., P.L.D. and D.J.; Writing—Review and Editing, J.A.-W., S.H., A.R.S., A.P.W. and P.L.D.; project administration, A.R.S., A.P.W. and D.J.; funding acquisition, A.R.S., A.P.W., P.L.D., D.J. and J.A.-W. All authors have read and agreed to the published version of the manuscript.

Funding

This study was funded by a Knowledge Economy Skills Scholarship (KESS 2) in collaboration with Innovis Ltd. and the Woodland Trust. KESS 2 is a pan-Wales higher level skills initiative led by Bangor University on behalf of the Higher Education sector in Wales. It is part-funded by the Welsh Government’s European Social Fund convergence programme for West Wales and the Valleys, grant number 80815. Further funding was provided by the Santander University Employability Scheme.

Data Availability Statement

Please contact corresponding authors.

Acknowledgments

The authors would like to thank the shepherding staff at the study farm for enabling this trial to be conducted on their breeding flock; without their collaboration this project would not have been possible.

Conflicts of Interest

The authors declare no conflict of interest and the funders had no role in the design of the study; in the collection, analyses, or interpretation of data; in the writing of the manuscript; or in the decision to publish the results.

References

  1. Sinclair, F.L. A general classification of agroforestry practice. Agrofor. Syst. 1999, 46, 161–180. [Google Scholar] [CrossRef]
  2. Lynch, J.J.; Mottershead, B.E.; Alexander, G. Sheltering behaviour and lamb mortality amongst shorn Merino ewes lambing in paddocks with a restricted area of shelter or no shelter. Appl. Anim. Ethol. 1980, 6, 163–174. [Google Scholar] [CrossRef]
  3. Pritchard, C.E.; Williams, A.P.; Davies, P.; Jones, D.; Smith, A.R. Spatial behaviour of sheep during the neonatal period: Preliminary study on the influence of shelter. Animal 2021, 15, 100252. [Google Scholar] [CrossRef] [PubMed]
  4. Varah, A.; Jones, H.; Smith, J.; Potts, S.G. Enhanced biodiversity and pollination in UK agroforestry systems. J. Sci. Food Agric. 2013, 93, 2073–2075. [Google Scholar] [CrossRef] [PubMed]
  5. Prevedello, J.A.; Almeida-Gomes, M.; Lindenmayer, D.B. The importance of scattered trees for biodiversity conservation: A global meta-analysis. J. Appl. Ecol. 2018, 55, 205–214. [Google Scholar] [CrossRef]
  6. Mellor, D.J.; Stafford, K.J. Animal welfare implications of neonatal mortality and morbidity in farm animals. Vet. J. 2004, 168, 118–133. [Google Scholar] [CrossRef] [PubMed]
  7. Bowen, J.P.; Martin, J. The ‘Big Freeze’ of 1962–1963: The loss of livestock, the issue of fodder supply and the problem of the commons in two upland hill-farming regions in England and Wales. Agric. Hist. Rev. 2016, 64, 226–260. [Google Scholar]
  8. Jordon, M.W.; Willis, K.J.; Harvey, W.J.; Petrokofsky, L.; Petrokofsky, G. Implications of Temperate Agroforestry on Sheep and Cattle Productivity, Environmental Impacts and Enterprise Economics. A Systematic Evidence Map. Forests 2020, 11, 1321. [Google Scholar] [CrossRef]
  9. Bianca, W. The signifiance of meteorology in animal production. Int. J. Biometeorol. 1976, 20, 139–156. [Google Scholar] [CrossRef]
  10. Mount, L.E.; Brown, D. The use of meteorological records in estimating the effects of weather on sensible heat loss from sheep. Agric. Meteorol. 1982, 27, 241–255. [Google Scholar] [CrossRef]
  11. McArthur, A.J.; Ousey, J.C. Heat-loss from a wet animal–Changes with time in the heat-balance of a physical model representing a newborn homeotherm. J. Therm. Biol. 1994, 19, 81–89. [Google Scholar] [CrossRef]
  12. McArthur, A.J.; Monteith, J.L. Air movement and heat-loss from sheep.2. Thermal insulation of fleece in wind. Proc. R. Soc. Ser. B-Biol. Sci. 1980, 209, 209–217. [Google Scholar] [CrossRef]
  13. Dwyer, C.M. The welfare of the neonatal lamb. Small Rumin. Res. 2008, 76, 31–41. [Google Scholar] [CrossRef]
  14. Munro, J. The use of natural shelter by hill sheep. Anim. Sci. 1962, 4, 343–349. [Google Scholar] [CrossRef]
  15. Gregory, N.G. The role of shelterbelts in protecting livestock: A review. N. Z. J. Agric. Res. 1995, 38, 423–450. [Google Scholar] [CrossRef]
  16. Baker, T.P.; Moroni, M.T.; Hunt, M.A.; Worledge, D.; Mendham, D.S. Temporal, environmental and spatial changes in the effect of windbreaks on pasture microclimate. Agric. For. Meteorol. 2021, 297, 1–10. [Google Scholar] [CrossRef]
  17. Bird, P.R.; Jackson, T.T.; Kearney, G.A.; Roache, A. Effects of windbreak structure on shelter characteristics. Aust. J. Exp. Agric. 2007, 47, 727–737. [Google Scholar] [CrossRef]
  18. Taylor, D.B.; Schneider, D.A.; Brown, W.Y.; Price, I.R.; Trotter, M.G.; Lamb, D.W.; Hinch, G.N. GPS observation of shelter utilisation by Merino ewes. Anim. Prod. Sci. 2011, 51, 724–737. [Google Scholar] [CrossRef]
  19. Pollard, J.C. Shelter for lambing sheep in New Zealand: A review. N. Z. J. Agric. Res. 2006, 49, 395–404. [Google Scholar] [CrossRef] [Green Version]
  20. Donnelly, J.B.; Lynch, J.J.; Webster, M.E.D. Climatic adaptation in recently shorn merino sheep. Int. J. Biometeorol. 1974, 18, 233–247. [Google Scholar] [CrossRef]
  21. Mcarthur, A.J.; Monteith, J.L. Air movement and heat loss from sheep. I. Boundary layer insulation of a model sheep, with and whoitut fleece. Proc. R. Soc. London. Ser. B Biol. Sci. 1980, 209, 187–208. [Google Scholar] [CrossRef]
  22. Pollard, J.C.; Littlejohn, R.P. Shelter for lambing in southern New Zealand. II. Sheltering behaviour and effects on productivity. N. Z. J. Agric. Res. 1999, 42, 171–177. [Google Scholar] [CrossRef] [Green Version]
  23. Aycrigg, J.L.; Wells, A.G.; Garton, E.O.; Magipane, B.; Liston, G.E.; Prugh, L.R.; Rachlow, J.L. Habitat selection by Dall’s sheep is influenced by multiple factors including direct and indirect climate effects. PLoS ONE 2021, 16, e0248763. [Google Scholar] [CrossRef] [PubMed]
  24. Fogarty, E.S.; Swain, D.L.; Cronin, G.; Trotter, M. Autonomous on-animal sensors in sheep research: A systematic review. Comput. Electron. Agric. 2018, 150, 245–256. [Google Scholar] [CrossRef]
  25. Baker, T.P.; Moroni, M.T.; Mendham, D.S.; Smith, R.; Hunt, M.A. Impacts of windbreak shelter on crop and livestock production. Crop Pasture Sci. 2018, 69, 785. [Google Scholar] [CrossRef]
  26. Carslaw, D.C.; Ropkins, K. openair–An R package for air quality data analysis. Environ. Model. Softw. 2012, 27–28, 52–61. [Google Scholar] [CrossRef]
  27. Ltd, I. Innovis Breeding Sheep. Available online: https://www.innovis.org.uk/breeding-sheep/ (accessed on 22 November 2022).
  28. Russel, A. Body condition scoring of sheep. Pract. 1984, 6, 91–93. [Google Scholar] [CrossRef]
  29. He, Y.F.; Jones, P.J.; Rayment, M. A simple parameterisation of windbreak effects on wind speed reduction and resulting thermal benefits to sheep. Agric. For. Meteorol. 2017, 239, 96–107. [Google Scholar] [CrossRef] [Green Version]
  30. Wales, N.R. LiDAR Composite Dataset. Available online: https://lle.gov.wales/catalogue/item/LidarCompositeDataset/?lang=en (accessed on 16 November 2021).
  31. Maclean, I.M.D.; Mosedale, J.R.; Bennie, J.J. Microclima: An r package for modelling meso- and microclimate. Methods Ecol. Evol. 2019, 10, 280–290. [Google Scholar] [CrossRef] [Green Version]
  32. Maps, G. Innovis field site. Available online: https://www.arcgis.com/apps/fieldmaps/ (accessed on 18 November 2021).
  33. Pebesma, E.J. Multivariable geostatistics in S: The gstat package. Comput. Geosci. 2004, 30, 683–691. [Google Scholar] [CrossRef]
  34. Graler, B.; Pebesma, E.; Heuvelink, G. Spatio-Temporal Interpolation using gstat. R J. 2016, 8, 204–218. [Google Scholar] [CrossRef]
  35. Wickham, H.; Averick, M.; Bryan, J.; Chang, W.; Mcgowan, L.; François, R.; Grolemund, G.; Hayes, A.; Henry, L.; Hester, J.; et al. Welcome to the Tidyverse. J. Open Source Softw. 2019, 4, 1686. [Google Scholar] [CrossRef] [Green Version]
  36. Wickham, H. Ggplot2: Elegant Graphics for Data Analysis; Springer: New York, NY, USA, 2016. [Google Scholar]
  37. Broster, J.C.; Dehaan, R.L.; Swain, D.L.; Robertson, S.M.; King, B.J.; Friend, M.A. Shelter type and birth number influence the birth and death sites of lambs and ewe movement around lambing time. J. Anim. Sci. 2017, 95, 81–90. [Google Scholar] [CrossRef] [PubMed]
  38. ESRI. How Spatial Autocorrelation Analysis Works. Available online: https://pro.arcgis.com/en/pro-app/latest/tool-reference/spatial-statistics/h-how-spatial-autocorrelation-moran-s-i-spatial-st.htm (accessed on 12 November 2021).
  39. Getis, A.; Ord, J.K. The analysis of spatial association by use of distance statistics. Geogr. Anal. 1992, 24, 189–206. [Google Scholar] [CrossRef]
  40. Wilensky, U.; Reisman, K. Thinking Like a Wolf, a Sheep, or a Firefly: Learning Biology Through Constructing and Testing Computational Theories—An Embodied Modeling Approach. Cogn. Instr. 2006, 24, 171–209. [Google Scholar] [CrossRef]
  41. Wilensky, U. NetLogo Flocking Model. 1998. Available online: https://ccl.northwestern.edu/netlogo/models/Flocking (accessed on 21 November 2021).
  42. Winfield, C.J.; Brown, W.; Lucas, I.A.M. Sheltering behaviour at lambing by Welsh Mountain ewes. Anim. Sci. 1969, 11, 101–105. [Google Scholar] [CrossRef]
  43. Ngo, T.T.; Letchford, C.W. Experimental study of topographic effects on gust wind speed. J. Wind. Eng. Ind. Aerodyn. 2009, 97, 426–438. [Google Scholar] [CrossRef]
  44. Xiong, H.; Pandey, G.; Steinbach, M.; Kumar, V. Enhancing data analysis with noise removal. IEEE Trans. Knowl. Data Eng. 2006, 18, 304–319. [Google Scholar] [CrossRef]
  45. Ramseyer, A.; Boissy, A.; Thierry, B.; Dumont, B. Individual and social determinants of spontaneous group movements in cattle and sheep. Animal 2009, 3, 1319–1326. [Google Scholar] [CrossRef]
  46. Champion, R.A.; Rutter, S.M.; Penning, P.D.; Rook, A.J. Temporal variation in grazing behavior of sheep and the reliability of sampling periods. Appl. Anim. Behav. Sci. 1994, 42, 99–108. [Google Scholar] [CrossRef]
  47. Sibbald, A.M.; Oom, S.P.; Hooper, R.J.; Anderson, R.M. Effects of social behaviour on the spatial distribution of sheep grazing a complex vegetation mosaic. Appl. Anim. Behav. Sci. 2008, 115, 149–159. [Google Scholar] [CrossRef]
  48. Dumont, B.; Boissy, A. Grazing behaviour of sheep in a situation of conflict between feeding and social motivations. Behav. Process. 2000, 49, 131–138. [Google Scholar] [CrossRef] [PubMed]
  49. Beausoleil, N.J.; Stafford, K.J.; Mellor, D.J. Sheep show more aversion to a dog than to a human in an arena test. Appl. Anim. Behav. Sci. 2005, 91, 219–232. [Google Scholar] [CrossRef]
  50. Festabianchet, M. Seasonal range selection in bighorn sheep–Conflicts between forage quality, forage quantity, and predator avoidance. Oecologia 1988, 75, 580–586. [Google Scholar] [CrossRef] [PubMed]
  51. Hutson, G.D.; Vanmourik, S.C. Effect of artificial wind on sheep movement along indoor races. Aust. J. Exp. Agric. 1982, 22, 163–167. [Google Scholar] [CrossRef]
  52. Silva, S.R.; Sacarrão-Birrento, L.; Almeida, M.; Ribeiro, D.M.; Guedes, C.; González Montaña, J.R.; Pereira, A.F.; Zaralis, K.; Geraldo, A.; Tzamaloukas, O.; et al. Extensive Sheep and Goat Production: The Role of Novel Technologies towards Sustainability and Animal Welfare. Animals 2022, 12, 885. [Google Scholar] [CrossRef] [PubMed]
  53. Kumar, B.; Nair, P. Carbon Sequestration Potential of Agroforestry Systems: Oppoortunities and Challenges; Springer: Dordrecht, The Netherlands, 2011; Volume 8. [Google Scholar]
Figure 1. Satellite image of the study area demonstrating natural (band of vegetation at the northern boundary of the field) and artificial shelters (black symbols). Getmapping Plc© (Fleet, UK).
Forests 13 02133 g001
Figure 2. Predominant wind direction coming from the south-east and accompanying wind speeds during the study period (constructed using the openair R package [26]).
Forests 13 02133 g002
Figure 5. Shelter ratio (reduction in wind speed from ambient weather station normalised to a value of 1) for south easterly wind direction. Shelter structures are depicted with green outline and no estimated shelter effect within the shelter. Artificial shelters are visible as the irregular shapes near the top of the field and natural shelters are larger and distributed around the perimeter of the field.
Forests 13 02133 g005
Figure 6. Net Logo model demonstrating shelter-seeking behaviour in sheep. Model parameters set using light-green boxes (sliders, switches and choosers) and model monitored using beige boxes (monitors, e.g. ‘Average sheep energy’) (a) No shelter is provided and a windchill below the thermal comfort zone results in a lowering of agent energy, illustrated by the colour of agents (sheep) changing from black to blue and eventually red before reaching an energy of zero and being removed (b) Parkland trees are incorporated into the landscape and shown as brown patches with leeward shelter effect shown in brown-green, in this scenario the energy of the agents remains comfortable in cold condition when the agents are located near shelter.
Forests 13 02133 g006
Table 1. Description of artificial shelters, shape, physical dimensions, and optical porosity used to evaluate the shelter-seeking behaviour of sheep. Reproduced from Pritchard et al., 2021 [3].
NameShapeHeight (m)Length (m)Breadth (m)Optical
Porosity (%)
Shelter 1Elongated S0.716.55.50.05
Shelter 2Cross0.78.07.50.05
Shelter 3Elongated S0.726.58.50.05
Table 2. Weather conditions (± standard error) at the experimental site during the study period (1 to 14 April 2019).
Weather Variable
Temperature (°C)Wind-Speed (m s−1)Rain (mm)Wind-Chill (°C)
Mean6.18 ± 0.11Mean3.73 ± 0.09Total27.4Mean3.69 ± 0.14
Minimum0.6Minimum0Daily Average1.96 ± 0.05Minimum−5.3
Maximum13.1Maximum9.8 Maximum13.1
Table 3. Ewe preference index values for zones defined using 2.5 and 5 times the shelter height to define the sheltered region and the exposed area of the trial field. Data are mean ± standard error (n = 6) with superscript letters indicating statistically significant (p < 0.05) difference between areas.
DistancePreference Utilisation Areas
Shelter 1 (S)Shelter 2 (+)Shelter 3 (W)Natural ShelterExposed Area
2.5 H5.63 a (±1.48)2.17 ab (±0.95)2.34 ab (±0.85)5.11 ab (±1.18)1.46 b (±0.07)
5 H4.36 acde (±0.82)1.01 abcdef (±0.95)0.56 bcdef (±0.19)4.94 abcef (±1.05)1.46 abdf (±0.55)
Table 4. Z scores relating to the significant hot and coldspots from the Getis-Ord Gi* Analysis (Figure 3).
Hotspot Analysis OutputWeather Variable
Figure ColourHot/ColdspotConfidence IntervalWind SpeedWind-ChillTemperature
Z Score RangeZ Score RangeZ Score Range
Lower UpperLower UpperLower Upper
Cold99% Confidence−3.25−8.88−3.38−7.52−3.34−6.31
Cold95% Confidence−2.45−2.87−2.58−3.15−2.65−3.01
Cold90% Confidence−2.15−2.39−2.28−2.47−2.30−2.43
Hot90% Confidence2.122.492.162.492.282.60
Hot95% Confidence2.53.142.533.132.643.29
Hot99% Confidence3.158.153.155.373.334.91
Table 5. Z scores relating to the significant hot and coldspots from the Getis-Ord Gi* Analysis (Figure 4).
Hotspot Analysis OutputWeather Variable and Time of Day
Figure ColourHot/ColdspotConfidence IntervalWind SpeedWind SpeedWind Speed
00:00–08:0008:00–16:0016:00–00:00
Z Score RangeZ Score RangeZ Score Range
Lower UpperLower UpperLower Upper
Hot99% Confidence2.957.753.485.203.295.39
Hot95% Confidence2.352.932.923.022.752.97
Hot90% Confidence1.992.242.482.882.422.61
Cold90% Confidence−2.05−2.21−2.89~−2.48~
Cold95% Confidence−2.34−2.94~~−3.00−3.18
Cold99% Confidence−2.96−4.38~~−3.66−4.99
Table 6. Summary of significant Moran’s I values for the weather variables wind speed, wind-chill and temperature at various temporal scales with accompanying temporally stratified mean weather values ± standard error. Moran’s I, on a scale of 0–1, indicates a clustering of high/low values, i.e., clustering of sheep positions when temperature was warmer or colder.
Spatial ScaleTime PeriodWeather Variable Moran’s
Index
Expected IndexVariancez-Scorep Value
Wind speed (m s−1)
Field00:00–24:003.73 ± 0.090.08−0.0000860.00000258.61<0.01
00:00–08:003.91 ± 0.190.21−0.0002370.00001357.06<0.01
08:00–16:004.49 ± 0.200.08−0.0002500.00001620.47<0.01
16:00–00:002.91 ± 0.170.09−0.0000230.00002318.53<0.01
Local00:00–24:00n/a0.17−0.0000860.000002121.96<0.01
Wind-chill (°C)
Field00:00–24:003.69 ± 0.140.11−0.0000860.00000451.79<0.01
00:00–08:001.65 ± 0.270.08−0.0002370.00001321.85<0.01
08:00–16:004.31 ± 0.320.15−0.0002500.00001637.79<0.01
16:00–00:005.14 ± 0.300.11−0.0000230.00002322.88<0.01
Temperature (°C)
Field00:00–24:006.18 ± 0.110.05−0.0000860.00000258.91<0.01
00:00–08:004.49 ± 0.200.10−0.0002370.00001327.5<0.01
08:00–16:007.13 ± 0.230.16−0.0002500.00001640.91<0.01
16:00–00:006.99 ± 0.260.14−0.0000230.00002330.03<0.01
Table 7. Spatial correlation of slope and wind speed with z-scores outputs from hotspot (Getis-Ord Gi*) analysis for the prevailing south easterly wind direction.
Explanatory Variable Test
Statistic
Correlation
Coefficient (r)
95% CId.f. p Value
Wind speed 55.9130.21390.2065–0.221265,180p < 0.01
Slope13.7930.05390.0462–0.061565,180p < 0.01
Publisher’s Note: MDPI stays neutral with regard to jurisdictional claims in published maps and institutional affiliations.

