Article

Genome-Wide Comprehensive Analysis of PtLACs: Prediction and Verification of the Functional Divergence of Tandem-Duplicated Genes

1
The Tree and Ornamental Plant Breeding and Biotechnology Laboratory of National Forestry and Grassland Administration, Institute of Tree Development and Genome Editing, College of Biological Sciences and Bio-Technology, Beijing Forestry University, 35 Tsinghua East Road, Beijing 100083, China
2
State Key Laboratory of Tree Genetics and Breeding, Chinese Academy of Forestry, Beijing 100091, China
*
Author to whom correspondence should be addressed.
Forests 2022, 13(2), 157; https://doi.org/10.3390/f13020157
Submission received: 29 November 2021 / Revised: 14 January 2022 / Accepted: 18 January 2022 / Published: 20 January 2022
(This article belongs to the Section Genetics and Molecular Biology)

Abstract

:
Laccases (EC 1.10.3.2) have been widely considered to participate in the metabolic processes of lignin synthesis, osmotic stress response, and flavonoid oxidation in higher plants. The research into Populus trichocarpa laccase focused on the synthesis of lignin in the past few years. In this study, for the first time, a comprehensive analysis of 53 laccase copies in the P. trichocarpa genome was conducted. Positive selection analysis using the branch-site model indicated that LAC genes in terrestrial plants have undergone selective pressure for adaptive evolution. On the basis of the phylogenetic relationship, we reconstructed the evolutionary process of terrestrial plant laccase and found that this gene family began to expand during the evolution of angiosperms. Tandem duplication is the main form of expansion of the PtLAC gene family. The analysis of the sequence characteristics, gene structure, expression pattern, and gene synonymous mutation rate of PtLACs provided a theoretical basis for the functional divergence of tandem duplicated genes. The synonymous mutation rate was used to quantify the divergence time of 11 tandem duplicated gene clusters. Cluster 2, with the earliest divergence time and lower share of sequence similarity, and cluster 5, with the latest divergence time and higher share of similarity, were selected in this study to explore the functional divergence of tandem-duplicated gene clusters. Tobacco subcellular localization and Arabidopsis transgenes verified the functional differentiation of PtLAC genes in cluster 2 and the functional non-differentiation of PtLAC genes in cluster 5. The results of this study provide a reference for the functional differentiation of tandem-duplicated PtLAC.

1. Introduction

Laccase (p-diphenol, EC1.10.3.2) is a copper-containing glycoprotein oxidase. Plant laccase is a ubiquitous multifunctional protein that encodes a large gene family. Oryza sativa L. [1], Brachypodium distachyon (L.) Beauv. [2], and Arabidopsis thaliana (L.) Heynh. [3] have 30, 29, and 17 laccase genes, respectively. The functions of some plant laccases have been revealed through genetics and molecular biology strategies. For example, Arabidopsis laccases AtLAC4, AtLAC11, and AtLAC17 play a key role in the polymerization of lignin [4]. AtLAC15 is involved in the oxidative polymerization of flavonoids [5]. O. sativa laccases Os12g15680 and Os01g63180 participate in herbicide degradation [6]. Zea mays Linn. laccase ZMLAC1 responds to salt stress in maize roots [7]. The cotton laccase GaLAC1 enhances the resistance of Arabidopsis to phenolic allelochemicals [8].
Comparative plant genomics studies confirmed that plant gene families are largely conserved [9]. However, lineage-specific fluctuations in gene family size often occur [9,10,11]. This kind of fluctuation is produced by gene duplication and is specifically used to improve plant adaptability. Plants have a higher gene duplication rate than most eukaryotes [12]. Most of these plant gene copies are derived from whole-genome replication and/or tandem duplication. Earlier studies showed that many repeated genes are retained during the evolutionary process, and that these genes have functional divergence [13]. The effect of duplication mechanism on gene retention has been studied in different species [14,15]. It is a key issue that needs to be discussed in depth in the study of the evolution of gene families.
The whole-genome sequence of P. trichocarpa has been reported in 2006 as the first woody plant genome data [16]. P. trichocarpa has experienced three genome duplication events, the most recent of which occurred approximately 60–65 million years ago. The annotation results of the P. trichocarpa genome identified about 45,555 protein-coding gene loci. About 4839 tandem-duplicated genes are present in P. trichocarpa and account for 10.6% of the total number of genes [16]. Whether the genes produced by tandem or segment duplication have functional redundancy is of concern. The laccases PtLAC3 (Poptri.010G193100) and PtLAC2 (Poptri.008G064000) of P. trichocarpa are a pair of genes produced by segmental duplication. After inhibition of the expression of PtLAC3, the lignin content and composition are not significantly changed in P. trichocarpa. The growth and development of P. trichocarpa are not affected, but the integrity of the xylem fiber cell wall is affected [17]. Anthony C. Bryan has shown that reducing the expression of PdLAC2 (the ortholog of PtLAC2) can cause changes in the syringyl/guaiacyl ratio of Populus deltoides. PdLAC2 is considered to be involved in the oxidation of phenolics and the binding of flavonoids that interact with cell wall lignin [18]. These findings indicate that the genes produced by segmental duplication have functional differences. However, the current research on the function of tandem-duplicated genes in plants is rare. Therefore, studies of gene function are necessary to reveal the functional differentiation of tandem duplicates.
Populus trichocarpa Torr. & Gray, a model woody species with complete genome information, is used as the research object. In this work, we evaluated the phylogenetic relationship of laccase in land plants and proposed a new classification for the laccase gene family of P. trichocarpa. The evolutionary course of the P. trichocarpa laccase gene family is inferred in accordance with the phylogenetic relationship. The 53 P. trichocarpa laccases are divided into seven subclasses (subfamily I–VII). The genetic map of the P. trichocarpa chromosome shows that PtLACs form 11 gene clusters through tandem duplication. This study analyzed the molecular evolution, gene structure, and expression patterns of tandem-duplicated genes in P. trichocarpa to investigate the functional divergence of tandem-duplicated genes. Gene clusters 2 and 5 are predicted to be likely and unlikely, respectively, to be functionally divergent. Tobacco subcellular localization and transgenic Arabidopsis mutants confirmed the functional differences between these two gene clusters.

2. Materials and Methods

2.1. Identification of the Laccase Gene Family from P. trichocarpa

We obtained the nucleotide and amino acids sequences of 17 AtLAC genes, as described by Turlapati PV [3]. Then, AtLAC amino acid sequences were set as queries to search the P. trichocarpa genome version v3.1 [16] in Phytozome v13 database (https://phytozomenext.jgi.doe.gov/info/Ptrichocarpa_v3_1, accessed on 5 July 2021) with the TBLASTN program. All output genes within default E-value (<0.1) were collected and the complete Cu-oxidase domain shared by the LAC gene family was confirmed by searching the NCBI’s conserved domain database (https://www.ncbi.nlm.nih.gov/Structure/cdd/wrpsb.cgi, accessed on 5 July 2021) with E-value < 0.01. BioEdit v7.0.5.3 (https://www.bioedit.com/?ref=labworm, accessed on 12 July 2021) was used for sequence alignment and correction [19]. The non-redundant and confident genes were gathered and assigned as PtLAC genes. We manually inspected these proteins to ensure that all proteins had laccase protein domains and obtained their molecular weights and isoelectric points (pI) by using ExPaSy v3.0 (https://web.expasy.org/compute_pi, accessed on 27 July 2021).

2.2. In Silico Characterisation of Identified Laccases

P. trichocarpa CDS and genome sequence were obtained from the Phytozome database. The Gene Structure View in the TBtools v0.1986853 [20] was used to draw sequence structure and motifs. The conserved motifs of laccase protein were statistically identified by MEME tool v5.4.1 (http://meme-suite.org/tools/meme, accessed on 3 August 2021) [21]. The default maximum number of motifs was 10. The classic mode was selected as motif discovery mode. 3D protein structure simulation uses SWISS-MODEL (https://swissmodel.expasy.org, accessed on 4 August 2021). Substrate pocket drawing analysis uses phymol v2.2.0 (https://www.pymol.org/, accessed on 4 August 2021). The microRNA targets were predicted using the online tool psRNATarget (https://www.zhaolab.org/psRNATarget, accessed on 4 August 2021). Choose Populus trichocarpa JGI genomic project, Phytozome 13 v3.1 as cDNA library. Set the parameters to psRNATarget scoring mode V2 and the default maximum expectation value to 5.0.

2.3. Multiple Sequence Alignment and Phylogenetic Analysis

The coding sequences (CDSs) and amino acid (AA) sequences of Physcomitrella patens, Selaginella moellendorffii Hieron., Amborella trichopoda Baill., O. sativa, Vitis vinifera L., Glycine max (L.) Merr., and A. thaliana were downloaded from the phytozome v13. The genome versions are Physcomitrium patens v3.3 [22], Selaginella moellendorffii v1.0 [23], Amborella trichopoda v1.0 [24], Oryza sativa v7.0 [25], Vitis vinifera v2.1 [26], Glycine max Lee v1.1(Glycine max Lee v1.0, DOE-JGI, http://phytozome.jgi.doe.gov/, accessed on 4 August 2021), Arabidopsis thaliana TAIR10 [27]. Pinus taeda laccases were obtained from the Congenie database (https://congenie.org/, accessed on 4 August 2021). The amino acid (AA) sequences of published LACs from A. thaliana were used as a query to perform BLASTp searches against the protein sequences of other eight genomes mentioned above one-by-one. The conserved domains of candidate LACs were predicted using the Conserved Domains Database (CDD; http://www.ncbi.nlm.nih.gov/Structure/cdd/wrpsb.cgi, accessed on 6 August 2021) from the National Center for Biotechnology Information. Multiple sequence alignment used online tool MAFFT v7 (https://mafft.cbrc.jp/alignment/server, accessed on 6 August 2021). PhyML v3.0 [28] was used to rebuild the phylogenetic relationship of terrestrial plant laccases, with bootstrap = 1000. The amino acid substitution model WAG + I + G calculated by modelgenerator [29] was used to construct the phylogenetic tree. All laccase sequences involved in the phylogenetic tree are given in Table S2. Two Trametes laccases (AAQ12267.1 and AAQ12268.1) and three Arabidopsis ascorbate peroxidases (AT4G39830, AT5G21100, and AT5G21105) were the outgroups in the phylogenetic tree. According to the phylogenetic tree and the classification of A. thaliana laccases [3], the plant laccase was classified, and the support rate of the subfamilies was >65%.

2.4. Detection of Positive Selection

The approach of Yang and coworkers [30,31] was applied to test the positive selection of the LAC genes in P. trichocarpa with the codeml program of EasyCodeML v1.4 [32] under the branch-site model. Branch-site model hypothesizes the different evolutionary rates to vary among different sites and branches simultaneously [33]. Use an improved branch site model to compare the ratio of nonsynonymous and synonymous substitution rates between branches, and detect the positively selected amino acid sites of PtLAC. Divide all branches into foreground and background. The branches on the foreground were tested for positive selection; the other branches on this tree were used as the background. For each branch, the ratio of nonsynonymous and synonymous substitution rates was calculated with the alternative model (Model A ω > 1) and null model (Model A Null ω = 0). The positive selection sites were selected by comparing the LRT of null model and alternative model subsequently. The codons under positive selection may come from the positive selection site class, if LRT indicates that it is present on the foreground branch [34]. Estimate a posteriori probability (Qks) by Bayesian Empirical Bayes (BEB) method [33]. The standard threshold for identifying amino acid sites under selection is a posterior probability of 0.95.

2.5. Synonymous Substitutions per Synonymous Site Analysis

ParaAT v2.0 [35] was used for parallel construction of protein-coding DNA alignments for a large number of homologs. KaKs_Calculator 2.0 [36] was employed to estimate synonymous substitutions per synonymous site (Ks) using the YN method [37]. The Ks calculation of the cluster is based on the full-length nucleic acid sequence of each cluster member. All calculation results were given in Table S5. Boxplot was drawn using GraphPad Prism v8.0 software.

2.6. Gene Genomic Distribution and Segmental Duplication Analyses

The collinear region information of the P. trichocarpa genome referred to the data given in Plaza 3.0 (http://bioinformatics.psb.ugent.be/plaza/versions/plaza_v3_dicots, accessed on 5 July 2021). The chromosome map was drawn on the basis of the chromosome rearrangement in poplar after the most recent genome-wide duplication event. Between two chromosomes, shaded lines were used to indicate homologous chromosomal fragments, which were repetitively produced by large fragments. Numbers 1–19 were the chromosome numbers. PtLACs were numbered in accordance with their position on the chromosome. The members of the gene family formed by tandem duplication usually form gene clusters with similar sequences and functions, which are closely arranged on the same chromosome. This study considers that multiple tandem-duplicated genes linked head to tail on the same chromosome constitute a gene cluster. The number of members in the 11 gene clusters esd 30, accounting for 56.6% (30 of 53) of the PtLACs.

2.7. Expression Patterns of PtLAC Using RNA-Seq Data

The publicly available RNA-Seq data of P. trichocarpa were obtained from the SRA database (https://github.com/ncbi/sra-tools, accessed on 7 September 2021) and used to analyze the expression pattern of PtLACs in organs/tissues. Three different tissues: roots [38], stems (Fujian Agriculture and Forestry University), and leaves [39]. The accession numbers were as follows: roots (ERR1864438, ERR1864439, and ERR1864440), drought-stressed roots (ERR1864444, ERR1864445, and ERR1864446), salt-stressed roots (ERR1864450, ERR1864451, and ERR1864452); stems (SRR12768913, SRR12768914, and SRR12768915); leaves (SRR6509752), leaves treated with salicylic acid (SA) (SRR6509753), leaves treated with methyl jasmonate (MeJA) (SRR6509754), leaves treated with cold stress (SRR6509756), leaves treated with salt stress (SRR6509757), and mechanical damage (SRR6509758). Use the fastq-dump command in the SRA Toolkit software (https://github.com/ncbi/sra-tools, accessed on 7 September 2021) to convert SRA format files to FastQ format. Hisat2 [40] was used to build the sequence index of the P. trichocarpa genome, and aligned it with the RNA-Seq data to get the sam file. Samtools [41] was used to convert sam files into bam files, which were sorted to generate sort.bam files, and finally bam files were indexed to generate sort.bam.bai files. Gffread converts the genome annotation file GFF into GTF format. In the HTSeq [42] operating environment, use the HTSeq-count command to calculate the gene expression matrix to generate the sample gene expression matrix readcount file. All software is installed using miniconda (https://docs.conda.io/en/latest/miniconda.html, accessed on 7 September 2021). Transcript abundance was expressed as unit of normalized FPKM (fragments per kilobase of exon per million reads mapped), and log2 (FPKM + 1) values were used for heat map generation.

2.8. Plant Growth and RNA Isolation

P. trichocarpa Torr. & Gray and Nicotiana benthamiana were grown in a greenhouse under the following growing conditions: temperature of 25 °C, relative humidity of 40%, light intensity of 3500 lux, and 16 h light/8 h dark cycle. All materials were provided by Zeng Qingyin of the Chinese Academy of Forestry. The P. trichocarpa used for gene cloning was an 8-month-old plant. The tobacco used for subcellular localization experiments was about two weeks old. The seeds of the Arabidopsis mutant (SALK_025690 and SALK_128292) were obtained from the Arabidopsis Biological Resource Center (Ohio State University, Columbus, OH, USA).
Leaf, stem, and root tissue materials of the same strain P. trichocarpa were collected and immediately frozen in liquid nitrogen. The total RNA from all samples was extracted using the RNA prep pure polysaccharide polyphenol plant total RNA extraction kit (TransGen, CN). Nanodrop 2000 spectrophotometer (Thermo, Waltham, MA, USA) and gel electrophoresis were used to evaluate the quality and quantity of total RNA. cDNA was synthesized using the RNA PCR Kit (AMV) version 3.0 (Takara Bio Inc., Dalian, China). PCR primers were designed in accordance with the PtLAC genome sequences (Table S1). The PCR program initially started with a 94 °C denaturation for 3 min, followed by 35 cycles of 94 °C for 30 s, 55 °C for 40 s, 72 °C for 1 min and 30 s and 72 °C for 5 min. Nucleic acid amplification products were stored at 4 °C. The predicted LAC genes were amplified from P. trichocarpa cDNA, cloned into the Peasy-T3 vector (TransGen Biotech, Beijing, China), and sequenced for verification. Primers used in experiments were synthesized by the Beijing Genomics Institute (Table S1). The sequences of PtLAC10, PtLAC11, PtLAC22, PtLAC25, PtLAC26, and PtLAC30 have been deposited in the GenBank database with accession no. MT811935, MT811936, MT811937, MT811938, MT811939, and MT811940, respectively.

2.9. Subcellular Localisation Analysis of PtLAC

To investigate the subcellular localization of the PtLAC proteins, the PtLAC genes were subcloned into the Pcambia1302–GFP transgenic vector to generate C-terminal green fluorescent protein (GFP) fusions driven by the 35S promoter. This vector was previously modified in our laboratory. Primers are shown in Table S1. All constructs containing the proper insert were verified by sequencing and transformed into Agrobacterium tumefaciens EHA105 strain by electric shock (2500 V, 5.3 ms). Agrobacterium was cultivated and collected at OD600 of 0.6–0.8. The bacterial solution was resuspended in permeation buffer to an OD600 of 0.6–0.8 (5 mg/Ml D-glucose, 2.5 Mm MES, 0.1 Mm Na3PO4·12H2O, 0.005 Mm acetosyringone). The resuspended bacteria were injected into the subcutaneous tissue of tobacco leaves by using a syringe without a needle. After exposure to darkness for 24 h, tobacco was cultured for 72 h under normal photoperiod conditions. The transformed tissue was collected, and the GFP signal was immediately observed under a confocal laser microscope (Olympus FV1000MPE, Olympus Corporation, Tokyo, Japan). GFP was excited with a 488 nm excitation spectrum. The epidermal cell wall localization was observed after plasmolysis caused by 30% (v/v) sucrose solution.

2.10. Homozygous Line Acquisition and Treatment of Transgenic A. thaliana

Pcambia-1302-PtLAC plasmids were transformed into A. thaliana with A. tumefaciens (EHA105) using the floral dipping method [43]. Pcambia-1302 vector contained a hygromycin resistance gene for the selection of transgenic seedlings. After two generations, seed germination rate higher than 98% was considered to be a homozygous line. Three homozygous lines were selected for phenotypic observation and subsequent experiments. Seeds were surface sterilized and chilled at 4 °C for two days before growth on Murashige and Skoog (MS) medium with or without antibiotics or planting on Florobella potting compost/roseite mix (1:1). Plants were maintained in a growth room (16 h light/8 h dark, 20–25 °C).
To test whether the introduced gene was expressed in A. thaliana plants, the PtLAC gene expression level was detected using sqRT-PCR in transgenic lines. The total RNAs from wild-type, mutant, and transgenic seedling were extracted using the plant total RNA extraction kit (Tiangen, China). The PrimeScript™ 1st Strand cDNA Synthesis Kit (Takara Bio Inc., Dalian, China) was used to convert the total RNA samples into single-stranded cDNA, which was utilized for sqRT-PCR. SqRT-PCR primers were designed using the Primer Premier 5 [44] software (Table S1). AtActin2 expression was used as an internal control. SqRT-PCR was performed under the following conditions: 98 °C for 5 min, followed by 28 cycles of 98 °C for 30 s, 55 °C annealing for 40 s and 72 °C for 1 min with a final extension at 72 °C for 5 min. All sqRT-PCR experiments were repeated for three biological replicates. The size of the AtActin2 fragment is 842 bp, and the size of the PtLAC gene product is about 2300 bp.
Seedling roots were treated with PEG8000 (33.5% PEG solution containing 0.5 × MS and 0.5% sucrose at pH 5.8 autoclaved for 15 min at 15 psi and 121 °C) by using the method in Cai X’s article (2006) [45]. The PEG8000 solution was added to a square Petri dish (10 cm3 × 10 cm3 × 1.5 cm3) containing 35 mL sterile solid medium. Dishes were allowed to equilibrate for 16 h. After cold treatment (4 °C) for two days, seeds were germinated and transferred into a 16 h light/8 h dark photoperiod at room temperature. Three-day-old seedlings with uniform root lengths were selected (wild, mutant, and transgenic lines) and placed vertically under 16 h light/8 h dark photoperiod for the roots to grow vertically. Each plate contained 4–5 seedlings of wild-type, mutant, and transgenic lines, respectively. The initial root length was measured. The position of root tips was marked to track the root growth process [46], and 5 biological replicates was observed. The seed coat color was observed after complete bolting for approximately 45 days. Uncracked siliques of approximately 1 cm were chosen, peeled, and spread on the glass slide. A LEICA-DMC-4500 (Leica, Wetzlar, Germany) was used to observe the color of the A. thaliana seed coat. Each phenotype observation uses 3 biological replicates.

3. Results

3.1. Identification of the LAC Gene Family in the Populus Genome

Previous studies identified 53 PtLAC genes in the P. trichocarpa genome [18]. In this study, re-identification and manual re-annotation were performed to confirm the PtLAC genes of P. trichocarpa further. In total, 58 putative laccase protein-coding gene loci were tentatively identified through BLAST from Phytozome using Populus trichocarpa v3.1 release. Fifty-three full-length genes were numbered PtLAC1–PtLAC53 (Table 1), and these genes all contain typical laccase copper oxidase-conserved domains. The molecular weight of PtLAC was 555–582 KD, and the pI was between 6.46 and 9.91. Five fragments with incomplete domains were considered to be pseudogenes, named PtLAC1-fr–PtLAC5-fr (*indicated in Table 1). Frameshift mutations or premature stop codons in these sequences resulted in incomplete protein domains. After the annotation information release of Populus trichocarpa v4.1, we have compared the PtLAC information of these two versions. In v4.1, PtLAC43, PtLAC44, and PtLAC52 are not annotated. Except for these three genes, the IDs of the remaining laccase genes have not changed. In the phylogenetic tree, PtLAC43 and PtLAC40 are 100% clustered, PtLAC44 and PtLAC41 are 100% clustered, PtLAC52 and PtLAC53 are 100% clustered; these three genes do not affect our classification results and we have not continued to study the functions of these genes. In this article, we still use the v3.1 version.

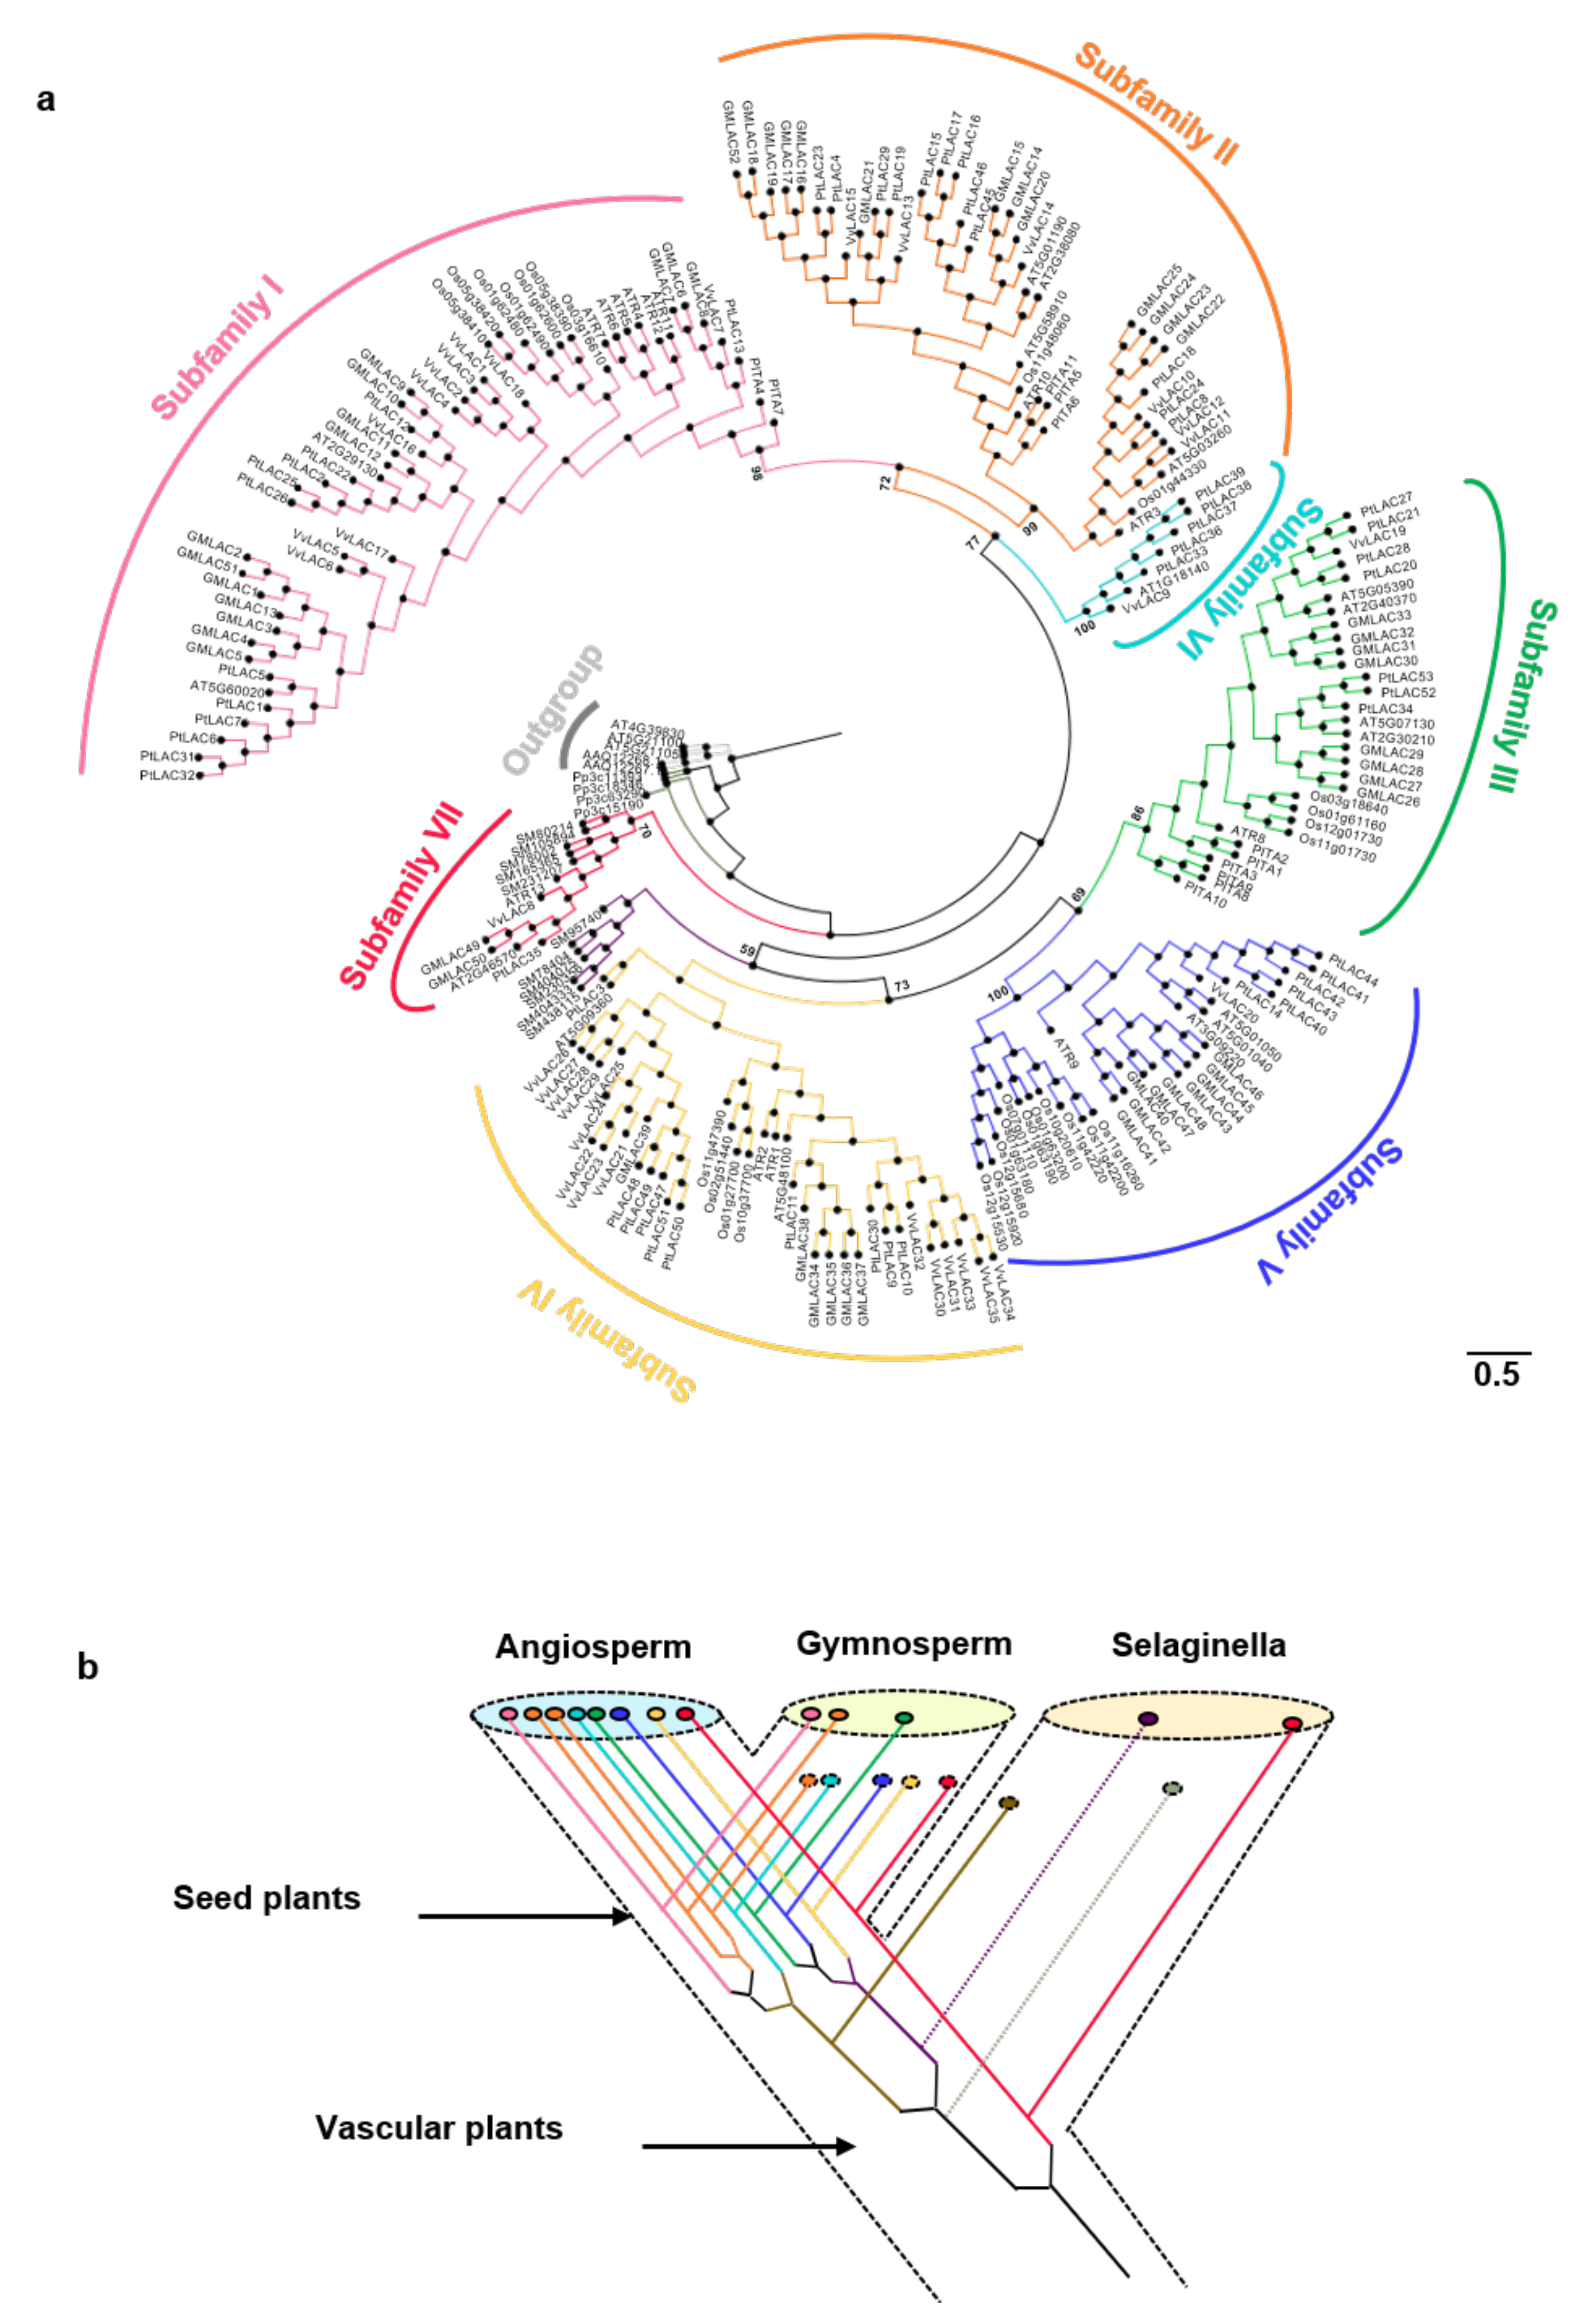
3.2. Evolutionary Analysis of the Laccase Gene Family in Terrestrial Plants

Eight terrestrial plants with completed whole-genome sequencing were used to represent different evolutionary stages to study the evolutionary course of laccase. Laccases were excavated in the genomes of these species for comprehensive phylogenetic analysis (Table S2). The examined plant species include one moss (P. patens), one fern (Selaginellae moellendorfii), one gymnosperm (P. taeda), one archaic angiosperm (A. trichopoda), one monocot (O. sativa), and three dicots (A. thaliana, V. vinifera, and G. max). Four laccase genes were present in the bryophyte P. patens. No laccase gene was identified in the whole genomes of green algae (Ostreococcus lucimarinus) and Micromonas sp. Therefore, laccase might have originated from the plant’s landing process. The numbers of laccase genes in S. moellendorfii, P. taeda, and A. trichopoda were 11, 11, and 13, respectively. In total, 29, 17, 35 and 52 laccases were present in the monocot O. sativa, dicot A. thaliana, V. vinifera, and G. max, respectively. The gene family size of laccase in species indicated that this gene family began to expand during the evolution of angiosperms.
The cladogram based on the phylogenetic tree is shown in Figure 1a. The real phylogenetic tree is shown in Figure S1. In terms of the classification criteria of Arabidopsis laccase and location on the phylogenetic tree, the 221 land plant laccases were clearly divided into seven branches of Subfamilies I–VII (support rate > 65%) [47]. Subfamilies I–V contained gymnosperms and angiosperms. Subfamily VI is a unique branch of angiosperms. Subfamily VII was a basal branch and contained ferns and angiosperms. Gymnosperm laccases might have been lost in Subfamilies II, VI, and VII. According to the ML (Maximum likelihood) tree, the ancestors of vascular plants had at least two laccase genes. The fern laccase ancestor might have lost one copy. This copy produced two duplicates before it was lost. One of the duplicates was lost in the subsequent evolutionary process. Two of the five laccase ancestors of seed plants experienced duplication events. Eventually, eight ancient laccase genes were present. Five of the eight laccase gene ancestors might be lost in gymnosperms. Gymnosperms only had three ancient laccase genes (Figure 1b). The specific classification of the members of Populus trichocarpa laccase, which this research focuses on, is shown in Table S3.

3.3. Positive Selection Analysis of Plant Laccases

The branch-site model allowed ω ratios to simultaneously vary between sites and branches in order to detect positive selection which affecting a few sites along particular lineages [33]. Table 2 lists the parameter estimates for branches under positive selection. When Subfamily I was set as the foreground branch, 2∆lnL between Null and Alternative models was 6.624184 (p < 0.05), and found two possible positive selection sites (163 L 334 F, p > 0.95) (Table 2). In addition, a possible positive selection site was found (26 E, p > 0.95) when Subfamily II or Subfamily III were set as the foreground branch, and the p-value between the null and alternative models was p < 0.05. The 2∆lnL value between the null and alternative models was 5.42867 and 5.278286, respectively. When Subfamily IV was set as the foreground branch, the value of 2∆lnL between Null and Alternative models was 13.565518 (p < 0.01). In total, eight sites (55 C, 93 T, 95 L, 170 M, 227 G, 236 S, 242 A, 324 F, p > 0.95) were found positively selected at a level of 95%. When subfamily V is the foreground branch, the value of 2∆lnL between the null and alternative models was 6.82632 (p < 0.01). Five sites were found (2 V, 33 H, 50 R, 179 I, 252 R), and the posterior probability according to the BEB method was significantly greater than the critical value of 0.95 (p > 0.95). When Subfamily VI and VII were used as foreground branches, no potential positive selection sites were found, and the value of 2∆lnL between the null and alternative models was 3.31621 (p > 0.05) and 0.055894 (p > 0.05), respectively.

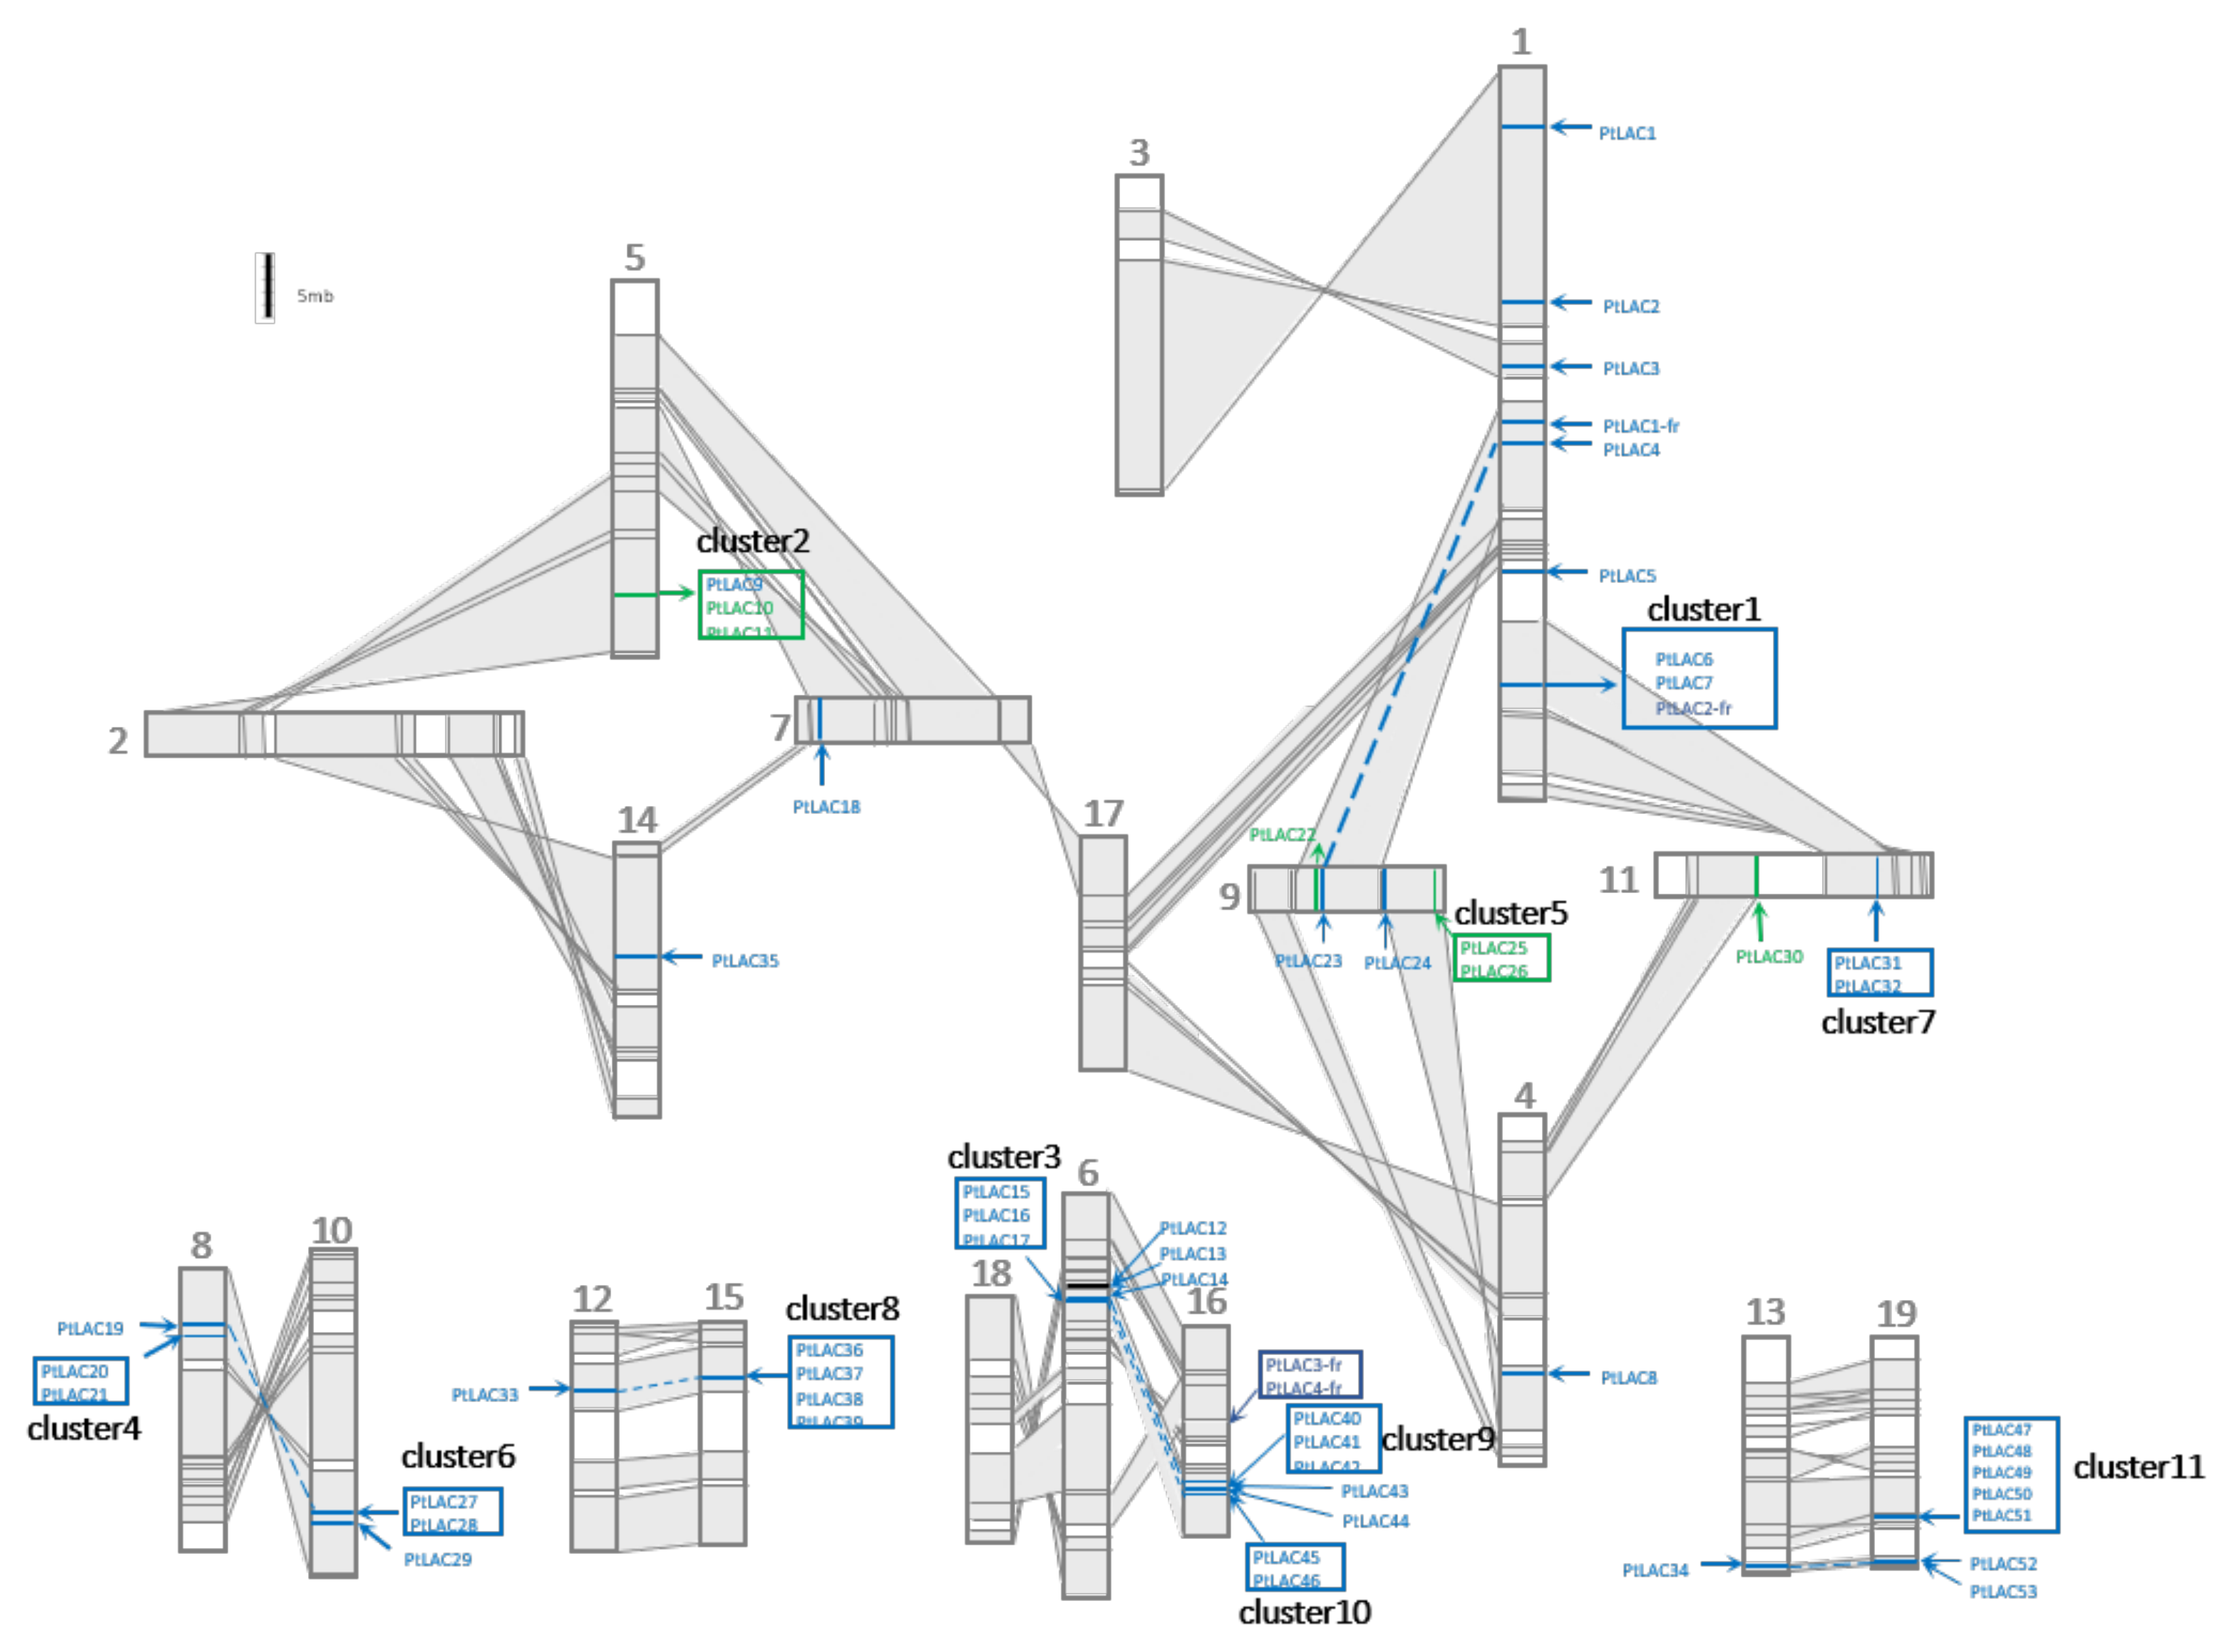
3.4. Formation Mechanism Analysis of the Laccase Gene Family in P. trichocarpa

The salicoid genome duplication events occurred at least three times. The most recent one occurred between 60 and 65 Mya [16]. The chromosome rearrangement of poplar after the most recent whole-genome duplication (WGD) event is shown in Figure 2. Collinear regions between two chromosomes were shaded grey and connected with lines. These regions were used to represent homologous chromosomal fragments produced by segment-duplicated fragments. In total, 53 full-length PtLACs were located on 15 chromosomes of P. trichocarpa. The distribution of PtLACs on chromosomes was uneven. No laccase or laccase fragment was observed on chromosomes 2, 3, 17, and 18. PtLACs produced by tandem duplication formed 11 tightly connected clusters (clusters 1–11), and these gene clusters were distributed in certain regions of chromosomes 10, 11, 15, 16, and 19 with 2–5 cluster members. The gene cluster was generated by the tandem duplication of its core gene, which could be determined from the sequence similarity between cluster members. Clusters are shown in the box of Figure 2. PtLAC4/23, PtLAC14/40, and PtLAC34/53 were located in homologous chromosomal segments, which indicated that they were produced by WGD. Gene clusters 1/7, 3/10, and 4/6 were located in homologous chromosomal fragments, and these three pairs of gene clusters were also generated by WGD. Cluster 8 in the homologous chromosome segment did not correspond to the laccase gene cluster, but PtLAC33. Cluster 9 did not correspond to the laccase gene cluster instead of PtLAC14. This result indicated that the duplicated gene copies tended to be lost after genome-wide duplication events. P. trichocarpa produced 56.6% (30 of 53) of laccase members through tandem duplication. Therefore, tandem duplication was considered to be the main expansion formation of the laccase gene family.

3.5. Gene Structure Analysis and Motif Detection of PtLACs

The conserved motif of PtLACs and the details of the motif were analyzed using the MEME website to characterize the protein sequence (Figure 3). The results showed that PtLAC genes with close phylogenetic relationships contained similar exon/intron patterns, including the number of exons, exon length, intron phases, and splicing patterns. The length of the amino acid motif of PtLACs was 15–50, and the number of motifs was 9–11. The height of the amino acid residue letter at each position represented the degree of conservation. Results showed that P. trichocarpa laccase had four conserved Cu2+ binding motifs HXHG, HXH, HXXHXH, and HCHXXXHXXXXM/L. PtLAC18, PtLAC33, PtLAC36, and PtLAC37 had 11 motifs, whereas PtLAC39 had nine motifs. In addition, the members of cluster 8 contained highly conserved motifs, which had one more motif 8 than the members in other clusters. Since exon loss/gain and sequence polymorphisms were identified in the PtLAC genes, there is likely functional diversity in the gene family as well.
The structural features of each of the PtLAC genes in subfamilies are shown in Figure 3. Structural analyses of all of the PtLAC genes in P. trichocarpa revealed that the number of exons varied from three to seven. The structural analysis of 53 PtLAC genes revealed that genes from the same subfamily, particularly Subfamilies I–IV, contained similar gene structures. The members of Subfamily V contained five exons. The members of Subfamily VI had 3–7 exons. There were no intronless genes. The exon/intron pattern belonging to the same subfamily was more similar than those from different subfamilies (Figure 3). This suggested that genes with similar functions may be clustered in the same group.

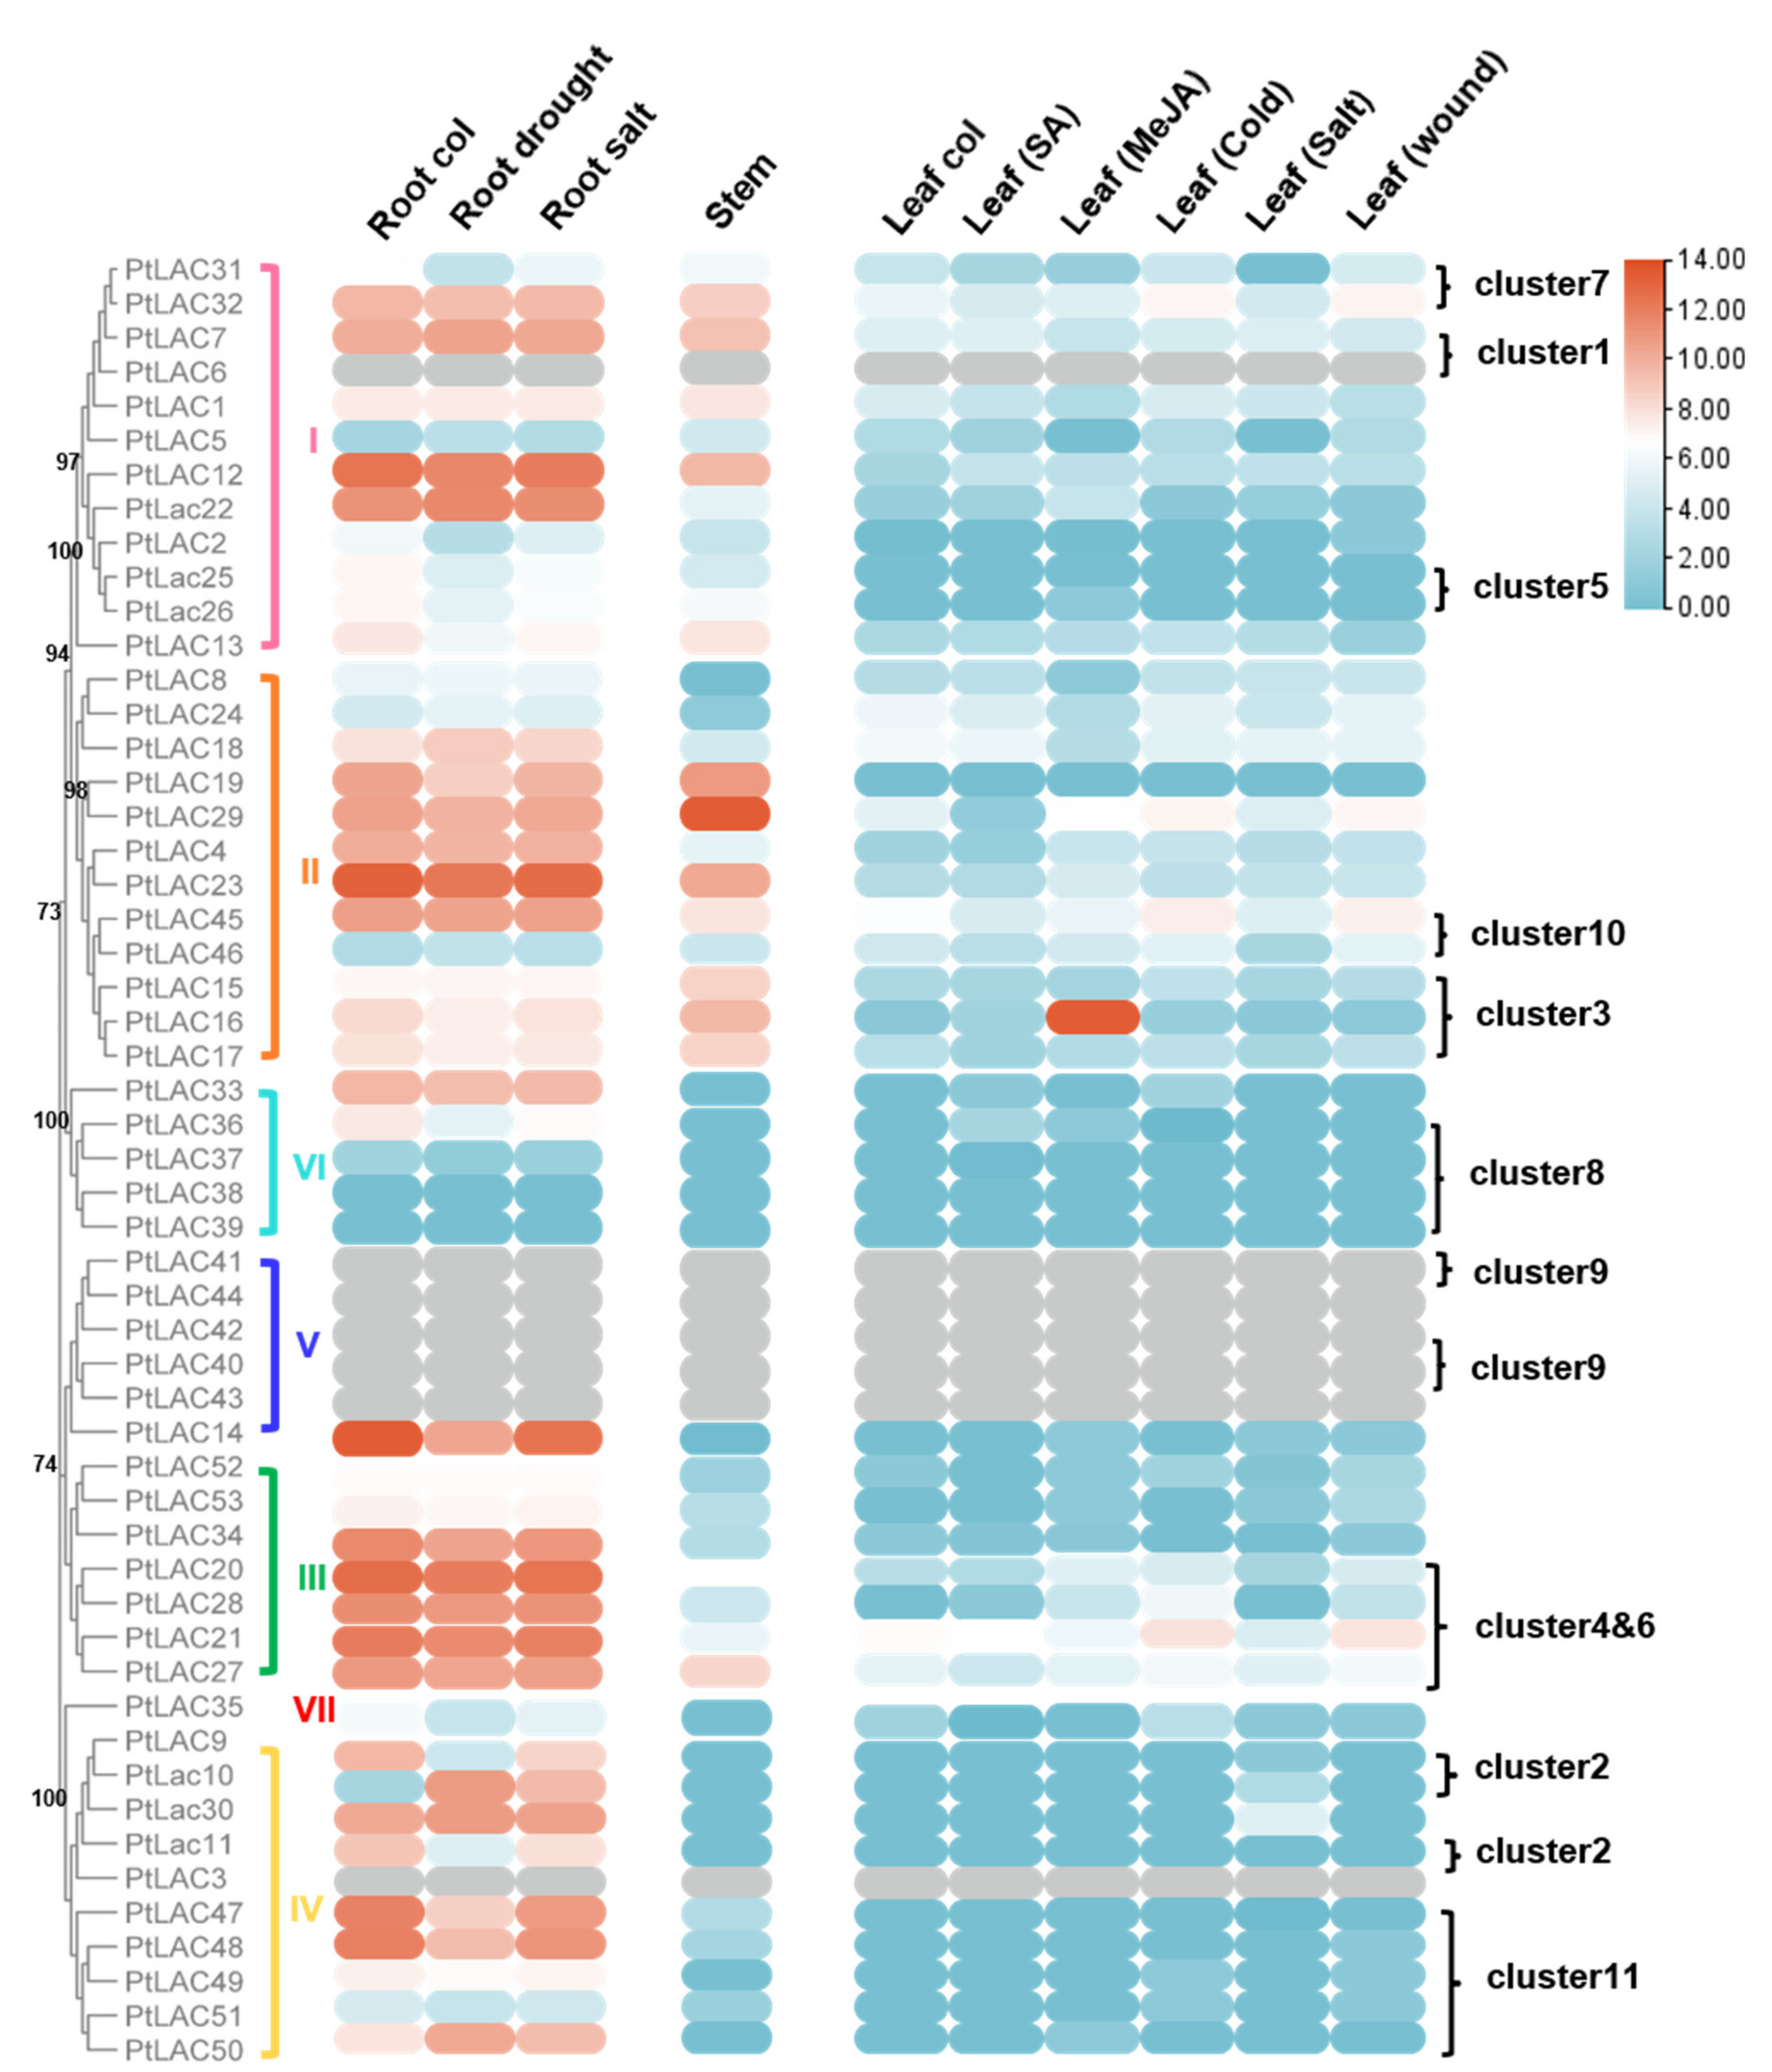
3.6. Expression Patterns of the PtLAC Genes Revealed by Transcriptome Analysis

Based on public transcriptome data, the expression of PtLAC genes in different tissues of P. trichocarpa plant was used to analyze their expression patterns. The expression of 46 PtLAC genes was detected in at least one of the tissues, and the expression levels showed diversity. PtLAC3, PtLAC6, PtLAC40, PtLAC41, PtLAC42, PtLAC43, and PtLAC44 did not obtain transcription data in the tissues involved in transcriptome data. PtLAC38 and PtLAC39 had no detectable transcription in the roots, stems, and leaves and did not respond to various abiotic stresses. This result might be due to the incorrect assembly of the genome or because they were expressed in organs or tissues other than the sample. These two genes might also be non-functional. As shown in Figure 4, the majority of the PtLACs genes showed tissue-specific expression patterns. According to this data set, Subfamilies I, II, and III were preferentially expressed in the root and stem tissues with a high degree of lignification and low expression level in leaves. PtLAC14, PtLAC33, PtLAC36, and Subfamilies IV and VII were only highly expressed in the roots. This finding indicated that PtLACs in these subfamilies might be related to lignin synthesis.
Since the promoter analysis showed that many cis-elements associated with low-temperature, drought, SA, MeJA, and defense and stress responsiveness, we examined the expression of PtLACs under cold acclimation, SA, salt and MeJA treatment and mechanical damage based on RNA-Seq data. However, compared with cold acclimation, salt, and mechanical damage, PtLACs genes showed no obvious response to SA and MeJA treatment (Figure 4), which indicated that they might not have special functions in response to abiotic stress. Then, we focused on their response to the latter two treatments. In the MeJA treatment, PtLAC16 expression was upregulated after MeJA treatment. Meanwhile, except clusters 1, 5, and 8, most PtLAC clusters showed different expression patterns. Tandem-duplicated genes had different regulatory mechanisms at the transcriptional level. This finding was the main reason why duplicate genes were retained (Figure 5).

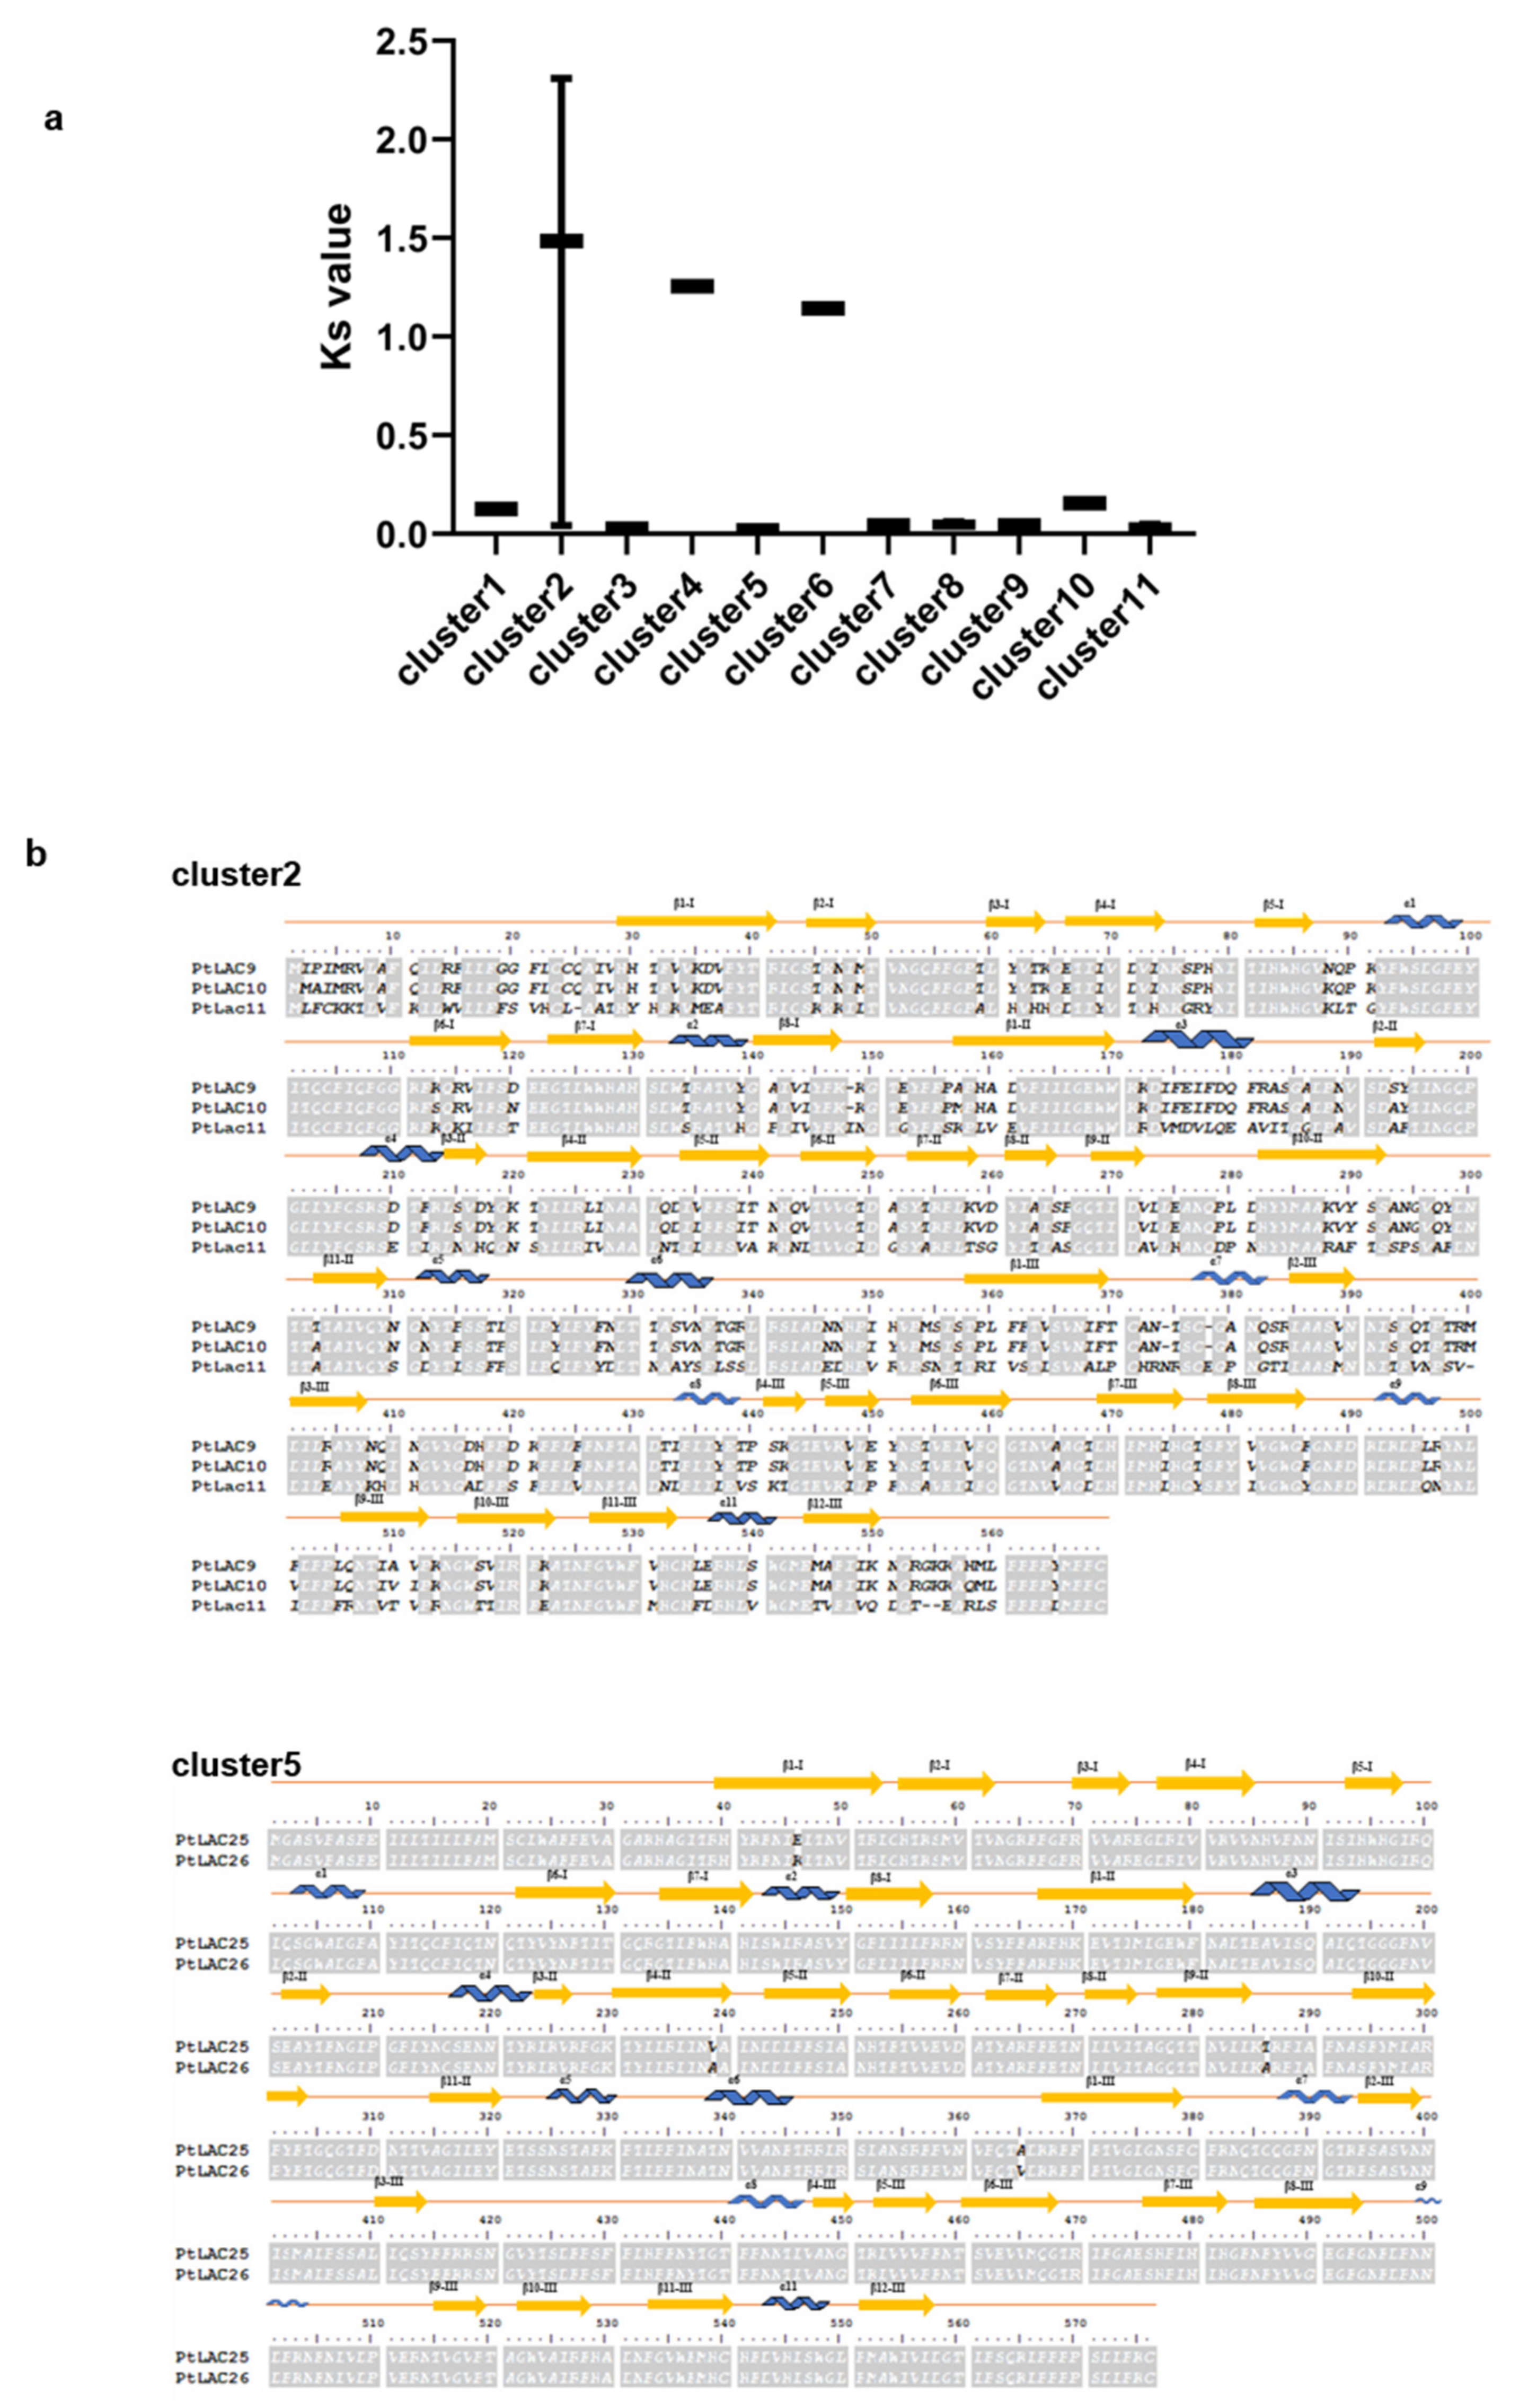
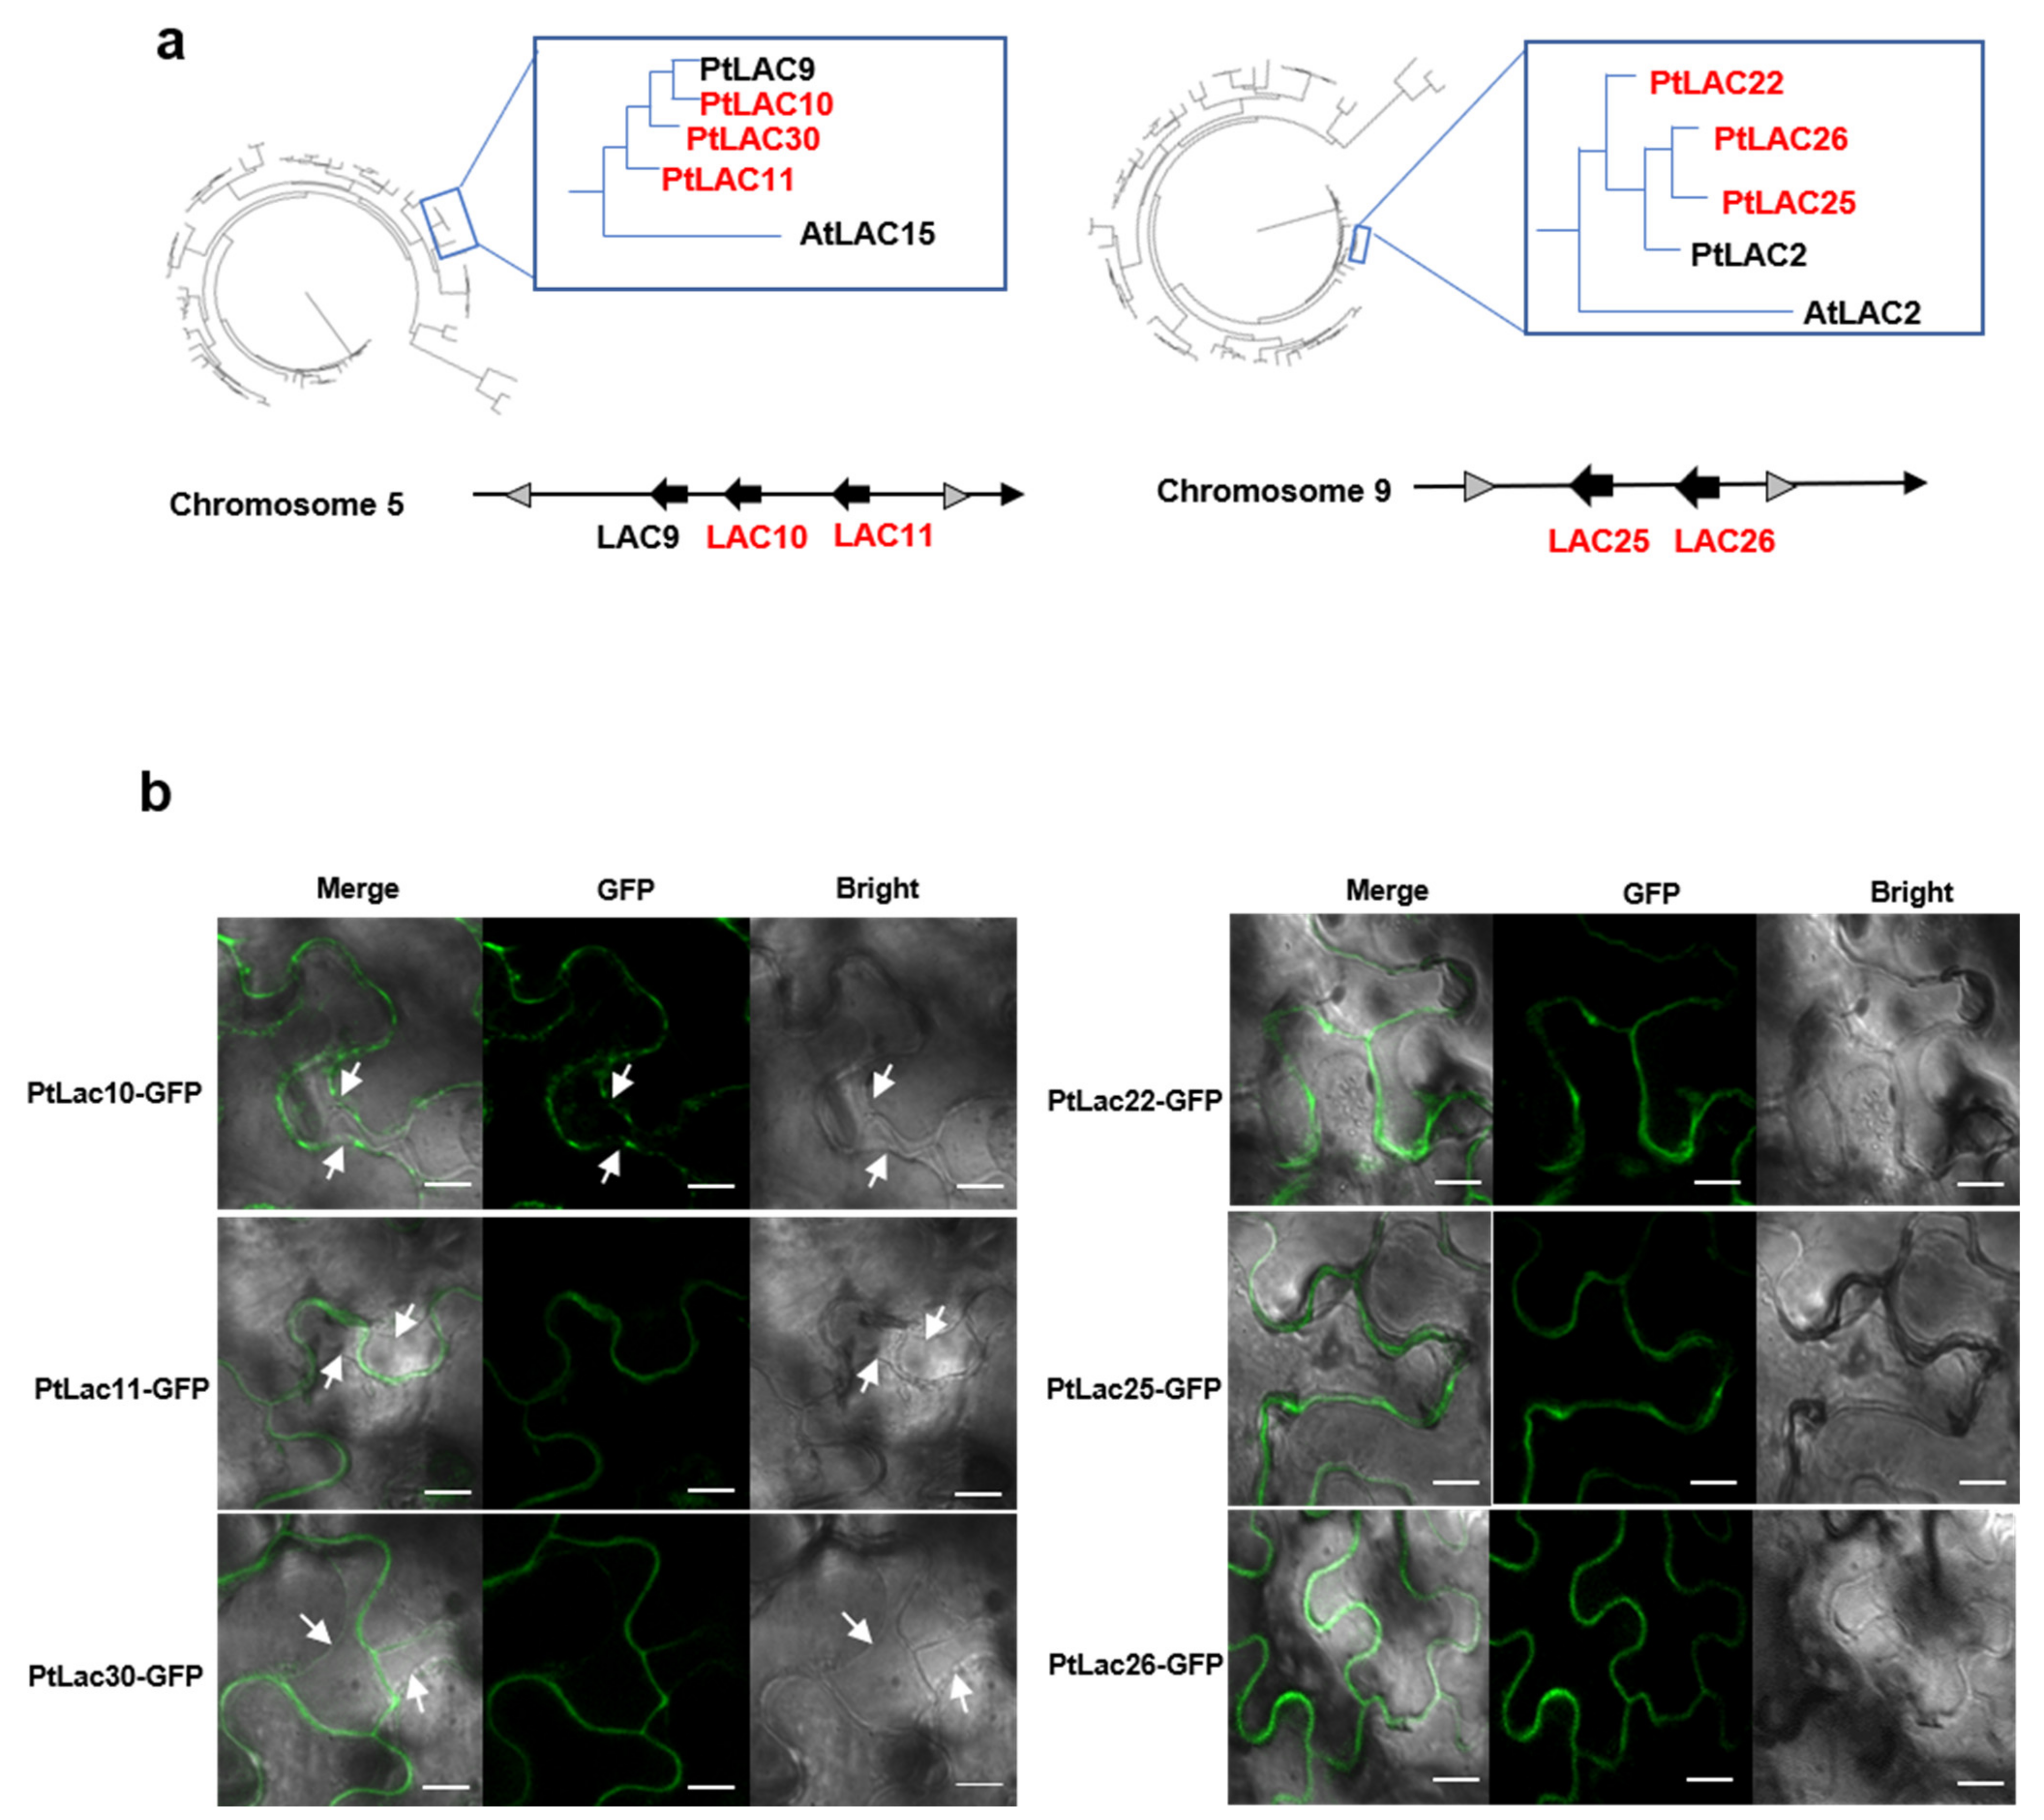
3.7. Molecular Evolution Analysis of the Laccase Gene Cluster in P. trichocarpa

The analysis of the selection pressure of protein evolution was obtained through the comparison of codons, that is, the comparison of the nucleotide substitution rate between synonymous and nonsynonymous sites. Synonymous substitutions (Ks) were hardly constrained by selection and accumulated approximately with random probabilities proportional to time. Therefore, we used the Ks values of 11 gene clusters to measure the divergence time of duplicated genes. Figure 5a shows that clusters 2, 4, and 6 had higher Ks values than other gene clusters, indicating their early divergence time. In contrast, cluster 2 had the earliest divergence time and cluster 5 had the latest divergence time. We compared the protein primary structure of PtLAC in cluster 2 and cluster 5 (Figure 5b). The amino acid sequence alignment result found that the similarity between PtLAC25 and PtLAC26 in cluster 5 was 99.3%. The sequence similarity between PtLAC9 and PtLAC10 in cluster 2 was 97.6%. The sequence similarities of PtLAC11 with PtLAC9, PtLAC11, and PtLAC10 were 45%. In the three-dimensional structure of laccase protein, four loop regions form a narrow space, which is a pocket for laccase to bind to the substrate [48]. Variable amino acids in the binding region can change the substrate specificity of laccase [49]. The PtLAC three-dimensional protein structures of clusters 2 and 5 were simulated. Evident conformational differences were observed in loop 3 of cluster 2 members (Figure S4), which did not exist in cluster 5. Therefore, we speculated that cluster 2 is more likely to be functionally differentiated than cluster 5. In this study, clusters 2 and 5 were selected for the transgenic experiments of Arabidopsis mutants to verify the functional divergence of these two gene clusters.

3.8. Subcellular Localization of P. trichocarpa LACs

Eukaryotic cells are highly compartmentalized, and the correct localization of proteins is essential for their function [50]. Subcellular divergence may play a significant role in the functional divergence of gene families [51,52]. To investigate the subcellular divergence of cluster 2 and cluster 5, PtLAC subcellular localization was tested using C-terminal GFP fusions and visualization by confocal microscopy after the transient expression of the fusions in Nicotiana benthamiana. To distinguish the plasma membrane and/or cell wall localization, the epidermal cells were plasmolyzed by treatment with 0.3 g ml−1 sucrose. The GFP signal of tobacco leaves cell was observed after plasmolysis.
LAC-GFP fusions of six P. trichocarpa LACs showed typical cell wall and plasma membrane localizations (Figure 6b). The six proteins consisted of two in cluster 2 (PtLAC10, PtLAC11), one paralogous protein of cluster 2 (PtLAC30) (Figure 6a), two in cluster 5 (PtLAC25 and PtLAC26), one paralogous protein of cluster 5 (PtLAC22). PtLAC2 in cluster 5, and PtLAC9 in cluster 2 had not been amplified. PtLAC10 was only found localized on the plasma membrane. PtLAC11 and PtLAC30 were located on the cell wall. The GFP signals of PtLAC22, PtLAC25, and PtLAC26 were observed on the cytoskeleton (Figure 6b). This result showed that PtLAC22, PtLAC25, and PtLAC26 might act on the cell wall.

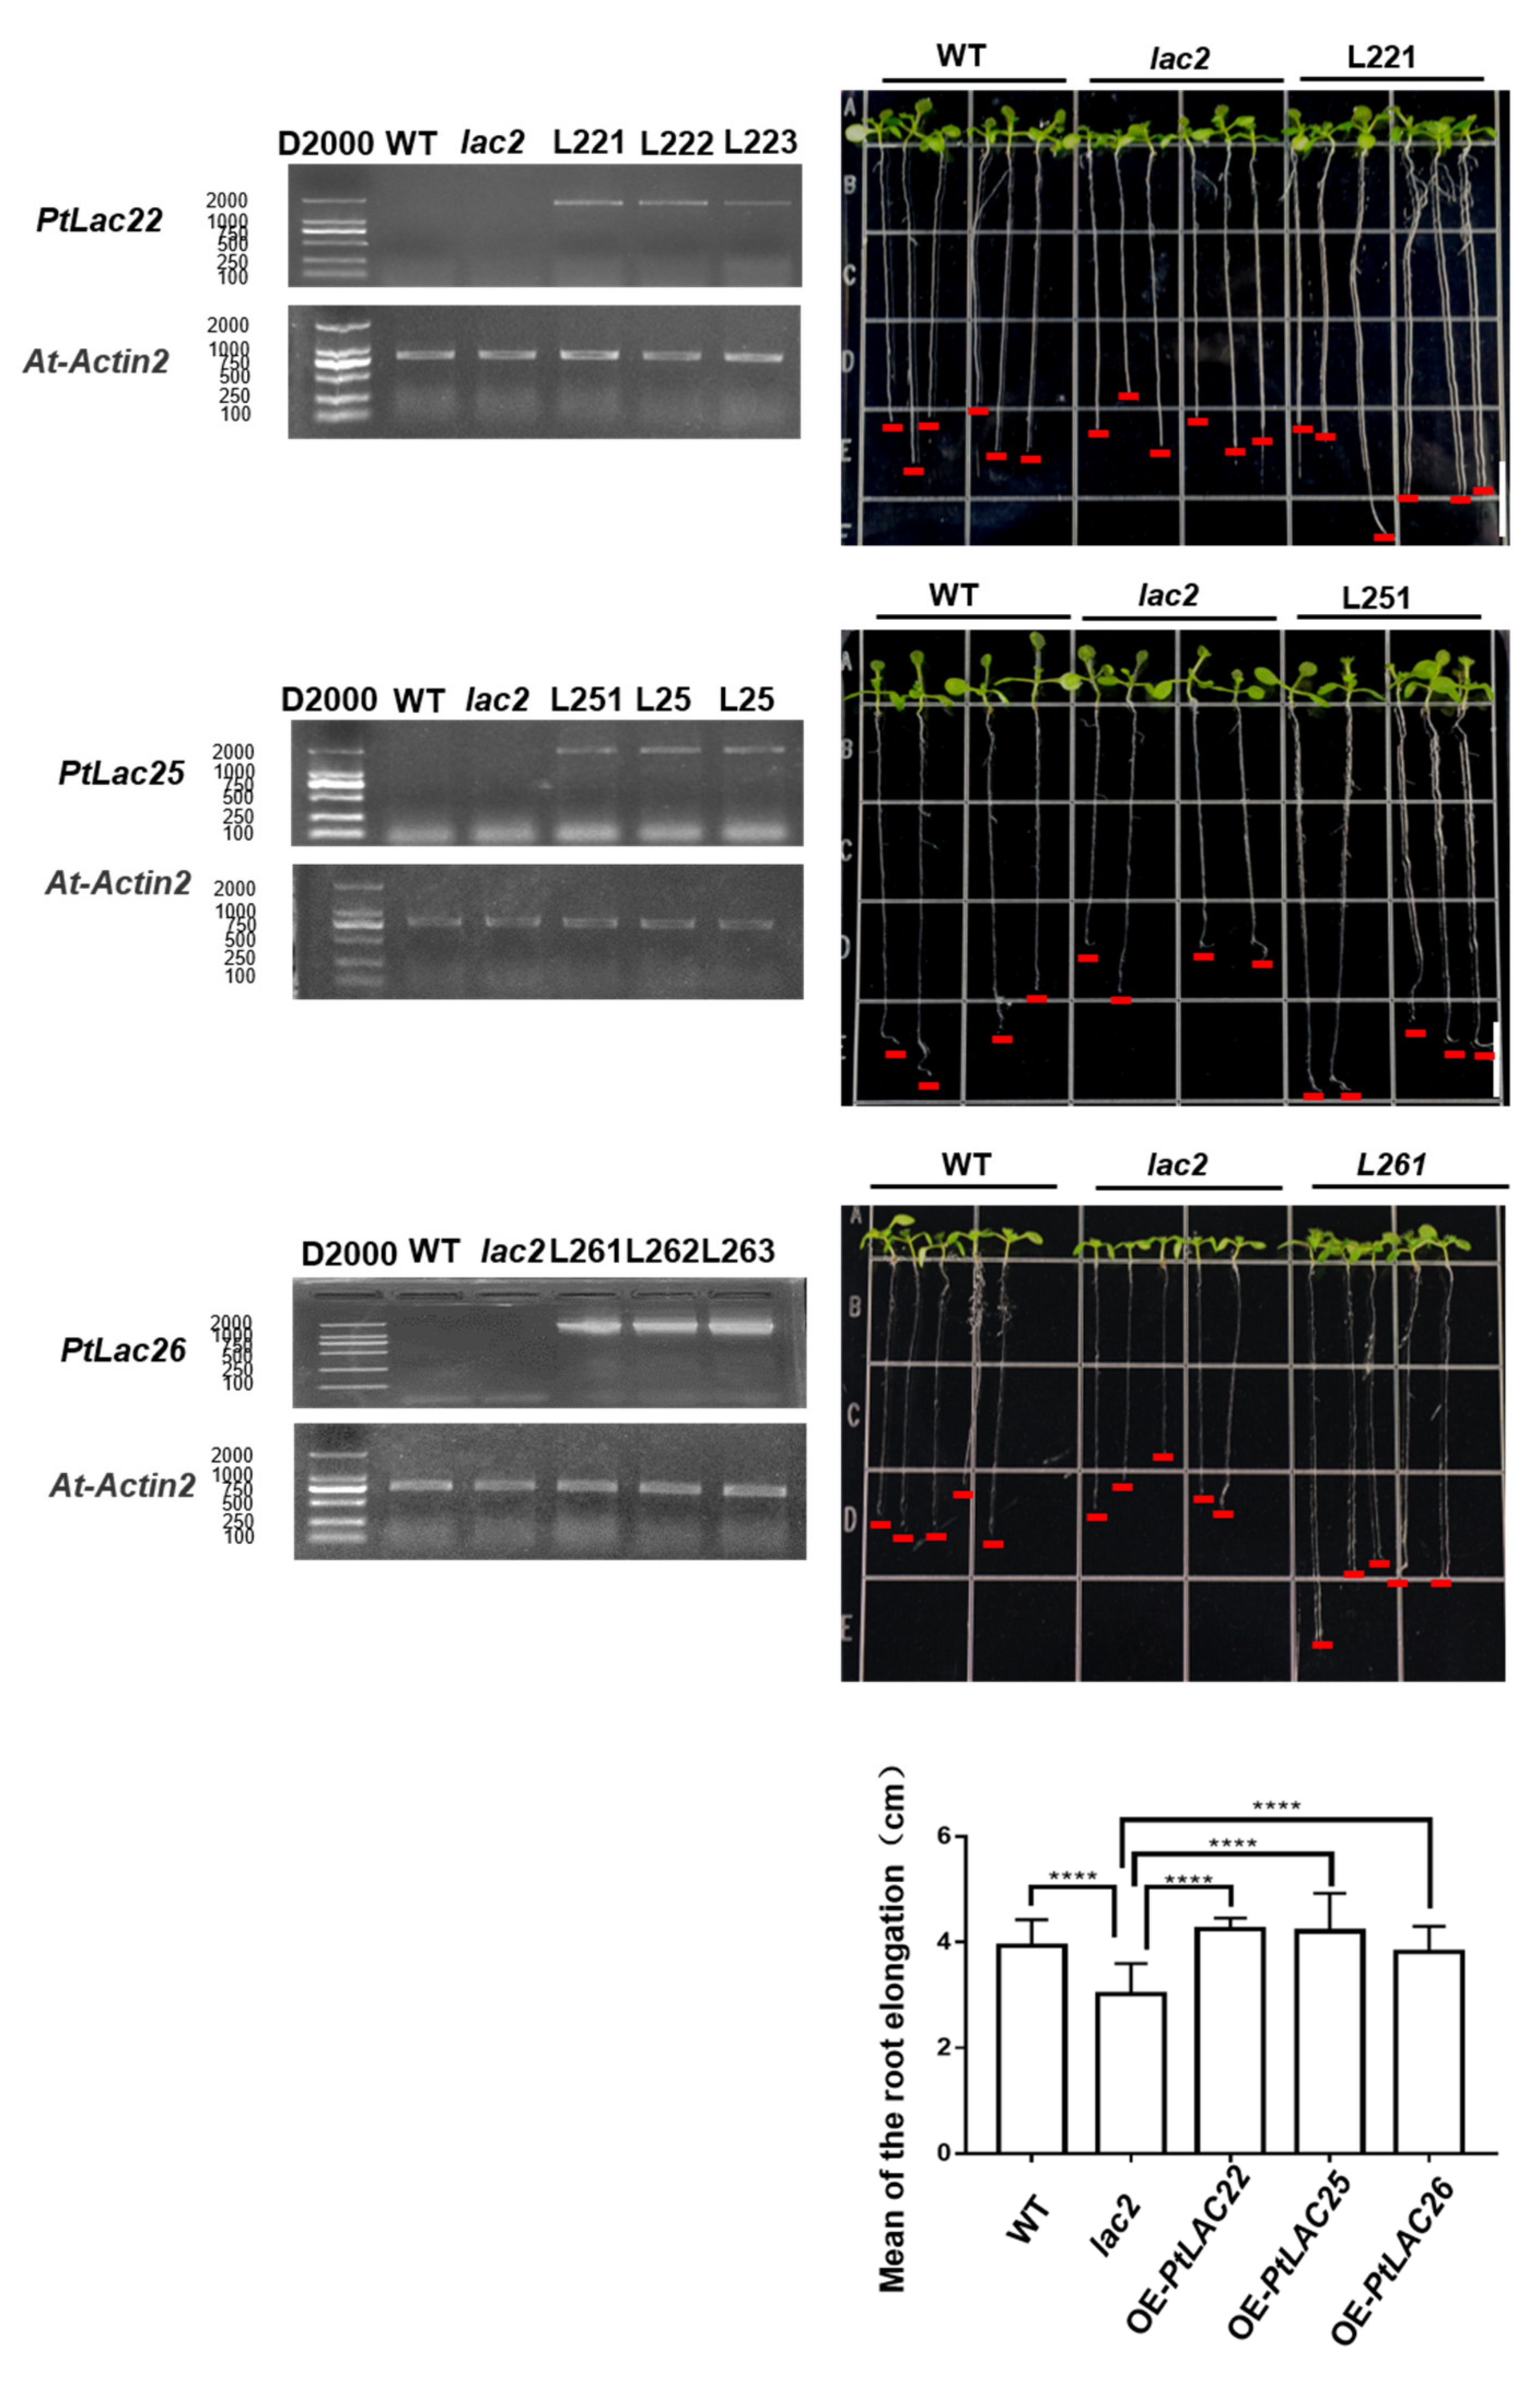
3.9. Identification of the Functional Divergence of Genes in Cluster 2

Seed coat color in Arabidopsis was believed to be determined mainly by PAs (proanthocyanidins) and other flavanols [53,54]. AT5G48100 (AtLAC15) was considered to be involved in the oxidation of Arabidopsis seed coat proanthocyanidins. When AT5G48100 was mutated, the seed coat color of the mutant tt10 plant was pale brown [5]. In order to explore the function of AtLAC15 orthologous genes PtLAC10, PtLAC11, and PtLAC30, tt10 was used as plant material for genetic transformation. pCAMBIA-1302-PtLAC10, pCAMBIA-1302-PtLAC11, and pCAMBIA-1302-PtLAC30 vectors were transformed into A. thaliana. The expression of the insert was verified by sqRT-PCR. All genetically transformed lines were overexpression plants (OE-PtLAC). Approximately 45 days after A. thaliana bolting, the seed coat color of WT, tt10, and transgenic plants was observed. The seed coat color of OE-PtLAC10 line was pale brown, which was consistent with tt10. The seed coat color of PtLAC11 and PtLAC30 transgenic lines was brown, which was consistent with the wild-type (Figure 7). The experiment has been conducted in three biological replicates. This result indicated that PtLAC11 and PtLAC30 participated in the proanthocyanidin metabolic pathway, whereas PtLAC10 did not. In addition, the microRNA target prediction results found that PtLAC10 might be the target gene of ptc-miR1450, ptc-miR7832, ptc-miR6474, and that PtLAC11 might be the target gene of ptc-miR6471, ptc-miR1447, and ptc-miR6435 (Table S4). We considered these two genes may be regulated differently.

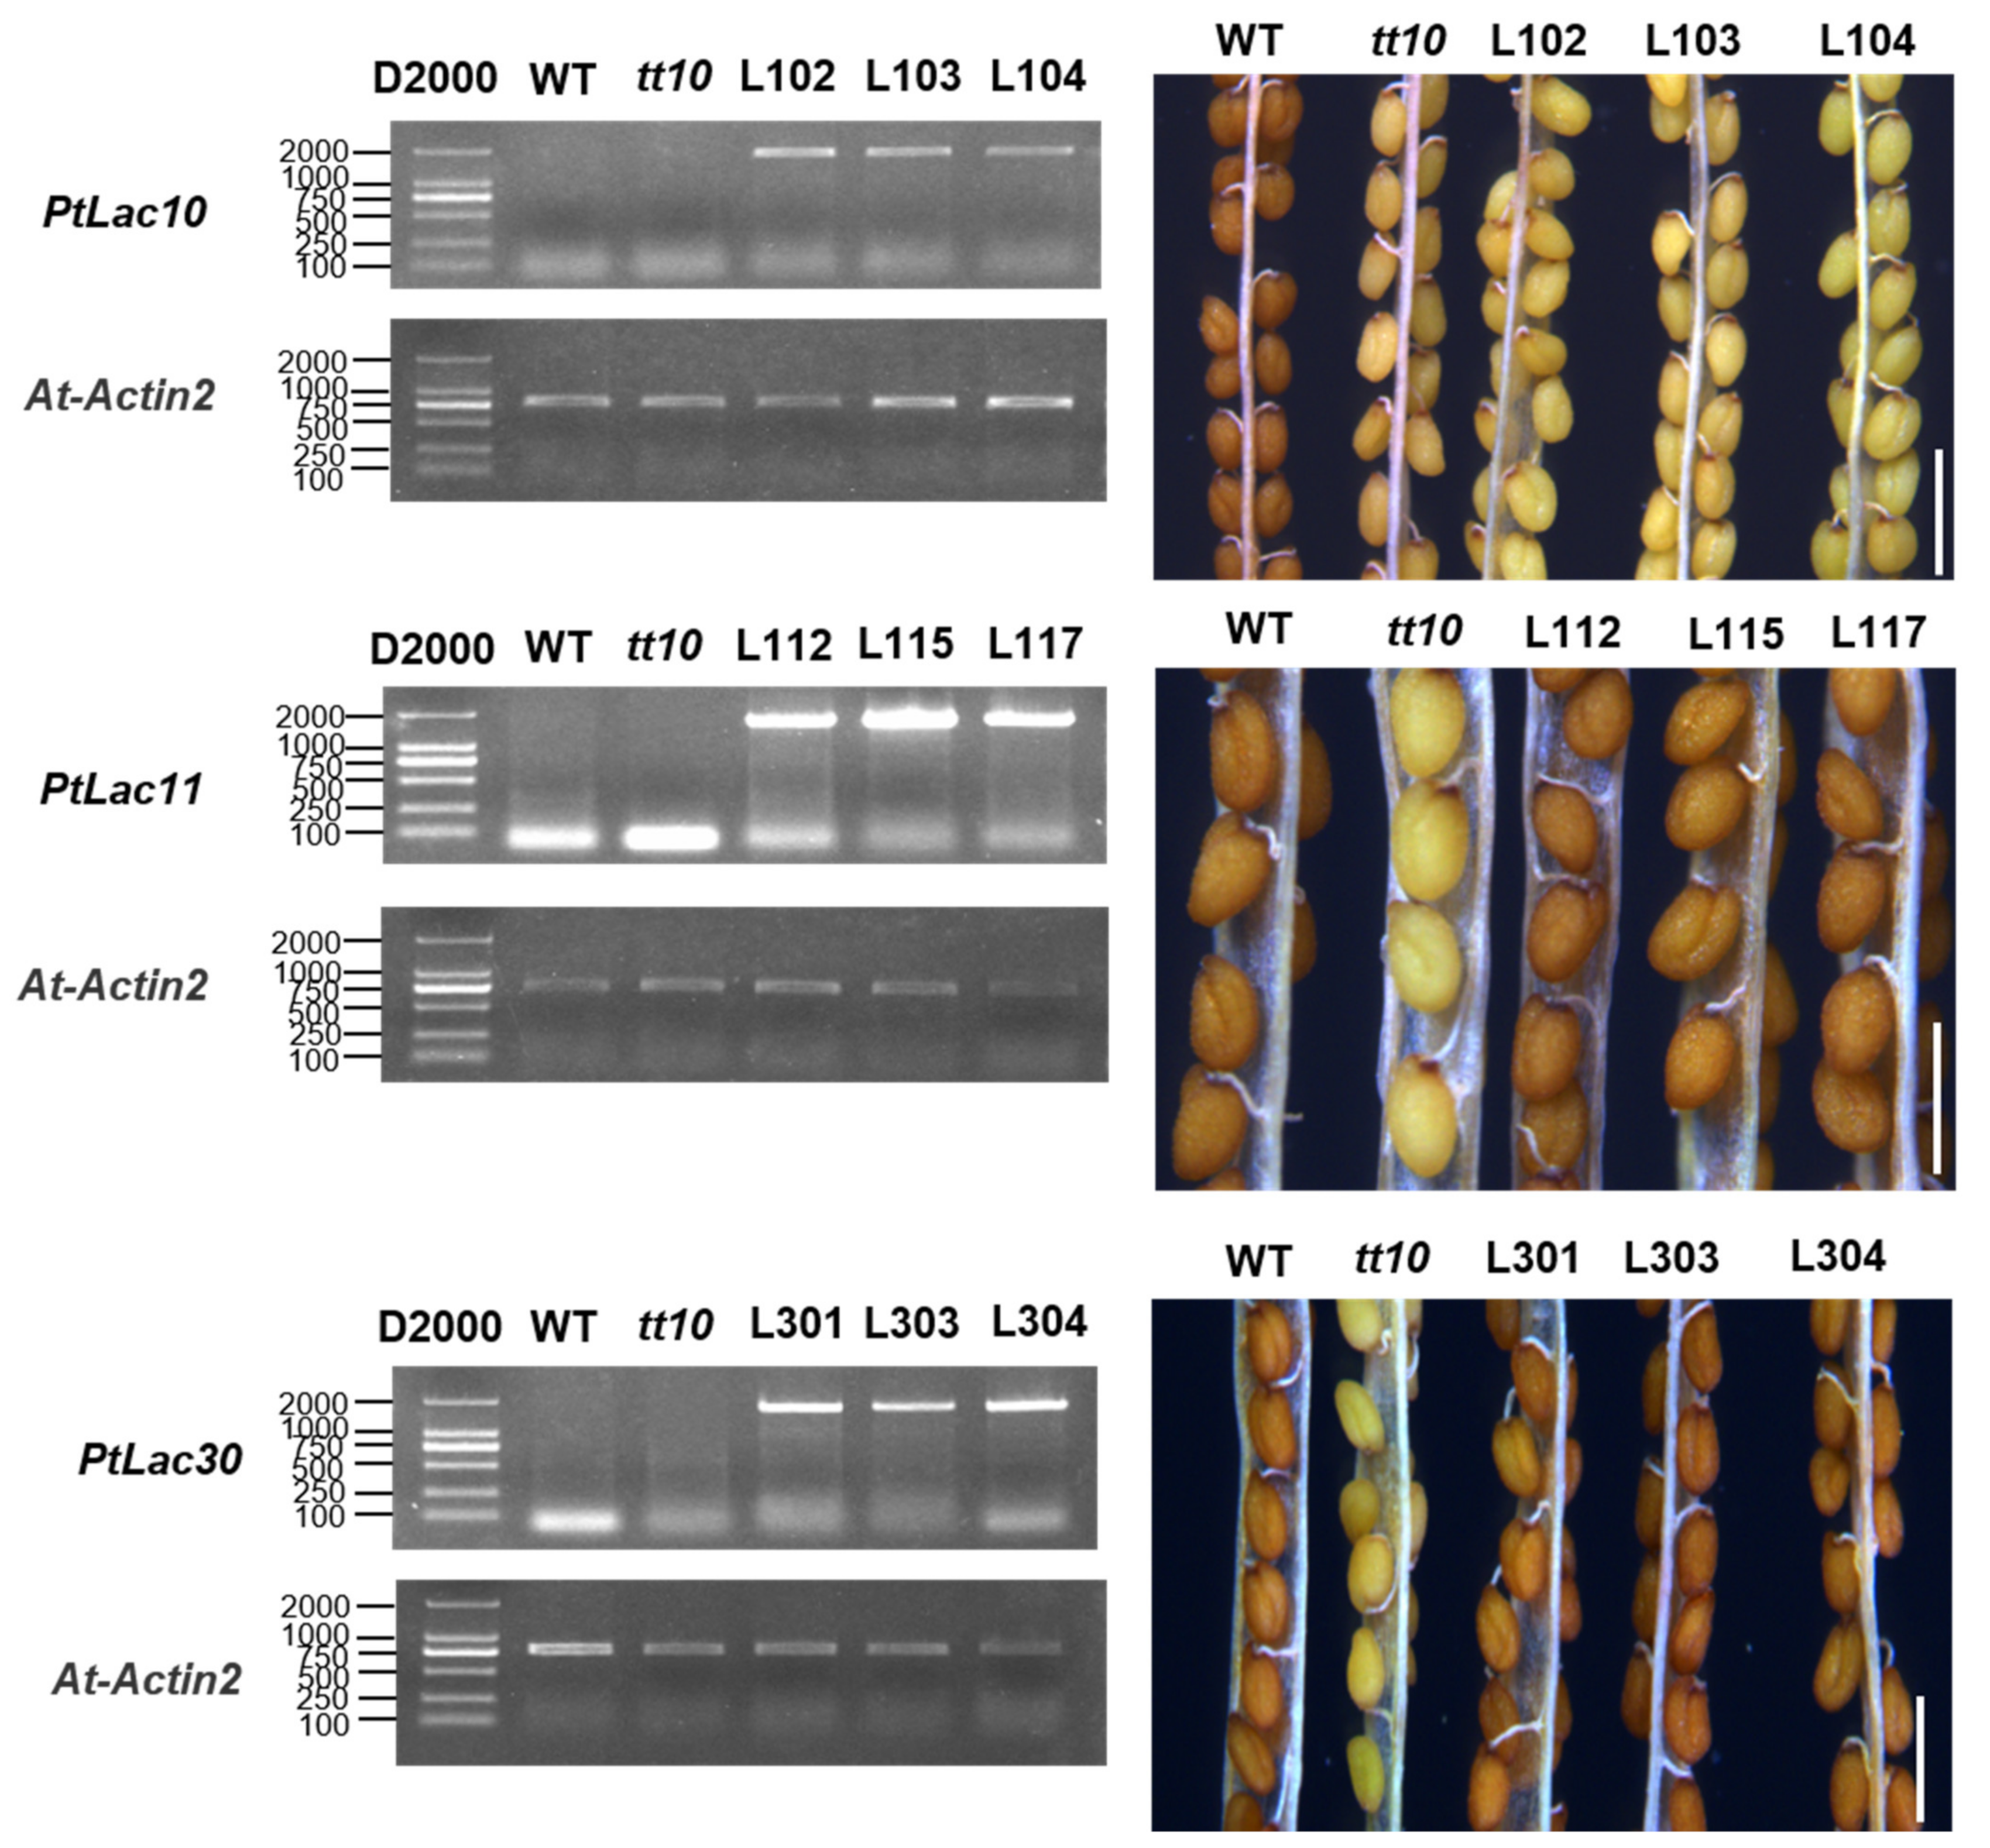
3.10. Identification of the Functional Divergence of Genes in Cluster 5

Arabidopsis LACCASE2 (AT2G29130) acts as a negative regulator of lignin deposition in root vascular tissues during water deficit. The excessive accumulation of lignin in the roots of lac2 mutants inhibited the root elongation of seedlings. After the lac2 mutant was treated with 0.4 M mannitol, the length of the taproots became shorter than that under control conditions. The inhibitory effect was significant after 48 h [50]. In order to explore the function of AtLAC2 orthologous genes, PtLAC22, PtLAC25, and PtLAC26, lac2 was used as plant material for genetic transformation. pCAMBIA-1302-PtLAC22, pCAMBIA-1302-PtLAC25, and pCAMBIA-1302-PtLAC26 vectors were transformed into A. thaliana Agrobacterium-mediated transformation. Three homozygous transgenic lines were selected for each genotype. The growth of taproots was observed under osmotic stress caused by 33.5% PEG8000 (Figure 8). Compared with the wild-type, the root elongation of the mutant was significantly reduced (*** p < 0.001). Compared with that of the mutant, the average root elongation of OE-PtLAC significantly increased (OE-PtLAC25, **** p < 0.0001; OE-PtLAC26, **** p < 0.0001). This phenotype was also observed under normal growth conditions (Figure S2). The results of this experiment indicated that PtLAC22, PtLAC25, and PtLAC26 were involved in the negative regulation process of lignin accumulation in Arabidopsis seedling roots. In addition, the roots of transgenic seedlings responded to osmotic stress caused by 33.5% PEG8000. In Figure 8, we only show one line for each transgenic seedling; the remaining lines are shown in Figure S3. The microRNA target prediction results found that PtLAC25 and PtLAC26 may be the target genes of ptc-miR397, ptc-miR474, ptc-miR399, ptc-miR156l, ptc-miR478, ptc-miR396, ptc-miR7819, and ptc-miR828 (Table S4). From the prediction results, these two genes were under the same transcriptional regulation.

4. Discussion

The Laccase gene family, which has a large number of members, has been determined and analyzed in multiple species. The classification of this gene family also shows discrepancy in different species. In recent studies, Simes (2020) also divided Setaria viridis laccases into six subclades [55]. However, Xu (2019) [56] divided Citrus sinensis laccases into seven groups, and the existence of the seventh group was also confirmed in the phylogenetic tree of plant laccases constructed by Liu (2020) [57]. Anthony C. Bryan (2016) [17] once divided PtLACs into six subfamilies. Wang’s research divided soybean laccase into six subfamilies [58]. In this study, the maximum likelihood method was used to reconstruct the phylogenetic relationships of 221 laccases in the terrestrial plants. The laccase ML tree was divided into seven distinct branches, i.e., Subfamilies I–VII. Variation in the number of genes occurred in the LAC gene family during land plant evolution. The LAC gene family only contained four members in the nonvascular land plant Physcomitrella patens, but had expanded to varying degrees in vascular plants. Selaginellae moellendorfii and P. taeda, contained 11 and 11 LAC genes, respectively. Gymnosperms had lost a large number of copies of laccase during evolution. The laccase gene family has expanded significantly in angiosperms and has become a large gene family. Oryza sativa [1], Brachypodium distachyon [2], and Arabidopsis thaliana [3] have 30, 29, and 17 LAC genes, respectively. In this study, 53 laccase genes were identified from the P. trichocarpa genome. It was worth noting that the number of laccase gene families in soybeans had expanded to 93, almost twice that of P. trichocarpa, but the classification of soybean laccases had not increased. This showed that there are a large number of redundant individuals in soybean laccase. Positive selection analysis showed that the evolutionary rate among LAC lineages was not consistent. Some positive sites were detected in Subfamily I–III, indicating that these branches may be under positive Darwinian selection; moreover, Subfamily IV and Subfamily V could be confronted with strong positive Darwinian selection, since significant positive sites were detected at the 0.95 significance level. In the evolution of Subfamily VI and VII, no evidence of suitable selection was detected (p > 0.05), and no positive selection sites were found.
One of the main driving forces of genome evolution is gene duplication [59]. A source of novel genetic variation is duplicated genes. Interspersed repeats, tandem repeats, and segmental duplication are the most common modes of gene duplication [60]. However, segmental duplication and tandem duplication are generally considered to be the main reasons for the expansion of large plant gene families [61]. The most obvious of these is the soybean laccase gene family: 43.0% of soybean laccase genes were produced by tandem duplication and 45.1% were involved segmental duplication. P. trichocarpa laccases that expanded by tandem duplication accounted for 56.6% (30 of 53) of the gene family. These results indicate that the expansion mode of laccase in different species is species-specific.
Analysis of gene structure and protein motifs showed that the most closely related members of the phylogenetic tree had similar exon/intron structures. The motif content of P. trichocarpa laccase and soybean laccase [58] was both 10. Compared with soybean laccases, the motif of P. trichocarpa laccases was more conservative. The difference is that soybean laccase has four motifs at the N-terminal and C-terminal, while the N-terminal and C-terminal of P. trichocarpa have five and three, respectively. Compared with other members of the family, the gene cluster 8 of PtLAC contained two No. 8 motifs. This situation also existed in soybean subfamily V, which had 1–2 more motifs than other soybean laccases 3. It was certain that motif 1–10 was necessary for the function of P. trichocarpa laccase. The motif No. 8, unique to the members of cluster 8, may be a special structure of the gene cluster. The expression pattern of PtLACs shows that it is expressed in a large amount in roots, but had no obvious response to stress treatment. The expression level in leaves was generally low, but PtLAC16 showed a specific response to MeJA. In Liu’s study [57], the expression patterns of Glycine max (Linn.) Merr. and Z. mays laccase in tissues were described. The expression level of laccase in the roots and stems of soybean and corn was significantly higher than that in leaves and flowers. This is similar to our result. It shows the expression of plant laccase in tissues with higher lignin content.
Liang (2006) [62] found that soluble proanthocyanidins accumulate in the tt10 seed coat after the mutation of AtLAC15. As orthologous genes of AtLAC15, PtLAC10, PtLAC11, and PtLAC30 had certain functional similarities with AtLAC15. After PtLAC11 and PtLAC30 were ectopically expressed in Arabidopsis mutant tt10, the color of the seed coat changed from pale brown to brown; this finding was consistent with the WT. Kitamura (2004) showed that epicatechins and proanthocyanidins migrated from the vacuoles to cell walls in senescent testa [18]. Laccase interacted with phenolic compounds in the cell wall [63]. The subcellular localization results of PtLAC11 and PtLAC30 show that these two proteins can be localized in the cell wall. These studies supported the results that PtLAC11 and PtLAC30 participated in the oxidation of cell wall proanthocyanidins. The promoter region of PtLAC11 contained the MYB regulatory element MBSI, which was related to the synthesis of flavonoids, indicating that PtLAC11 might be regulated by the MYB transcription factor. Expression pattern data showed that PtLAC10 responded to drought stress, and its expression level was upregulated in roots, whereas PtLAC11 showed downregulation. Drought stress hardly affected the expression of PtLAC30. The microRNA target predictions of PtLAC10 and PtLAC11 were also different, indicating that these two genes were under different regulations. In summary, homologous genes of AtLAC15, PtLAC11, and PtLAC30 were involved in the oxidation process of cell wall proanthocyanidins. We proved that the gene function in cluster 2 was differentiated.
Hitaishi K (2020) [64] found that the mutant lac2 of AtLAC2 accumulated lignin in the roots, which affected the longitudinal growth of cells. The subcellular localization of PtLAC22, PtLAC25, and PtLAC26 in the cell wall indicated that these genes functioned at this location. After transferring PtLAC22, PtLAC25, and PtLAC26 genes into lac2, the roots of the transgenic plants grew normally and responded to osmotic stress caused by PEG. The deposition of lignin usually occurs on the secondary cell walls of growing plants [65]. Excessive lignin deposition reduces the diameter of xylem ducts, restricting the transport of water and nutrients [66]. PtLAC22, PtLAC25, and PtLAC26 could restore the phenotype of lac2, indicating their involvement in reducing root lignin accumulation. The regulatory regions of PtLAC25 and PtLAC26 contained the MYB regulatory element MBS, which was used to respond to drought stress. In the expression pattern data, the expression of this pair of genes was downregulated under drought stress, indicating that drought was a negative regulatory signal for these two genes. PtLAC22 could maintain normal expression levels under drought stress. Studies showed that in a period of water shortage, the root structure will undergo morphological changes to enhance its ability to absorb water and nutrients [67,68]. These changes can be traced back to events that coordinate cell division, extension, and differentiation. In areas with low rainfall, the shallow root structure is conducive to maximizing the extraction of water from the soil surface [69]. The downregulation of PtLAC25 and PtLAC26 in poplar roots might lead to the accumulation of lignin and a reduction in root elongation. No difference was observed in microRNA target prediction between PtLAC25 and PtLAC26 (Table S4). Experimental results showed that PtLAC22, PtLAC25, and PtLAC26 might respond to osmotic or drought stress by participating in the synthesis of root lignin. PtLAC25 and PtLAC26 might be a pair of tandem-duplicated genes with no functional divergence.

5. Conclusions

We identified 53 laccase genes in P. trichocarpa and reconstructed the phylogenetic relationships of P. trichocarpa laccase. The gene family began to expand during the evolution of angiosperms. The 221 land plant laccases were clearly divided into seven branches of Subfamilies I–VII (support rate > 65%). Subfamily VI is a unique branch of angiosperms. Two of the five laccase ancestors of seed plants experienced duplication events. Finally, eight ancient laccase genes were produced. Positive selection analysis with the branch-site model indicated that land plant LAC genes in Subfamily I–V experienced positive selection. Tandem-duplicated genes accounted for 56.6% of the members of P. trichocarpa laccase gene family, which was the main way for this gene family to expand. The motif and gene structure analyses of the tandem-duplicated gene of P. trichocarpa laccase did not provide evidence of functional divergence. The expression pattern data provided a basis for studying the different regulations of tandem repeat genes and the response difference of the repeat genes to different stresses, also explained the reasons why tandem repeat genes were retained. We noticed that the KS value, which represented the rate of base synonymous replacement during evolution, could be used to quantify the time of divergence. In this study, the KS value was used to quantify the divergence time of tandem-duplicated gene pairs. Cluster 2 with the earliest divergence time and cluster 5 with the latest divergence time were found. The results of subcellular localization showed that PtLAC11 in cluster 2 was located in the cell wall and PtLAC10 was located in the cell membrane, indicating their functional divergence. PtLAC25 and PtLAC26 in cluster 5 were both located on the cell wall, indicating the similarity of functions. Sequence alignment and genetic transformation experiments confirmed the functional divergence of cluster 2 and the undivergence of cluster 5. This study provides new ideas for the study of the function of P. trichocarpa laccase, new insights into the potential role of this family and methods to reveal the function of tandem-duplicated genes.

Supplementary Materials

The following supporting information can be downloaded at: https://www.mdpi.com/article/10.3390/f13020157/s1, Figure S1: Phylogenetic tree of land plant laccase. Figure S2: Comparison of root elongation amongst WT, lac2, OE-PtLac22, OE-PtLac25 and OEPtLac26 under normal growth conditions. Figure S3: Comparison of root elongation amongst WT, lac2, PtLac22-L222, PtLac22-L223; PtLac25-L252, PtLac25-L253 and PtLac26-L261, PtLac26-L226. Figure S4: Comparison of three-dimensional protein structure of genes in clusters 2 and 5. Figure S5: Cis-acting elements in promoter regions of genes in clusters 2 and 5. Table S1: Primers used in the experiments. Table S2: Full-length LAC protein sequences used to construct the phylogenetic trees in this study. Table S3: Populus trichocarpa laccase classification and cluster information. Table S4: List of the PtLAC genes with putative miRNA target sites. Table S5: KaKs_calculator calculation result.

Author Contributions

H.-L.Y. and N.X. conceived the project. N.X. performed research. N.X., X.-M.H., Y.X., X.-L.Z. and C.-N.G. contributed to data analysis, writing of the manuscript, and reviewed the manuscript. All authors have read and agreed to the published version of the manuscript.

Funding

This work was supported by the National Natural Science Foundation of China (No. 32071486) and the basic research funds of Chinese Academy of forestry (No. CAFYBB2019ZY002).

Data Availability Statement

The data presented in this study are available on request from the corresponding author.

Acknowledgments

The authors are grateful to Qing-Yin Zeng team of State Key Laboratory of Tree Genetics and Breeding for their constant support.

Conflicts of Interest

The authors declare no conflict of interest.

References

  1. Liu, Q.; Luo, L.; Wang, X.; Shen, Z.; Zheng, L. Comprehensive Analysis of Rice Laccase Gene (OsLAC) Family and Ectopic Expression of OsLAC10 Enhances Tolerance to Copper Stress in Arabidopsis. Int. J. Mol. Sci. 2017, 18, 209. [Google Scholar] [CrossRef] [PubMed]
  2. Wang, Y.; Bouchabke-Coussa, O.; Lebris, P.; Antelme, S.; Soulhat, C.; Gineau, E.; Dalmais, M.; Bendahmane, A.; Morin, H.; Mouille, G.; et al. LACCASE5 Is Required for Lignification of the Brachypodium distachyon Culm. Plant Physiol. 2015, 168, 192–204. [Google Scholar] [CrossRef] [PubMed] [Green Version]
  3. Turlapati, P.V.; Kim, K.-W.; Davin, L.B.; Lewis, N.G. The laccase multigene family in Arabidopsis thaliana: Towards addressing the mystery of their gene function(s). Planta 2010, 233, 439–470. [Google Scholar] [CrossRef] [PubMed]
  4. Zhao, Q.; Nakashima, J.; Chen, F.; Yin, Y.; Fu, C.; Yun, J.; Shao, H.; Wang, X.; Wang, Z.-Y.; Dixon, R.A. LACCASE Is Necessary and Nonredundant with PEROXIDASE for Lignin Polymerization during Vascular Development in Arabidopsis. Plant Cell 2013, 25, 3976–3987. [Google Scholar] [CrossRef] [Green Version]
  5. Pourcel, L.; Routaboul, J.M.; Kerhoas, L.; Caboche, M.; Lepiniec, L.; Debeaujon, I. TRANSPARENT TESTA10 encodes a laccase-like enzyme involved in oxidative polymerization of flavonoids in Arabidopsis seed coat. Plant Cell 2005, 17, 2966–2980. [Google Scholar] [CrossRef] [Green Version]
  6. Huang, M.T.; Lu, Y.C.; Zhang, S.; Luo, F.; Yang, H. Rice (Oryza sativa) Laccases Involved in Modification and Detoxification of Herbicides Atrazine and Isoproturon Residues in Plants. J. Agric. Food Chem. 2016, 64, 6397–6406. [Google Scholar] [CrossRef]
  7. Liang, M.; Haroldsen, V.; Cai, X.; Wu, Y. Expression of a putative laccase gene, ZmLAC1, in maize primary roots under stress*. Plant Cell Environ. 2006, 29, 746–753. [Google Scholar] [CrossRef]
  8. Wang, G.-D.; Li, Q.-J.; Luo, B.; Chen, X.-Y. Ex planta phytoremediation of trichlorophenol and phenolic allelochemicals via an engineered secretory laccase. Nat. Biotechnol. 2004, 22, 893–897. [Google Scholar] [CrossRef]
  9. Rensing, S.A.; Lang, D.; Zimmer, A.D.; Terry, A. The Physcomitrella genome reveals evolutionary insights into the conquest of land by plants. Science 2008, 319, 64–69. [Google Scholar] [CrossRef] [Green Version]
  10. Velasco, R.; Zharkikh, A.; Troggio, M. A high quality draft consensus sequence of the genome of a heterozygous grapevine variety. PLoS ONE 2007, 2, e1326. [Google Scholar] [CrossRef] [Green Version]
  11. Ming, R.; Hou, S.; Feng, Y. The draft genome of the transgenic tropical fruit tree papaya (Carica papaya Linnaeus). Nature 2008, 452, 991–996. [Google Scholar] [CrossRef] [Green Version]
  12. Flagel, L.E.; Wendel, J.F. Gene duplication and evolutionary novelty in plants. New Phytol. 2009, 183, 557–564. [Google Scholar] [CrossRef]
  13. Hanada, K.; Zou, C.; Lehti-Shiu, M.D.; Shinozaki, K.; Shiu, S.H. Importance of lineage-specific expansion of plant tandem duplicates in the adaptive response to environmental stimuli. Plant Physiol. 2008, 148, 993–1003. [Google Scholar] [CrossRef] [Green Version]
  14. Rodgers-Melnick, E.; Mane, S.P.; Dharmawardhana, P.; Slavov, G.T.; Crasta, O.R.; Strauss, S.H.; Brunner, A.M.; Difazio, S.P. Contrasting patterns of evolution following whole genome versus tandem duplication events in Populus. Genome Res. 2012, 22, 95–105. [Google Scholar] [CrossRef] [Green Version]
  15. Freeling, M. Bias in plant gene content following different sorts of duplication: Tandem, whole-genome, segmental, or by transposition. Annu. Rev. Plant Biol. 2009, 60, 433–453. [Google Scholar] [CrossRef]
  16. Tuskan, G.A.; Difazio, S.; Jansson, S. The genome of black cottonwood, Populus trichocarpa (Torr. & Gray). Science 2006, 313, 1596–1604. [Google Scholar]
  17. Ranocha, P.; Chabannes, M.; Chamayou, S.; Danoun, S.; Jauneau, A.; Boudet, A.M.; Goffner, D. Laccase down-regulation causes alterations in phenolic metabolism and cell wall structure in poplar. Plant Physiol. 2002, 129, 145–155. [Google Scholar] [CrossRef] [Green Version]
  18. Bryan, A.C.; Jawdy, S.; Gunter, L.; Gjersing, E.; Sykes, R.; Hinchee, M.A.; Winkeler, K.A.; Collins, C.M.; Engle, N.; Tschaplinski, T.J.; et al. Knockdown of a laccase in Populus deltoides confers altered cell wall chemistry and increased sugar release. Plant Biotechnol. J. 2016, 14, 2010–2020. [Google Scholar] [CrossRef]
  19. Alzohairy, A.M. BioEdit: An important software for molecular biology. GERF Bull. Biosci. 2011, 2, 60–61. [Google Scholar]
  20. Chen, C.; Chen, H.; Zhang, Y.; Thomas, H.R.; Frank, M.H.; He, Y.; Xia, R. TBtools: An Integrative Toolkit Developed for Interactive Analyses of Big Biological Data. Mol. Plant 2020, 13, 1194–1202. [Google Scholar] [CrossRef]
  21. Bailey, T.; Elkan, C. Fitting a Mixture Model by Expectation Maximization to Discover Motifs in Biopolymers. Proc. Int. Conf. Intell. Syst. Mol. Biol. 1994, 2, 28–36. [Google Scholar] [PubMed]
  22. Lang, D.; Ullrich, K.K.; Murat, F.; Fuchs, J.; Jenkins, J. The Physcomitrella patens chromosome-scale assembly reveals moss genome structure and evolution. Plant J. 2018, 93, 515–533. [Google Scholar] [CrossRef] [PubMed] [Green Version]
  23. Banks, J.A.; Nishiyama, T.; Hasebe, M.; Bowman, J.L.; Gribskov, M.; dePamphilis, C.; Albert, V.A.; Aono, N.; Aoyama, T.; Ambrose, B.A.; et al. The Selaginella Genome Identifies Genetic Changes Associated with the Evolution of Vascular Plants. Science 2011, 332, 960–963. [Google Scholar] [CrossRef] [PubMed] [Green Version]
  24. Amborella Genome, P. The Amborella genome and the evolution of flowering plants. Science 2013, 342, 1241089. [Google Scholar] [CrossRef]
  25. Ouyang, S.; Zhu, W.; Hamilton, J.; Lin, H.; Campbell, M.; Childs, K.; Thibaud-Nissen, F.; Malek, R.L.; Lee, Y.; Zheng, L.; et al. The TIGR Rice Genome Annotation Resource: Improvements and new features. Nucleic Acids Res. 2007, 35, D883–D887. [Google Scholar] [CrossRef] [Green Version]
  26. Jaillon, O.; Aury, J.M. The grapevine genome sequence suggests ancestral hexaploidization in major angiosperm phyla. Nature 2007, 449, 463–467. [Google Scholar]
  27. Lamesch, P.; Berardini, T.Z.; Li, D.; Swarbreck, D.; Wilks, C.; Sasidharan, R.; Muller, R.; Dreher, K.; Alexander, D.L.; Garcia-Hernandez, M.; et al. The Arabidopsis Information Resource (TAIR): Improved gene annotation and new tools. Nucleic Acids Res. 2012, 40, D1202–D1210. [Google Scholar] [CrossRef]
  28. Guindon, S.; Dufayard, J.F.; Lefort, V.; Anisimova, M.; Hordijk, W.; Gascuel, O. New algorithms and methods to estimate maximum-likelihood phylogenies: Assessing the performance of PhyML 3.0. Syst. Biol. 2010, 59, 307–321. [Google Scholar] [CrossRef] [Green Version]
  29. Keane, T.M.; Creevey, C.J.; Pentony, M.M.; Naughton, T.J.; McLnerney, J.O. Assessment of methods for amino acid matrix selection and their use on empirical data shows that ad hoc assumptions for choice of matrix are not justified. BMC Evol. Biol. 2006, 6, 29. [Google Scholar] [CrossRef] [Green Version]
  30. Anisimova, M.; Bielawski, J.P.; Yang, Z. Accuracy and Power of the Likelihood Ratio Test in Detecting Adaptive. Mol. Biol. Evol. 2001, 18, 1585–1592. [Google Scholar] [CrossRef] [Green Version]
  31. Yang, Z.; Nielsen, R.; Goldman, N.; Pedersen, A.M.K. Codon-Substitution Models for Heterogeneous Selection Pressure at Amino Acid Sites. Genetics 2000, 155, 431–449. [Google Scholar] [CrossRef]
  32. Gao, F.; Chen, C.; Arab, D.A.; Du, Z.; He, Y.; Ho, S.Y.W. EasyCodeML: A visual tool for analysis of selection using CodeML. Ecol. Evol. 2019, 9, 3891–3898. [Google Scholar] [CrossRef] [Green Version]
  33. Yang, Z. PAML 4: Phylogenetic analysis by maximum likelihood. Mol. Biol. Evol. 2007, 24, 1586–1591. [Google Scholar] [CrossRef] [Green Version]
  34. Yang, Z.; Wong, W.S.; Nielsen, R. Bayes empirical bayes inference of amino acid sites under positive selection. Mol. Biol. Evol. 2005, 22, 1107–1118. [Google Scholar] [CrossRef] [Green Version]
  35. Zhang, Z.; Xiao, J.; Wu, J.; Zhang, H.; Liu, G.; Wang, X.; Dai, L. ParaAT: A parallel tool for constructing multiple protein-coding DNA alignments. Biochem. Biophys. Res. Commun. 2012, 419, 779–781. [Google Scholar] [CrossRef]
  36. Zhang, Z.; Li, J.; Zhao, X.-Q.; Wang, J.; Wong, G.K.-S.; Yu, J. KaKs_Calculator: Calculating Ka and Ks through Model Selection and Model Averaging. Genom. Proteom. Bioinform. 2006, 4, 259–263. [Google Scholar] [CrossRef] [Green Version]
  37. Rivers, C.S.; Wardlaw, J.M.; Armitage, P.A.; Bastin, M.E.; Carpenter, T.K.; Cvoro, V.; Hand, P.J.; Dennis, M.S. Persistent Infarct Hyperintensity on Diffusion-Weighted Imaging Late after Stroke Indicates Heterogeneous, Delayed, Infarct Evolution. Stroke 2006, 37, 1418–1423. [Google Scholar] [CrossRef] [Green Version]
  38. Banerjee, A.; Roychoudhury, A. Epigenetic regulation during salinity and drought stress in plants: Histone modifications and DNA methylation. Plant Gene 2017, 11, 199–204. [Google Scholar] [CrossRef]
  39. Xing, H.; Fu, X.; Yang, C.; Tang, X.; Guo, L.; Li, C.; Xu, C.; Luo, K. Genome-wide investigation of pentatricopeptide repeat gene family in poplar and their expression analysis in response to biotic and abiotic stresses. Sci. Rep. 2018, 8, 2817. [Google Scholar] [CrossRef] [Green Version]
  40. Kim, D.; Langmead, B.; Salzberg, S.L. HISAT: A fast spliced aligner with low memory requirements. Nat. Methods 2015, 12, 357–360. [Google Scholar] [CrossRef] [Green Version]
  41. Li, H.; Handsaker, B.; Wysoker, A.; Fennell, T.; Ruan, J.; Homer, N.; Marth, G.; Abecasis, G.; Durbin, R.; Genome Project Data Processing Subgroup. The Sequence Alignment/Map format and SAMtools. Bioinformatics 2009, 25, 2078–2079. [Google Scholar] [CrossRef] [PubMed] [Green Version]
  42. Anders, S.; Pyl, P.T.; Huber, W. HTSeq—A Python framework to work with high-throughput sequencing data. Bioinformatics 2015, 31, 166–169. [Google Scholar] [CrossRef] [PubMed]
  43. Clough, S.J.; Bent, A.F. Floral dip: A simplified method for Agrobacterium-mediated transformation of Arabidopsis thaliana. Plant J. 1998, 16, 735–743. [Google Scholar] [CrossRef] [PubMed] [Green Version]
  44. Lalitha, S. Primer Premier 5. Biotech Softw. Internet Rep. 2000, 1, 270–272. [Google Scholar] [CrossRef]
  45. Cai, X.; Davis, E.J.; Ballif, J.; Liang, M.; Bushman, E.; Haroldsen, V.; Torabinejad, J.; Wu, Y. Mutant identification and characterization of the laccase gene family in Arabidopsis. J. Exp. Bot. 2006, 57, 2563–2569. [Google Scholar] [CrossRef] [Green Version]
  46. Wu, S.J.; Ding, L.; Zhu, J.K. SOS1, a Genetic Locus Essential for Salt Tolerance and Potassium Acquisition. Plant Cell 1996, 8, 617–627. [Google Scholar] [CrossRef] [Green Version]
  47. McCaig, B.C.; Meagher, R.B.; Dean, J.F. Gene structure and molecular analysis of the laccase-like multicopper oxidase (LMCO) gene family in Arabidopsis thaliana. Planta 2005, 221, 619–636. [Google Scholar] [CrossRef]
  48. Hakulinen, N.; Rouvinen, J. Three-dimensional structures of laccases. Cell. Mol. Life Sci. 2015, 72, 857–868. [Google Scholar] [CrossRef]
  49. Xie, T.; Liu, Z.; Wang, G. Structural basis for monolignol oxidation by a maize laccase. Nat. Plants 2020, 6, 231–237. [Google Scholar] [CrossRef]
  50. Boruc, J.; Mylle, E.; Duda, M.; De Clercq, R.; Rombauts, S.; Geelen, D.; Hilson, P.; Inze, D.; Van Damme, D.; Russinova, E. Systematic localization of the Arabidopsis core cell cycle proteins reveals novel cell division complexes. Plant Physiol. 2010, 152, 553–565. [Google Scholar] [CrossRef] [Green Version]
  51. Marques, A.C.; Vinckenbosch, N.; Brawand, D.; Kaessmann, H. Functional diversification of duplicate genes through subcellular adaptation of encoded proteins. Genome Biol. 2008, 9, R54. [Google Scholar] [CrossRef] [Green Version]
  52. Qian, W.; Zhang, J. Protein subcellular relocalization in the evolution of yeast singleton and duplicate genes. Genome Biol. Evol. 2009, 1, 198–204. [Google Scholar] [CrossRef] [Green Version]
  53. Shirley, B.W.; Hanley, S.; Goodman, H.M. Effects of Ionizing Radiation on a Plant Genome: Analysis of Two Arabidopsis transparent testa Mutations. Plant Cell 1992, 4, 333–347. [Google Scholar]
  54. Shirley, B.W.; Kubasek, W.L.; Storz, G.; Bruggemann, E.; Koornneef, M.; Ausubel, F.M.; Goodman, H.M. Analysis of Arabidopsis mutants deficient in flavonoid biosynthesis. Plant J. 1995, 8, 659–671. [Google Scholar] [CrossRef]
  55. Simoes, M.S.; Carvalho, G.G.; Ferreira, S.S.; Hernandes-Lopes, J.; de Setta, N.; Cesarino, I. Genome-wide characterization of the laccase gene family in Setaria viridis reveals members potentially involved in lignification. Planta 2020, 251, 46. [Google Scholar] [CrossRef]
  56. Xu, X.; Zhou, Y.; Wang, B.; Ding, L.; Wang, Y.; Luo, L.; Zhang, Y.; Kong, W. Genome-wide identification and characterization of laccase gene family in Citrus sinensis. Gene 2019, 689, 114–123. [Google Scholar] [CrossRef]
  57. Liu, M.; Dong, H.; Wang, M.; Liu, Q. Evolutionary divergence of function and expression of laccase genes in plants. J. Genet. 2020, 99, 23. [Google Scholar] [CrossRef]
  58. Wang, Q.; Li, G.; Zheng, K.; Zhu, X.; Ma, J.; Wang, D.; Tang, K.; Feng, X.; Leng, J.; Yu, H.; et al. The Soybean Laccase Gene Family: Evolution and Possible Roles in Plant Defense and Stem Strength Selection. Genes 2019, 10, 701. [Google Scholar] [CrossRef] [Green Version]
  59. Moore, R.C.; Purugganan, M.D. The early stages of duplicate gene evolution. Proc. Natl. Acad. Sci. USA 2003, 100, 15682–15687. [Google Scholar] [CrossRef] [Green Version]
  60. Kong, H.; Landherr, L.L.; Frohlich, M.W.; Leebens-Mack, J.; Ma, H.; dePamphilis, C.W. Patterns of gene duplication in the plant SKP1 gene family in angiosperms: Evidence for multiple mechanisms of rapid gene birth. Plant J. 2007, 50, 873–885. [Google Scholar] [CrossRef]
  61. Cannon, S.B.; Mitra, A.; Baumgarten, A.; Young, N.D.; May, G. The roles of segmental and tandem gene duplication in the evolution of large gene families in Arabidopsis thaliana. BMC Plant Biol. 2004, 4, 10. [Google Scholar] [CrossRef] [Green Version]
  62. Liang, M.; Davis, E.; Gardner, D.; Cai, X.; Wu, Y. Involvement of AtLAC15 in lignin synthesis in seeds and in root elongation of Arabidopsis. Planta 2006, 224, 1185–1196. [Google Scholar] [CrossRef]
  63. Khandal, H.; Singh, A.P.; Chattopadhyay, D. The MicroRNA397b-LACCASE2 Module Regulates Root Lignification under Water and Phosphate Deficiency. Plant Physiol. 2020, 182, 1387–1403. [Google Scholar] [CrossRef]
  64. Liu, L.; Dean, J.F.D.; Friedman, W.E.; Eriksson, K.-E.L. A laccase-like phenoloxidase is correlated with lignin biosynthesis in Zinnia elegans stem tissues. Plant J. 1994, 6, 213–224. [Google Scholar] [CrossRef]
  65. Qin, S.; Fan, C.; Li, X.; Li, Y.; Hu, J.; Li, C.; Luo, K. LACCASE14 is required for the deposition of guaiacyl lignin and affects cell wall digestibility in poplar. Biotechnol. Biofuels 2020, 13, 197. [Google Scholar] [CrossRef]
  66. Fan, L.; Linker, R.; Gepstein, S.; Tanimoto, E.; Yamamoto, R.; Neumann, P.M. Progressive inhibition by water deficit of cell wall extensibility and growth along the elongation zone of maize roots is related to increased lignin metabolism and progressive stelar accumulation of wall phenolics. Plant Physiol. 2006, 140, 603–612. [Google Scholar] [CrossRef] [Green Version]
  67. Dinneny, J.R. Developmental Responses to Water and Salinity in Root Systems. Annu. Rev. Cell Dev. Biol. 2019, 35, 239–257. [Google Scholar] [CrossRef]
  68. Rellán-Álvarez, R.; Lobet, G.; Dinneny, J.R. Environmental Control of Root System Biology. Annu. Rev. Plant Biol. 2016, 67, 619–642. [Google Scholar] [CrossRef] [Green Version]
  69. Gupta, A.; Rico-Medina, A.; Caño-Delgado, A.I. The physiology of plant responses to drought. Science 2020, 368, 3. [Google Scholar] [CrossRef]
Figure 1. (a) Phylogenetic tree for the PtLACs and other plant laccases. The phylogenetic relationship was constructed using the maximum likelihood procedure on the basis of the amino acids of the Arabidopsis (AT), Amborella trichopoda (ATR), Glycine max (Gm), O. sativa (Os), Physcomitrella patens (Pp), Vitis vinifera (Vv), Herba Selaginellae moellendorfii (SM), and Populus trichocarpa (Pt) under the model of WAG + I + G and bootstrap = 1000. Subfamilies I–VII are marked on the outermost of the tree. The branch length was shown next to the branches. (b) Hypothetical evolutionary histories of laccases in terrestrial plants.
Forests 13 00157 g001
Figure 2. Genomic localization of P. trichocarpa laccase gene family. Schematic view of chromosome reorganization by the most recent whole-genome duplication in Populus. Regions that were assumed to correspond to homologous genome blocks were shaded grey and connected by lines. Paralogous LAC genes and clusters were indicated by dashed lines within grey-shaded trapezoids. The genes for functional research in this paper are marked in green.
Forests 13 00157 g002
Figure 3. Motif distribution and gene structure of PtLACs. The multiple alignment of 53 full-length PtLAC amino acid sequences was performed by MAFFT v7. Each PtLACs subfamily is marked. MEME identification of conserved motifs in PtLAC proteins. Each motif is represented by a different color block. The sequence logos of 10 conserved motifs were named 1–10. Yellow rectangles represented exons and horizontal lines represented introns. The scale estimates the lengths of exons and introns. The scale bar represents 100 amino acid residues for protein sequences and 1.0 kb for gene structure.
Forests 13 00157 g003
Figure 4. Hierarchical clustering of the expression profiles of PtLACs in different organs or abiotic stress. Expression data of PtLACs in three tissues were collected from RNA-Seq data. Log2 value of FPKM + 1 (FPKM > 0) was converted.
Forests 13 00157 g004
Figure 5. (a) Ks of 11 PtLACs clusters. (b) Amino acid sequence alignments of cluster 2, cluster 5, and their corresponding secondary structures. The blue curve, yellow arrow, and straight line represent α-helix, β-sheet, and connecting sequence, respectively.
Forests 13 00157 g005
Figure 6. (a) Arrangement of cluster 2/cluster 5 in the chromosome and their clustering relationship with PtLAC30 and AtLAC15/PtLAC22 and AtLAC2. (b) Subcellular localizations of cluster 2/cluster 5. GFP signal (green) was detected using confocal laser scanning microscopy. The plasma membrane separated from the cell wall after plasmolysis is indicated by white arrows. Bar = 10 µm.
Forests 13 00157 g006
Figure 7. RT-PCR detection of the expression of PtLACs in transgenic Arabidopsis for the phenotype observation of transgenic Arabidopsis seed coat. Bar = 1 mm.
Forests 13 00157 g007
Figure 8. Overexpression of transgenic Arabidopsis detected using RT-PCR. Arabidopsis seedling roots were treated with PEG8000. WT, lac2 and PtLac22-L221, PtLac25-L251, PtLac26-L261 plants were treated with 33.5% PEG8000, bars = 1 cm. Comparison of root elongation amongst WT, lac2, PtLac22-L221, PtLac25-L251, and PtLac26-L261. **** p < 0.0001. The remaining transgene lines are shown in Figure S3. The control group is shown in Figure S2.
Forests 13 00157 g008
Table 1. Information of Laccase gene family in Populus trichocarpa.
GeneGene ModelAmino AcidIsoelectronic Point (pI)Molecular WeightGeneGene ModelAmino AcidIsoelectronic Point (pI)Molecular Weight
PtLAC1Potri.001G0546005819.2964.262KDPtLAC30Potri.011G0711005558.7260.919KD
PtLAC2Potri.001G1843005819.364.015KDPtLAC31Potri.011G1202005626.6763.079KD
PtLAC3Potri.001G2062005649.1963.345KDPtLAC32Potri.011G1203005819.0363.935KD
PtLAC4Potri.001G2487005579.0561.145KDPtLAC33Potri.012G0489005819.1864.027KD
PtLAC5Potri.001G3416005808.9164.163KDPtLAC34Potri.013G1527005799.3564.456KD
PtLAC6Potri.001G4011005819.1964.264KDPtLAC35Potri.014G1006005769.2964.491KD
PtLAC7Potri.001G4013005819.264.197KDPtLAC36Potri.015G0404005727.2663.456KD
PtLAC8Potri.004G1564005736.4664.341KDPtLAC37Potri.015G0406005798.5264.38KD
PtLAC9Potri.005G2005005648.9462.557KDPtLAC38Potri.015G0407005798.9664.499KD
PtLAC10Potri.005G2006005667.0463.558KDPtLAC39Potri.015G0408005599.9162.010KD
PtLAC11Potri.005G2007005667.6263.558KDPtLAC40Potri.016G1060005686.8261.924KD
PtLAC12Potri.006G0871005656.563.026KDPtLAC41Potri.016G1061005698.4962.01KD
PtLAC13Potri.006G0875005809.1963.79KDPtLAC42Potri.016G1063005628.3161.538KD
PtLAC14Potri.006G0941005799.8464.094KDPtLAC43Potri.016G1075005686.8261.958KD
PtLAC15Potri.006G0969005628.361.508KDPtLAC44Potri.016G1079005698.0562.029KD
PtLAC16Potri.006G0970005589.5261.311KDPtLAC45Potri.016G1120005579.360.916KD
PtLAC17Potri.006G0971005599.5661.285KDPtLAC46Potri.016G1121005649.5362.027KD
PtLAC18Potri.007G0233005599.5661.426KDPtLAC47Potri.019G0885005677.0162.76KD
PtLAC19Potri.008G0640005627.2662.356KDPtLAC48Potri.019G0886005677.2962.781KD
PtLAC20Potri.008G0737005567.2760.948KDPtLAC49Potri.019G0887005677.6862.77KD
PtLAC21Potri.008G0738005749.2363.889KDPtLAC50Potri.019G0888005666.4962.735KD
PtLAC22Potri.009G0345005826.6263.906KDPtLAC51Potri.019G0889005676.7862.919KD
PtLAC23Potri.009G0425005769.3563.523KDPtLAC52Potri.019G1217005768.2363.9KD
PtLAC24Potri.009G1027005569.0360.74KDPtLAC53Potri.019G1243005768.2363.888KD
PtLAC25Potri.009G1566005618.9162.735KD* PtLAC1-frPotri.001G243200259
PtLAC26Potri.009G1568005769.263.512KD* PtLAC2-frPotri.001G401000215
PtLAC27Potri.010G1835005769.3163.481KD* PtLAC3-frPotri.016G083300147
PtLAC28Potri.010G1836005827.6364.164KD* PtLAC4-frPotri.016G083400189
PtLAC29Potri.010G1931005758.7563.672KD* PtLAC5-frPotri.T096500183
* It is considered as a fragment of pseudogene in this paper.
Table 2. Selective pressure analyses of LACCASE genes in terrestrial lants by branch-site model.
Foreground
Branches
ModelnpLNL2Δ (LNL)Estimates of ParametersModel ComparedLRT p-ValuePositive Sites
Subfamily IModel A420−105,416.8313906.62418Site class012a2bModel A vs.Model A nullp < 0.05163 L 334 F (p > 0.95)
f0.837180.094910.060990.00691
ω00.127381.000000.127381.00000
ω10.127381.0000018.6216318.62163
Model A null419−105,420.1434821 Not Allowed
Subfamily IIModel A412−103,339.3740835.42867Site class012a2bModel A vs.Model A nullp < 0.0526 E (p > 0.95)
f0.854220.098270.042610.00490
ω00.128611.000000.128611.00000
ω10.128611.0000049.2174549.21745
Model A null411−103,342.0884181 Not Allowed
Subfamily IIIModel A420−105,420.4683815.27829Site class012a2bModel A vs.Model A nullp < 0.0526 E (p > 0.95)
f0.855710.096940.042540.00482
ω00.127411.000000.127411.00000
ω10.127411.0000043.0909343.09093
Model A null419−105,423.1075241 Not Allowed
Subfamily IVModel A420−105,405.39761513.5655Site class012a2bModel A vs.Model A nullp < 0.0155 C 93 T 95 L 170 M 227 G 236 S 242 A 324 F (p > 0.95)
f0.805180.091210.093070.01054
ω00.12711.000000.127131.00000
ω10.127131.000007.236467.23646
Model A null419−105,412.1803741 Not Allowed
Subfamily VModel A420−105,411.6717276.82632Site class012a2bModel A vs.Model A nullp < 0.012 V 33 H 50 R 179 I 252 R (p > 0.95)
f0.737460.083620.160700.01822
ω00.127111.000000.127111.00000
ω10.127111.000009.123889.12388
Model A null419−105,415.0848871 Not Allowed
Subfamily VIModel A420−105,420.8566123.31621Site class012a2bModel A vs.Model A nullp > 0.05Not Found
f0.857080.097230.041030.00466
ω00.127431.000000.127431.00000
ω10.127431.000004.041024.04102
Model A null419−105,422.5147171 Not Allowed
Subfamily VIIModel A420−105,423.3788740.05589Site class012a2bModel A vs.Model A nullp > 0.05Not Found
f0.001930.000220.896190.10167
ω00.127451.000000.127451.00000
ω10.127451.000005.995375.99537
Model A null419−105,423.4068211 Not Allowed
Note: 2∆(LNL): Log likelihood difference between models using the c2-test.
Publisher’s Note: MDPI stays neutral with regard to jurisdictional claims in published maps and institutional affiliations.

