Article

Modeling of Falling Ball Impact Test Response on Solid, Veneer, and Traditional Engineered Wood Floorings of Several Hardwoods

1
Intasa S.A., Polígono Penapurreira, 15320 As Pontes de García Rodríguez, Spain
2
Timber Structures and Wood Technology Research Group, Universidad de Valladolid, 47014 Valladolid, Spain
3
Wood Research Laboratory (LIMAD), School of Agrarian and Forestry Sciences, National University of La Plata, Buenos Aires B1900, Argentina
4
Instituto Universitario de Investigación en Ciencias Ambientales de Aragón (IUCA), EPS, University of Zaragoza, Carretera de Cuarte s/n, 22071 Huesca, Spain
*
Author to whom correspondence should be addressed.
Forests 2022, 13(2), 167; https://doi.org/10.3390/f13020167
Submission received: 8 January 2022 / Revised: 19 January 2022 / Accepted: 21 January 2022 / Published: 22 January 2022
(This article belongs to the Special Issue Performance Testing and Service Life of Wood and Wood-Based Materials)

Abstract

:
Hardness is a key mechanical property of flooring materials. In this study, the performance of veneer floorings (with a top layer thickness of 0.6 mm) was investigated by dynamic hardness tests, comparing it with those of traditional engineered wood floorings (with a top layer thickness of 3 mm) and solid wood floorings. Two hardwoods commonly used on wood flooring, viz. Quercus robur L. and Hymenaea courbaril L., and two fast-growing hardwoods, Eucalyptus globulus Labill. and Eucalyptus grandis W. Hill ex Maiden, were tested as top layers. To compare their usage properties, a dynamic impact hardness test involving steel balls with three diameters and five different drop heights was carried out, measuring the footprint diameter (FD) and the indentation depth (ID). The data from 4800 impacts, corresponding to 180 different individual groups (4 hardwood species × 3 ball diameters × 5 drop heights × 3 floor types) were analyzed. The results showed that the general response in terms of both FD and ID was better in the engineered wood floorings than in solid wood floorings, and that the veneer floorings (0.6 mm) showed better behavior than traditional engineered wood floorings (3.0 mm). Furthermore, for the veneer floorings, the two fast-growing hardwood species tested, which have significantly different densities, showed similar behavior to traditional hardwoods, suggesting that they would be suitable for valorization in the wood flooring industry.

1. Introduction

The use of wood floorings in building construction is widespread, to the extent that wood has become the most used floor material [1]. At present, four main types of wood floorings are available: solid wood floorings, parquet wood floorings, engineered wood floorings, and veneer floorings. Nonetheless, as discussed below, no real differences between the latter two are defined in regions outside Europe.
Solid wood flooring is made with a single piece of hardwood (i.e., a solid piece of noble wood), while engineered wood floorings consist of an inner core with a thin noble wood layer on top (i.e., a multilayer heart with a final noble wood top layer). The modernization of the industrial flooring sector and the development of new products have resulted both in quality improvement and cost reductions, making engineered wood floorings more competitive than solid ones [2,3,4]. The current trend in the industry is towards the development of new multilayer products with lower top layer thicknesses, supported by technology improvements and pushed by new consumer habits [5]. As a result, conventional technical floors are being replaced by novel products with noble wood layers with thicknesses below 1 mm, which enable the production of a greater amount of floor volume with the same amount of noble wood [6].
Even though all these products are engineered floorings made with wood, the European Federation of the Parquet Industry [7] differentiates three types of wood-based floorings depending on the top layer thickness: parquet, with a top layer thickness over 2.5 mm; engineered wood floorings, when the top layer thickness ranges between 2.5 and 0.7 mm; and veneer floorings, with a top layer thickness under 0.7 mm. However, no official distinction is made by other associations or in other countries (e.g., in the USA, Canada, or China, for example), where all these products are simply considered ‘engineered wood floorings’ [8].
From a market perspective, solid wood floorings of fine hardwood were traditionally requested by customers, but preferences have gradually shifted towards different engineered wood floorings, which have significantly increased their market share over the past two decades [9,10]. The global wood flooring market, considering the main economic areas, is estimated at around 397M m2 in China, 172M m2 in North America, and 81M m2 in Europe [11]. Wood engineered floorings are the largest product segment, accounting for 52%, 23%, and 82% of the market share in North America, China [12], and Europe [7,13], respectively. A growth of 5% is expected for the next 5 years, and veneer flooring will experience the highest growth, mainly concentrated in China [11,14].
As noted above, veneer flooring is based on the use of a thinner top layer, which increases both the competitiveness and technical stability of the composition. The top layer can be produced from the log by a rotary peeling or slicing process, simpler and cheaper than traditional production. All producers in Europe use high-density fiberboard (HDF) as the inner core, with a specific gravity >850 kg·m−3, and claim that the resistance to impact is better than that of normal parquet made with a 3 mm wear layer [15,16]. Nonetheless, it is worth noting that the technical lifespan of the product is reduced, with entailed limitations in terms of re-coating of varnish or re-sanding of the top layer. Veneer flooring with a top layer thickness of less than 0.7 mm may only be subjected to re-coating but not to re-sanding. Considering re-sanding, every millimeter of top layer thickness allows for refinishing once every 20 or 30 years. Hence, a 2-mm thickness of the wear layer would imply an estimated lifespan of 30 to 40 years, and a 3-mm wear layer would withstand three to four refinishes with an estimated lifespan of 40 to 50 years [17]. There is no public information about other reasons to replace this kind of wood flooring, but the need for re-decoration, color-changing, and others could substantially reduce the technical lifespan.
Concerning the top layer, few species are used for flooring purposes, mainly hardwoods [18], and, more recently, some softwoods after a densification treatment [19,20]. Oak (Quercus robur L.) is the main traditional species in all markets [7,21]. However, a remarkable share of the forest industry investments is now going to fast-growing markets in Asia and low-cost production regions, such as South America [14]. Among the different species available, Eucalyptus stands out in terms of availability, sustainability, price [22], and mechanical performance [23,24,25]. Hence, it may be an alternative to hardwood species for the wood flooring industry [26,27].
Accordingly, the work presented herein aims to: (i) evaluate the performance of veneer floorings with a 0.6 mm top layer through dynamic hardness tests, comparing it with that of traditional products (engineering wood floorings with a 3.0 mm top layer and solid wood floorings), with a view to a possible introduction of the former into the European market; (ii) explore the possibility of industrial utilization of two fast-growing species (viz. E. globulus and E. grandis) in the top layer, taking oak and jatoba (Hymenaea courbaril L.) as a reference for comparison purposes; (iii) provide models that can predict the dynamic hardness test response of various wood flooring products in order to facilitate the choice of appropriate combinations of wood flooring typology, top layer thickness, and composition that meet market exigencies.

2. Materials and Methods

2.1. Wood Sources

Four hardwood species were evaluated: two of them, oak and jatoba, are widely used in wood floorings, whereas the two Eucalyptus species, blue gum and rose gum, are fast-growing species with no current application in wood flooring. To reduce the variability of the physical properties of the wood due to different environmental conditions during growth, each lot came from a single sawmill. Timber pieces without visual defects were selected. The oak wood lot came from a sawmill in Milicz (Poland); the jatoba wood lot came from a sawmill in Belém (Brazil); the E. globulus lot came from plantations located in Arzúa and Curtis (Galicia, Spain); and the E. grandis lot was obtained from plantations located in Concordia (Entre Ríos, Argentina).
Upon arrival at the laboratory, the samples were kept in controlled conditions at a temperature of 20 ± 2 °C and relative air humidity of 65% ± 5% according to EN 408:2011 [28]. After 3 months, once the wood pieces had stabilized, the moisture content of the different species was measured according to EN 13183:2002 [29] (Table 1).

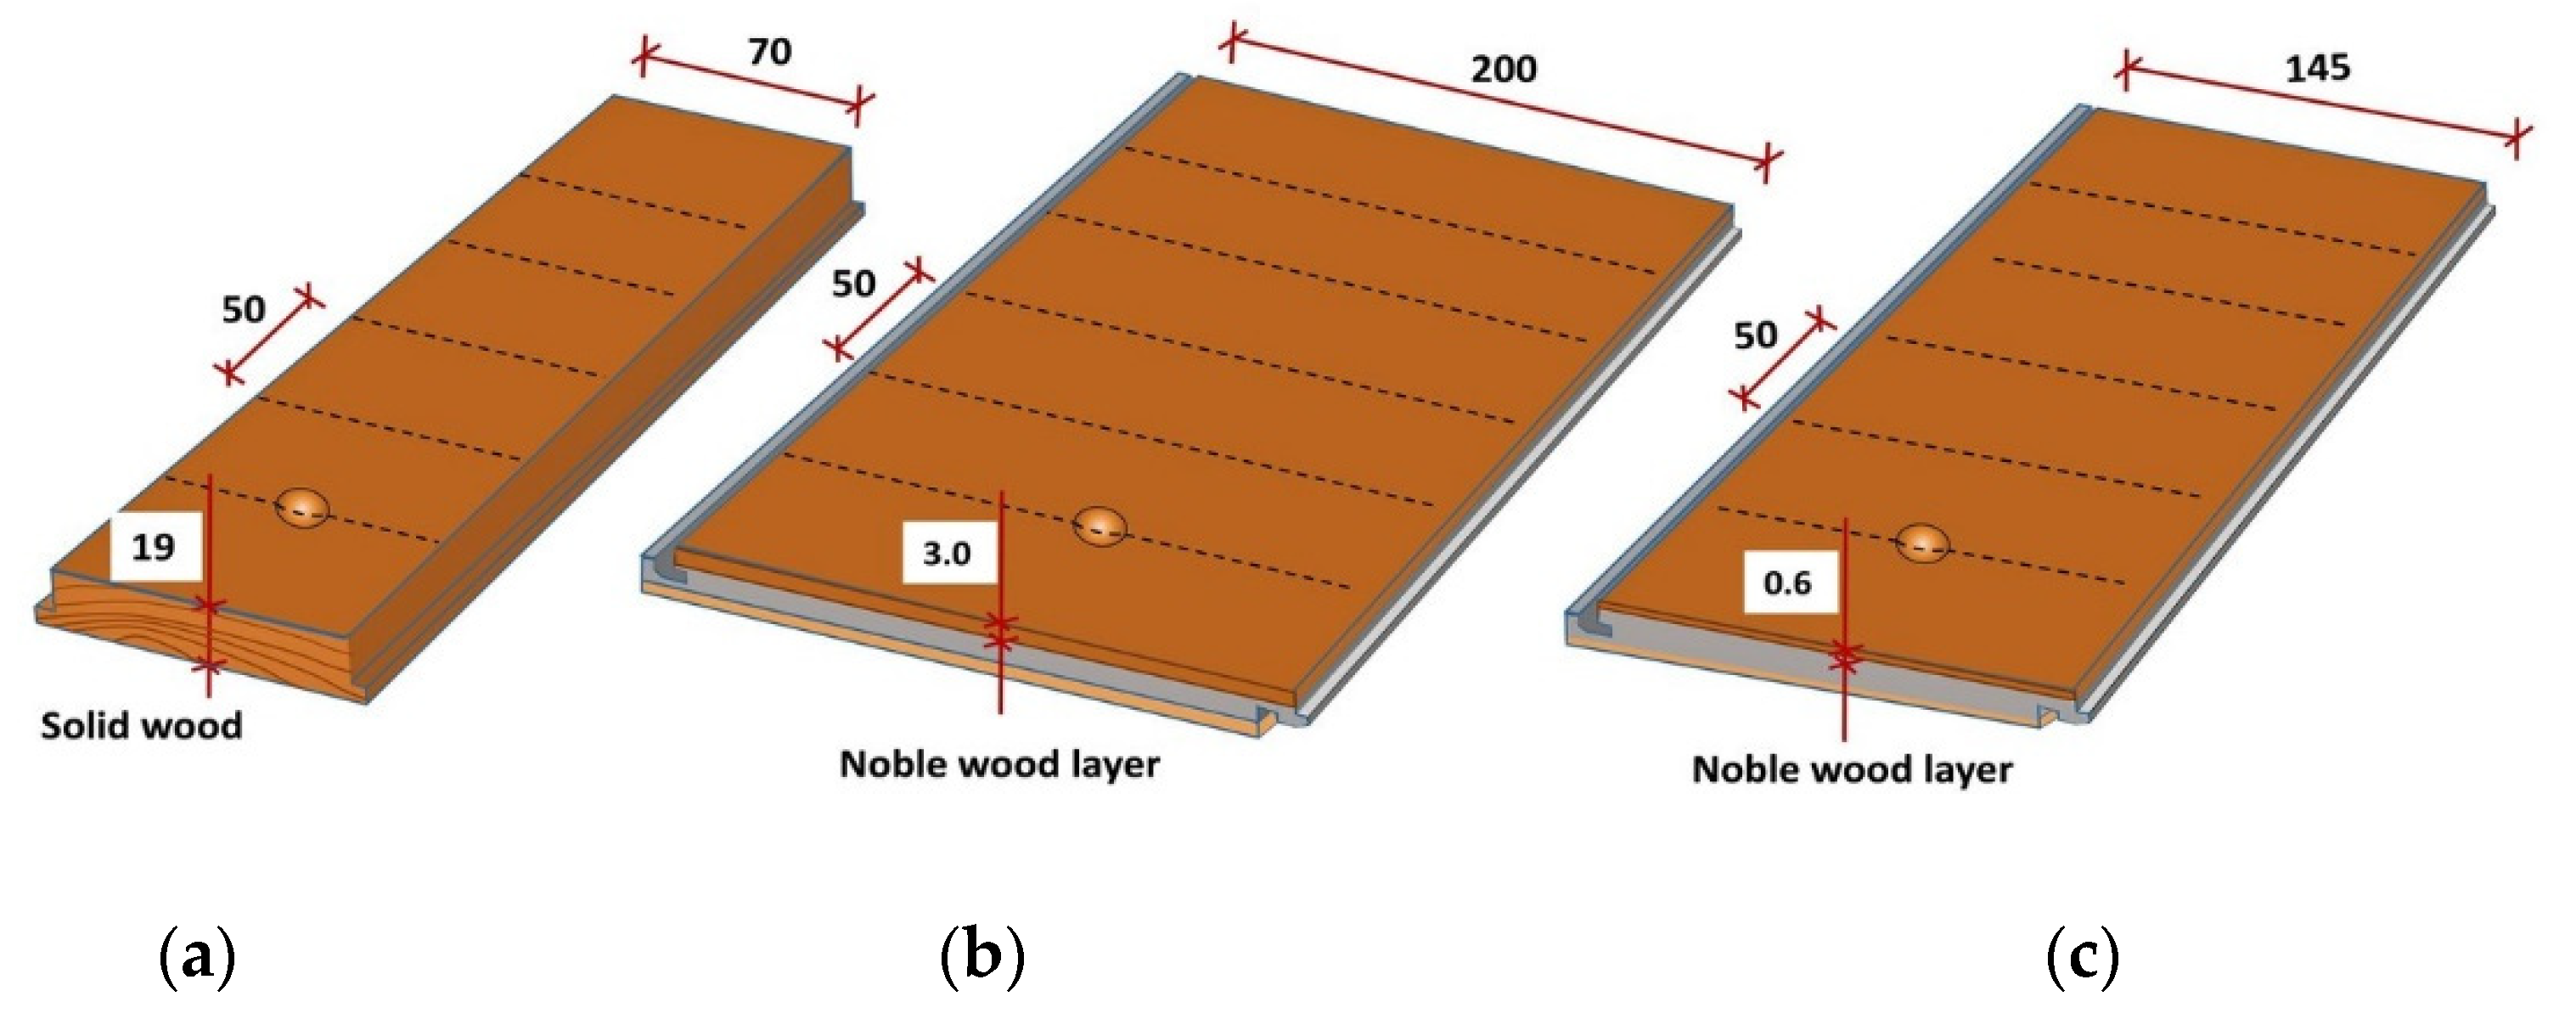
2.2. Wood Flooring Specimens

Three types of wood floorings were assayed (Table 1), namely:
  • Solid wood flooring (SW), consisting of a single piece of wood (sawn, brushed, and sanded).
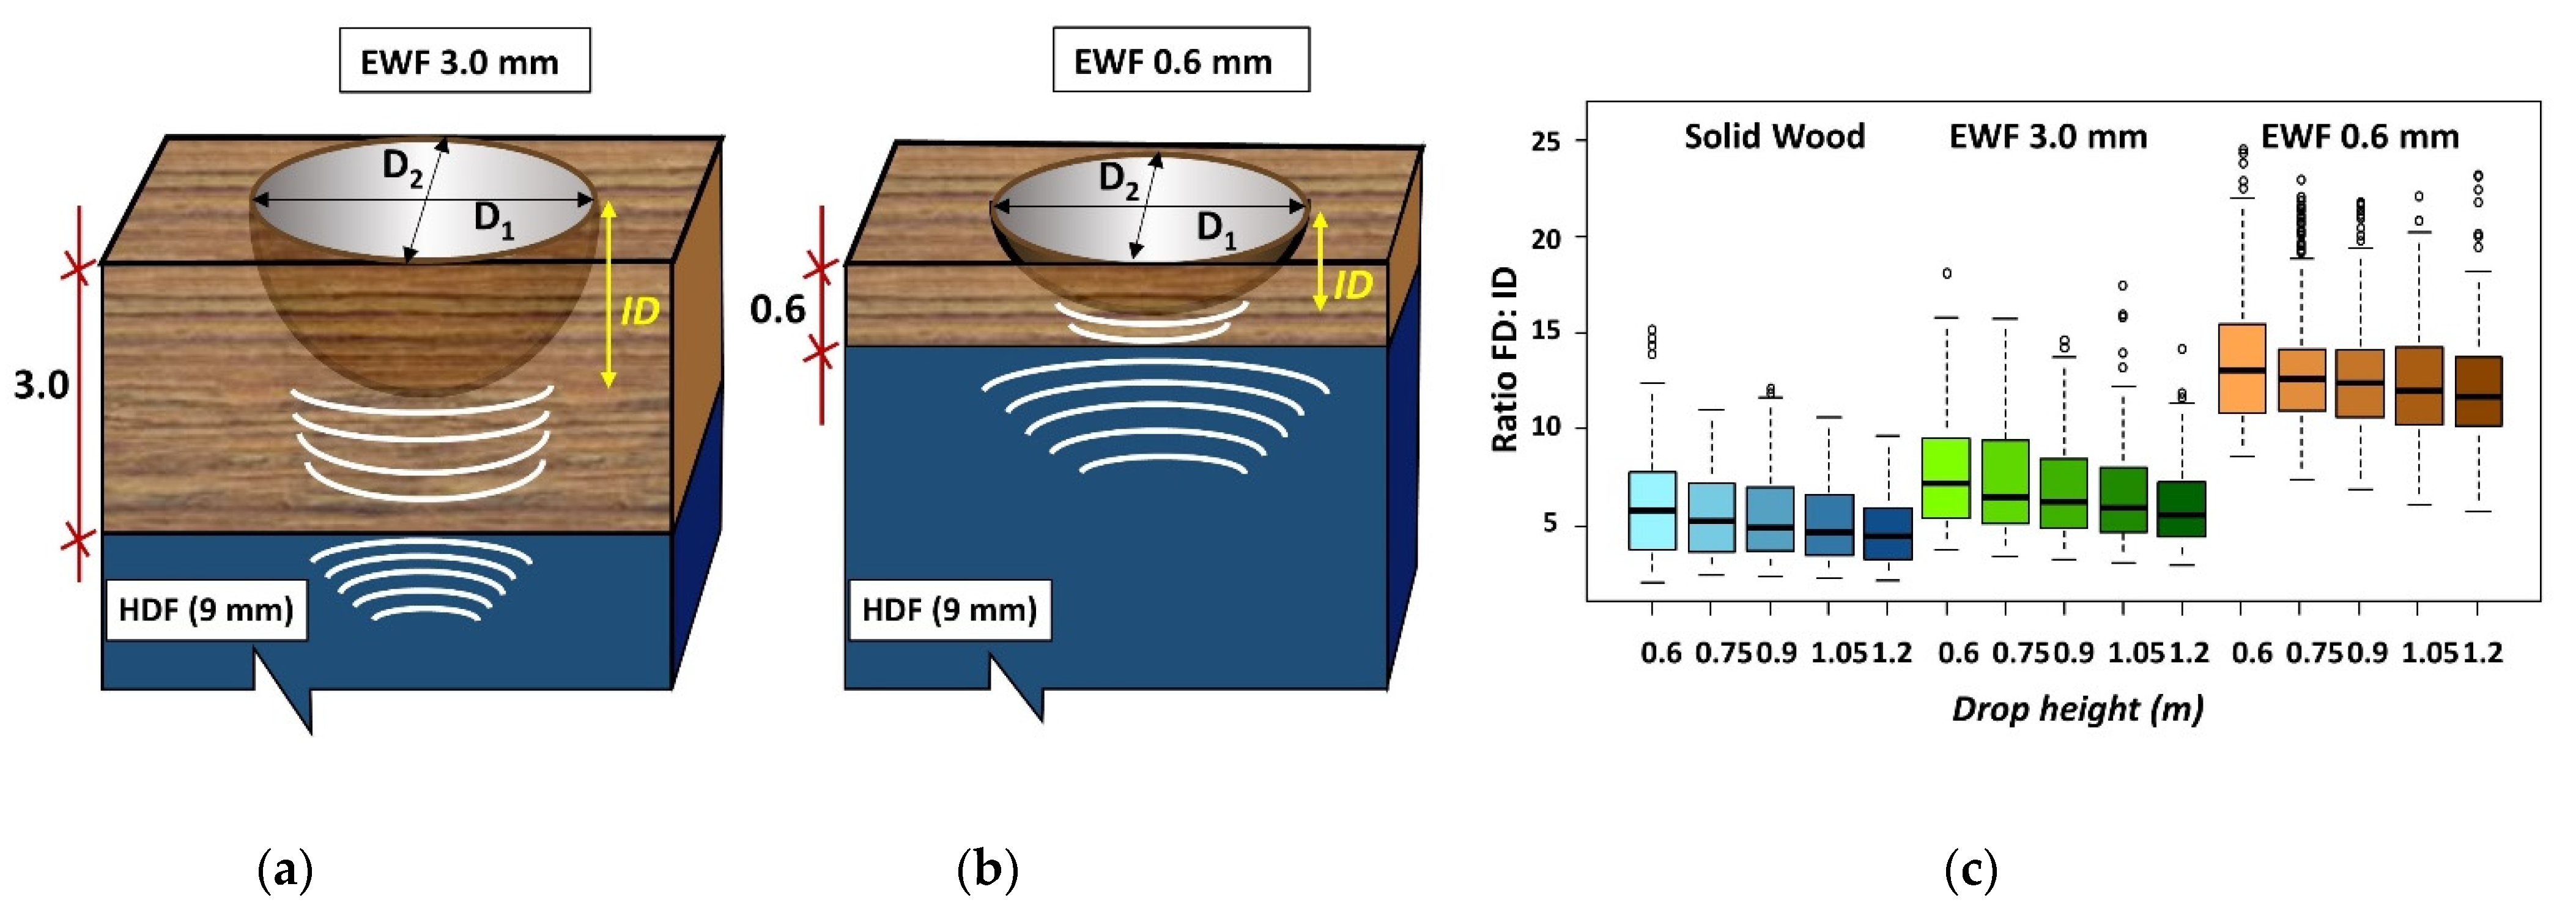
  • Engineered wood flooring with a 3-mm top layer (EWF 3 mm), consisting of 3 layers: a 3-mm hardwood wear layer obtained by a thin-cutting frame saw, a 9-mm backing panel of HDF (850 kg·m−3), and a 2-mm backing layer of pine unrolled veneer (Pinus radiata D. Don, 500 kg·m−3).
  • Veneer flooring or engineered wood flooring with a 0.6-mm top layer (EWF 0.6 mm), consisting of a 0.6-mm thick top layer of veneer obtained by slicing, a 9-mm backing panel of HDF (850 kg·m−3), and a 0.5-mm backing layer of pine unrolled veneer (P. radiata, 500 kg·m−3).
All wood layers were glued with polyvinyl acetate (PVAc). The tested surfaces were varnished with the Bona UV system with a matte finish, consisting of 5 coats and about 80 g·m−2 [30].
All samples were manufactured ad hoc at Intasa S.A. wood flooring factory located in As Pontes de García Rodríguez (Galicia, Spain).

2.3. Dynamic Hardness Testing

The dynamic hardness of the different samples was evaluated through the ball impact test by measuring the footprint diameter (FD) and indentation depth (ID). According to ASTM D1037-99 [31] and ASTM D2394-83(1999) [32], with the modifications of some parameters of the tests indicated in AITIM recommendations [33], the FD and ID of the impact footprint left by different diameter steel balls upon free fall from a given height were measured. While it does not require sophisticated equipment, it may cause perimeter breakage of the wood fibers as a result of excessive impact energy, hampering an accurate measurement of the footprint. Hence, a modification of the procedure proposed by Acuña et al. [23] was followed instead: the wood impact test was performed with three steel balls of three different sizes (ø = 30, 40, 50 mm), and at five different reference heights (0.60, 0.75, 0.90, 1.05, and 1.20 m). The impact energies for each diameter and height combination are summarized in Table 2. In the tests, chromed steel balls, of 100Cr6 steel type (SKF, Gothenburg, Sweden), with the indicated hardness according to ISO 3290-1:2014 [34] standard, were used. Table 3 shows the characteristics of the steel balls used in the tests.
The sample from each group (4 hardwood species × 3 types of wood flooring) consisted of 50 pieces. The dimensions of the specimens, detailed in Table 1, were chosen because they are the most common in the wood flooring industry. Each specimen was subjected to at least 5 impacts with a minimum spacing of 50 mm (the location of the impacts is shown in Figure 1), resulting in a total of 4800 impacts.
Following the methodology proposed by Acuña et al. [23], the specimens were placed on a completely rigid surface and were anchored to it using clamps located on the perimeter, thus avoiding any influence of the support on the deformation behavior. Subsequently, each of the reference drop heights was tested on each of the specimens using an auxiliary metallic instrument to guarantee the test conditions (precise reference height, and initial velocity u0 = 0 m·s−1), as shown in Figure 2.
For each impact, the FD and ID were measured using a digital micrometer (with a ±0.001 mm error) and a back plunger dial indicator (with a ±0.01 mm error), both from Mitutoyo (Takatsu-ku, Kawasaki, Kanagawa, Japan). To improve the impact readings, carbon paper was placed on the specimen surface. It should be clarified that the ball impact produces an elliptical deformation due to the different compressive strengths in the parallel- and perpendicular-to-the-fibers direction, so the mean diameter of the footprint was calculated as the mean value between the D1 (direction of the fiber) and D2 (transverse to the fiber) values.

2.4. Statistical Analyses

All statistical analyses were performed using R software (v. 4.1.1:2021). Steel ball diameter and drop height were selected to establish the statistical design according to ASTM D1037-99 [31] and AITIM [33] recommendations. For each group (hardwood species × ball diameter × drop height × wood flooring type), the number of tests was established by an initial and traditional variability analysis, performed with 800 tests. Accordingly, the number of replicates (n) obtained with a 95% confidence level was 26 trials. However, to ensure the adequate performance of the design, between 30 and 35 trials per group were carried out, resulting in a total of 4800 impacts, corresponding to 180 different individual groups.
The assumptions of independence, normality, and homoscedasticity were checked for the two variables under study (FD and ID) in each of the 180 sample groups. The normality of the data was tested for all populations using the Shapiro–Wilk normality test and Q–Q normal probability plots. The homoscedasticity requirement was contrasted by Bartlett’s test. Since it was not met on numerous occasions, the usual comparative analysis by ANOVA could not be used. Robust comparison methods were used instead: Welch’s heteroscedastic F-test with trimmed means and Winsorized variances. This robust procedure tests for equality of means by replacing the usual means and variances with trimmed means and Winsorized variances [35,36], together with bootstrapping and comparison using robust homogeneous groups.
To select the response models, generalized linear models (GLM) from different families (Gaussian and gamma families) and different link functions (identity, inverse, log) were used, selecting for each target variable (FD, ID) the one that offered the best explanation. This performance was evaluated employing residual analysis, the residual deviance [37], the Akaike information criterion (AIC) [38], the Bayesian information criterion (BIC) [39,40], and Efron’s R2 value [41]. These values, together with the likelihood-ratio test and Wald’s test, make it possible to establish the model’s goodness-of-fit.

3. Results and Discussion

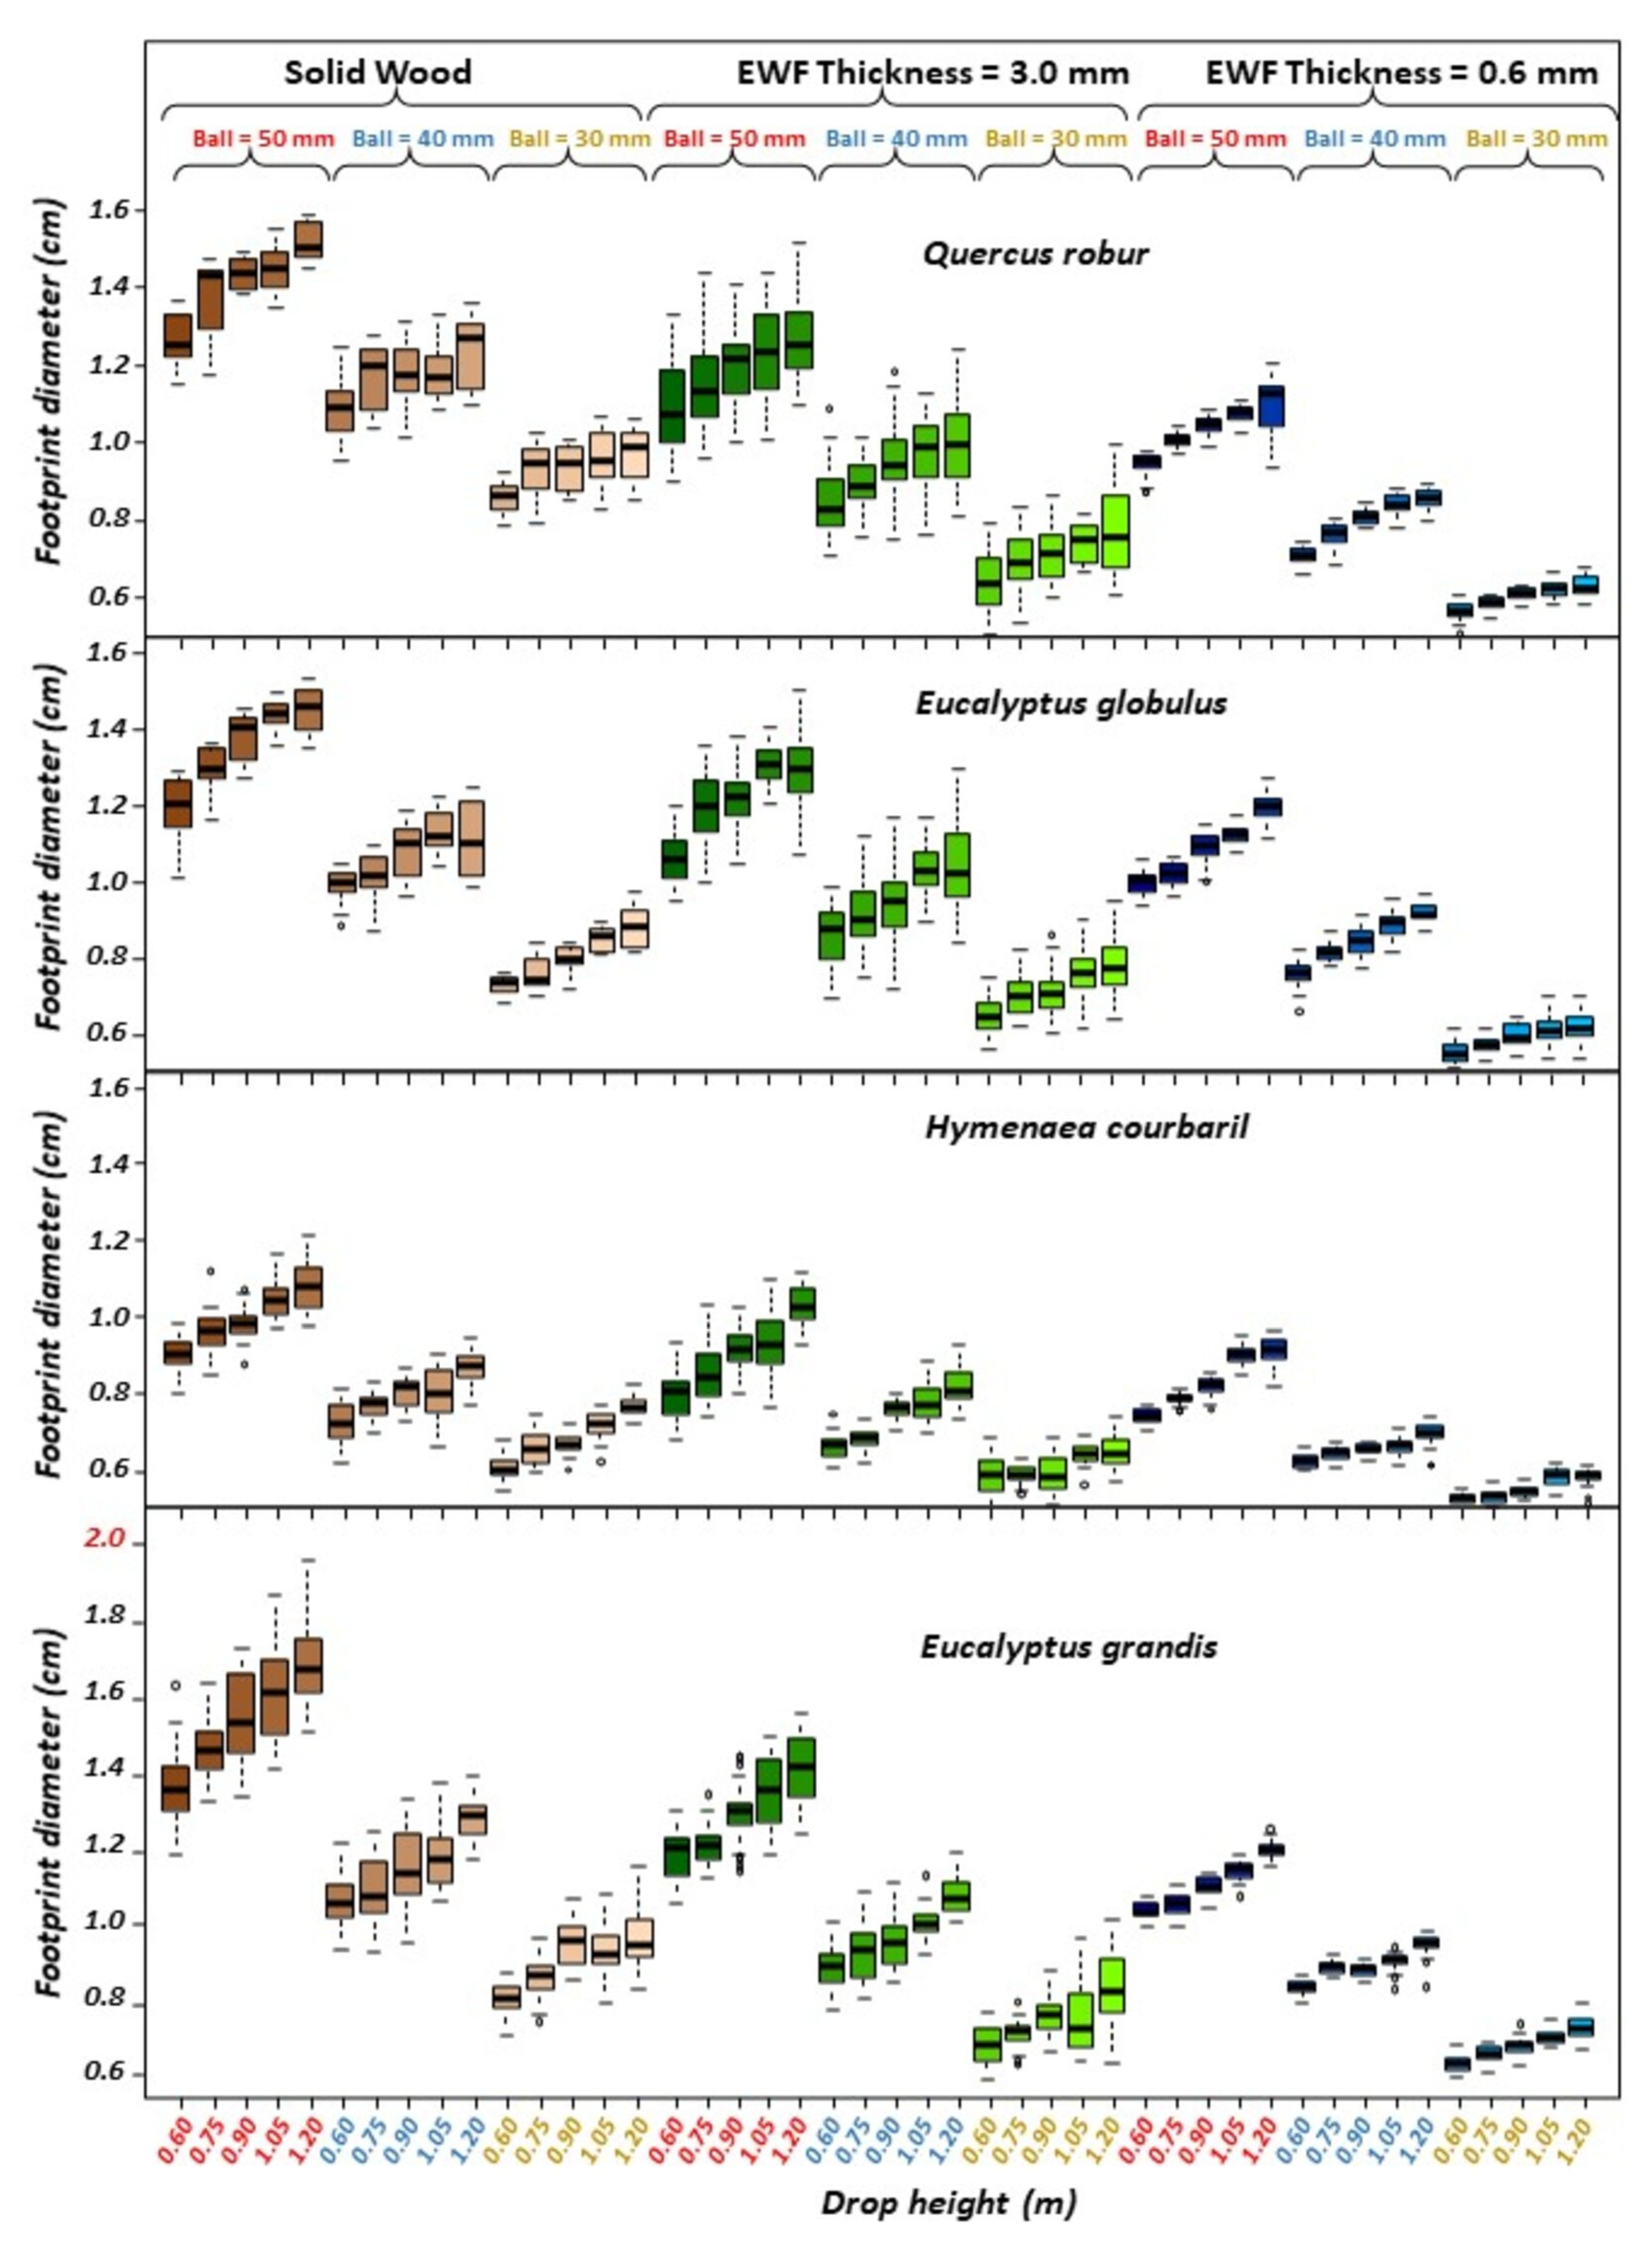
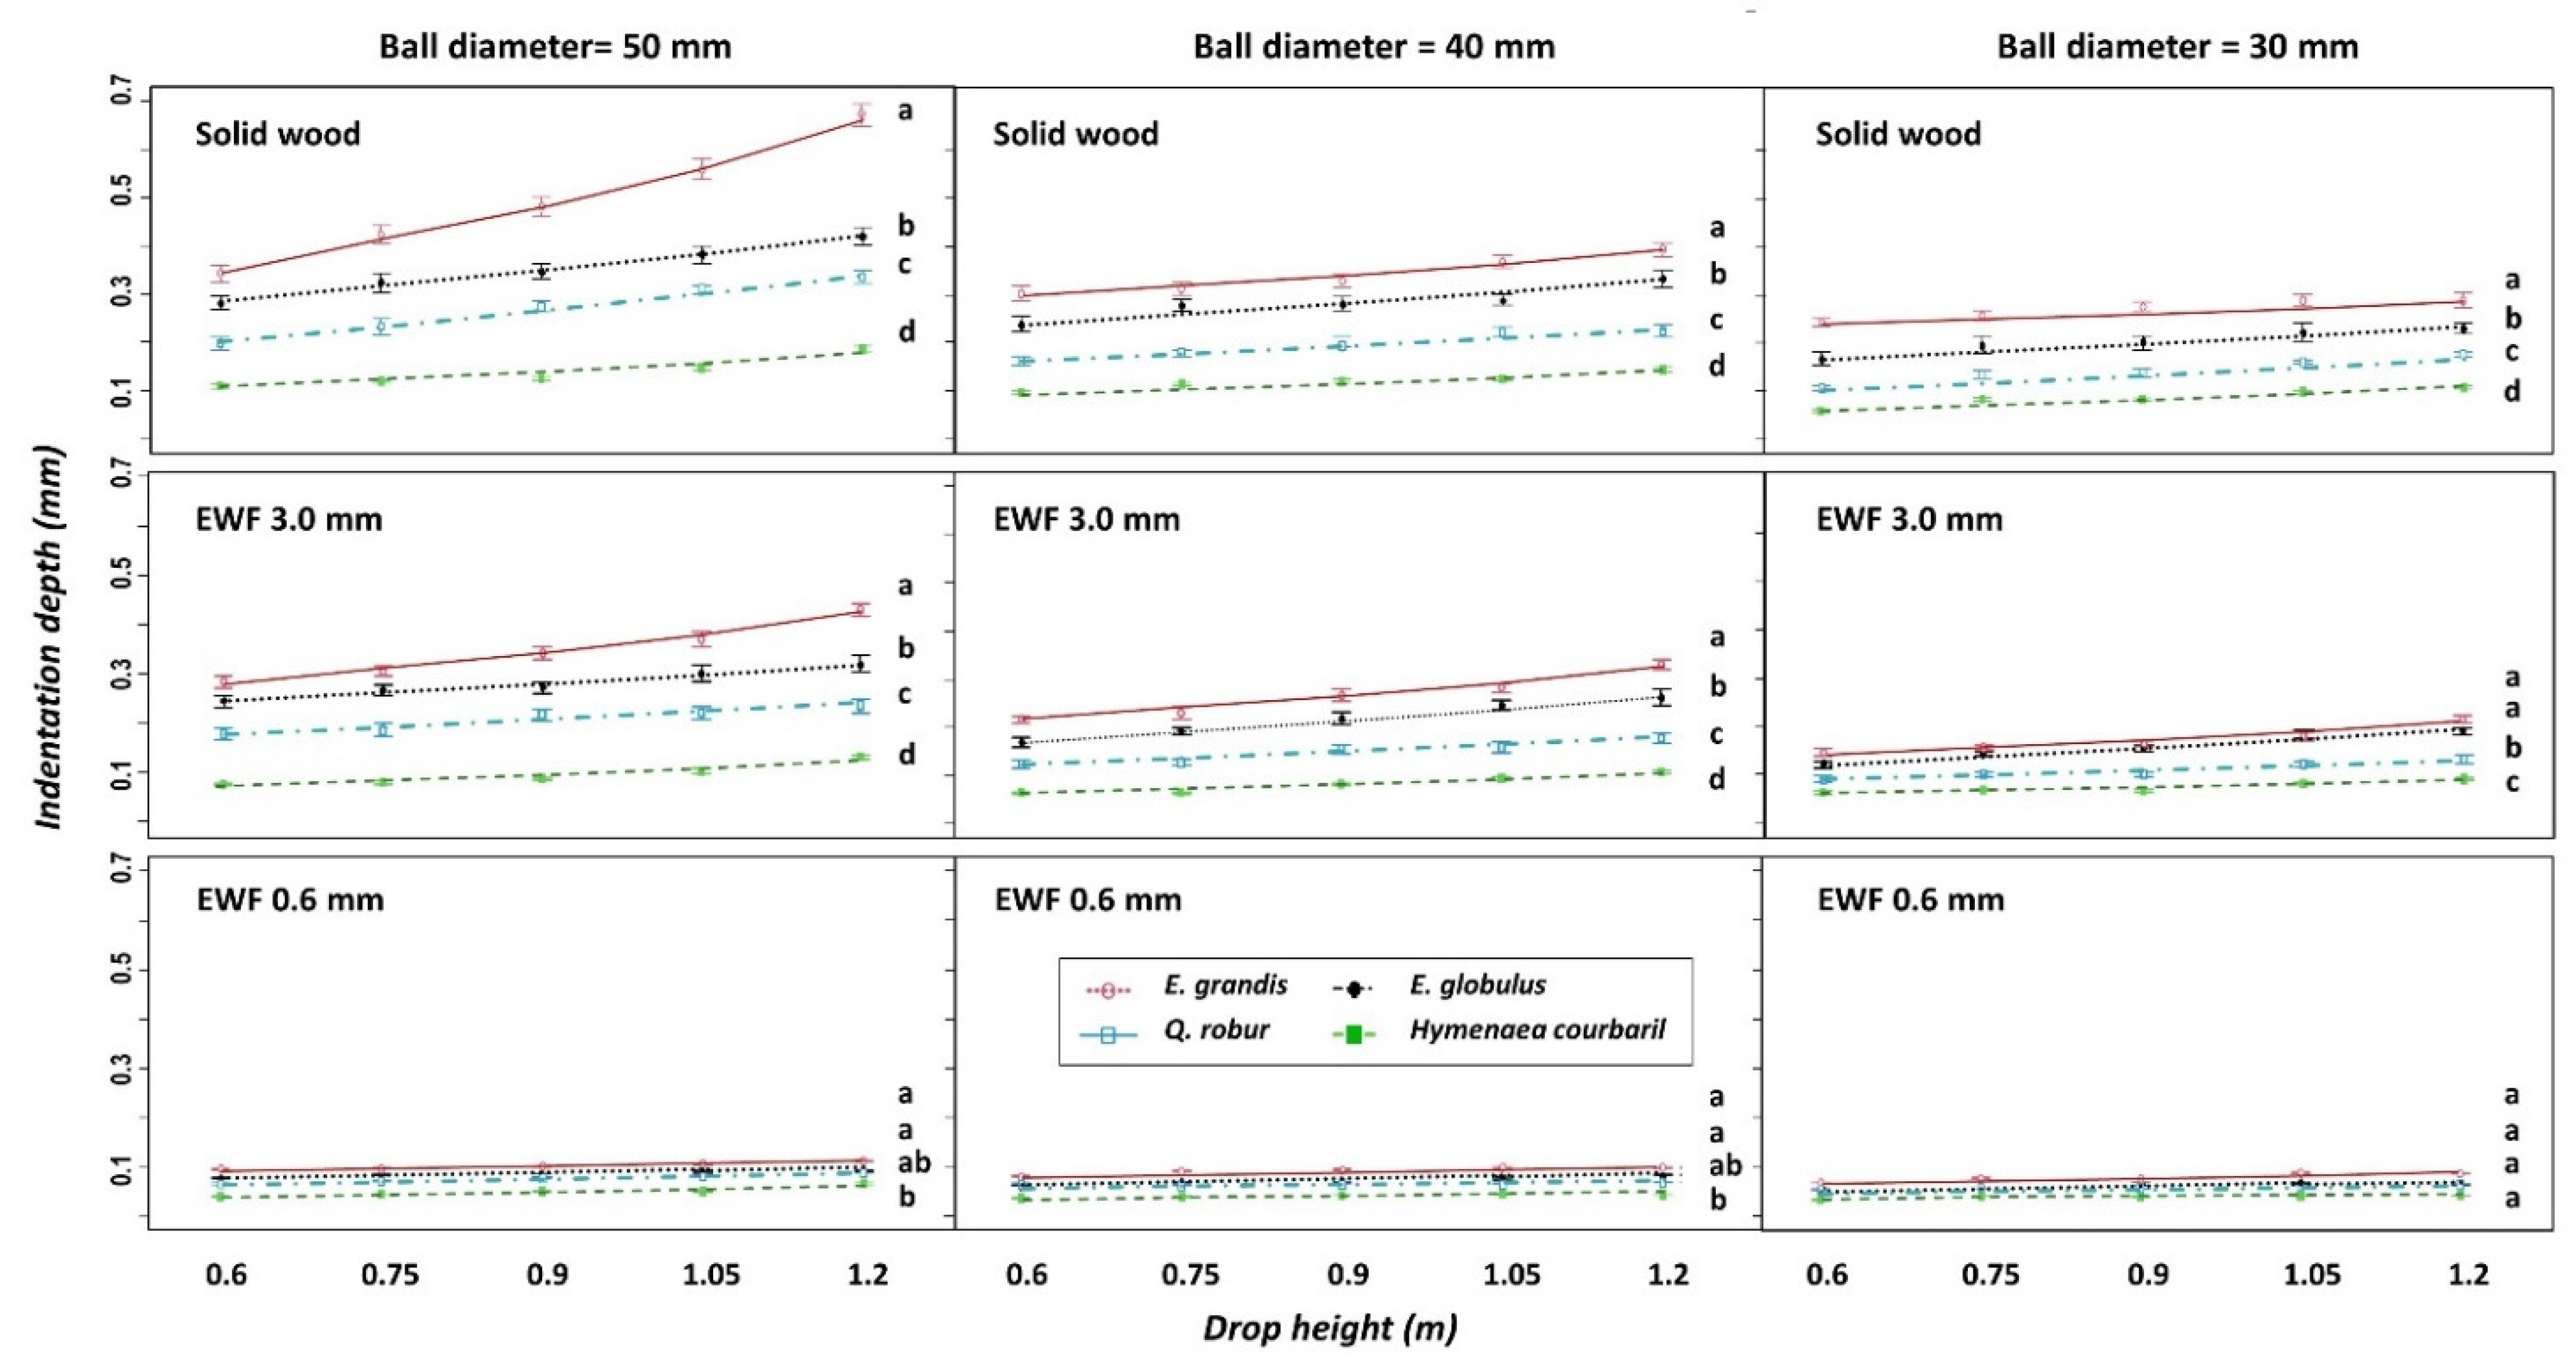
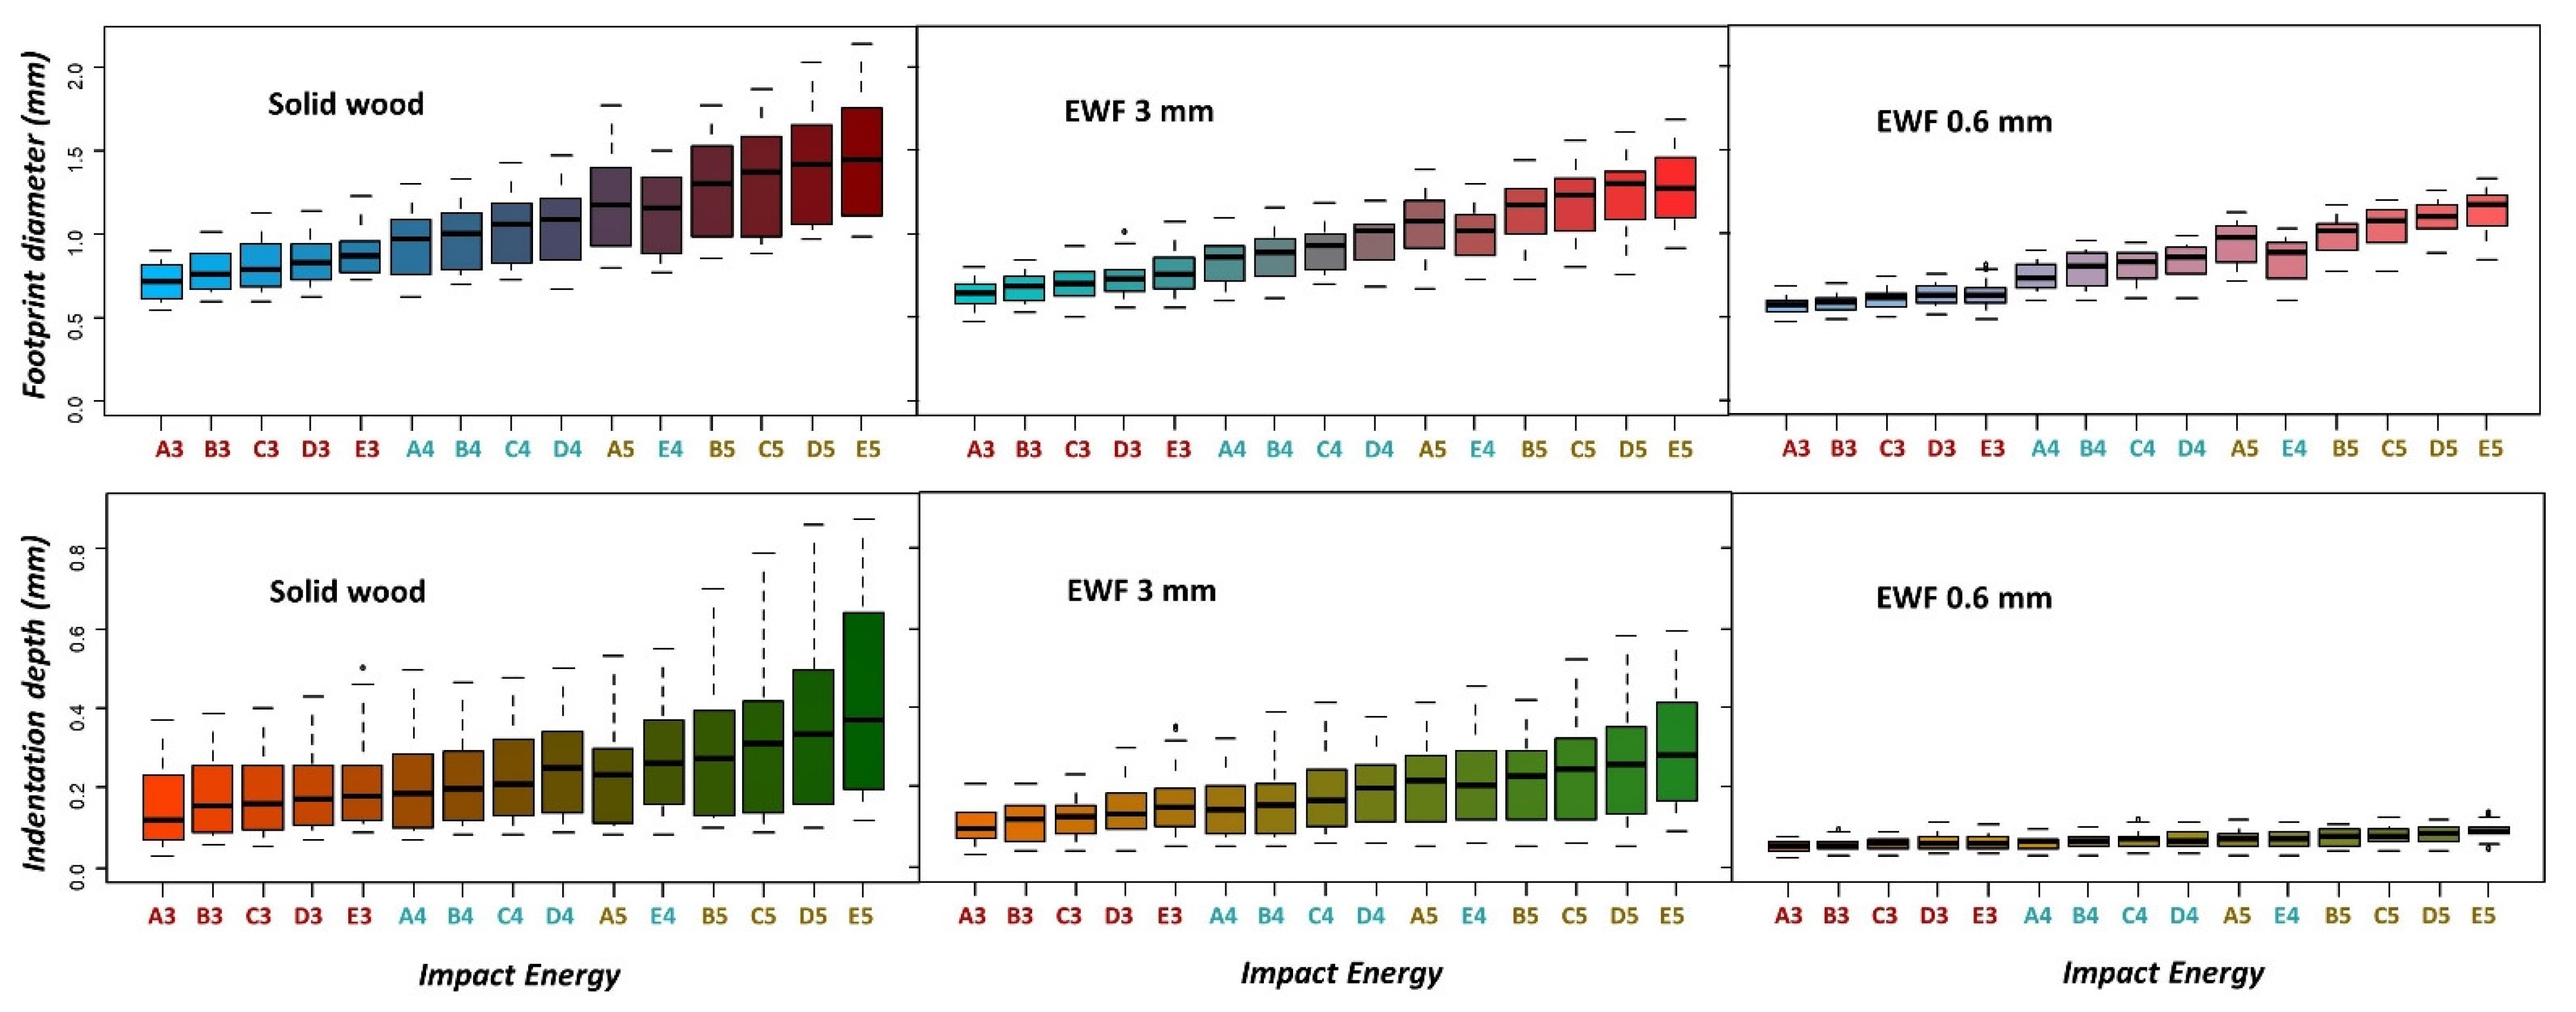
3.1. Descriptive Statistics

Box plots of the two variables under study, viz. average footprint diameter and indentation depth, as a function of the wood flooring type, hardwood species used in the top layer, steel ball diameter, and drop height are presented in Figure 3 and Figure 4, respectively. The main descriptive statistics by groups are summarized in Table S1 for SW and in Table S2 for EWF.

3.2. Model Selection

According to the box plots presented in Figure 3 and Figure 4, several general trends in the response of the target variables, FP and ID, could be observed. These trends were influenced by: (i) the ball diameter (the larger the diameter, the larger FD and ID were); (ii) the ball drop height (the higher the drop height, the higher the values of FD and ID were); (iii) the type of wood flooring and thickness of the noble layer, with higher values in SW than in EWF, and, in the latter case, higher values of FD and ID for a larger thickness of the top layer; and (iv) the hardwood species used, with higher FD and ID values for the hardwood species with lower densities. The significance and importance of these influences were corroborated by an analysis of variance of the GLMs established for the two target variables, FD and ID, which may be expressed by Equations (1) and (2):
FD = V 1 + V 2 + V 3 + V 4 +   V 5 + error ,
ID = V 1 + V 2 + V 3 + V 4 +   V 5 + error ,
where V1 is the drop height (in m), considered a continuous numerical variable; V2 is the diameter of the steel ball (in mm), taken as a 3-level factor; V3 is the hardwood species, taken as a 4-level factor; V4 is the wood flooring type, taken as a 2-level factor; and V5 is the top layer thickness (mm), considered a continuous numerical variable.
The reference values of the models are listed in Table 4. For the footprint diameter, a gamma GLM with inverse link function was selected, which proved to be the most explanatory and which was significantly better than the other models tested. For the selection of the model for the ID variable, two models from the gamma family were shortlisted as the best candidates, one with a logarithmic link function and the other with an inverse link function. As may be observed in Table 4, the main reference values of these two models turned out to be appreciably similar, with a very slight advantage for the model with the logarithmic link function. Nonetheless, the better distribution of errors of the gamma model with inverse link function (Figure 5) finally led to its selection.
The results of the analysis of the selected models allow establishing that all the variables used were statistically significant. The individual explanatory capacity of each independent variable in terms of the explained deviance is presented in Table 5 and Table 6 for FD and ID, respectively.
Based on the values presented in Table 4 and on the values obtained from the likelihood-ratio test and Wald’s test for both models, presented in Table 5 and Table 6, the selected models may be regarded as strongly significant and highly explanatory. The equations of the final models are presented in Equations (3) and (4):
FD = 1.5 − 0.3 × V1 + 0.241 × V240 + 0.569 × V230 − 0.107 × V3E. grandis + 0.28 ×
V3H. courbaril + 0.02 × V3Q. robur − 0.227 × V4EWF − 0.059 × V5,
ID = − 5.015 + 0.538 × V1 − 0.231 × V240 + 0.465 × V230 + 0.237 × V3E. grandis
0.766 × V3H. courbaril − 0.226 × V3Q. robur + 1.992 × V4EWF + 0.38 × V5,

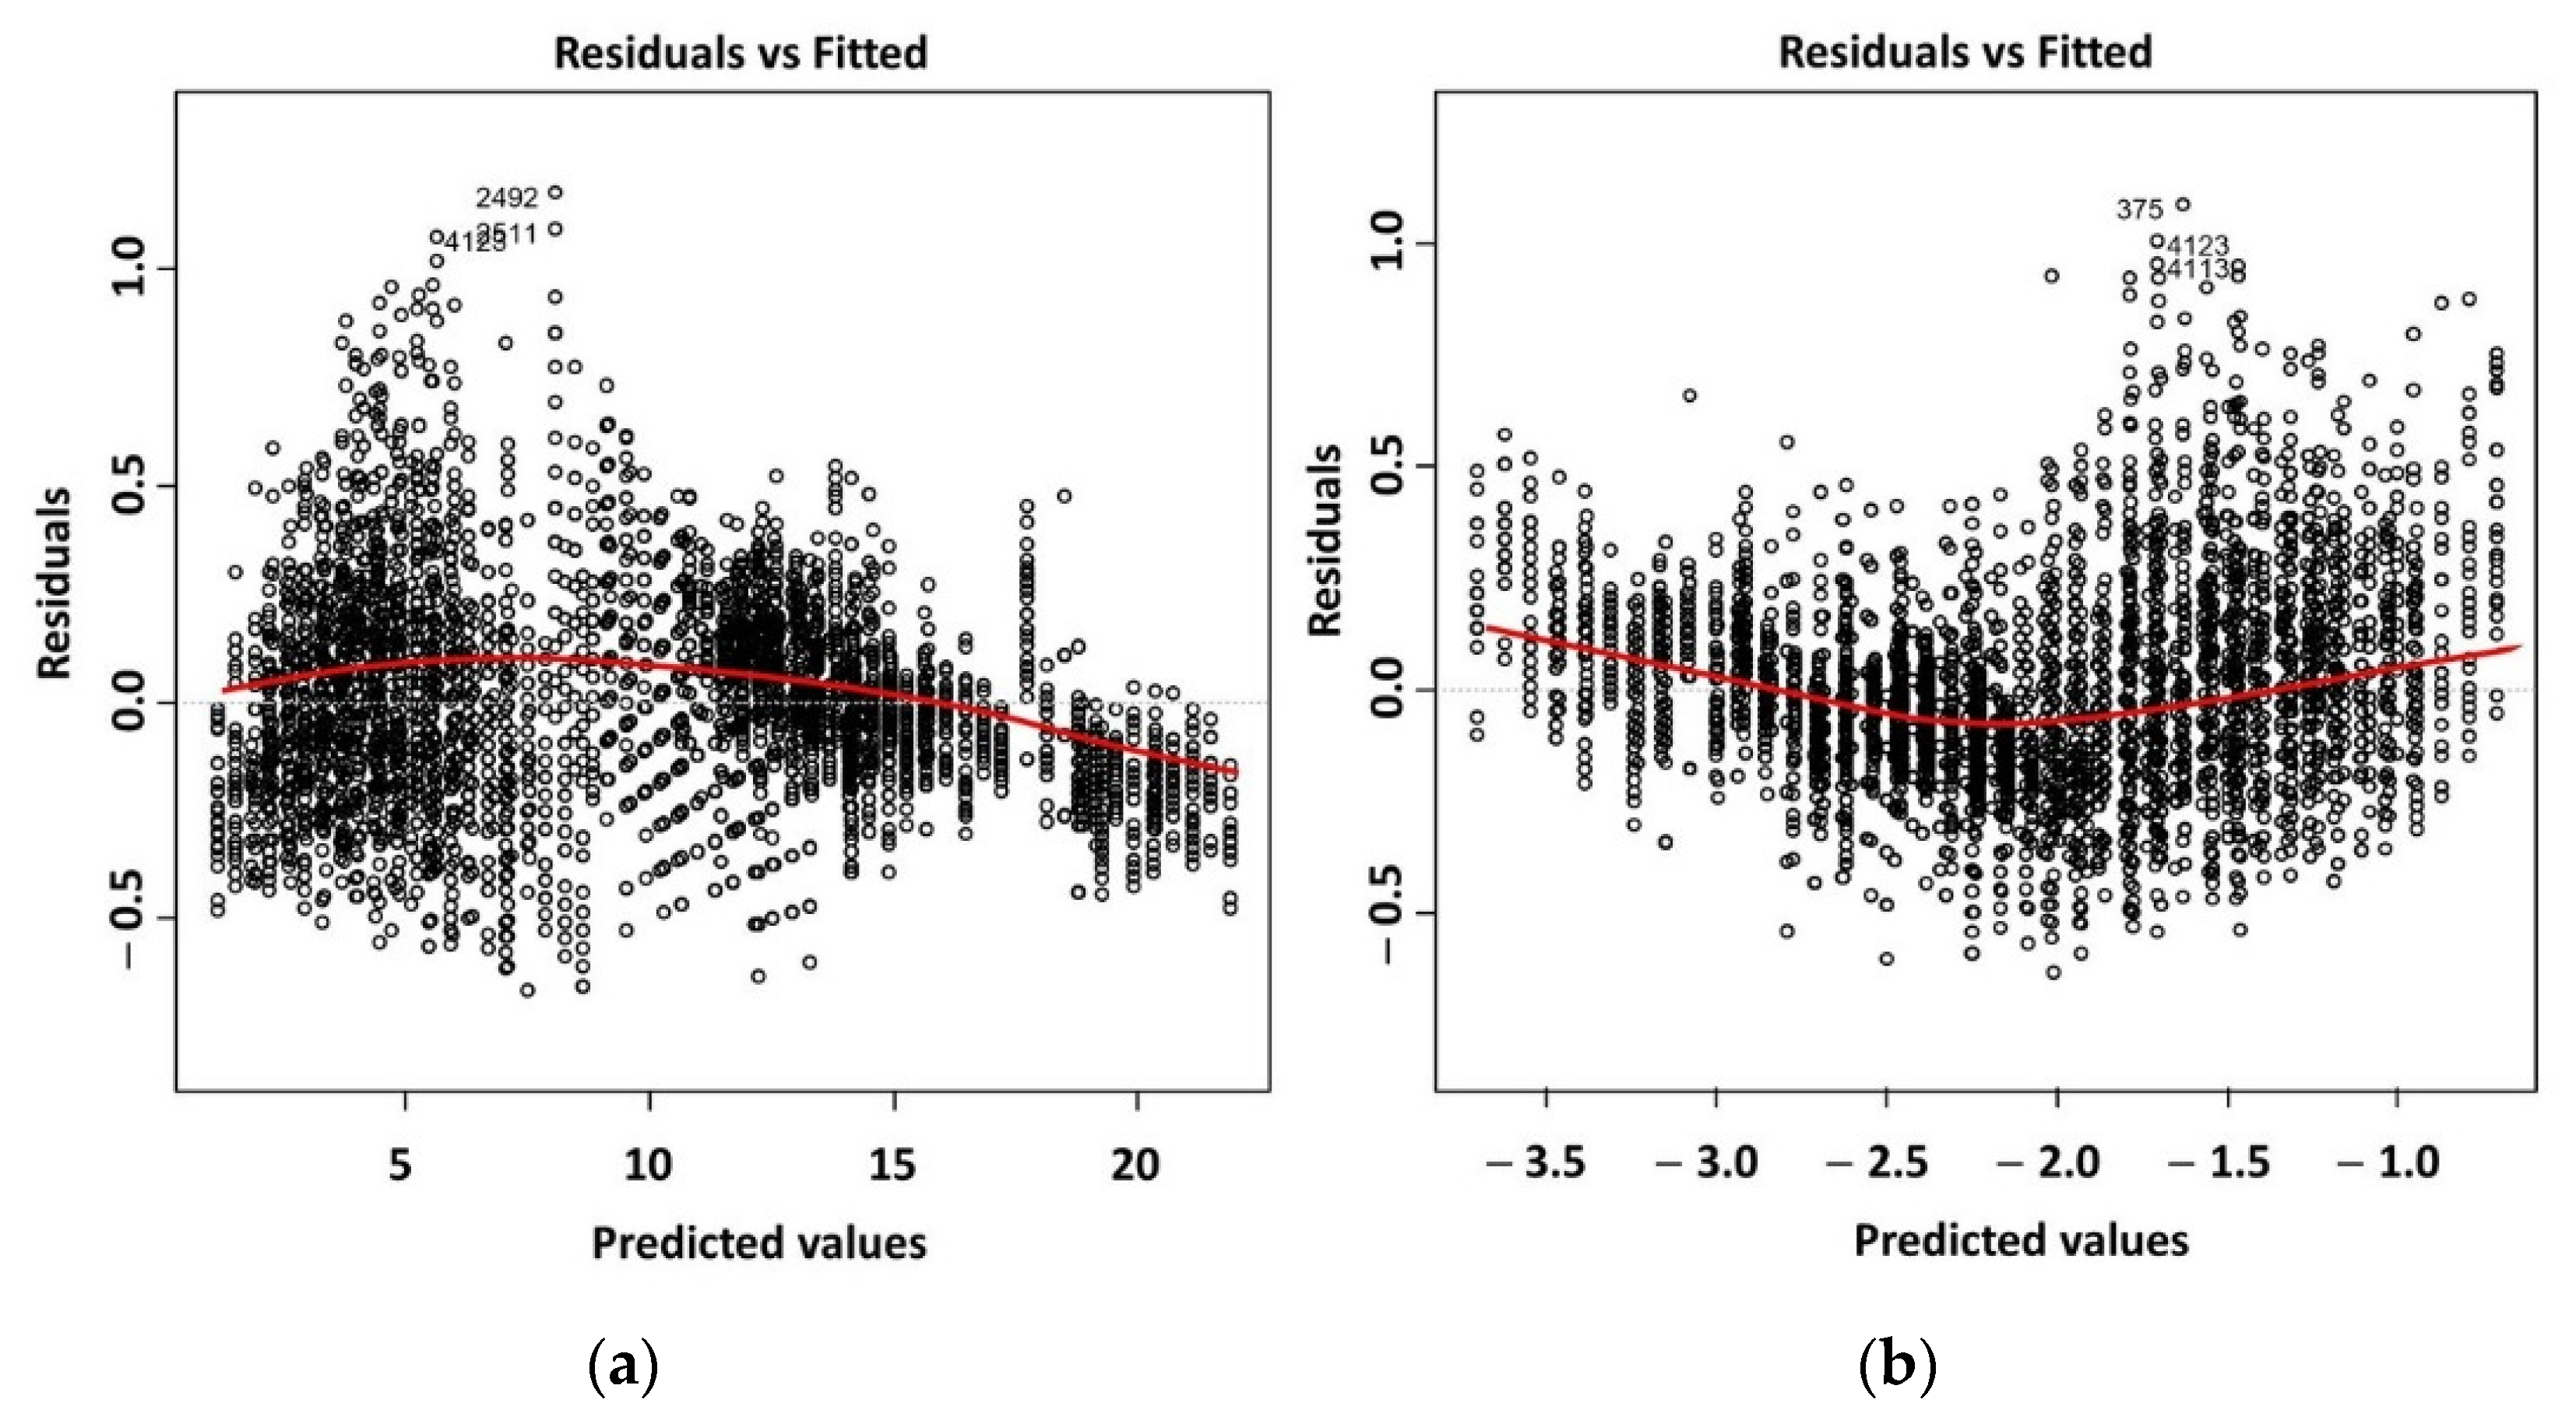
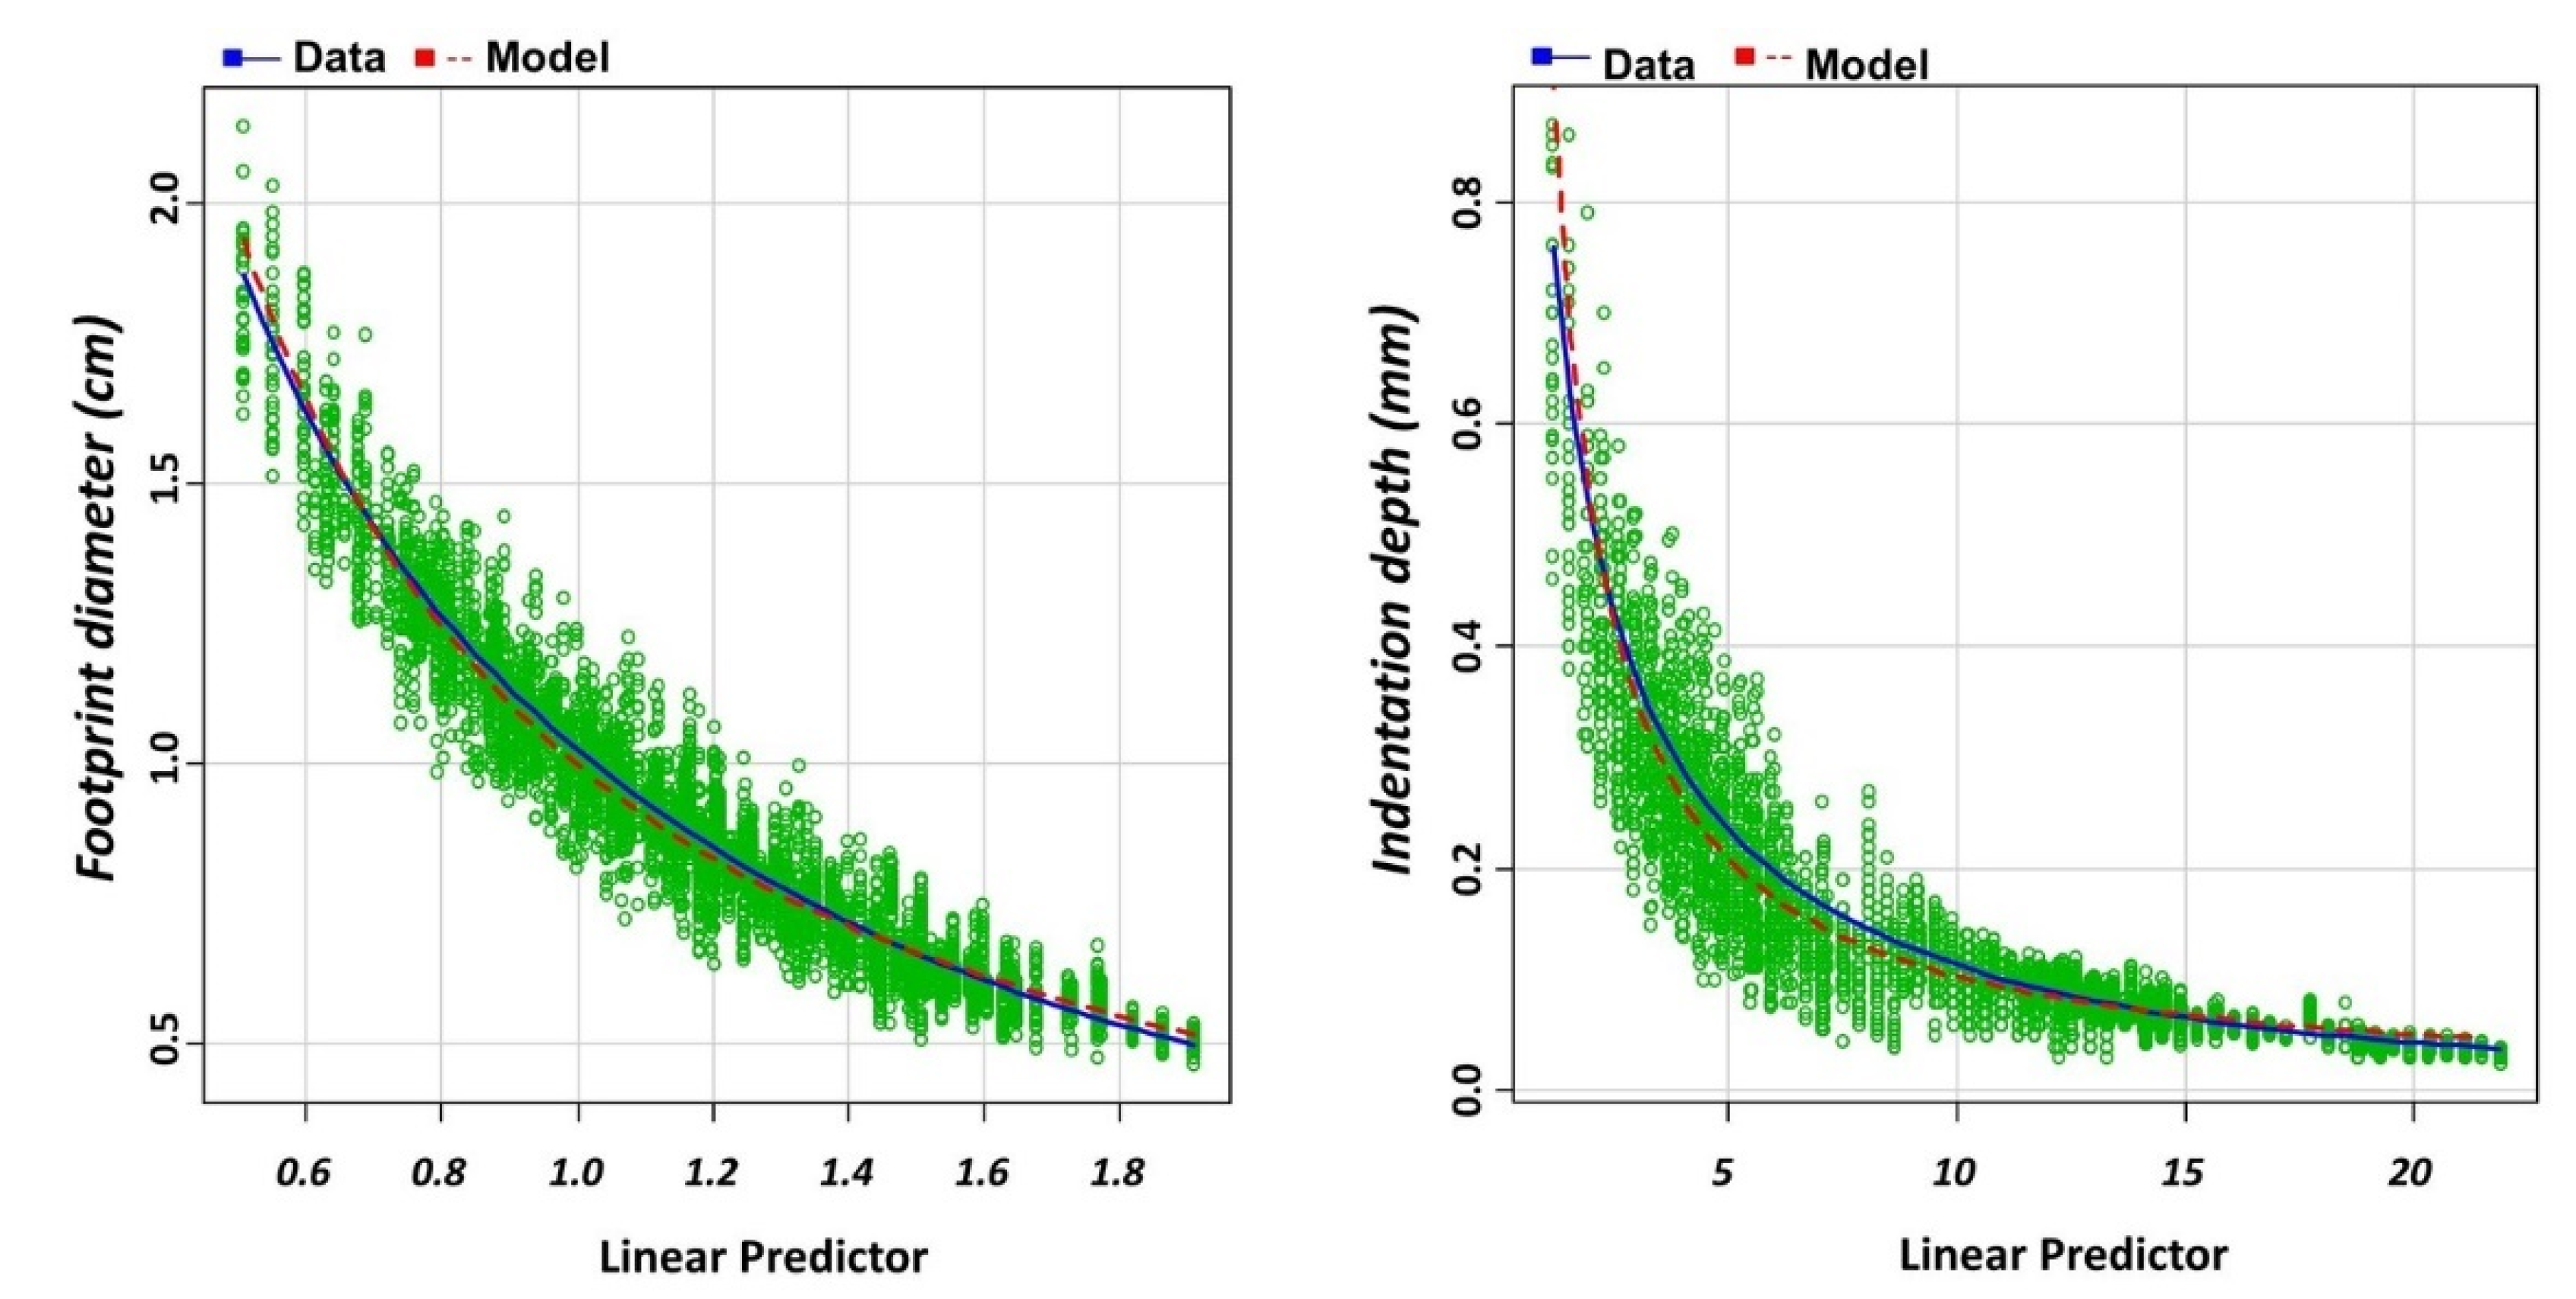
3.3. Model Diagnostics and Performance

Cook and Weisberg marginal model plots [42] were used to reproduce nonlinear marginal relationships for the predictors. In Figure 6, it may be observed that the models, represented by the dashed red lines, fitted quite well to the marginal relationships, represented by the solid blue lines.
The responses of the selected models for FD and ID have been plotted in Figure 7 and Figure 8. For clarity, the responses have been divided into different windows according to ball diameter and wood flooring type, representing in each of them the values of FD and ID for the different drop heights and keeping the same scale on the Y-axis to enable visual comparisons of the evolution of the response.
The differences observed in the FD among the four hardwood species in the SW group decreased with ball diameter. These differences were always statistically significant, except for Q. robur and E. globulus, which presented a similar response in all cases. In the case of EWF with a 3.0 mm top layer, the values of FD response by species for the same ball size were—in all cases—significantly lower than those found in SW and significantly higher than those found in EWF with a 0.6 mm top layer. Within each of the three wood flooring types, for the different ball sizes, the existing differences between species were smaller as the ball diameter decreased, although they were still statistically significant with the exception, as in the previous case, of Q. robur and E. globulus, which did not show differences between them. It may be observed that, for EWF with a 0.6 mm top layer, the values of the four species were not clearly differentiated, becoming significantly equal as the ball size decreased.
The general trend of the response of the ID (Figure 8) was analogous to that of the FD, although there were some notable differences. Firstly, the ID of Q. robur and E. globulus differed in all cases for SW and EWF 3.0 mm, whereas they were similar in terms of FD. Secondly, for EWF 6.0 mm, differentiation between the species was gradually lost and, finally (ball diameter = 30 mm), no difference was found between the ID values of the wood flooring types of the four species, i.e., the indentation depth for EWF 0.6 mm showed a considerably complacent behavior, in which practically no differences between species were observed or, when they did exist, they were extremely small.
This could also be observed when the relationship between the target variables (FD and ID) and the impact energy was represented (Figure 9).
As is shown in Figure 7 and Figure 8, due to the size of the footprint and wood anisotropy, the results showed that measuring the FD is an easier and more precise method than measuring the ID.
The construction morphology of the EWF has a structural performance analogous to that of a collaborating slab. In this structure, the HDF layer is responsible for absorbing much of the impact energy, being greater the thinner the hardwood layer is, and actively forcing the outer layer to recover from the deformation caused by the impact (Figure 10a). In the absence of this HDF layer, permanent deformation would occur, essentially perpendicular to the ground, with no significant recovery in the indentation depth. This can be verified by plotting the FD:ID ratio for each wood flooring type as a function of the drop height, regardless of steel ball diameter and hardwood species. In Figure 10b, it may be observed that the FD:ID ratio increases as there is a higher proportion of collaborative HDF in the wood flooring type architecture.

3.4. Final Remarks

Based on the test results obtained, two key outcomes should be highlighted:
(i)
E. globulus showed very similar behavior to that of Q. robur in the three wood flooring typologies in terms of the footprint diameter and the indentation depth. Hence, E. globulus, a fast-growing species, may hold promise to replace (or complement) Q. robur, a much slower-growing species, in the production of wooden floorings. As for the values of FD and ID in E. grandis, due to its lower density, significant differences versus the rest of the hardwood species were observed in SW and EWF 3.0 mm floorings, but, in the EWF with a 0.6 mm top layer, the ID variable did not show significant differences with the rest of the species. Similar conclusions were reached by other researchers [43,44], although from the comparison of different hardwood species with similar density ratios. This fast-growing species, currently destined for uses with little added value, may thus be valorized as an oak replacement in veneer floorings.
(ii)
Regarding the constructive typology of the floors, the replacement of part of the solid wood by a 9 mm HDF board significantly improved the behavior of the floor in terms of its performance in hardness tests, regardless of the hardwood species used. These results provide evidence that hardness is more closely related to density than to other wood properties [45], which explains why HDF board properties are more representative than those of the hardwood layer. An EWF flooring with a hardwood layer thickness of only 0.6 mm resulted in significantly lower FD and ID values than an EWF typology with a 3 mm hardwood layer thickness for three of the hardwood species (E. globulus, E. grandis, and Q. robur), while, in the case of the densest wood, from H. courbaril, the difference in FD was not as evident between the two EWF floorings. This implies that using a 9 mm HDF board and a 0.6 mm thickness of the solid wood top layer may save a significant amount of high-quality wood and lower the cost of the final product while offering better performance in terms of hardness than solid wood flooring.

4. Conclusions

The dynamic hardness test results demonstrated that veneer floorings (with a top layer thickness of only 0.6 mm) exhibited a performance comparable to (or better than) those of solid wood floorings and traditional engineered wood floorings (with a top layer thickness of 3 mm), with lower footprint diameter and indentation depth values. Concerning the influence of the hardwood used in the top layer, one of the two fast-growing hardwoods (E. globulus) showed a behavior similar to that of oak, suggesting that it may be a suitable replacement for the latter in the three types of wood floorings tested. The other fast-growing species (E. grandis), with a lower density, would only be a suitable alternative to oak for veneer floorings (0.6 mm top layer). These experimental results have been completed with two dynamic response models, one for predicting the footprint diameter and the other for the indentation depth of the footprint, which include the ball diameter, drop height, hardwood species, flooring type, and thickness of the top layer variables. These models can be used by wood flooring factories to choose the combination of wood flooring typology and thickness of the top layer, with the species analyzed in the study, to meet customers’ requirements in terms of impact hardness.

Supplementary Materials

The following are available online at https://www.mdpi.com/article/10.3390/f13020167/s1, Table S1: Descriptive statistics for the solid wood flooring; Table S2: Descriptive statistics for the engineered wood floorings.

Author Contributions

Conceptualization, L.A. and F.S.; methodology, L.A.; formal analysis, L.A., E.S. and M.C.; investigation, F.S., E.S., R.D.M., J.-A.B., G.K. and M.C.; resources, R.D.M., J.-A.B. and G.K.; writing—original draft preparation, F.S., L.A., R.D.M., E.S., J.-A.B. and P.M.-R.; writing—review and editing, L.A. and P.M.-R.; visualization, E.S. and M.C.; supervision, L.A. and P.M.-R.; funding acquisition, F.S. All authors have read and agreed to the published version of the manuscript.

Funding

This research received no external funding.

Institutional Review Board Statement

Not applicable.

Informed Consent Statement

Not applicable.

Data Availability Statement

The data presented in this study are available on request from the corresponding author. The data are not publicly available due to their relevance to an ongoing Ph.D. thesis.

Acknowledgments

The authors would like to thank INTASA S.A. for manufacturing the engineered wood flooring materials used in this investigation.

Conflicts of Interest

The authors declare no conflict of interest.

References

  1. Andrade, A.; Jankowsky, I.; Takeshita, S.; Neto Vieira, P. Análise de qualidade em pisos de madeira. Rev. Madeira 2010, 125, 12–18. [Google Scholar]
  2. Castro, G.; Zanuttini, R. Multilaminar wood: Manufacturing process and main physical-mechanical properties. For. Prod. J. 2004, 54, 61–67. [Google Scholar]
  3. Bergman, R.D.; Bowe, S.A. Life cycle inventory of manufacturing prefinished engineered wood flooring in Eastern, U.S. with comparison to solid strip wood flooring. Wood Fiber Sci. 2011, 43, 421–441. [Google Scholar]
  4. Li, N.; Tsushima, E.; Tsushima, H. Comparison of impact force attenuation by various combinations of hip protector and flooring material using a simplified fall-impact simulation device. J. Biomech. 2013, 46, 1140–1146. [Google Scholar] [CrossRef] [PubMed]
  5. Vinden, P. Changes in markets, technology and resources: Prospects for wood-based products. Aust. For. 2003, 66, 51–54. [Google Scholar] [CrossRef]
  6. Németh, R.; Molnarne Posh, P.; Molnár, S.; Bak, M. Performance evaluation of strip parquet flooring panels after long-term, in-service exposure. Drewno 2014, 57, 119–134. [Google Scholar]
  7. European Federation of the Parquet Industry. From European Nature to European Homes. Available online: https://www.parquet.net/p/index.html (accessed on 5 January 2022).
  8. Spetic, W.; Kozak, R.; Cohen, D. Perceptions of wood flooring by Canadian householders. For. Prod. J. 2006, 57, 34–38. [Google Scholar]
  9. Tanritanir, E.; Akbulut, T. Plywood industry and general situation of plywood trade. Laminart Furnit. Decor. J. 1999, 9, 122–132. [Google Scholar]
  10. Decospan. Decospan Wood Solutions. Available online: https://www.decospan.com (accessed on 5 January 2022).
  11. Grand View Research. In Wood and Laminate Flooring Market Size, Share & Trends Analysis Report by Product, by Application, by Region and Segment Forecasts, 2019–2025; Grand View Research: San Francisco, CA, USA, 2019; p. 99.
  12. Chen, Q.; Guo, X.; Ji, F.; Wang, J.; Wang, J.; Cao, P. Effects of decorative veneer and structure on the thermal conductivity of engineered wood flooring. BioResources 2015, 10, 2213–2222. [Google Scholar] [CrossRef] [Green Version]
  13. Glavonjić, B.; Lazarević, A.; Oblak, L.; Kalem, M.; Sretenović, P. Competitiveness of selected South-Eastern European countries in European Union wood flooring market. Drvna Ind. 2020, 71, 281–288. [Google Scholar] [CrossRef]
  14. Hetemäki, L.; Hurmekoski, E. Forest products markets under change: Review and research implications. Curr. For. Rep. 2016, 2, 177–188. [Google Scholar] [CrossRef]
  15. Nesheim, S.Ø. Competitive Timber Floors: Optimisation of Hollow Section Timber Floor Elements for Adaptable Buildings; Norwegian University of Science and Technology: Trondheim, Norway, 2021. [Google Scholar]
  16. Kalaycioglu, H.; Hiziroglu, S. Evaluation of surface characteristics of laminated flooring. Build. Environ. 2006, 41, 756–762. [Google Scholar] [CrossRef]
  17. Cassens, D.L.; Feist, W.C. Finishing and Maintaining Wood Floors; Cooperative Extension Service, Purdue University: West Lafayette, IN, USA, 1988; p. 8. [Google Scholar]
  18. Padilha, C.; Lima, J.T.; da Silva, J.R.M.; Trugilho, P.F.; Andrade, H.B. Evaluation of the Eucalyptus urophylla wood quality for flooring utilization. Sci. For. 2006, 71, 141–147. [Google Scholar]
  19. Mania, P.; Wróblewski, M.; Wójciak, A.; Roszyk, E.; Moliński, W. Hardness of densified wood in relation to changed chemical composition. Forests 2020, 11, 506. [Google Scholar] [CrossRef]
  20. Mathis, D.; Blanchet, P.; Landry, V.; Lagière, P. Impregnation of wood with microencapsulated bio-based phase change materials for high thermal mass engineered wood flooring. Appl. Sci. 2018, 8, 2696. [Google Scholar] [CrossRef] [Green Version]
  21. Sepliarsky, F.; Tapias-Martin, R.; Acuña-Rello, L. Eucalyptus globulus and Quercus robur engineered wood flooring. Impact resistance for several compositions. Maderas Cienc. Tecnol. 2018, 20, 103–116. [Google Scholar] [CrossRef]
  22. Hague, J. Utilisation of Plantation Eucalypts in Engineered Wood Products; Forest and Wood Products Australia: Melbourne, VIC, Australia, 2013; p. 20. [Google Scholar]
  23. Acuña, L.; Sepliarsky, F.; Spavento, E.; Martínez, R.D.; Balmori, J.-A. Modelling of impact falling ball test response on solid and engineered wood flooring of two Eucalyptus species. Forests 2020, 11, 933. [Google Scholar] [CrossRef]
  24. Crespo, J.; Majano-Majano, A.; Lara-Bocanegra, A.J.; Guaita, M. Mechanical properties of small clear specimens of Eucalyptus globulus Labill. Materials 2020, 13, 906. [Google Scholar] [CrossRef] [Green Version]
  25. Derikvand, M.; Kotlarewski, N.; Lee, M.; Jiao, H.; Nolan, G. Characterisation of physical and mechanical properties of unthinned and unpruned plantation-grown Eucalyptus nitens H.Deane & Maiden lumber. Forests 2019, 101, 194. [Google Scholar] [CrossRef] [Green Version]
  26. Jeon, J.Y.; Ryu, J.K.; Jeong, J.H.; Tachibana, H. Review of the impact ball in evaluating floor impact sound. Acta Acust. United Acust. 2006, 92, 777–786. [Google Scholar]
  27. Todaro, L. Effect of steaming treatment on resistance to footprints in Turkey oak wood for flooring. Eur. J. Wood Wood Prod. 2011, 70, 209–214. [Google Scholar] [CrossRef]
  28. Asociación Española de Normalización. UNE-EN 408:2010+A1:2012. Timber Structures—Structural Timber and Glued Laminated Timber—Determination of Some Physical and Mechanical Properties; Asociación Española de Normalización: Madrid, Spain, 2012. [Google Scholar]
  29. Asociación Española de Normalización. UNE EN 13183-1:2002. Moisture Content of a Piece of Sawn Timber—Part 1: Determination by Oven Dry Method; Asociación Española de Normalización: Madrid, Spain, 2007. [Google Scholar]
  30. Bona. Bona UV System. Available online: https://www.bona.com/ParquetProducers/IC-Products/Bona-UV-System/ (accessed on 5 January 2022).
  31. ASTM International. ASTM D1037-99. Standard Test Methods for Evaluating Properties of Wood-Base Fiber and Particle Panel Materials; ASTM International: West Conshohocke, PA, USA, 1999. [Google Scholar]
  32. ASTM International. ASTM D2394-83. Standard Methods for Simulated Service Testing of Wood and Wood-Base Finish Flooring; ASTM International: West Conshohocke, PA, USA, 1999. [Google Scholar]
  33. AITIM. Reglamento del Sello de Calidad AITIM Para Pavimentos de Madera, Parquet Industrial, Parquet Mosaico, Lamparquet y Tarima; Asociación de Investigación de las Industrias de la Madera (AITIM): Madrid, Spain, 2012; p. 11. [Google Scholar]
  34. International Organization for Standardization. ISO 3290-1:2014. Rolling Bearings—Balls—Part 1: Steel Balls; International Organization for Standardization: Geneva, Switzerland, 2014. [Google Scholar]
  35. Wilcox, R.R. Introduction to Robust Estimation and Hypothesis Testing, 5th ed.; Academic Press: London, UK, 2021. [Google Scholar]
  36. Welch, B.L. On the comparison of several mean values: An alternative approach. Biometrika 1951, 38, 330–336. [Google Scholar] [CrossRef]
  37. Krzanowski, W.J. An Introduction to Statistical Modelling; Wiley: London, UK; New York, NY, USA, 2010; p. 264. [Google Scholar]
  38. Akaike, H. Information theory and an extension of the maximum likelihood principle. In Selected Papers of Hirotugu Akaike; Parzen, E., Tanabe, K., Kitagawa, G., Eds.; Springer: New York, NY, USA, 1998; pp. 199–213. [Google Scholar] [CrossRef]
  39. Schwarz, G. Estimating the dimension of a model. Ann. Stat. 1978, 6, 461–464. [Google Scholar] [CrossRef]
  40. Chen, J.; Chen, Z. Extended Bayesian information criteria for model selection with large model spaces. Biometrika 2008, 95, 759–771. [Google Scholar] [CrossRef] [Green Version]
  41. Laitila, T. A pseudo-R2 measure for limited and qualitative dependent variable models. J. Econom. 1993, 56, 341–355. [Google Scholar] [CrossRef]
  42. Cook, R.D.; Weisberg, S. Graphics for assessing the adequacy of regression models. J. Am. Stat. Assoc. 1997, 92, 490–499. [Google Scholar] [CrossRef]
  43. Laine, K.; Rautkari, L.; Hughes, M. The effect of process parameters on the hardness of surface densified Scots pine solid wood. Eur. J. Wood Wood Prod. 2013, 71, 13–16. [Google Scholar] [CrossRef]
  44. Sydor, M.; Pinkowski, G.; Jasińska, A. The Brinell method for determining hardness of wood flooring materials. Forests 2020, 11, 878. [Google Scholar] [CrossRef]
  45. Kollmann, F. Untersuchungen über den Abnutzungswiderstand von Holz, Holzwerkstoffen und Fußbodenbelägen. Holz Roh Werkst. 1963, 21, 245–256. [Google Scholar] [CrossRef]
Figure 1. Impact test specimens: (a) solid wood flooring; (b) engineered wood flooring with a 3 mm top layer; and (c) engineered wood flooring with a 0.6 mm top layer.
Forests 13 00167 g001
Figure 2. Device for testing dynamic hardness: (1) drop height; (2) drop support; (3) ball diameters.
Forests 13 00167 g002
Figure 3. Footprint diameter for each of the three types of flooring × four hardwood combinations as a function of ball diameter and drop height.
Forests 13 00167 g003
Figure 4. Indentation depth for each of the three types of flooring × four hardwood combinations as a function of ball diameter and drop height.
Forests 13 00167 g004
Figure 5. Residuals vs. predicted values for the two indentation depth GLMs. (a) Link function = log. (b) Link function = inverse.
Forests 13 00167 g005
Figure 6. Footprint diameter and indentation depth marginal models.
Forests 13 00167 g006
Figure 7. Footprint diameter modeling as a function of drop height for each of the steel ball diameters, wood flooring type, and hardwood used in the top layer. Lowercase letters indicate the belonging of each response to a robust homogeneous group within groups of each of the nine groups presented (3 balls × 3 wood flooring types).
Forests 13 00167 g007
Figure 8. Indentation depth modeling as a function of drop height for each of the steel ball diameters, wood flooring type, and hardwood used in the top layer. Lowercase letters indicate the belonging of each response to a robust homogeneous group within groups of each of the nine groups presented (3 balls × 3 wood flooring types).
Forests 13 00167 g008
Figure 9. Footprint diameter and indentation depth as a function of impact energy. The alphanumeric nomenclature for ball diameter × drop height combinations is explained in Table 2.
Forests 13 00167 g009
Figure 10. Footprint on EWF with (a) a 3.0 mm and (b) a 0.6 mm top layer; (c) FD:ID ratio vs. drop height.
Forests 13 00167 g010
Table 1. Wood flooring types tested in the study, with basic information on sample sizes and properties for each of the hardwood species investigated.
Flooring Type Quercus robur L.Hymenaea courbaril L.Eucalyptus globulus Labill.Eucalyptus grandis W. Hill ex Maiden
Solid wood flooringNumber of pieces and impacts30/15030/45030/15030/450
Nominal size *300 × 70 × 25300 × 70 × 25300 × 75 × 16300 × 75 × 16
Mean density ** (CV ***)686.1 (9.1)954.6 (10.4)832.0 (11.3)488.3 (9.8)
Engineered wood flooring
3 mm noble wood layer
Number of pieces and impacts50/45050/45050/45050/450
Nominal size *1000 × 200 × 141000 × 200 × 141000 × 200 × 141000 × 200 × 14
Mean density ** (CV ***)765.1 (0.08)821.4(0.06)796.4(0.11)722.4(0.13)
Engineered wood flooring
0.6 mm noble wood layer
Number of pieces and impacts50/45050/45050/45050/450
Nominal size *1000 × 145 × 101000 × 145 × 101000 × 145 × 101000 × 145 × 10
Mean density ** (CV ***)822.9 (0.02)838.6 (0.04)821.7 (0.06)807.2 (0.07)
* Length, width, and thickness values are expressed in mm; ** Mean density is expressed in kg m−3; *** Coefficient of variation is expressed in %.
Table 2. Impact energies as a function of the steel ball diameter and drop height.
Nominal Diameter (mm)Weight (g)Impact Energy (J) *
h = 0.60 mh = 0.75 mh = 0.90 mh = 1.05 mh = 1.20 m
50508.82.99 (A5)3.74 (B5)4.49 (C5)5.24 (D5)5.99 (E5)
40260.51.53 (A4)1.92 (B4)2.30 (C4)2.68 (D4)3.07 (E4)
30109.90.65 (A3)0.81 (B3)0.97 (C3)1.13 (D3)1.29 (E3)
* The alphanumeric nomenclature used in the graphs below is indicated in parentheses.
Table 3. Steel ball properties according to the manufacturer.
Maximum Nominal Diameter Deviation (μm)Hardness
(HRC)
Elastic Modulus (MPa)Compressive Breaking Stress (MPa)
±11.462–65200,0002500–2600
Table 4. Main performance values of the generalized linear models.
ModelsLink FunctionResidual DevianceAICBICEfron’s Pseudo R2
Footprint diameterInverse28.569−12,598−12,5330.926
Indentation depthLog275.76−21,187−21,121.780.837
Inverse289.96−20,937−20,872.450.832
AIC = Akaike information criterion; BIC = Bayesian information criterion.
Table 5. Main performance values of the footprint diameter GLM model.
DfDevianceAICLR ChiSqWithheld
Deviance
Explained
Deviance
Pr (Chi)
Model null 28.569−12,598.2 370.790.928
Drop height146.808−9485.0311518.240.046<2.2 × 10⁻¹⁶
Ball diameter2240.08523,524.836,127211.520.530<2.2 × 10⁻¹⁶
Hardwood species3117.1552526.315,13088.590.222<2.2 × 10⁻¹⁶
Wood flooring type139.967−10,653.415774.010.010<2.2 × 10⁻¹⁶
Noble layer thickness143.334−10,078.2252214.770.037<2.2 × 10⁻¹⁶
Table 6. Main performance values of the indentation depth GLM model.
DfDevianceAICLR ChiSqWithheld
Deviance
Explained
Deviance
Pr(Chi)
Model null 275.76−21,186.8 2278.530.892
Drop height1340.91−20,024.61164.2312.34 0.122<2.2 × 10⁻¹⁶
Ball diameter2450.39−18,070.33120.5421.820.165<2.2 × 10⁻¹⁶
Hardwood species3964.60−8883.6123,09.1936.030.366<2.2 × 10⁻¹⁶
Wood flooring type1647.47−14,546.66642.2618.900.242<2.2 × 10⁻¹⁶
Noble layer thickness11025.41−7793.113,395.7996.840.390<2.2 × 10⁻¹⁶
Publisher’s Note: MDPI stays neutral with regard to jurisdictional claims in published maps and institutional affiliations.

