Article

The Impact of Forest Fertilization on the Ecological Quality of Two Hemiboreal Streams

1
Laboratory of Hydrobiology, Institute of Biology, University of Latvia, Jelgavas Str. 1, LV-1004 Riga, Latvia
2
Latvian State Forest Research Institute ‘Silava’ (LSFRI Silava), Rigas Str. 111, LV-2169 Salaspils, Latvia
3
Latvian Environment, Geology and Meteorology Center, Division of Inland Waters, Maskavas Str. 165, LV-1019 Riga, Latvia
4
Freshwater Solutions, Kalna Pluci, Cesu District, LV-4136 Vaives Parish, Latvia
*
Author to whom correspondence should be addressed.
Forests 2022, 13(2), 196; https://doi.org/10.3390/f13020196
Submission received: 13 December 2021 / Revised: 24 January 2022 / Accepted: 25 January 2022 / Published: 27 January 2022
(This article belongs to the Section Forest Ecology and Management)

Abstract

:
The present study aimed to detect any changes in concentrations of nutrients and evaluate the impact on the quality of two hemiboreal streams that collect a discharge from two fertilized Scots pine stands. In 2017, nitrogen-containing mineral fertilizer was spread in pine stands on mineral soil located near the first stream. In 2018, potassium containing wood ash was spread in pine stands on organic soil near the second stream. From 2017 to 2020, surveys of physico-chemical parameters, diatoms, macrophytes, and macroinvertebrates were performed to determine the possible effects of fertilization on the ecological quality of the streams. A control site upstream of the fertilized forest stand and a treatment site downstream of the fertilized forest stand was monitored at each stream. Water quality indices, chemical parameters of surface water, and indicator species analysis showed no short-term impact of forest soil improvement with wood ash and ammonium nitrate. We found no clear patterns before and after the fertilization events in both streams, although we did observe inter- and intra-annual differences in aquatic biota and stream ecological quality mainly caused by local environmental factors.

1. Introduction

Forest management practices include drainage, sanitary cuts, pre-commercial thinning, and proper regeneration, including implementing forest soil preparation methods and selecting planting material. In addition, forest soil fertilization—depending on the fertilizer type and site conditions—is recognized as an effective measure to enhance tree growth [1,2]. Forest soil fertilization has been practiced in Sweden since the 1950s, with 190,000 ha per year fertilized with nitrogen-containing fertilizer in the mid-1970s to improve the growth conditions of forests. However, this practice declined significantly in the 1990s due to an increased ecological focus in Swedish forestry [3]. Due to soil acidification, it is vital to focus research on forest soil treatment with wood ash [4] and determine its subsequent effects on the chemistry of soil and water [5,6,7,8]. In the 1960s, fertilization experiments of Norway spruce were conducted in Denmark, but since 1980, experiments mainly focused on counteracting decline of forest. However, forest soil fertilization is no longer practiced in Denmark [9]. On the contrary, it is estimated that annual fertilization of 5000–10,000 ha forest in Norway would contribute to the CO2 sequestration in 10 years of 0.14–0.27 million tonnes/year [10].
Local studies have reported the positive impact of wood ash on the radial increment of hybrid aspen plantation [11] in the first 1–2 years and additional radial increment in middle-aged Norway spruce stands [12] 5 years after soil improvement with fertilizers. Recent studies have also shown the impact of fertilization on soil organic carbon stock and chemical properties of the soil, groundwater, and stem wood [13,14,15].
Nevertheless, the main purpose of fertilization is forest growth improvement and, as a result, CO2 sequestration. Ojanen et al. [16] reported that fertilization of low-productivity peatland forest increased CO2 sink capacity. Regarding the effect of forest soil fertilization on C stock, several indirect effects must be also considered apart from the nutrient input into forest ecosystem. Moreover, increasing O3 concentration in above-ground layer may possibly have an adverse effect on C sequestration [17,18].
Several studies have focused on the impact of applying wood ash [6,8,19,20], nitrogen-containing mineral fertilizer [7], phosphorus [21], and NPK fertilizer [1]. Studies investigating the effect of forest soil fertilization on water quality mainly focused on evaluating changes in the chemical properties of soil leachate, groundwater, and surface water [6,20,22]. However, studies exploring the effects of fertilizers—particularly on ecological water quality—were mostly conducted on agricultural lands and in urban areas [23]. Although forest territories have a comparatively lower impact on the surface water quality than agricultural lands, it is still crucial to estimate the effect of nutrient loading from forests. Such studies are of great importance because they provide an assessment of direct nutrient loads and reveal indirect effects, e.g., increased primary production [24] and oxygen consumption due to microbial oxidation of ammonia [25].
Studies that evaluated the environmental aspects of forest soil fertilization mainly focused on the chemistry of soil and water. However, much less is known about the response of biological communities—more specifically, their effects on the ecology of hemiboreal streams—as few similar experiments have been reported from subtropical [26] and boreal zones [5,19]. Diatoms (benthic algae) are claimed to be sensitive to changes in environmental factors (e.g., light, temperature, stream velocity, pH, oxygen, dissolved organic matter, and inorganic nutrients) and, therefore, may be used as bio-indicators of a state of, or a change in, freshwater ecology [27,28]. The primary production of diatoms is determined by light, temperature, and nutrients; however, the development of biomass is affected by stream velocity and grazing [29]. The composition and indicator species of macrophytes are used for bio-indication purposes throughout Europe [30,31,32]. Macrophytes are essential components of aquatic ecosystems. Changes in the community composition or the abundance of individual species provide valuable information on how and why an ecosystem might be changing [33]. Macrophytes are known to reflect physico-chemical and hydromorphological pressures [34]. Plant communities can incorporate the effects of successive anthropogenic disturbances over long periods, often years, which can be advantageous when assessing the ecological status of rivers [35]. Nevertheless, macroinvertebrates have been widely used as indicators of freshwater ecological quality for many decades [36]. Many benthic fauna-based indices addressing different stressors, e.g., eutrophication and hydromorphological pressures, are used to assess the ecological quality of freshwater ecosystems [37,38].
This study aimed to compare the impact of forest soil improvement with wood ash and ammonium nitrate on ecological quality between two hemiboreal streams using water chemistry, diatoms, macrophytes, and macroinvertebrates as indicators. We predicted no short-term negative impacts from the forest fertilization on the stream water chemistry and aquatic biota.

2. Materials and Methods

2.1. Study Sites

The first experimental site was located next to the Age (No.1. in Table 1), Limbazi Parish, in the northern part of Latvia. The experiment was carried out in a 93-year-old stand of Scots pine (Pinus sylvestris L.) on drained organic soil (Figure 1 and Table 1).
According to the Latvian forest site type classification system, the forest type of the stand is Myrtillosa turf. mel.—mesoeutrophic site [39]. The second experimental site was situated next to the Rusinupe (No.2. in Table 1), Vecumnieki Parish, in the central part of Latvia. The experiment was conducted in a 61-year-old stand of Scots pine on drained mineral soil. The forest type of the stand is Myrtillosa—mesotrophic site. The annual mean air temperature during 1961-2010 in the areas of Age and Rusinupe was 6.2 and 5.9 °C, respectively. The annual mean precipitation during 1961–2010 in these same areas was 667 and 704 mm y−1, respectively [40].
The dominant soil type in the forest stand No. 1 is Histosol, and Podzol is dominant in the forest stand No. 2 [41]. The main characteristics of the soil are summarized in Table 2.

2.2. Experimental Design and Treatments

Samples were collected upstream and downstream of the experiment site to obtain data on control and impact [42]. The Age is a medium-sized rhithral stream with silt, pebbles, and rocks on the riverbed. The monitoring was conducted before and after the inflow of the tributary, which collects a discharge and a runoff of the forest stands fertilized with WA, into the Age. Rusinupe is a small potamal stream with sand and coarse particulate organic matter on the riverbed. The monitoring points were established upstream and downstream of the forest stand, where NH4NO3 was spread. In Age, a beaver dam next to the inflow of the tributary was observed throughout 2018. In Rusinupe, a beaver dam was detected upstream in the autumn of 2018. From 2017 to 2020, macrophytes, macroinvertebrates, and phytobenthos were monitored once, twice, and three times, respectively, per year.

2.3. Surface Water Sample Collection and Analysis

Surface water samples were collected twice a month from 2017 to 2019. At the first study site, samples were collected from the Age tributary before the inflow into the Age. At the second study site (the Rusinupe), samples were collected upstream and downstream of the fertilized forest stand. Chemical analyses of the surface water samples were carried out in an accredited laboratory of the Latvian Environment, Geology and Meteorology Centre.

2.4. Sampling and Analysis of Biological Quality Elements

Because the streams contained different types of riverbed substrates, phytobenthos (Figure S1) were collected from branchwood and pebbles. Slides were prepared according to the European standard NF EN 13946 for the microscopic study of diatoms. Up to 400 frustules per sample were counted and identified at the species level. The Trophic Diatom Index (TDI20 and TDI100), Watanabe’s Index (WAT), and Specific Polluosensitivity Index (IPS) were calculated using OMNIDIA [43] and used to assess ecological quality [44].
Macrophyte (Figure S2) assemblages in a 100 m stretch were described once a year during the vegetation season. The diversity and abundance of the detected species were determined using a nine-point grading scale. Macrophytes were recorded and identified at the species level or the lowest practical taxonomic level.
The Macrophyte Index for Rivers (MIR) was calculated as described by Szoszkiewicz et al. [45] to estimate the ecological quality of streams. To assign the MIR values to the ecological quality classes as required by the European Union (EU) Water Framework Directive, the calculated MIR was standardized using the ecological quality ratio (EQR) [46].
Samples of macrozoobenthos (Figure S3) were collected twice a year in spring and autumn. Five replicate samples were collected at each site, in proportion to microhabitat occurrence. The macroinvertebrates were primarily identified at the species or genus level. Oligochaetes were not identified further, whereas Dipetra were identified to the family level. Macroinvertebrate indices were calculated using Asterics v. 4.04 [47]. A total of 102 numerically and ecologically suitable metrics were selected for further analysis.
In the Age, ecological quality based on macroinvertebrates was assessed using the Latvian Macroinvertebrate Index (LMI) [48]. In Rusinupe, we applied a method used in Estonia [44] as there is currently no appropriate ecological quality assessment method based on macroinvertebrates for small streams in Latvia.

2.5. Statistical Methods

Principal component analysis (PCA)—an ordination analysis—was performed using PC-ORD 5.0 software [49] to determine the relationship between the selected metrics and samples at each stream. Benthic invertebrate taxa and metric data were log-transformed before conducting the PCA. The abundance of benthic invertebrate taxa in Age and Rusinupe was measured via indicator species analysis (ISA) using the PC-ORD 5.0 software [49]. A common aspect of ecological research is identifying species associated with, or indicative of, groups of samples, including studies of environmental management. In-depth analyses are often required to identify species indicative of specific groups. ISA allows statistically rigorous assessments of these indicator species [50]. Taxonomic data were grouped according to three categorical variables, namely site position to the treatment (upstream or downstream), season (spring, autumn), and year (2017 to 2020). We performed the Monte Carlo test of significance of the observed maximum indicator value for species, with 4999 permutations. Indicator values were calculated according to the method described by Dufrene and Legendre [51]. The non-parametric Wilcoxon rank sum test with continuity correction was used to compare the chemical parameters of water samples collected at the control and treatment sites. The test was conducted at a 95% confidence level using the R program [52].

3. Results

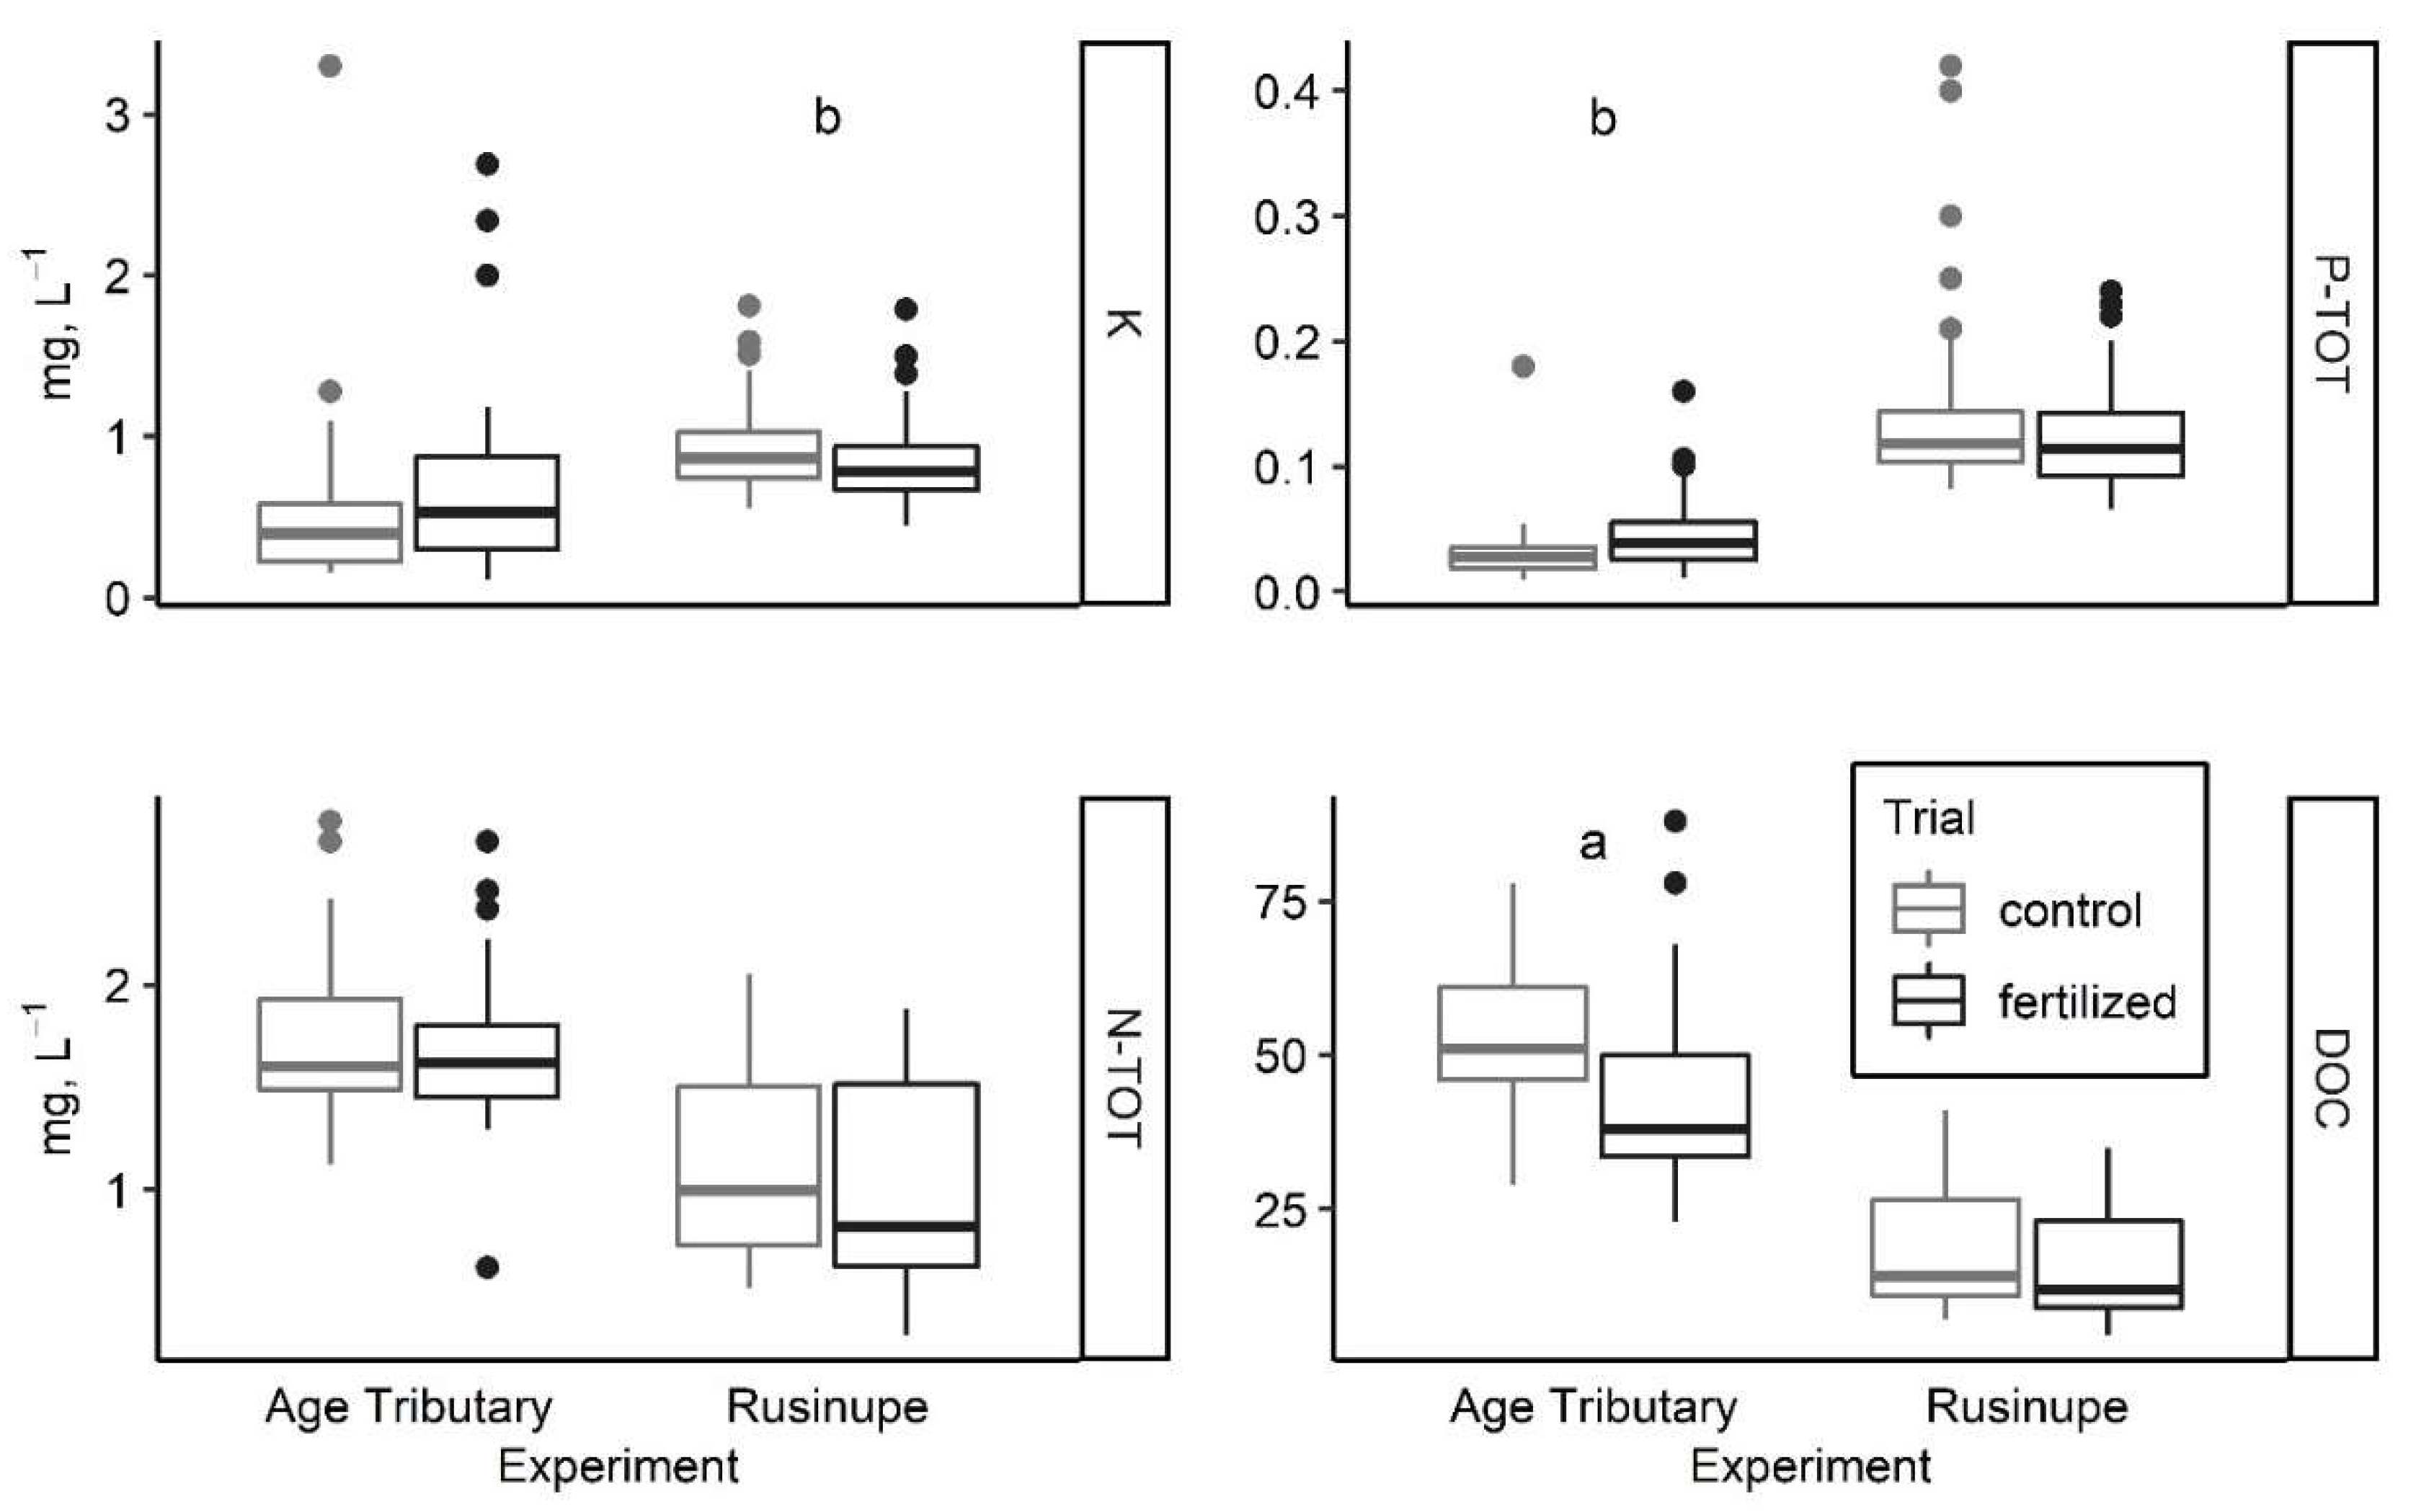
3.1. Chemistry of Surface Water

Following the treatment with wood ash, the average pH of water samples from the Age tributary changed from 6.88 ± 0.10 to 6.91 ± 0.06 (p < 0.01). The average K concentration was slightly higher two years after the treatment with wood ash than during the one-year period before fertilization—(from 0.56 ± 0.13 to 0.69 ± 0.08) (Figure 2).
We detected a statistically significant increase in PTOT concentration (from 0.03 ± 0.01 to 0.04 ± 0.00, p < 0.05) and a significant decrease of dissolved organic carbon (DOC) concentration (from 52.96 ± 2.46 to 41.62 ± 2.19, p < 0.01) after the application of wood ash in the Age catchment area. The average pH of water samples from the Age tributary ranged from 7.29 ± 0.05 (upstream) to 7.29 ± 0.06 (downstream). The average NTOT concentration did not indicate any nutrient loading of the applied NH4NO3 from the fertilized forest stand in the Rusinupe catchment area. The concentration of NTOT was slightly lower downstream of the fertilized forest stand (1.12 ± 0.06 control and 1.00 ± 0.06 fertilized). However, a significantly lower (p < 0.05) concentration of K (0.92 ± 0.03 control and 0.83 ± 0.03 fertilized) was detected in surface water downstream of the treatment site in Rusinupe.

3.2. Macrophytes

A total of 44 macrophyte taxa were found in the stretches of Age and Rusinupe. Of these, 39 taxa were identified to the species level and five taxa to the genus level. The number of species varied from nine macrophyte taxa at the control site in Rusinupe to 18 taxa at the experimental site in Age. Vegetation cover varied from 10% to 40% at the Age control site and from 20% to 50% at the Age treatment site. In the Rusinupe, vegetation cover varied from 10% to 15% upstream and from 70% to 80% downstream of the fertilization site. The species most frequently found at both Age sites were Nuphar lutea, Sparganium emersum, and Fontinalis antipyretica. In the Rusinupe, Sparganium emersum, Lemna minor, Cicuta virosa, and Elodea canadensis were the dominant species at the control site. By contrast, Lemna minor, Spirodela polyrhiza, Phragmites australis, Nuphar lutea, and Elodea canadensis were the most frequent species at the treatment site. The EQR_MIR values ranged from 0.43 to 0.81. Lower values of the EQR_MIR were recorded at the Age control site. The highest values of the EQR_MIR index were recorded at the Age experimental site in 2018 and in the Rusinupe control site in 2020.

3.3. Phytobenthos

We detected 124 and 147 diatom taxa in the Age and the Rusinupe, respectively. The most frequently occurring taxa in the Age were Amphora pediculus, Cocconeis placentula, Gomphonema parvulum, Meridion circulare, Planothidium lanceolatum, Platessa conspicua, Rhoicosphenia abbreviate, and Stauroneis anceps. In the Rusinupe, the most frequently occurring taxa were Amphora pediculus, Cocconeis placentula, Navicula cryptocephala, and Meridion circulare. Ecological quality varied from medium to high in both streams and stretches, and the TDI, WAT, and IPS values varied seasonally. At the Age control site, TDI varied from medium to high quality, WAT from medium to high quality, and IPS from good to high quality. At the Age treatment site, TDI fluctuated from medium to good quality, WAT from good to high quality, and IPS good to high quality.
In the Rusinupe, TDI was in the range of medium to high quality both at the control and treatment stretches. The WAT index showed good to high quality at the control site and moderate to high quality at the treatment site. The IPS values indicated good to high quality both at the control and treatment stretches.

3.4. Macroinvertebrates

We found a total of 169 macroinvertebrate taxa, of which 133 were in Age and 104 in Rusinupe. Caddisflies (Trichoptera) was the order with the highest species richness, with 30 taxa in the Age and 22 taxa in the Rusinupe. The macroinvertebrate abundance varied annually and seasonally, from 173 to 1685 specimens per sample in the Age and from 414 to 4043 in the Rusinupe. We observed higher macroinvertebrate abundance in spring in the Age and autumn in the Rusinupe.
In the Age, the LMI indicated moderate (in 2017 and 2018) to good (in 2019 and 2020) ecological quality in spring, but moderate ecological quality (in all years) in autumn. In the Rusinupe, the ecological quality also fluctuated from medium to good, reaching the highest values in spring of 2018 at both sites, in addition to in spring and autumn of 2020, at the experimental sites. Macroinvertebrate communities in the Age were more heterogeneous compared to those in the Rusinupe. Bivalvia, Diptera, and Crustacea were the dominant taxa and comprised 50% to 90% of the total number of benthic organisms found in the Rusinupe. In the Age, these three taxa constituted only approximately 30% to 60% of the total number of organisms; moreover, crustaceans were not among the dominating taxa. In the Age, a slightly stronger dominance of Diptera and Trichoptera was observed at the upstream site than at the downstream site. The number of Bivalvia increased upstream of the Rusinupe treatment site but decreased downstream of the site.

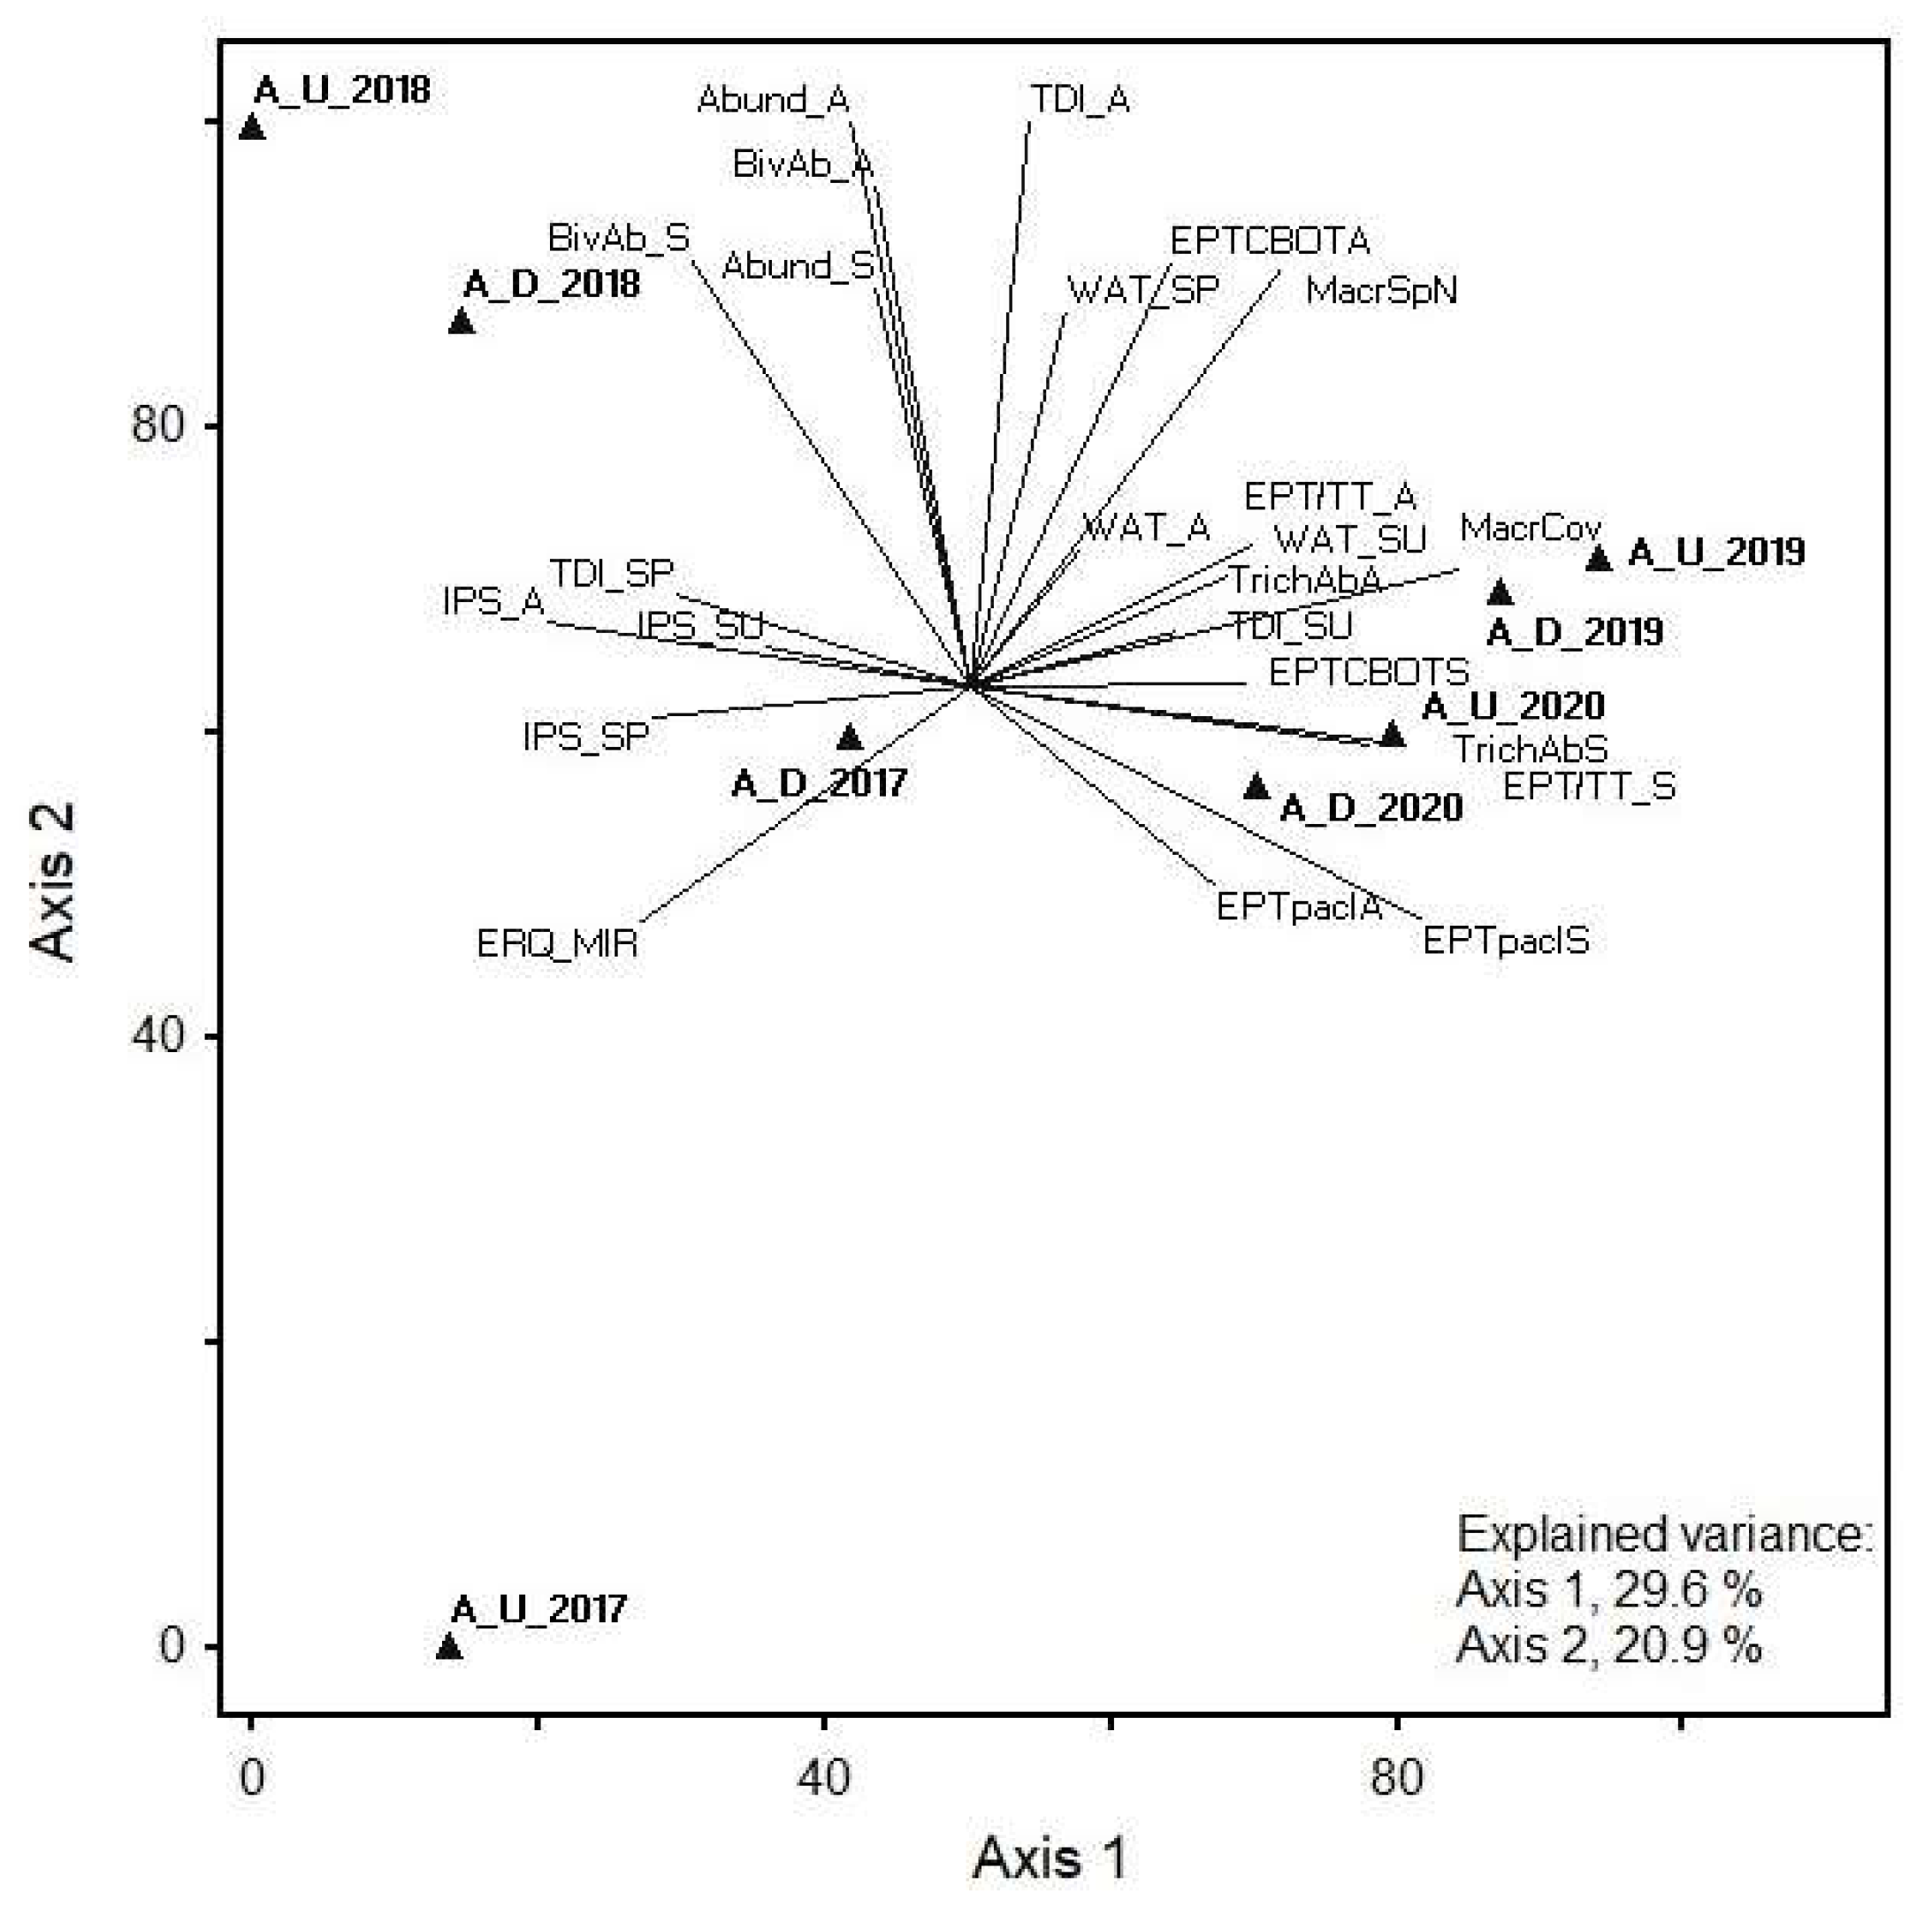
3.5. Indicator Species Analysis of the Age

Altogether, 10 indicator species showed significant interannual variability (p < 0.05). Most of these met the criteria for indicator species in 2018 (one species each from the Bivalvia, Diptera, Coleoptera, and Lepidoptera taxonomic groups and two Gastropoda species). Of the remaining, one was designated in 2017 (Ephemeroptera), one in 2019 (Odonata), and two in 2020 (Hydrachnidia and Ephemeroptera). Two bivalve species were significant indicator species for the experimental site, and three were for the control site (one Diptera and two free-living caddisfly species). However, seasonal variability showed the largest number of indicator species in spring (eight in total): four Trichoptera species and one each from the Simuliidae, Coleoptera, Plecoptera, and Hydrachnidia taxonomic groups. Four indicator species were designated in autumn: two Trichoptera species and one species each from Ephemeroptera and Plecoptera (Table 3).
PCA of benthic invertebrate metrics (7 of 102 metrics were selected having 70% of the fitted range) showed an impact of season on calculated metric value distribution along the PCA axes (axes 1 and 2 explained 57.3% and 31.9% of the total data variance, respectively). From axis 1, the most significant correlation was found for EPT (%) abundance classes in spring and abundance of Trichoptera larvae in spring; however, from axis 2, total abundance was found in autumn.
The first two axes of the phytobenthos, macrophyte, and selected benthic invertebrate metric PCA explained 50.5% of the total data variance (29.6% and 20.9% for axes 1 and 2, respectively) in the Age. Significant correlations with PCA ordination axes were found for all biological quality element (BQE) group metrics. Positive correlations with axis 1 were found for several diatom metrics and the EQR of macrophyte MIR index, whereas negative correlations were found for several macrozoobenthos metrics. The highest positive correlation coefficients with axis 1 were found for IPS in autumn, whereas TDI in autumn and total abundance of benthic invertebrates (in autumn) had the highest positive correlation with axis 2.
The highest positive correlation coefficient was found for IPS in autumn and high negative correlation coefficients with axis 1 were found for total coverage of macrophytes, abundance classes (%) of Ephemeroptera, Plecoptera, and Trichoptera (in spring), and abundance of Trichoptera (in spring). Furthermore, TDI in autumn and total abundance of benthic invertebrates (in autumn) had the highest positive correlation with axis 2.
The highest positive correlation coefficients with axis 1 were found for total coverage of macrophytes, abundance classes (%) of Ephemeroptera, Plecoptera, and Trichoptera (in spring), and abundance of Trichoptera (in spring); however, correlation coefficients were negative for IPS in autumn. Furthermore, TDI in autumn and total abundance of benthic invertebrates (in autumn) had the highest positive correlation with axis 2. The abundance of Bivalvia, number of Ephemeroptera, Plecoptera, Trichoptera, Coleoptera, Bivalvia, and Odonata (EPTCBO) taxa, and number of macrophyte species also correlated positively with axis 2. These metrics indicated higher abundances in 2018 at both the upstream and downstream sampling sites, forming a separate group from other samples, thus showing interannual differences in communities of biological quality elements. The upstream site also differed from other samples in 2017 and showed a negative correlation with axis 2 (Figure 3).

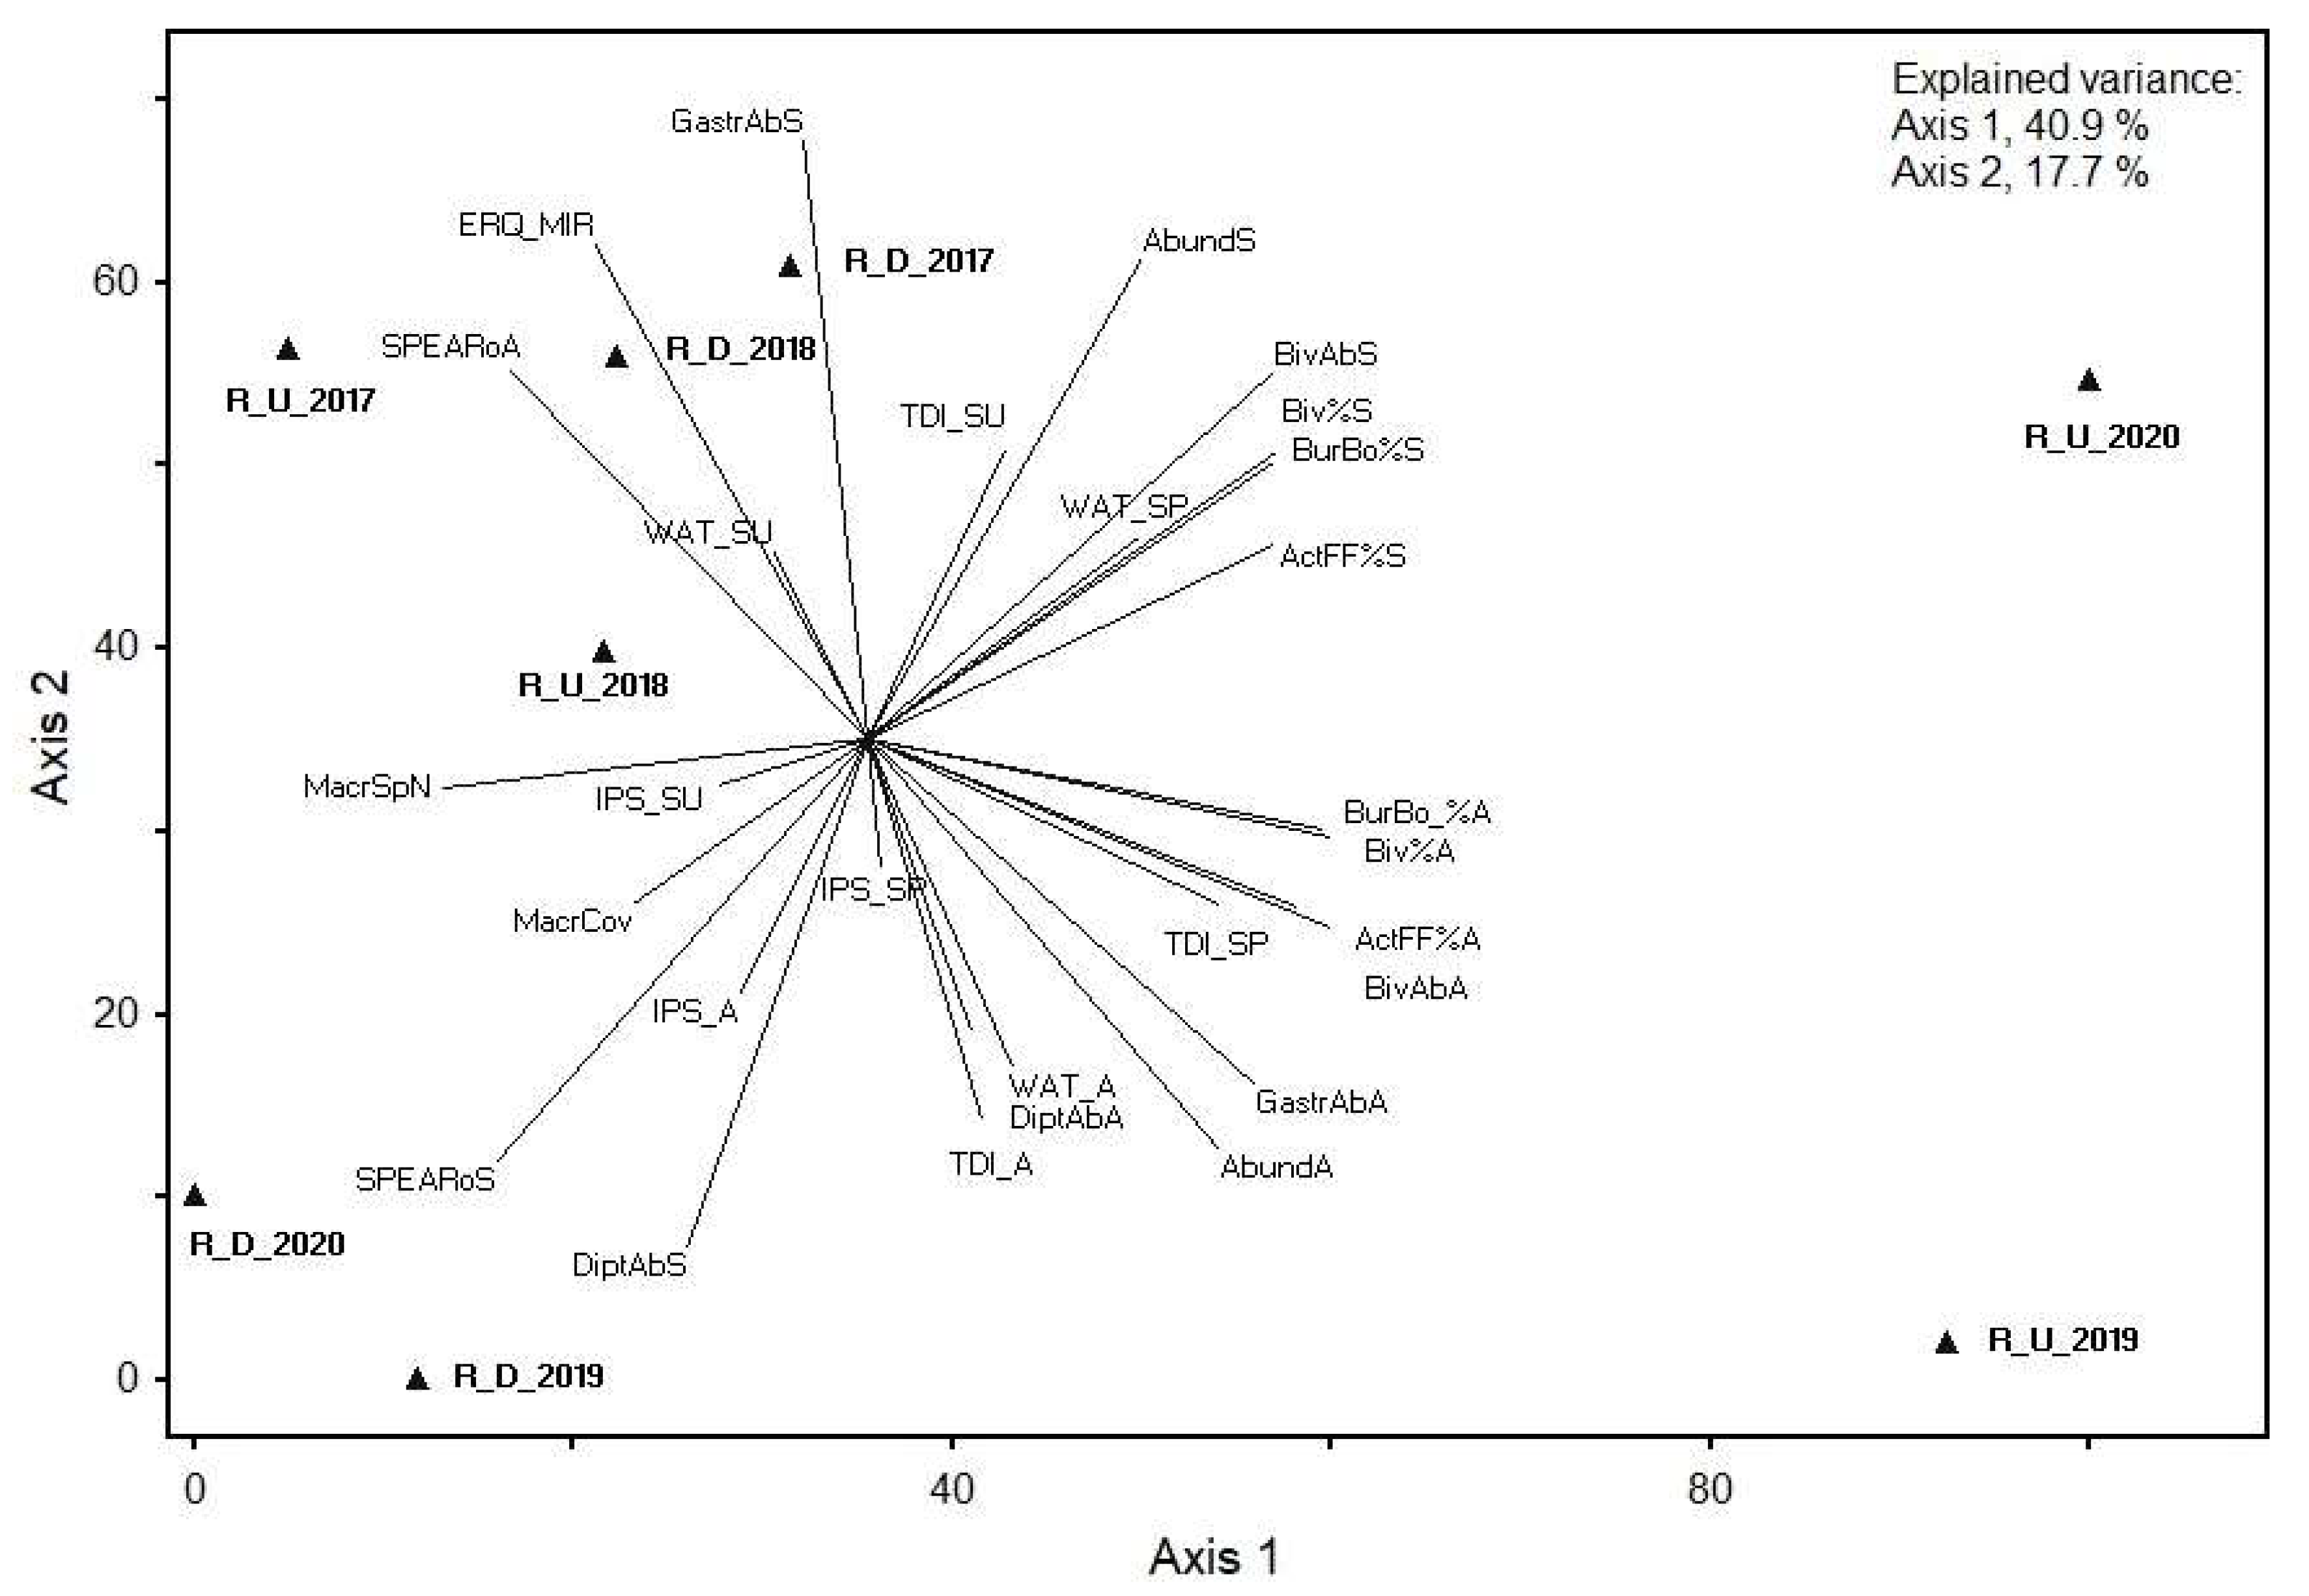
3.6. Indicator Species Analysis of the Rusinupe

Two indicator species showed significant interannual variability (p < 0.05) for 2017 (one from the Diptera genus and one Plecoptera species). Upstream and downstream site differences showed nine indicator species (p < 0.05): one Gastropoda and one Ephemeroptera species for the upstream site, and two Gastropoda, one Isopoda, one Zygoptera, and three Trichoptera species for the downstream site. Rheophile indicator species were characteristic of the downstream site. Seven indicator species showed seasonal differences (p < 0.05): two significant indicator species (one Ephemeroptera and one Trichoptera species) were found for spring; five taxa (one Zygoptera and two Diptera families, in addition to two Trichoptera species) were found for autumn (Table 4).
According to the PCA of the metrics in the Rusinupe, axis 1 of selected benthic invertebrate PCA explained 56.96% of the total data variance, whereas axis 2 explained 22.72%. High correlation coefficient values with axis 1 were found for eight metrics, from which the majority were calculated from the abundance of Bivalvia. However, high correlation coefficient values with axis 2 were found for only one metric, calculated from the abundance of Gastropoda in spring.
The first two axes of phytobenthos, macrophyte, and selected benthic invertebrate metric PCA explained 58.6% of the total data variance (40.9% and 17.7% for axes 1 and 2, respectively) in the Rusinupe. Significant correlations with PCA ordination axes were found for all BQE group metrics. The highest positive correlation coefficients with axis 1 were found for abundance of Bivalvia (number of individuals, % from total abundance and abundance classes (%)), abundance of burrowing/boring organisms (%) in spring and autumn, and active filter feeders (%) in spring and autumn. With axis 2, the highest negative correlation coefficient was for abundance of Gastropoda in spring (Figure 4).

4. Discussion

4.1. Water Chemistry

The major advantages of forest fertilization include a reduction in greenhouse gas emissions and economic benefits from the additional wood volume increment [53]. However, the possible adverse effects of this practice on the aquatic environment are not fully understood, particularly in terms of fertilization rates and experimental scale, as high variability of enrichment level can be found at a scale of less than 1 km. The variability in the results of nutrient enrichment experiments can be explained by the sedimentary environment, benthic macrofauna, and macrophyte community [54]. In general, our short-term monitoring results did not indicate an apparent decrease of ecological quality according to chemical parameters in the studied streams, thus supporting the conclusions of an earlier study [20]. In the Age tributary, a significant decrease in DOC and an increase in PTOT concentration were observed one year after applying wood ash, whereas the K concentration after applying wood ash was not statistically significant. It should be noted that aquatic chemistry parameters, including PTOT, K, DOC, and NTOT, display strong seasonal changes due to differences in nutrient input sources and pathways to streams, in addition to nutrient consumption by algae and macrophytes [55]. Although PTOT concentration during the first summer was higher than during the second summer or a year before treatment, due to the short study time and absence of replicate sites, it was not possible to exclude the impact of interannual variability. Results from a similar study [6] conducted in a Swedish peatland showed elevated pH, PTOT, and K concentrations for up to two years after applying wood ash at concentrations (3.1 t ha−1) similar to those in the present study. A study [20] on the long-term effects of wood ash application in Finland showed increased K concentration but no effect on PTOT, indicating the slow release of PTOT from wood ash [56]. Similarly, the fertilization of organic soil with NH4NO3 did not affect NTOT concentration, although it has been reported that nitrate leaching occurred from acidic, sandy podosol [57]. In the present study, even after applying wood ash, concentrations of PTOT and NTOT in the Age were low and corresponded to high ecological quality both before and after the treatment. In the Rusinupe, NTOT showed good ecological quality, whereas total PTOT showed poor quality at both the control and treatment sites. We assume that the increased phosphorus concentration in the Rusinupe is caused by the loading of PTOT from drained forest soils in the catchment, as no other significant pollution sources were detected.

4.2. Biological Quality Elements

The species richness of diatoms observed in the Age and the Rusinupe would be considered relatively high and comparable with the taxa numbers of small streams in Sweden [5]. Of the species characteristic of forest streams, Gomphonema parvulum was common in the Age, Navicula cryptocephala in the Rusinupe, and Meridion circulare in both. Meridion circulare prefers alkaline or neutral pH values and tolerates slightly elevated concentrations of organically bound nitrogen [58]. Gomphonema parvulum is a eutraphenic species that tolerates low oxygen concentrations (>30%). Navicula cryptocephala requires moderate oxygen saturation (>50%), and M. circulare prefers oxygen saturation above 75%, as both are hypereutraphent species [59]. Their ecological requirements and occurrence reveal these species to be generalists [60]. In addition, our results of the diatom indices failed to detect any changes in the ecological quality of the studied streams, supporting the reported IPS values in Finland and Sweden [5,58]. The IPS values obtained at the streams examined in our study were comparable to those of boreal non-urban streams (mean 14.0), as reported by Teittinen et al. [58]. Although we did not estimate the changes in the biomass of primary producers following treatments with wood ash and NH4NO3, Hensley et al. [26] reported no impact of fertilization on the production of abundant algal and plant biomass.
The assessment of the effects of nutrients on the status of macrophytes in running waters is confounded by the synergistic effects of the other environmental and biotic variables that affect their growth, e.g., light conditions, substrate type, or stream velocity [61]. The most frequent macrophyte species observed in studied streams are tolerant to habitat degradation and other types of impacts, such as organic pollution [62]. In addition, the free-floating macrophyte species are limited by stream velocity. They reach their highest abundances in slow-flowing streams with sandy and soft, silty substrate similar to the treatment site in the Rusinupe.
Benthic invertebrates showed high seasonal and interannual variation in both species composition and abundance, in addition to in quality indices, thus supporting the results carried out in large rivers [63,64]. Moreover, the differences in macroinvertebrate assemblages between the treatment and control sites in the Age and Rusinupe are most likely caused by the natural variability of macroinvertebrate communities. Nevertheless, our results on macroinvertebrate abundance concur with those of a 3-year study in Germany, showing a distinct variation in seasonality. Regarding the macroinvertebrates, long-term studies are recommended to distinguish clear patterns in quantitative data [65]. Another cause of the macroinvertebrate data variability may be the beaver activity we observed at both studied streams in 2018. Beavers are reported to alter the macroinvertebrate communities, and the species richness of ecologically sensitive taxa, such as mayflies, stoneflies, and caddisflies, tends to decline [66,67]. Furthermore, the ISA results of benthic invertebrate communities support the statements mentioned previously. The herbivorous Lepidoptera indicator species Cataclysta lemntata (Table 3), which feeds on free-floating lemnids [68], may be evidence of beaver activity in 2018. The presence of seasonal indicator species in both streams could be suitably explained by the different life histories of aquatic invertebrates [69]. In the Age, the most significant differences were found within sampling year and sampling season rather than within sampling sites. In the Rusinupe, the most significant differences were found within sampling sites and sampling seasons rather than within sampling years. Such differences may be explained by the varying size of streams and the larger impact of local environmental factors [64] on benthic invertebrate communities in a small stream such as that of the Rusinupe. Studied biological quality element metrics showed high seasonal, interannual, and spatial data variability and we could not describe clear negative or positive patterns of diatom, macrophyte, and benthic invertebrate metric results.
Streams are open ecosystems, strongly connected to their riparian zone, and the aquatic biota are connected to the food resources and nutrients received from the terrestrial environment. Separation of the natural environmental factor impact from an impact of anthropogenic factors on the stream ecosystems remains an open question. A study of plant communities [70] emphasized that climate change induced significant alterations in the hydrological characteristics of lowland streams in temperate regions. Moreover, climate change effects on the structural and functional properties of riparian ecosystems remain to be more fully elucidated.

5. Conclusions

In conclusion, no negative effects of forest fertilization on the studied streams were observed, though we are aware that a complex set of different factors, e.g., site variability, beaver activity, and seasonal or interannual variations, may affect the ecological quality of the lotic ecosystems. Therefore, we suggest that longer-term monitoring of reference conditions is needed to distinguish the impact of forest fertilization from the natural variability of physico-chemical parameters and biological quality elements. Additionally, site-specific hydrology, measurements of forest soil chemistry, and shallow groundwater are required for better understanding of the processes and effects caused by forest fertilizers.

Supplementary Materials

The following supporting information can be downloaded at: https://www.mdpi.com/article/10.3390/f13020196/s1, Figure S1: Valves of diatoms collected in the Age stream upstream of the treatment site (November 2017) in 200× magnification (photo by Dr. I. Druvietis); Figure S2: Macrophytes of the Rusinupe stream downstream of the treatment site in July 2020 (photo by L. Uzule); Figure S3: Macroinvertebrates of the Age stream (upstream of the treatment site, collected 09.10.2018) in a Petri dish (photo by D. Ozoliņš).

Author Contributions

Conceptualization, D.O. and A.L.; methodology, I.K. (Ilga Kokorite), L.U., D.O., M.M.-P. and I.K. (Ilze Karklina); formal analysis, A.S. and I.K. (Ilze Karklina); writing—original draft preparation, D.O., I.K. (Ilga Kokorite), I.K. (Ilze Karklina), A.S., L.U. and M.M.-P.; writing—review and editing, A.L.; funding acquisition, A.L. All authors have read and agreed to the published version of the manuscript.

Funding

This study was elaborated within the scope of the post-doctoral research project “Economic and environmental assessment of biomass production in buffer zones around drainage systems and territories surrounding the protective belts of natural water streams” (agreement No. 1.1.1.2/16/l/001, application No. 1.1.1.2/VIAA/3/19/437).

Data Availability Statement

The data used in this study are available on request from the corresponding author.

Acknowledgments

This study was supported by University of Latvia grant Nr. AAp2016/B041//Zd2016/AZ03 “Climate change and sustainable use of natural resources”. The authors also want to thank Guntis Tabors for valuable comments on soil classification in Latvia.

Conflicts of Interest

The authors declare no conflict of interest.

References

  1. Sikström, U.; Almqvist, C.; Jansson, G. Growth of Pinus sylvestris after the application of wood ash or P and K fertilizer to a peatland in southern Sweden. Silva Fenn. 2010, 44, 411–425. [Google Scholar] [CrossRef] [Green Version]
  2. Pukkala, T. Optimal nitrogen fertilization of boreal conifer forest. For. Ecosyst. 2017, 4, 3. [Google Scholar] [CrossRef] [Green Version]
  3. Lindkvist, A.; Kardell, Ö.; Nordlund, C. Intensive Forestry as Progress or Decay? An Analysis of the Debate about Forest Fertilization in Sweden, 1960–2010. Forests 2011, 2, 112–146. [Google Scholar] [CrossRef] [Green Version]
  4. Lundström, U.S.; Bain, D.C.; Taylor, A.F.S.; van Hees, P.A.W. Effects of Acidification and its Mitigation with Lime and Wood Ash on Forest Soil Processes: A Review. Water Air Soil Pollut. Focus 2003, 3, 5–28. [Google Scholar] [CrossRef]
  5. Aronsson, K.A.; Ekelund, N.G.A. Limnological effects on a first order stream after wood ash application to a boreal forest catchment in Bispgården, Sweden. For. Ecol. Manag. 2008, 255, 245–253. [Google Scholar] [CrossRef]
  6. Ring, E.; von Brömssen, C.; Losjö, K.; Sikström, U. Water chemistry following wood-ash application to a Scots pine stand on a drained peatland in Sweden. For. Stud. 2011, 54, 54–70. [Google Scholar] [CrossRef] [Green Version]
  7. Ring, E.; Jacobson, S.; Högbom, L. Long-term effects of nitrogen fertilization on soil chemistry in three Scots pine stands in Sweden. Can. J. For. Res. 2011, 41, 279–288. [Google Scholar] [CrossRef]
  8. Norström, S.H.; Bylund, D.; Vestin, J.L.K.; Lundström, U.S. Initial effects of wood ash application to soil and soil solution chemistry in a small, boreal catchment. Geoderma 2012, 187–188, 85–93. [Google Scholar] [CrossRef]
  9. Vejre, H.; Ingerslev, M.; Raulund-Rasmussen, K. Fertilization of Danish Forests: A Review of Experiments. Scand. J. For. Res. 2001, 16, 502–513. [Google Scholar] [CrossRef]
  10. Norwegian Ministry of Climate and Environment. Norway’s National Plan Related to the Decision of the EEA Joint committee No. 269/2019 of 25 October 2019. Available online: https://www.regjeringen.no/contentassets/31a96bc774284014b1e8e47886b3fa57/norways-national-plan-related-to-the-decision-of-the-eea-joint-committee-no.-269-2019-of-25-october-2019.pdf (accessed on 12 December 2021).
  11. Bardule, A.; Rancane, S.; Gutmane, I.; Berzins, P.; Stesele, V.; Lazdina, D.; Bardulis, A. The effect of fertiliser type on hybrid aspen increment and seed yield of perennial grass cultivated in the agroforestry system. Agron. Res. 2013, 11, 13–24. [Google Scholar]
  12. Okmanis, M.; Kalvis, T.; Lazdina, D. Initial evaluation of impact of evenness of spreading wood ash in forest on additional radial increment. In Proceedings of the 17th International Scientific Conference Engineering for Rural Development, Jelgava, Latvia, 23–25 May 2018; Malinovska, L., Osadcuks, V., Eds.; Latvia University of Life Sciences and Technologies, Faculty of Engineering: Jelgava, Latvia, 2018. [Google Scholar]
  13. Bardule, A.; Bertins, M.; Busa, L.; Lazdina, D.; Viksna, A.; Tvrdonova, M.; Kanicky, V.; Vaculovic, T. Variation of major elements and heavy metals occurrence in hybrid aspen (Populus tremuloides Michx. × P. tremula L.) tree rings in marginal land. iForest 2020, 13, 24–32. [Google Scholar] [CrossRef]
  14. Bardule, A.; Grinfelde, I.; Lazdina, D.; Bardulis, A.; Sarkanabols, T. Macronutrient leaching in a fertilized juvenile hybrid aspen (Populus tremula L. × P. tremuloides Michx.) plantation cultivated in an agroforestry system in Latvia. Hydrol. Res. 2018, 49, 407–420. [Google Scholar] [CrossRef]
  15. Bardule, A.; Lazdins, A.; Sarkanabols, T.; Lazdina, D. Fertilized short rotation plantations of hybrid aspen (Populus tremuloides Michx. × Populus tremula L.) for energy wood or mitigation of GHG emissions. In Proceedings of the 15th International Scientific Conference Engineering for Rural Development, Jelgava, Latvia, 25–27 May 2016; Malinovska, L., Osadcuks, V., Eds.; Latvia University of Agriculture, Faculty of Engineering: Jelgava, Latvia, 2016. [Google Scholar]
  16. Ojanen, P.; Penttilä, T.; Tolvanen, A.; Hotanen, J.-P.; Saarimaa, M.; Nousiainen, H.; Minkkinen, K. Long-term effect of fertilization on the greenhouse gas exchange of low-productive peatland forests. For. Ecol. Manag. 2019, 432, 786–798. [Google Scholar] [CrossRef]
  17. Jurán, S.; Edwards-Jonášová, M.; Cudlín, P.; Zapletal, M.; Šigut, L.; Grace, J.; Urban, O. Prediction of ozone effects on net ecosystem production of Norway spruce forest. iForest 2018, 11, 743–750. [Google Scholar] [CrossRef] [Green Version]
  18. Agyei, T.; Juráň, S.; Edwards-Jonášová, M.; Fischer, M.; Švik, M.; Komínková, K.; Ofori-Amanfo, K.K.; Marek, M.V.; Grace, J.; Urban, O. The Influence of Ozone on Net Ecosystem Production of a Ryegrass–Clover Mixture under Field Conditions. Atmosphere 2021, 12, 1629. [Google Scholar] [CrossRef]
  19. Tulonen, T.; Arvola, L.; Ollila, S. Limnological Effects of Wood Ash Application to the Subcatchments of Boreal, Humic Lakes. J. Environ. Qual. 2002, 31, 946. [Google Scholar] [CrossRef]
  20. Piirainen, S.; Domisch, T.; Moilanen, M.; Nieminen, M. Long-term effects of ash fertilization on runoff water quality from drained peatland forests. For. Ecol. Manag. 2013, 287, 53–66. [Google Scholar] [CrossRef]
  21. Renou-Wilson, F.; Farrell, E.P. Phosphorus in surface runoff and soil water following fertilization of afforested cutaway peatlands. Boreal Environ. Res. 2007, 12, 693–709. [Google Scholar]
  22. Xu, Z.; Xu, Y.J. Assessing effectiveness of long-term forestry best management practices on stream water quality at a basin scale—a case study in Southern USA. Environ. Monit. Assess. 2018, 190, 108. [Google Scholar] [CrossRef]
  23. Orsini, F.; Kahane, R.; Nono-Womdim, R.; Gianquinto, G. Urban agriculture in the developing world: A review. Agron. Sustain. Dev. 2013, 33, 695–720. [Google Scholar] [CrossRef] [Green Version]
  24. Perrin, C.J.; Shortreed, K.S.; Stockner, J.G. An Integration of Forest and Lake Fertilization: Transport and Transformations of Fertilizer Elements. Can. J. Fish. Aquat. Sci. 1984, 41, 253–262. [Google Scholar] [CrossRef]
  25. Stein, L.Y.; Klotz, M.G. The nitrogen cycle. Curr. Biol. 2016, 26, 94–98. [Google Scholar] [CrossRef] [Green Version]
  26. Hensley, R.T.; Decker, P.H.; Flinders, C.; McLaughlin, D.; Schilling, E.; Cohen, M.J. Fertilization has negligible effects on nutrient export and stream biota in two North Florida forested watersheds. For. Ecol. Manag. 2020, 465, 118096. [Google Scholar] [CrossRef]
  27. Rimet, F. Diatoms: An Ecoregional Indicator of Nutrients, Organic Mater and Micropollutants Pollution. Ph.D. Thesis, Université de Grenoble, Grenoble, France, 2012. [Google Scholar]
  28. Gudmundsdottir, R.; Palsson, S.; Hannesdottir, E.R.; Olafsson, J.S.; Gislason, G.M.; Moss, B. Diatoms as indicators: The influences of experimental nitrogen enrichment on diatom assemblages in sub-Arctic streams. Ecol. Indic. 2013, 32, 74–81. [Google Scholar] [CrossRef]
  29. Kelly, M.G.; Whitton, B.A. The Trophic Diatom Index: A new index for monitoring eutrophication in rivers. J. Appl. Phycol. 1995, 7, 433–444. [Google Scholar] [CrossRef]
  30. Haury, J.; Peltre, M.C.; Trémolières, M.; Barbe, J.; Thiébaut, G.; Bernez, I.; Daniel, H.; Chatenet, P.; Haan-Archipof, G.; Muller, S.; et al. A new method to assess water trophy and organic pollution—The Macrophyte Biological Index for Rivers (IBMR): Its application to different types of river and pollution. Hydrobiologia 2006, 570, 153–158. [Google Scholar] [CrossRef]
  31. Willby, N.J.; Pitt, J.; Phillips, G.L. The Ecological Classification of UK Rivers Using Aquatic Macrophytes; Environment Agency: Bristol, UK, 2009; p. 222. [Google Scholar]
  32. Kuhar, U.; Germ, M.; Gaberščik, A.; Urbanič, G. Development of a River Macrophyte Index (RMI) for assessing river ecological status. Limnologica 2011, 41, 235–243. [Google Scholar] [CrossRef]
  33. Scott, W.A.; Adamson, J.K.; Rollinson, J.; Parr, T.W. Monitoring of aquatic macrophytes for detection of long-term change in river systems. Environ. Monit. Assess. 2002, 73, 131–153. [Google Scholar] [CrossRef]
  34. Birk, S.; Willby, N. Towards harmonization of ecological quality classification: Establishing common grounds in European macrophyte assessment for rivers. Hydrobiologia 2010, 652, 149–163. [Google Scholar] [CrossRef]
  35. Aguiar, F.C.; Segurado, P.; Urbanič, G.; Cambra, J.; Chauvin, C.; Ciadamidaro, S.; Dörflinger, G.; Ferreira, J.; Germ, M.; Manolaki, P.; et al. Comparability of river quality assessment using macrophytes: A multi-step procedure to overcome biogeographical differences. Sci. Total Environ. 2014, 476–477, 757–767. [Google Scholar] [CrossRef]
  36. Hauer, F.R.; Lamberti, G.A. (Eds.) Methods in Stream Ecology, 1st ed.; Academic Press: New York, NY, USA, 1996; p. 674. [Google Scholar]
  37. Armitage, P.D.; Moss, D.; Wright, J.F.; Furse, M.T. The performance of a new biological water quality score system based on a wide range of unpolluted running-water sites. Water Res. 1983, 17, 333–347. [Google Scholar] [CrossRef]
  38. Gabriels, W.; Lock, K.; De Pauw, N.; Goethals, P.L.M. Multimetric Macroinvertebrate Index Flanders (MMIF) for biological assessment of rivers and lakes in Flanders (Belgium). Limnol.-Ecol. Manag. Inland Waters 2010, 40, 199–207. [Google Scholar] [CrossRef] [Green Version]
  39. Bušs, K. Meža Ekoloģija un Tipoloģija [Forest Ecology and Typology]; ‘Zinātne’: Riga, Latvia, 1981; p. 64. [Google Scholar]
  40. Avotniece, Z.; Aņiskeviča, S.; Maļinovskis, E. Climate Change Scenarios for Latvia; State Ltd. “Latvian Environment, Geology and Meteorology Centre”; 2017. p. 236. Available online: https://www4.meteo.lv/klimatariks/files/zinojums.pdf (accessed on 2 October 2021).
  41. IUSS Working Group WRB. World Reference Base for Soil Resources 2006; World Soil Resources Reports No. 103; FAO: Rome, Italy, 2006; p. 145. [Google Scholar]
  42. Stoddard, J.L.; Larsen, D.P.; Hawkins, C.P.; Johnson, R.K.; Norris, R.H. Setting Expectations for the Ecological Condition of Streams: The Concept of Reference Condition. Ecol. Appl. 2006, 16, 1267–1276. [Google Scholar] [CrossRef]
  43. Lecointe, C.; Coste, M.; Prygel, J. ‘Omnidia’ software for taxonomy, calculation of diatom indices and inventories management. Hydrobiologia 1993, 269–270, 509–513. [Google Scholar] [CrossRef]
  44. Timm, H.; Vilbaste, S. Pinnavee Ökoloogilise Seisundi Hindamise Metoodika Bioloogiliste Kvaliteedielementide Alusel. Bentiliste Ränivetikate Kooslus jões. Suurselgrootute Põhjaloomade Kooslus jões. ja Järves. [Methodology for Assessing the Ecological Status of Surface Waters on the Basis of Biological Quality Elements. Composition of Benthic Siliceous Algae in the Rivers. A Community of Large Invertebrates in the Rivers and Lakes]. Tartu, Estonia, 2010; Volume 112.
  45. Szoszkiewicz, K.; Jusik, S.; Pietruczuk, K.; Gebler, D. The Macrophyte Index for Rivers (MIR) as an Advantageous Approach to Running Water Assessment in Local Geographical Conditions. Water 2019, 12, 108. [Google Scholar] [CrossRef] [Green Version]
  46. Uzule, L.; Jēkabsone, J. Fitting the Assessment System for Rivers in Latvia Using Macrophytes to the Results of the Central Baltic Geographical Intercalibration Group; Institute of Biology, University of Latvia: Salaspils, Latvia, 2016; Volume 16. [Google Scholar]
  47. Anonymous. AQEM European Stream Assessment Program; English Manual, Version 2.3; Published Online, April 2004. Available online: http://www.aqem.de/ (accessed on 12 December 2021).
  48. Ozolins, D.; Skuja, A. Fitting the New Latvian Macroinvertebrate Index (LMI) for Rivers to the Results of the Central-Baltic Geographical Intercalibration Group; Institute of Biology, University of Latvia: Salaspils, Latvia, 2016; Volume 20. [Google Scholar]
  49. McCune, B.; Mefford, M.J. PC-ORD: Multivariate Analysis of Ecological Data; MjM Solfware Desing: Lincoln, OR, USA, 2006. [Google Scholar]
  50. Bakker, J.D. Increasing the utility of Indicator Species Analysis. J. Appl. Ecol. 2008, 45, 1829–1835. [Google Scholar] [CrossRef]
  51. Dufrêne, M.; Legendre, P. Species Assemblages and Indicator Species: The Need for a Flexible Asymmetrical Approach. Ecol. Monogr. 1997, 67, 345–366. [Google Scholar] [CrossRef]
  52. R Core Team. R: A Language and Environment for Statistical Computing; R Foundation for Statistical Computing; 2018. Available online: https://www.R-project.org/ (accessed on 25 October 2021).
  53. Petaja, G.; Okmanis, M.; Makovskis, K.; Lazdiņa, D.; Lazdiņš, A. Forest Fertilization: Economic Effect and Impact on GHG Emissions in Latvia. Balt. For. 2018, 24, 9–16. [Google Scholar]
  54. Douglas, E.J.; Pilditch, C.A.; Hines, L.V.; Kraan, C.; Thrush, S.F. In situ soft sediment nutrient enrichment: A unified approach to eutrophication field experiments. Mar. Pollut. Bull. 2016, 111, 287–294. [Google Scholar] [CrossRef] [Green Version]
  55. Klavins, M.; Rodinov, V.; Kokorite, I.; Klavina, I.; Apsite, E. Long-term and seasonal changes in chemical composition of surface waters in Latvia. Environ. Monit. Assess. 2001, 66, 233–251. [Google Scholar] [CrossRef]
  56. Karltun, E.; Saarsalmi, A.; Ingerslev, M.; Mandre, M.; Andersson, S.; Gaitnieks, T.; Ozolinčius, R.; Varnagiryte-Kabasinskiene, I. Wood Ash Recycling—Possibilities and Risks. In Sustainable Use of Forest Biomass for Energy; Röser, D., Asikainen, A., Raulund-Rasmussen, K., Stupak, I., Eds.; Sustainable Use of Forest Biomass for Energy; Springer: Dordrecht, The Netherlands, 2008; Volume 12, pp. 79–108. [Google Scholar] [CrossRef]
  57. Kahl, J.S.; Fernandez, I.J.; Rustad, L.E.; Peckenham, J. Threshold Application Rates of Wood Ash to an Acidic Forest Soil. J. Environ. Qual. 1996, 25, 220–227. [Google Scholar] [CrossRef]
  58. Teittinen, A.; Taka, M.; Ruth, O.; Soininen, J. Variation in stream diatom communities in relation to water quality and catchment variables in a boreal, urbanized region. Sci. Total Environ. 2015, 530–531, 279–289. [Google Scholar] [CrossRef] [PubMed]
  59. Dam, H.; Mertens, A.; Sinkeldam, J. A coded checklist and ecological indicator values of freshwater diatoms from The Netherlands. Neth. J. Aquat. Ecol. 1994, 28, 117–133. [Google Scholar] [CrossRef]
  60. Finlay, B. Hypothesis: The Rate and Scale of Dispersal of Freshwater Diatom Species is a Function of their Global Abundance. Protist 2002, 153, 261–273. [Google Scholar] [CrossRef]
  61. Franklin, P.; Dunbar, M.; Whitehead, P. Flow controls on lowland river macrophytes: A review. Sci. Total Environ. 2008, 400, 369–378. [Google Scholar] [CrossRef]
  62. Baattrup-Pedersen, A.; Larsen, S.E.; Riis, T. Composition and Richness of Macrophyte Communitites in Small Danish Streams—Influence of Environmental Factors and Weed Cutting. Hydrobiologia 2003, 495, 171–179. [Google Scholar] [CrossRef]
  63. Bady, P.; Doledec, S.; Fesl, C.; Gayraud, S.; Bacchi, M.; Scholl, F. Use of invertebrate traits for the biomonitoring of European large rivers: The effects of sampling effort on genus richness and functional diversity. Freshw. Biol. 2005, 50, 159–173. [Google Scholar] [CrossRef]
  64. Schmera, D.; Erős, T.; Heino, J. Habitat filtering determines spatial variation of macroinvertebrate community traits in northern headwater streams. Community Ecol. 2013, 14, 77–88. [Google Scholar] [CrossRef] [Green Version]
  65. Meyer, E. Pattern of invertebrate community structure, abundance and standing crop in a Black Forest stream: Results of a 3-year study. SIL Proc. 1922–2010 1991, 24, 1840–1845. [Google Scholar] [CrossRef]
  66. Pliūraitė, V.; Kesminas, V. Ecological impact of Eurasian beaver (Castor fiber) activity on macroinvertebrate communities in Lithuanian trout streams. Cent. Eur. J. Biol. 2012, 7, 101–114. [Google Scholar] [CrossRef] [Green Version]
  67. Washko, S.; Roper, B.; Atwood, T.B. Beavers alter stream macroinvertebrate communities in north-eastern Utah. Freshw. Biol. 2020, 65, 579–591. [Google Scholar] [CrossRef] [Green Version]
  68. Mariani, F.; Ellwood, N.T.W.; Zuccarello, V.; Ceschin, S. Compatibility of the Invasive Alien Lemna minuta and Its Potential Biocontrol Agent Cataclysta lemnata. Water 2020, 12, 2719. [Google Scholar] [CrossRef]
  69. Johnson, R.C.; Carreiro, M.M.; Jin, H.S.; Jack, J.D. Within-year temporal variation and life-cycle seasonality affect stream macroinvertebrate community structure and biotic metrics. Ecol. Indic. 2012, 13, 206–214. [Google Scholar] [CrossRef]
  70. Baattrup-Pedersen, A.; Garssen, A.; Göthe, E.; Hoffmann, C.C.; Oddershede, A.; Riis, T.; van Bodegom, P.; Larsen, S.E.; Soons, M. Structural and functional responses of plant communities to climate change-mediated alterations in the hydrology of riparian areas in temperate Europe. Ecol. Evol. 2018, 8, 4120–4135. [Google Scholar] [CrossRef] [Green Version]
Figure 1. Location of the forest fertilization sites at two hemiboreal streams in Latvia (the boundaries of administrative territories obtained from Eurostat (© EuroGeographics for the administrative boundaries)).
Forests 13 00196 g001
Figure 2. Average concentration of aquatic chemistry parameters (Figure indicates 25th, 50th, and 75th percentile, minimal and maximal value, and outliers) as influenced by forest fertilization in two hemiboreal streams in Latvia: (a) p < 0.01; (b) p < 0.05.
Forests 13 00196 g002
Figure 3. PCA showing the relationship between phytobenthos, macrophyte, and selected macroinvertebrate metrics at two Age stream sites in 2017–2020. Abbreviations: Sampling site code: A, Age; U, upstream; D, downstream; examples: A_U_2017, Age upstream demo object in 2017; A_D_2017, Age downstream demo object in 2017; metrics: last letter of metric—S, spring; SU, summer; A, autumn. Diatoms: TDI, Trophic Diatom Index; IPS, Specific Polluosensitivity Index; WAT, Watanabe’s Index. Macrophytes: MacrSpN, total number of macrophyte species; MacrCov, total coverage of macrophytes (%); EQR_MIR, EQR of Macrophyte Index for Rivers (MIR). Benthic invertebrates: Spring: Abund_S, total abundance in spring; EPTpaclS, abundance classes (%) of Ephemeroptera, Plecoptera, and Trichoptera in spring; EPT/TT_S, number of Ephemeroptera, Plecoptera, and Trichoptera taxa to the total number of taxa in spring; EPTCBOTS, number of Ephemeroptera, Plecoptera, Trichoptera, Coleoptera, Bivalvia, and Odonata taxa in spring; BivAb_S, abundance of Bivalvia in spring; TrichAbS, abundance of Trichoptera in spring. Autumn: Abund_A, total abundance in autumn; EPTpaclA, abundance classes (%) of Ephemeroptera, Plecoptera, and Trichoptera in autumn; EPT/TT_A, number of Ephemeroptera, Plecoptera, and Trichoptera taxa to the total number of taxa in autumn; EPTCBOTA, number of Ephemeroptera, Plecoptera, Trichoptera, Coleoptera, Bivalvia, and Odonata taxa in autumn; BivAb_A, abundance of Bivalvia in autumn; TrichAbA, abundance of Trichoptera in autumn.
Forests 13 00196 g003
Figure 4. PCA showing the relationship between phytobenthos, macrophyte, and selected macroinvertebrate metrics at two Rusinupe stream sites in 2017–2020. Abbreviations: Sampling site code: R, Rusinupe; U, upstream; D, downstream; examples: R_U_2017, Rusinupe upstream demo object in 2017; R_D_2017, Rusinupe downstream demo object in 2017; metrics: last letter of metric—S, spring; SU, summer; A, autumn. Diatoms: TDI, Trophic Diatom Index; IPS, Specific Polluosensitivity Index; WAT, Watanabe’s Index. Macrophytes: MacrSpN, total number of macrophyte species; MacrCov, total coverage of macrophytes (%); ERQ_MIR, ERQ of Macrophyte Index for Rivers (MIR). Benthic invertebrates: Spring: Abund_S, total abundance in spring; DiptAbS, abundance of Diptera in spring; BivAb_S, abundance of Bivalvia in spring; Biv%S, abundance of Bivalvia (%) in spring; GastrAbS, abundance of Gastropoda in spring; ActFF%A, active filter feeders (%) in spring; BurBo%S, abundance of burrowing and boring organisms (%) in spring; SPEARoS, SPEAR organic in spring. Autumn: Abund_A, total abundance in autumn; DiptAbA, abundance of Diptera in autumn; BivAb_A, abundance of Bivalvia in autumn; Biv%A, abundance of Bivalvia (%) in autumn; GastrAbA, abundance of Gastropoda in autumn; ActFF%S, active filter feeders (%) in autumn; BurBo%A, abundance of burrowing and boring organisms (%) in autumn; SPEARoA, SPEAR organic in autumn.
Forests 13 00196 g004
Table 1. Characteristics and treatments of the studied forest stands located at two hemiboreal streams in Latvia.
NoForest TypeTree SpeciesStand Age 1Type of FertilizerDose of Fertilizer, t ha−1Treated Area, haDate of TreatmentCoordinates
1MTM 2Scots pine94WA 434.702.201857.3986, 24.5930
2M 3Scots pine62NH4NO3 50.445.507.201756.6666, 24.5170
1 stand age in 2021; 2 Myrtillosa turf. mel.; 3 Myrtillosa; 4 wood ash; 5 ammonium nitrate.
Table 2. Characteristics of soil at the studied forest stands located at two hemiboreal streams in Latvia.
NopHCaCl2Soil Bulk Density kg/m3Total C, g/kgTotal N, g/kg
13.5131.5562.918.2
24.41265.77.60.4
Table 3. Indicator species analysis of the Age, showing indicator values of significant indicator species (groups are defined by year, season, and stream site).
Taxon NameParameter for Group DefiningObserved Indicator ValueIndicator Valuesp-Value
MeanStandart Deviation
Year
Pisidium sp.201831.828.21.40.01
Acroloxus lacustris201844.632.47.530.04
Ancylus fluviatilis201861.429.412.510.03
Atherix ibis201851.332.18.450.02
Limnius volckmari201851.233.88.410.03
Hydrachnidia Gen. sp.202056.832.18.490.002
Cataclysta lemnata201884.82812.050.01
Calopteryx virgo201951.832.78.840.02
Baetis muticus201761.929.512.40.02
Caenis luctuosa202041.532.23.390.01
Site
Sphaerium sp.Downstream70.443.39.860.02
Unio crassusDownstream62.528.110.370.03
Ceratopogonidae Gen. sp.Upstream65.7506.670.02
Cyrnus trimaculatusUpstream60.137.510.380.05
Polycentropus irroratusUpstream65.548.48.610.05
Season
Simuliidae Gen. sp.Spring71.747.98.420.01
Elmis aeneaSpring63.451.86.190.04
Hydrachnidia Gen. sp.Spring71.642.99.390.004
Paraleptophlebia submarginataAutumn66.345.89.370.03
Nemoura flexuosaAutumn82.148.28.630.0002
Leuctra sp.Spring95.940.59.840.0002
Brachycentrus subnubilusAutumn62.528.310.60.03
Ithytrichia lamellarisSpring61.640.710.160.04
Halesus digitatusSpring10037.410.330.0002
Limnephilus sp.Autumn81.237.910.70.004
Limnephilus lunatusSpring62.52810.240.03
Lepidostoma hirtumSpring69.947.98.360.02
Table 4. Indicator species analysis of the Rusinupe showing indicator values of significant indicator species (groups are defined by year, season, and stream site).
Taxon NameParameter for Group DefiningObserved Indicator ValueIndicator Valuesp-Value
MeanStandart Deviation
Year
Dicranota sp.201781.927.9120.01
Nemoura cinerea201744.1334.20.01
Site
Acroloxus lacustrisDownstream87.534.910.90.00
Bithynia tentaculataDownstream87.534.610.30.00
Segmentina nitidaUpstream794410.40.00
Asellus aquaticusDownstream60543.10.04
Calopteryx virgoDownstream6935.511.20.03
Cloeon dipterumUpstream62.528.511.30.02
Hydropsyche angustipennisDownstream65.837.410.40.02
Athripsodes aterrimusDownstream753110.70.01
Polycentropus irrratusDownstream62.528.29.80.03
Season
Chironomidae Gen. sp.Autumn59.452.720.00
Limoniidae Gen. sp.Autumn5631.710.60.05
Coenagrionidae Gen. sp.Autumn62.528100.02
Baetis rhodaniSpring78.437.810.40.01
Glyphotaelius pellucidusAutumn62.52810.60.02
Limnephilus flavicornisSpring70.934.610.30.01
Lype reductaAutumn73.340.29.80.01
Publisher’s Note: MDPI stays neutral with regard to jurisdictional claims in published maps and institutional affiliations.

