Article

Water Use Characteristics of Populus euphratica Oliv. and Tamarix chinensis Lour. at Different Growth Stages in a Desert Oasis

1
College of Ecology and Environment, Xinjiang University, Urumqi 830046, China
2
Key Laboratory of Oasis Ecology, Xinjiang University, Urumqi 830046, China
3
Key Laboratory of Smart City and Environment Modelling of Higher Education Institute, Xinjiang University, Urumqi 830046, China
4
School of Geographical Sciences, Xinjiang University, Urumqi 830046, China
5
Institute of Environmental Protection Science, Xinjiang Production and Construction Corps, Urumqi 830046, China
*
Author to whom correspondence should be addressed.
Forests 2022, 13(2), 236; https://doi.org/10.3390/f13020236
Submission received: 16 December 2021 / Revised: 27 January 2022 / Accepted: 28 January 2022 / Published: 3 February 2022
(This article belongs to the Section Forest Hydrology)

Abstract

:
Understanding the water use characteristics of vegetation is crucial for guiding the rational allocation of water resources and the restoration of sustainable vegetation in natural oases in arid desert areas. To analyze the water use characteristics of Populus euphratica Oliv. and Tamarix chinensis Lour. at different stages of growth in the Daliyabuyi natural pristine oasis in northwestern China, the δ18O values of plant xylem of 15 sample trees with different sizes per species, potential water sources (i.e., river water, soil water, and groundwater), and the δ13C values of plant leaves of sample trees were measured in August 2019 and June 2020. The results show that the δ18O values of the xylem water of P. euphratica at different growth stages were similar, but water uptake proportions from deep soil water changed in P. euphratica trees at different growth stages between years with (2019) and without (2020) river water. In contrast, the main water source of young T. chinensis shrubs was deep soil water, and those of mature and overmature shrubs were deep soil water and groundwater in 2020. However, the plant leaf water use efficiency (WUE) of the P. euphratica and T. chinensis were higher without river water. Overall, the water uptake proportion from groundwater and the WUE for T. chinensis were higher than those for P. euphratica, and thus, T. chinensis was more dependent on groundwater. This means that vegetation types and growth stages are the essential factors to be considered in ecological restoration management, which can enhance the effectiveness of vegetation restoration strategies.

1. Introduction

Desert vegetation resources are an important component of the ecosystem in arid desert areas, and they are highly significant in maintaining the stability of ecosystems and preventing desertification [1,2]. Owing to the shortage of water resources, the growth and distribution of desert vegetation are severely restricted [3,4,5]. Accurate information about the water use of desert vegetation is a basic prerequisite for the use of limited water resources to maintain the survival of desert vegetation [6,7]. Therefore, understanding the characteristics of plant water use will help to guide the practice of water resource management and vegetation restoration in arid desert areas.
Plant water use patterns and water use efficiency (WUE) are the two crucial metrics that reflect the characteristics of plant water [8]. Stable hydrogen and oxygen isotope techniques provide a powerful, reliable, and nondestructive method to study plant water use patterns [9]. Typically, no fractionation occurs during water transport between the root and shoot except for hydrogen fractionation in some halophytic plants [10,11]. Thus, the stable isotopic composition of plant water represents the integrated response of root systems to water sources with different isotopic signatures and can help to determine the soil depth at which plants obtain water or the source of plant water [9,12]. Many studies have been conducted on plant water use patterns using stable isotope techniques that primarily focus on plant water use patterns in different vegetation types, growth seasons, and growing stages [13,14,15,16]. In general, plant water use patterns are influenced by many physiological and physical characteristics [17], such as the distribution and functioning of fine roots [13], the availability of soil water [14,15], and the water demands of trees [16]. However, most of these studies have focused on plant water use patterns in pure forests, and insufficient research has been conducted on the water use patterns of different vegetation types and stages of plant growth in desert riparian forests. Furthermore, the differences in plant water use patterns during periods of the presence or absence of river water in arid regions remain unclear.
Plant WUE can be researched at multiple scales, such as leaf, individual, population, or ecosystem. Each research scale has different research methods, the results of which can reveal the intrinsic water consumption mechanism of plants, with practical significance for understanding specific plant water use [18]. Gas exchange and stable carbon isotope methods are the main methods used to determine plant water use efficiency at the leaf level [19]. The water use efficiency determined by the gas exchange method is transient, only representative of the physiological activity of plant leaves at a particular point in time, and subject to environmental fluctuations [20]. The research of WUE using the stable carbon isotope method overcomes the drawbacks of the traditional method, which can only perform short-term and transient studies. Carbon isotope composition can accurately reflect the water status of plants, and it has been used as a standard method to directly study the plant WUE [21,22]. It plays an irreplaceable role in revealing the response and adaptation characteristics of plants to environmental changes [23,24,25,26].
Daliyabuyi is located in the hinterland of the Taklimakan Desert in northwestern China. It is a natural pristine oasis formed by the tail of the Kriya River. Kriya River is the only supply of water for the oasis, and the amount of water supplied determines the survival and regeneration of oasis vegetation. The construction of a large reservoir in the upper reaches of the Kriya River has had serious effects on the distribution of water resources, affecting the vegetation in time, space, and volume, and the oasis has obviously degraded [27,28]. Populus euphratica Oliv. is a species of the Salicaceae, and Tamarix chinensis Lour. is a species of the Tamaricaceae. As typical dominant species in the desert, the two types of vegetation have typical physiological characteristics, such as tolerance to high temperatures and salinity and resistance to drought and sand [29]. They serve as a crucial barrier to protect oases and maintain the stability of oasis ecosystems. Studies on the water use patterns of P. euphratica and T. chinensis have been conducted in this oasis [30,31]. However, all of them focused on pure forests. In addition, the water use characteristics of P. euphratica differ during periods with or without river water. It is not clear whether there are differences in the water use characteristics between P. euphratica and T. chinensis in mixed forests or how the water use of P. euphratica and T. chinensis changes during periods with or without river water.
Consequently, we focused on (1) analyzing the water use characteristics of P. euphratica and T. chinensis at different growth stages; (2) how different water resources affect the water use characteristics of P. euphratica and T. chinensis. Two specific hypotheses were tested—(1) the water use characteristics of both species differs at different growth stages; (2) in the period with an absence of river water, P. euphratica tends to absorb groundwater, and the water use efficiency of both species increases. To test the above hypotheses, we selected a mixed forest sampling site consisting of P. euphratica and T. chinensis, and we investigated the water use characteristics of P. euphratica and T. chinensis at different growth stages using stable isotope techniques (δ18O and δ13C) in 2019 and 2020. Our work contributes to improving the understanding of the characteristics of plant water use and to guiding the sustainability of vegetation restoration in arid desert areas.

2. Materials and Methods
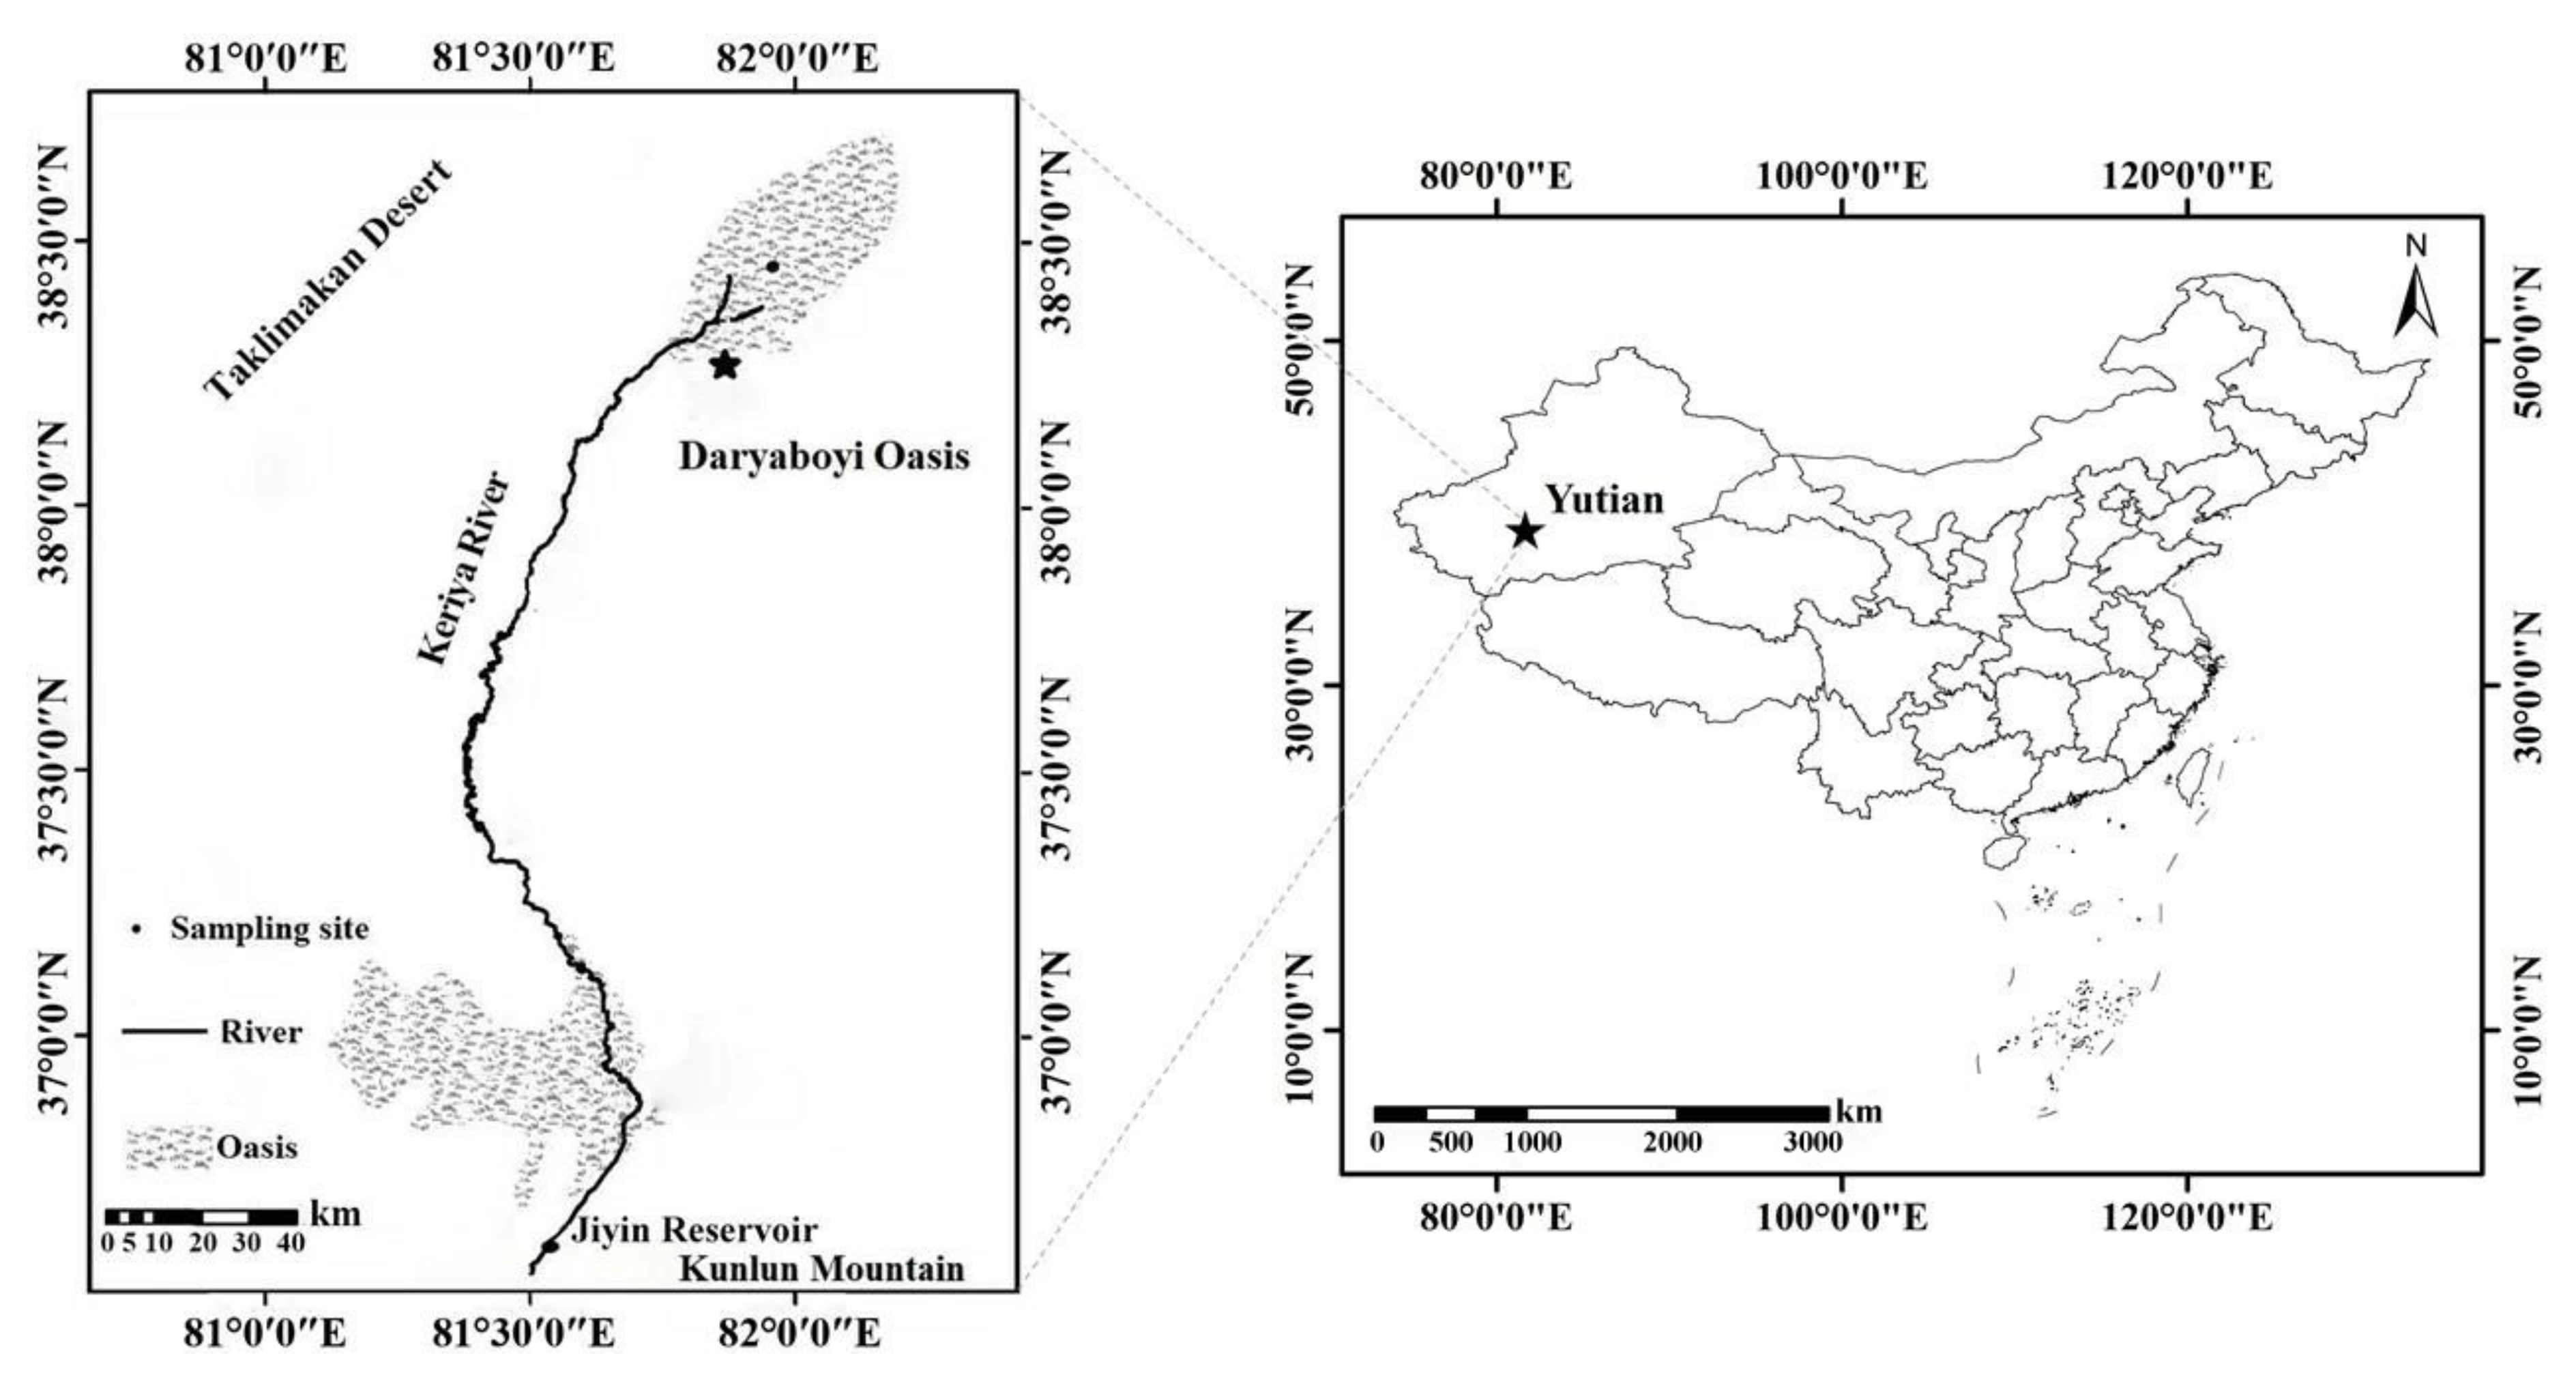
2.1. Study Area

The Daliyabuyi oasis is located in Yutian County, Xinjiang, China (38°16′–38°37′ N, 81°05′–81°46′ E) (Figure 1). The core area of the oasis is 324 km2. It belongs to the typical warm temperate arid desert climate. The annual average precipitation is <10 mm; the annual mean air temperature is 11.6 °C, and the mean evaporation is more than 2000 mm [27,28]. The vegetation in this oasis serves as a typical representative of desert ecosystems. They have simple structures and types and are sparsely distributed. The vegetation in this area is dominated by P. euphratica and T. chinensis.

2.2. Experimental Design

In August 2019, a sampling site (38°24’29” N, 81°56’8” E, altitude 1170 m) was selected within 10 m of the river in the Daliyabuyi oasis (Figure 1). The vegetation in the sampling site consisted of P. euphratica and T. chinensis. The soil that was sampled was sandy soil. In 2019, the sampling site had river water flowing through the river, but it had no river water in 2020. The groundwater depth was 4.2 m and 4.5 m in 2019 and 2020, respectively.
Different growth stages were determined based on the diameter of breast height (DBH) parameters combined with leaf characteristics to determine the different growth stages [32]. P. euphratica was divided into young trees (DBH ≤ 10 cm), mature trees (10 cm < DBH ≤ 40 cm), and overmature trees (DBH > 40 cm). Five representative healthy trees were chosen from each growth stage, and 15 trees in total were chosen as sample trees (Table 1). They were sampled in August 2019 and June 2020.
T. chinensis was classified based on its canopy width (CW) [33]. The shrubs were delineated as young (CW ≤ 100 cm), mature (100 cm < CW ≤ 500 cm), or overmature (CW > 500 cm). Five representative healthy shrubs were chosen from each growth stage, and 15 shrubs in total were chosen as sample shrubs (Table 1). They were sampled the same time as P. euphratica. However, the refrigerator that contained the T. chinensis samples was damaged during transportation in 2019. Thus, the data were abnormal, so the calculations and analyses for water resources of T. chinensis in 2019 were not conducted.

2.3. Sample Collection

Three branches 0.3–0.5 cm in diameter were sampled for their xylem. They were selected from each sample tree with a north orientation and approximately equal height from the ground and cut into 3–5 cm pieces. After removing the skin of each branch with a knife, the samples were placed in a sampling bottle and sealed with Parafilm. The samples were then immediately placed at 4 °C to reduce the evaporation of water and fractionation. Fully exposed, mature, and healthy leaves from the upper part of the canopy of the trees were collected in different directions, and 40 to 50 g were taken from each plant. The leaves were mixed, put into manual paper bags, and brought back to the laboratory for the determination of leaf δ13C.
Three points were selected near the sample trees to collect soil samples. The soil was sampled at a depth of 0–300 cm using a soil drill every 20 cm. The soil samples were divided into two portions. One portion was placed in a sampling bottle, sealed with parafilm, and immediately placed at 4 °C to determine the soil water isotope values in each soil layer, while the other portion was placed in an aluminum box to determine the soil water content using an oven-drying method.
The groundwater was sampled from observation wells at the sampling site. Three replicates of sampling bottles were extended to 40 cm below the water river to prevent the fractionation of water isotopes on the river surface. The rivers were only sampled in 2019 because there was no water in the river in 2020.

2.4. Isotopic Analysis

The water was extracted from the xylem and soil using a cryogenic vacuum distillation system (LI-2000; LICA, Beijing, China). The oxygen isotopic compositions of the samples were determined using an isotope ratio infrared spectroscopy analyzer known as the Liquid Water Isotope Analyzer (LWIA, DLT-100; Los Gatos Research, San Jose, CA, USA). The carbon isotopic values of P. euphratica and T. chinensis leaves were determined using a Thermo Delta V Advantage (DELTA-V; Thermo Fisher Scientific, Waltham, MA, USA) with analytical precisions of 0.25‰ for δ18O and 0.3‰ for δ13C. The formulae for calculating the oxygen isotope ratio and the carbon isotope ratio are shown in Equations (1) and (2), respectively, as follows:
δ 18 O = R s a m p l e R s t a n d a r d 1 × 1000
δ 18 C = R s a m p l e R s t a n d a r d 1 × 1000
The isotopic compositions were reported in standard δ-notation, representing ‰ deviations from the Vienna Standard Mean Ocean Water (VSMOW). Rsample is the ratio of heavy and light element richness in the sample (18Osam/16Osam, 13Csam/12Csam), and Rstadard is the ratio of heavy and light element richness of the national universal reference material (18Ostd/16Ostd, 13Cstd/12Cstd). To eliminate the effect of contamination with methanol and ethanol, the δ18O values of the xylem water were corrected using a standard curve that was created by engineers from Los Gatos Research [34]. An IsoSource mixing model was used to calculate the relative contributions of different water sources [35]. The fractional increment and mass balance of tolerance were established as 1% and 0.01%, respectively.

2.5. The Division of Water Sources

Based on the variation in the trend of water content and δ18O values in different soil profiles, the soil water was divided into shallow soil water and deep soil water. The final water sources include the following four types:
(1) Shallow soil water (0–140 cm): The δ18O values of soil water in this layer fluctuate greatly.
(2) Deep soil water (140–300 cm): The δ18O values of this layer were much lower than those of the shallow soil water, and there was slight variation in the amount of fluctuation.
(3) River water: There was water in the river in 2019.
(4) Groundwater: Groundwater was taken from the observation well in the sample site.

2.6. Data Analysis

There were five replicates for the plant samples and three for the soil and water samples. Outliers were identified before the data were analyzed using the absolute deviation around the median to exclude the most unreliable replicates. A one-way analysis of variance (ANOVA) with Duncan’s post hoc test (p < 0.05) was conducted to test for significant differences in the values of xylem water δ18O at different growth stages for P. euphratica and T. chinensis. In addition, any significant differences in the soil water content and δ18O values of soil water between 2019 and 2020 were identified using a t-test (p < 0.05). All the variables were checked for the distribution of normality (Shapiro–Wilk test) and homogeneity (Levene’s test) before they were analyzed. All the statistical tests and descriptive statistics were performed using SPSS 22.0 (IBM, Inc., Armonk, NY, USA). All the diagrams were drawn using Origin 2018 (OriginLab Corp., Northampton, MA, USA).

3. Results

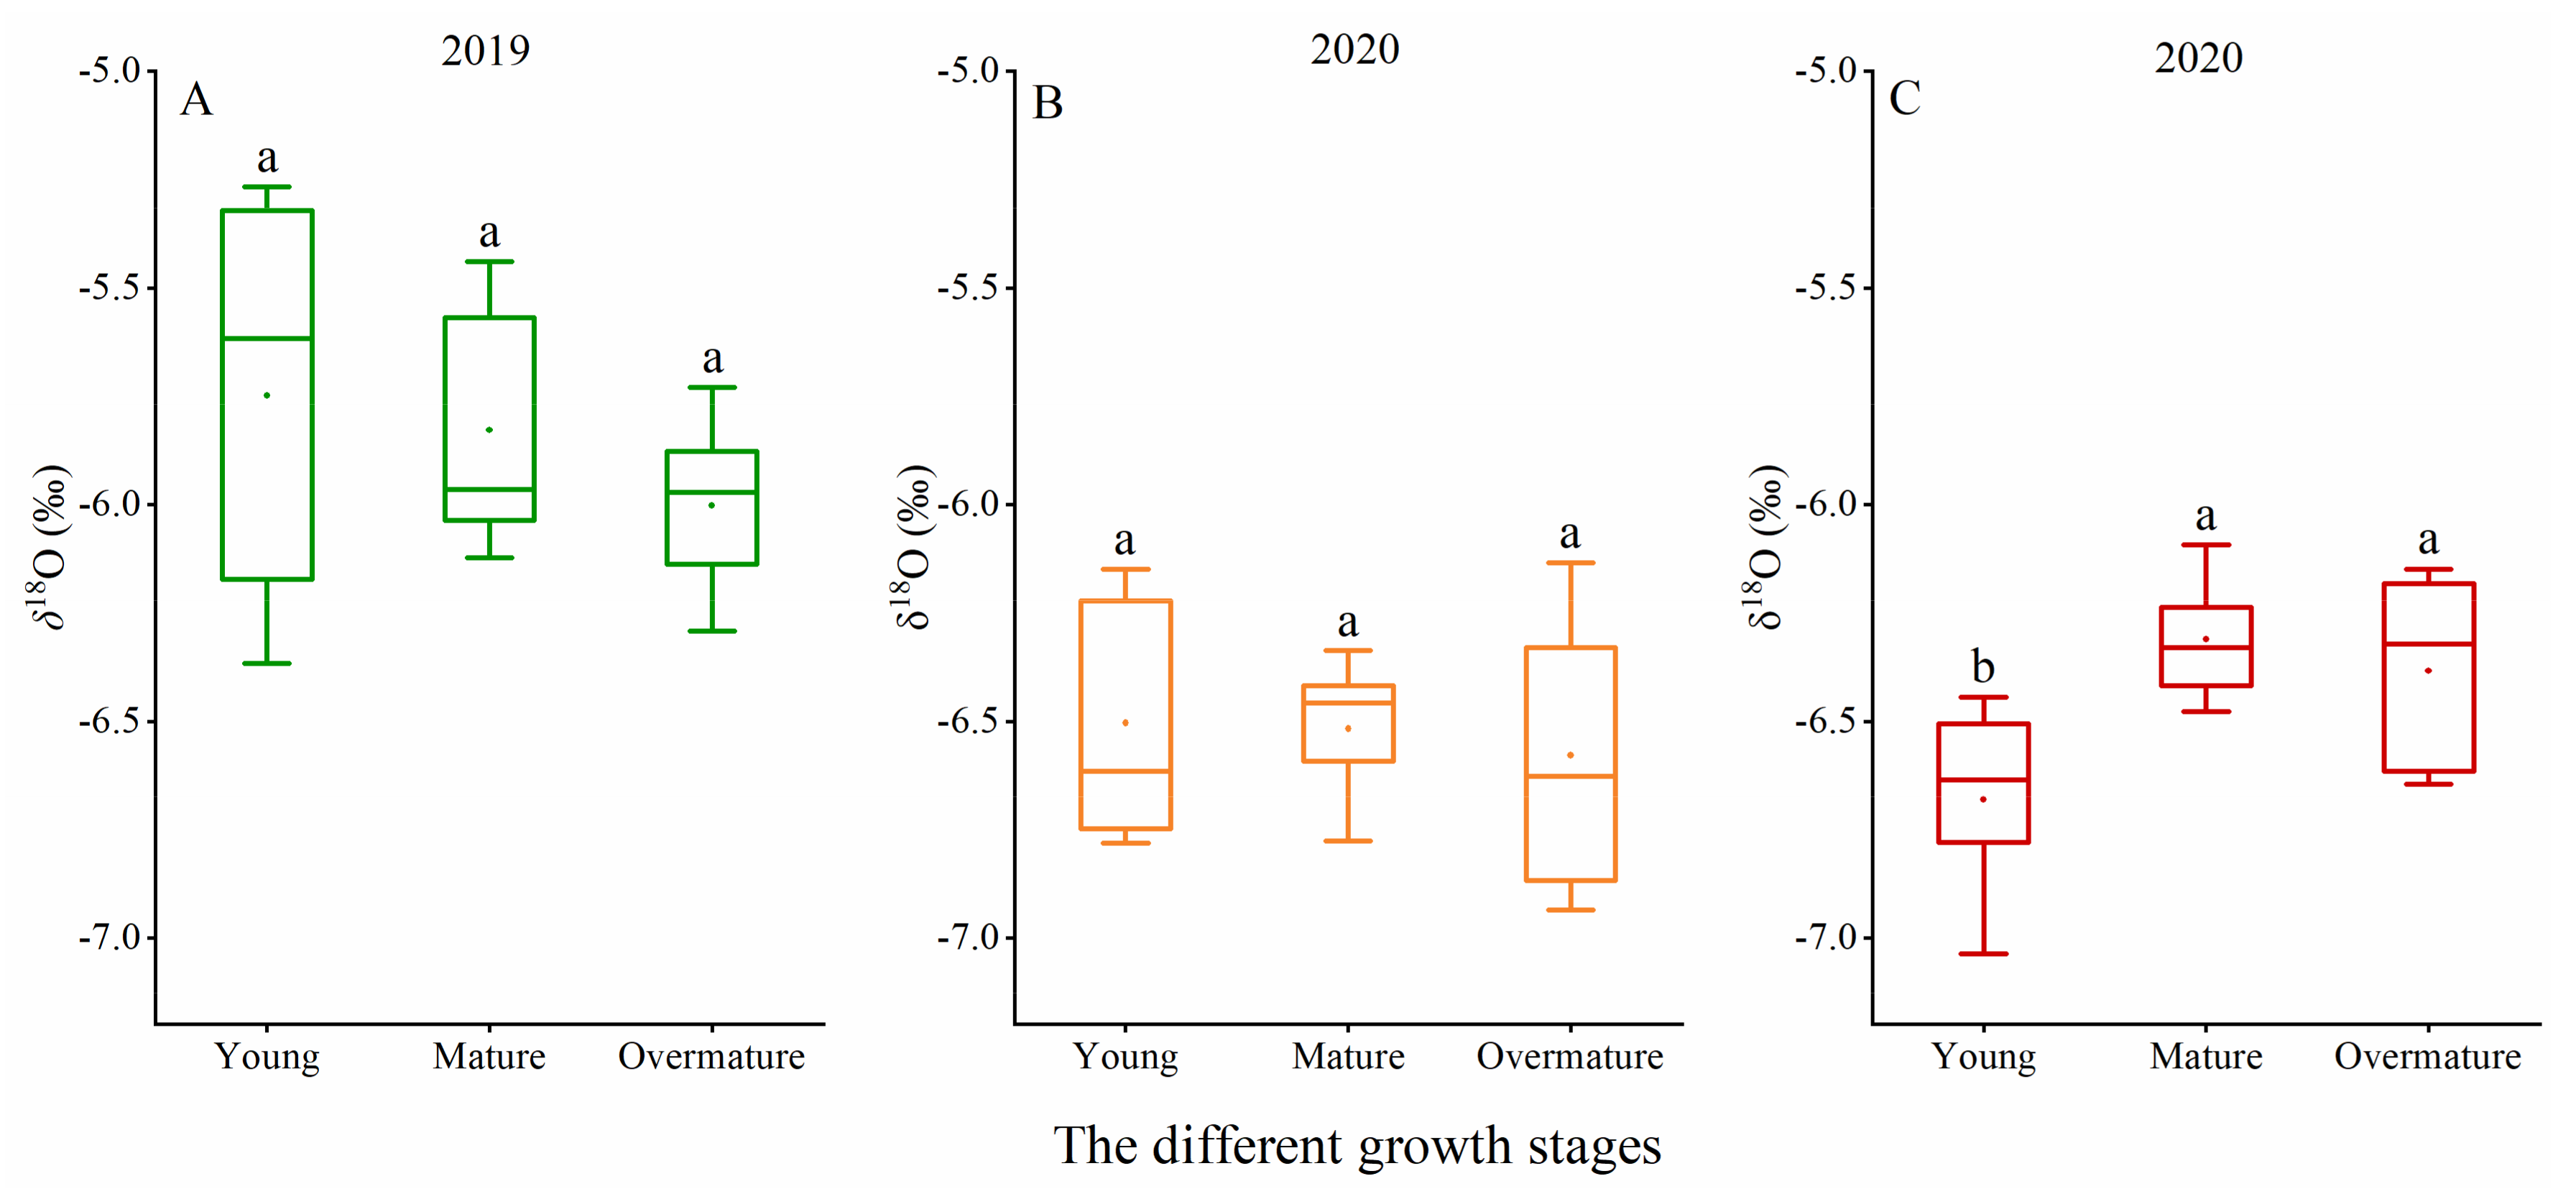
3.1. Variation of the Soil Water Content and δ18O Value

In 2019, the soil water content first fluctuated slightly and then increased rapidly, ranging from 1.5% to 18.6% (Figure 2A). In 2020, the soil water content increased slightly, ranging from 0.6% to 7.1% (Figure 2A). The shallow soil water content (0–140 cm) only changed slightly and was relatively similar during the two years, while the deep soil water content (140–300 cm) in 2019 was significantly higher than that in 2020. The shallow soil water content (0–140 cm) did not differ significantly between 2019 and 2020, but the deep soil water content (140–300 cm) differed significantly (p < 0.05).
The δ18O values exhibited distinct spatial variations, with the average progressively decreasing as the soil depth increased (Figure 2B). The δ18O values in the shallow soil layers (0–140 cm) changed rapidly, while the δ18O values in the deeper soil layers (140–300 cm) changed slowly in 2019 and 2020. There was no significant difference between the oxygen isotope values of the shallow soil water (0–140 cm) and the deep soil water (140–300 cm) between 2019 and 2020.

3.2. Isotopic Composition of Potential Water Sources and Xylem Water

In 2019, the δ18O values of the river water, shallow soil water, deep soil water, and groundwater were −7.43‰, −1.29‰, −5.92‰, and −5.72‰, respectively. However, the river water was no longer a potential water source in 2020, and the δ18O values of the shallow soil water, deep soil water, and groundwater were −2.39‰, −7.06‰, and −6.26‰, respectively. The δ18O value of the shallow soil water was the highest, followed by the groundwater and deep soil water, and the δ18O values of the river water were the lowest (Table 2).
The δ18O values of xylem water of P. euphratica at different growth stages did not differ significantly. The δ18O values of xylem water of young, mature, and overmature trees were −5.75‰, −5.83‰, and −6.00‰ in 2019, respectively, with an average value of −5.86‰. The corresponding δ18O values were −6.50‰, −6.52‰, and −6.58‰ in 2020, respectively, with an average value of −6.53‰. The δ18O values at different growth stages were higher in 2019 than those in 2020 (Figure 3A,B).
The δ18O values of xylem water in mature and overmature T. chinensis shrubs were significantly higher than those in the young shrubs (p < 0.05). The δ18O values of xylem water in young, mature, and overmature shrubs were −6.68‰, −6.38‰, and −6.31‰ in 2020, respectively, with an average value of −6.46‰ (Figure 3C).

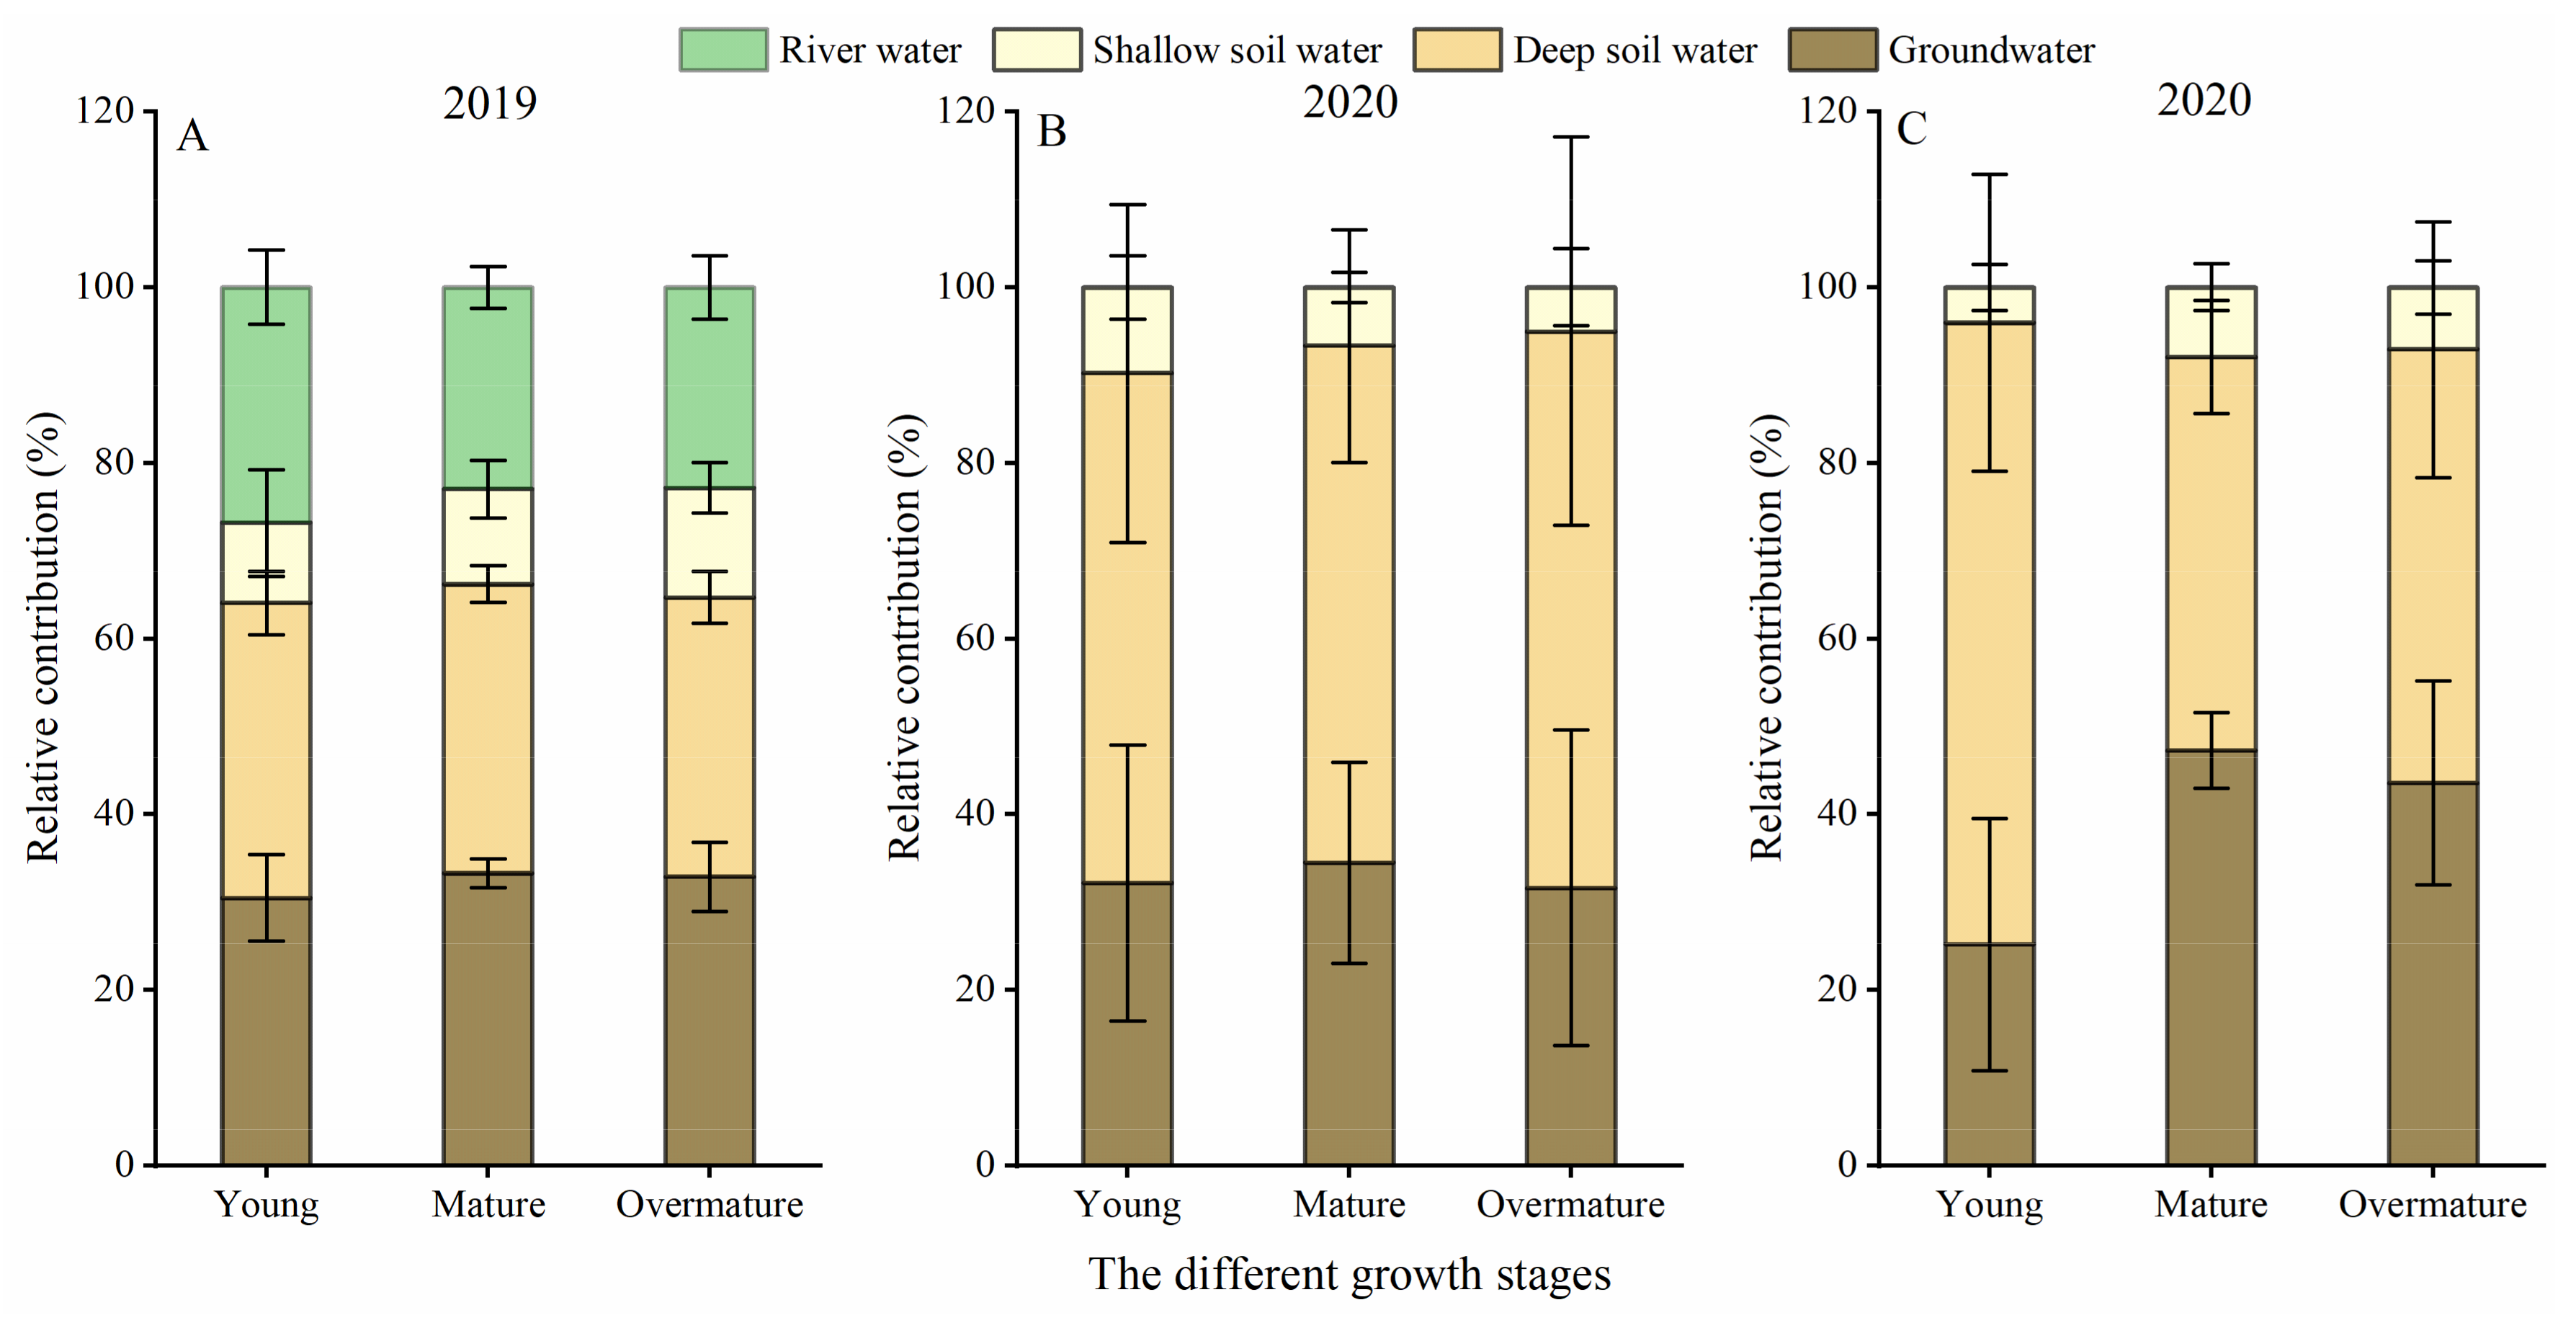
3.3. IsoSource Estimation of Feasible Potential Water Source Contributions

The sources of water uptake by P. euphratica at different growth stages were similar and did not differ significantly (Figure 4A,B). In 2019, the average rates of water uptake of P. euphratica at different growth stages were 24.2% for the river water, 10.8% for the shallow soil water, 32.8% for the deep soil water, and 32.2% for the groundwater. In 2020, the average uptake rates of P. euphratica at the different growth stages were 7.2% for the shallow soil water, 60.1% for the deep soil water, and 32.7% for the groundwater. The rate of uptake of the deep soil water by P. euphratica was evidently higher in 2020 than that in 2019, while the proportions of uptake of the shallow soil water and groundwater were similar during the two-year period.
The sources of water uptake of T. chinensis at different growth stages differed in 2020 (Figure 4C). The main water source of the young shrubs was deep soil water, with an average uptake rate of 70.8%. However, the main water sources for mature and overmature shrubs were deep soil water and groundwater. The average uptake rates of mature and overmature trees from the deep soil water were 44.7% and 49.3%, respectively, and the corresponding values for groundwater were 47.3% and 43.6%, respectively. The lowest proportions of uptake by T. chinensis at different growth stages were of shallow soil water, with a rate of 4% for young trees, 8% for mature trees, and 7.1% for overmature trees.

3.4. Variations in the δ13C Values of Plant Leaves

The leaf δ13C values of P. euphratica increased in parallel with the tree size (Figure 5A). In 2019, the δ13C values of leaves from young, mature, and overmature trees were −29.46‰, −29.11‰, and −29.16‰, respectively. In 2020, the corresponding values were −28.67‰, −28.67‰, and −28.30‰, respectively. The average values of leaf δ13C for P. euphratica were −29.24‰ and −28.55‰ in 2019 and 2020, respectively, and the average value was lower in 2019 than in 2020.
The leaf δ13C values of T. chinensis also increased in parallel with the tree size (Figure 5B). In 2019, the δ13C values of leaves from young, mature, and overmature shrubs were −27.80‰, −27.78‰, and −27.50‰, respectively. In 2020, the δ13C values of young, mature, and overmature shrubs were −27.55‰, −27.38‰, and −27.04‰, respectively. The average values of leaf δ13C for T. chinensis were −27.69‰ and −27.32‰ in 2019 and 2020, respectively, and the values were higher than those of P. euphratica in the same period.

4. Discussion

4.1. Water Uptake Patterns of P. euphratica and T. chinensis at Different Growth Stages

In this study, the water use patterns of P. euphratica at different growth stages were similar during the same period. This is consistent with the research results of Wang et al. on water sources of P. euphratica at different ages in the lower reaches of the Tarim River [36]. However, Liu et al. studied the water use pattern of P. euphratica and found that young trees primarily depended on shallow soil water, while the mature trees primarily depended on deep soil water and groundwater [37]. This difference could be caused by the distribution of plant roots [38,39]. Since the depth of groundwater at the sampling site was between 4 and 4.5 m, the higher amount of water that P. euphratica requires to propagate seedlings through seed germination increases the difficulty of propagating by seed. Therefore, P. euphratica primarily reproduces through asexual root tillers as an alternative to seed reproduction, young trees are connected to the root system of mature trees at some point, and water is primarily acquired from mature trees [40,41]. Therefore, there is no significant difference in the source of water among the growth stages of P. euphratica, which is inconsistent with the first hypothesis regarding the water use characteristics of P. euphratica.
In this study, the main sources of water for P. euphratica in 2019 and 2020 differed significantly. Since there was water in the river in 2019, river water, deep soil water, and groundwater were the main water sources of P. euphratica. However, the lack of river water in 2020 increased the proportion of deep soil water taken up by P. euphratica, while its use of groundwater did not increase significantly. This is not consistent with the second hypothesis. Whether desert riparian forests use river water depends on their proximity to the river and the presence or absence of river water flowing through the river [42]. This study selected P. euphratica trees that were all close to river channels. The river channel section had many exposed fine roots that extended to the bottom of the river. Thus, the P. euphratica roots were able to absorb river water.
The water use pattern of T. chinensis at different growth stages differed. The main water source for the young shrubs was deep soil water. In contrast, the main water sources for mature and overmature shrubs were deep soil water and groundwater. These results are consistent with the first hypothesis regarding the water use characteristics of T. chinensis. Research had shown that the main water source for young T. chinensis was shallow soil water, while the main water source for mature shrubs was deep soil water and groundwater [43]. Compared to the results of this study, there were differences in the main water sources of young T. chinensis. The reason for the difference could be owing to the soil moisture conditions of the environment in which the plants are located. It has been found that when the soil moisture conditions are reduced, young T. chinensis shrubs will elongate their root system to absorb deeper soil water in response to water limitation [31]. Our selected plant sampling site had a relatively deep depth of groundwater and low shallow soil water (Figure 2). Thus, young T. chinensis shrubs absorbed deep soil water by extending their root system to meet the demand for water for growth. The main water sources for mature and overmature T. chinensis shrubs were deep soil water and groundwater, which is consistent with the research by Wang et al. [43].
Since P. euphratica and T. chinensis are typical wind-proof and sand-fixing species in desert areas, they both have physiological and ecological characteristics that are adapted to arid environments. This study found that P. euphratica and T. chinensis use deep soil water and groundwater. This suggests that both species possess deep root systems that enable them to reach available water sources. Deep roots could be considered as insurance against the potential consequences of drought under less favorable conditions [44]. Many plants in water-limited environments utilize deep rooting strategies to avoid the water deficiency that occurs in the upper soil layers and, therefore, survive longer [45,46]. Although the two species in this study possess similar root patterns, they exhibited significant differences in the extraction of water sources in 2020. P. euphratica focused more on the uptake of deep soil water, with an average uptake rate between 58.0% and 63.4%. The uptake by T. chinensis used more groundwater than P. euphratica (except for young trees). This indicates that T. chinensis is more dependent on groundwater than P. euphratica, and decreases in groundwater would have a greater impact on T. chinensis in arid desert areas.

4.2. Plant Leaf δ13C Values of P. euphratica and T. chinensis at Different Growth Stages

The δ13C value of the leaves of both P. euphratica and T. chinensis increased in parallel with the growth stages, which is consistent with the first hypothesis. This indicates that the values of WUE were higher with the growth stages since the δ13C value of plant leaves positively correlates with the WUE [18,47]. This is consistent with the results of many researchers [48,49]. Farquhar et al. found that some meteorological factors can influence the δ13C values of plant leaves by affecting the stomatal conductance (gs) during photosynthesis [21]. However, in this study, the selected sample trees were all located at the same sampling site, and we did not consider the differences in climatic factors such as air temperature and solar radiation. In addition, Browh et al. found that carbon stable isotopes in C3 plant leaves correlated with the ratio of leaf intercellular CO2 to atmospheric CO2 concentration (Ci/Ca) [50,51]. Zheng et al. studied the physiological characteristics of black locust (Robinia pseudoacacia) and found that the ratio of intercellular (Ci) to atmospheric (Ca) CO2 and the carboxylation efficiency differed among stands of different ages, and the WUE of mature stands was significantly higher than that of young stands [49]. Therefore, in this study, the differences in the physiological characteristics of P. euphratica and T. chinensis at different growth stages may cause differences in the WUE.
The plant leaf δ13C values were affected by water conditions, and there was a significant negative correlation between the plant leaf δ13C values and the availability of soil water in arid regions [52,53]. When water conditions are insufficient, on the one hand, plants reduce water dissipation by reducing or closing the leaf stomata, leading to a decrease in stomatal conductance (gs) and transpiration rate. The decrease in the transpiration rate was greater than that of the net photosynthetic rate, thus improving the WUE [54,55]. On the other hand, plants reduce CO2 uptake by reducing or closing the leaf stomata. When the ratio of leaf intercellular Ci concentration to atmospheric Ca concentration (Ci/Ca) is related to CO2 demand and supply, and when the stomatal opening becomes small, the rate of CO2 entering leaf intercellular from atmosphere decreases. Photosynthetic enzymes, which initially preferentially use 12CO2, increase the use of 13CO2, and with the continuation of time, more 13CO2 is carboxylated [50,51], thus increasing the WUE. In this study, there was no river water in 2020, and the groundwater and soil moisture were not replenished in time and were significantly lower than in 2019 (Figure 2). The δ13C values of the P. euphratica and T. chinensis leaves in 2020 were obviously higher than those in 2019, indicating an increase in plant WUE due to the lack of water in the river, which is consistent with the second hypothesis regarding the change of water use efficiency. In addition, Bhusal et al. found a positive correlation between the plant leaf δ13C and the drought tolerance of plant root neck diameter [56]. Our study found that the δ13C values of P. euphratica leaves were lower than those of T. chinensis, which indicates that T. chinensis has a higher WUE. This is consistent with the results of previous research [57]. Simultaneously, it also echoes the water use pattern of the two species.

4.3. Implications for Desert Oasis Management

Limited water resources are important factors that limit vegetation restoration in arid desert areas. The results of this study show that P. euphratica and T. chinensis had different characteristics of water use at varying growth stages, and there were differences in the water use characteristics of P. euphratica under different water conditions. Therefore, the types and growth stages of vegetation should be fully considered when conducting ecological water transfer for vegetation restoration, which can increase the effectiveness of vegetation restoration strategies.

5. Conclusions

The water use patterns of P. euphratica were similar at different growth stages, while T. chinensis showed obvious differences, absorbing deeper water sources as the growth stage increased. When river water was available, P. euphratica absorbed a certain proportion of river water, and in the absence of river water, it absorbed more deep soil water, while T. chinensis tended to absorb more groundwater. It was also found that both vegetation species could improve the WUE to cope with the decreasing water resources, but the WUE of T. chinensis was obviously higher than that of P. euphratica. Therefore, when carrying out ecological water transport, the optimal water resource allocation scheme can be formulated based on the characteristics of vegetation water use in the community.

Author Contributions

Conceptualization, Q.S. and Y.D.; investigation, Y.W., N.M., L.P. (Liping Peng), L.P. (Lei Peng). and H.S.; writing—original draft preparation, Y.W.; writing—review and editing, Y.W. and Y.D. All authors have read and agreed to the published version of the manuscript.

Funding

This work was funded by the National Natural Science Foundation of China (Nos. 32160260, 31800623, and U1703237).

Institutional Review Board Statement

Not applicable.

Informed Consent Statement

Not applicable.

Data Availability Statement

Not available.

Acknowledgments

The author thanks Yanfang Wan from the Research Institute of Forest Ecology, Environment and Protection, Chinese Academy of Forestry for her assistance in writing this article.

Conflicts of Interest

The authors declare no conflict of interest.

References

  1. Lang, P.; Jeschke, M.; Wommelsdorf, T.; Backes, T.; Lv, C.; Zhang, X.; Thomas, F.M. Wood Harvest by Pollarding Exerts Long-Term Effects on Populus Euphratica Stands in Riparian Forests at the Tarim River, NW China. For. Ecol. Manag. 2015, 353, 87–96. [Google Scholar] [CrossRef]
  2. Aishan, T.; Halik, Ü.; Betz, F.; Gärtner, P.; Cyffka, B. Modeling Height–Diameter Relationship for Populus Euphratica in the Tarim Riparian Forest Ecosystem, Northwest China. J. For. Res. 2016, 27, 889–900. [Google Scholar] [CrossRef]
  3. Ehleringer, J.R.; Cooper, T.A. Correlations between Carbon Isotope Ratio and Microhabitat in Desert Plants. Oecologia 1988, 76, 562–566. [Google Scholar] [CrossRef]
  4. Reynolds, J.F.; Virginia, R.A.; Kemp, P.R.; Soyza, A.D.; Tremmel, D.C. Impact of Drought on Desert Shrubs: Effects of Seasonality and Degree of Resource Island Development. Ecol. Monogr. 1999, 69, 69–106. [Google Scholar] [CrossRef]
  5. Si, J.; Feng, Q.; Cao, S. Water Use Sources of Desert Riparian Populus Euphratica Forests. Environ. Monit. Assess. 2014, 186, 5469–5477. [Google Scholar] [CrossRef]
  6. Grossiord, C.; Sevanto, S.; Dawson, T.E.; Adams, H.D.; Collins, A.D.; Dickman, L.T.; Newman, B.D.; Stockton, E.A.; McDowell, N.G. Warming Combined with More Extreme Precipitation Regimes Modifies the Water Sources Used by Trees. New Phytol. 2017, 213, 584–596. [Google Scholar] [CrossRef]
  7. Harrison, J.L.; Blagden, M.; Green, M.B.; Salvucci, G.D.; Templer, P.H. Water Sources for Red Maple Trees in a Northern HardWood Forest under a Changing Climate. Ecohydrology 2020, 13, e2248. [Google Scholar] [CrossRef]
  8. Wang, J.; Fu, B.; Jiao, L.; Lu, N.; Wang, L. Age-Related Water Use Characteristics of Robinia Pseudoacacia on the Loess Plateau. Agric. For. Meteorol. 2021, 5, 301–302. [Google Scholar] [CrossRef]
  9. Dawson, T.E.; Ehleringer, J.R. Streamside Trees that Do Not use Stream Water. Nature 1991, 350, 335–337. [Google Scholar] [CrossRef]
  10. Lin, G.; Sternberg, S.; Ehleringer, J.R.; Hall, A.E.; Farquhar, G.D. Hydrogen Isotopic Fractionation by Plant Roots during Water Uptake in Coastal Wetland Plants. In Stable Isotopes and Plant Carbon-Water Relations; Academic Press: Cambridge, MA, USA, 1993; pp. 497–510. [Google Scholar] [CrossRef]
  11. Ellsworth, P.Z.; Williams, D.G. Hydrogen Isotope Fractionation during Water Uptake by Woody Xerophytes. Plant Soil 2007, 291, 93–107. [Google Scholar] [CrossRef]
  12. Zhao, L.; Wang, X.; Zhang, Y.; Meng, F. Plant Water Use Strategies in the Shapotou Artificial Sand-Fixed Vegetation of the Southeastern Margin of the Tengger Desert, Northwestern China. J. Mt. Sci. 2019, 16, 898–908. [Google Scholar] [CrossRef]
  13. Wu, J.; Liu, W.; Chen, C. How Do Plants Share Water Sources in a Rubber-Tea Agroforestry System during the Pronounced Dry Season? Agric. Ecosyst. Environ. 2017, 236, 69–77. [Google Scholar] [CrossRef]
  14. Dai, Y.; Zheng, X.; Tang, L.; Li, Y. Stable Oxygen Isotopes Reveal Distinct Water Use Patterns of Two Haloxylon Species in the Gurbantonggut Desert. Plant Soil 2015, 389, 73–87. [Google Scholar] [CrossRef]
  15. Gow, L.J.; Barrett, D.J.; O’grady, A.P.; Renzullo, L.J.; Phinn, S.R. Subsurface Water-Use Strategies and Physiological Responses of Subtropical Eucalypt Woodland Vegetation under Changing Water-Availability Conditions. Agric. For. Meteorol. 2018, 248, 348–360. [Google Scholar] [CrossRef]
  16. Song, L.; Zhu, J.; Li, M.; Zhang, J. Water Use Patterns of Pinus Sylvestris Var. Mongolica Trees of Different Ages in a Semiarid Sandy Lands of Northeast China. Environ. Exp. Bot. 2016, 129, 94–107. [Google Scholar] [CrossRef]
  17. Volkmann, T.H.; Haberer, K.; Gessler, A.; Weiler, M. High-Resolution Isotope Measurements Resolve Rapid Ecohydrological Dynamics at the Soil-Plant Interface. New Phytol. 2016, 210, 839–849. [Google Scholar] [CrossRef] [Green Version]
  18. Cao, S.; Feng, Q.; Si, J.; Chang, Z.; Zhuo, M.; Xi, H.; Su, Y. Summary on the Plant Water Use Efficiency at Leaf Level. Acta Ecol. Sin. 2009, 29, 3882–3892. [Google Scholar] [CrossRef]
  19. Luo, Y.; Zhao, X.; Huang, Y.; Su, N.; Feng, J. Research Progress on Plant Water Use Efficiency and its Determination Methods. J. Desert Res. 2009, 29, 648–655. [Google Scholar]
  20. Martin, B.; Thorstenson, Y.R. Stable Carbon Isotope Composition (13C), Water Use Efficiency, and Biomass Productivity of Lycopersicon Esculentum, Lycopersicon Pennellii, and the F1 Hybrid. Plant Physiol. 1988, 88, 213–217. [Google Scholar] [CrossRef] [Green Version]
  21. Farquhar, G.D.; Hubick, K.T.; Condon, A.G.; Richard, R.A. Carbon Isotope Fractionation and Plant Water-Use Efficiency; Springer: New York, NY, USA, 1989; pp. 21–40. [Google Scholar]
  22. Bhusal, N.; Lee, M.; Han, A.R.; Han, A.; Kim, H.S. Responses to Drought Stress in Prunus Sargentii and Larix Kaempferi Seedlings Using Morphological and Physiological Parameters. For. Ecol. Manag. 2020, 465, 118099. [Google Scholar] [CrossRef]
  23. Stokes, V.J.; Morecroft, M.D.; Morison, J. Comparison of Leaf Water Use Efficiency of Oak and Sycamore in the Cnopy over Two Growing Seasons. Trees 2010, 24, 297–306. [Google Scholar] [CrossRef] [Green Version]
  24. Baruch, Z. Leaf Trait Variation of a Dominant Neotropical Savanna Tree across Rainfall and Fertility Gradients. Oecologica 2011, 37, 455–461. [Google Scholar] [CrossRef]
  25. Robinson, D.; Handley, L.L.; Scrimgeour, M.C.; Gordon, C.D.; Forster, P.B. Using Stable Isotope Natural Abundances (δ15N and δ13C) to Integrate the Stress Responses of Wild Barley (Hordeum Spontaneum C. Koch.) Genotypes. J. Exp. Bot. 2000, 51, 41–50. [Google Scholar] [CrossRef] [PubMed] [Green Version]
  26. Igamberdiev, A.U.; Mikkelsen, T.N.; Mbus, P.; Bauwe, H.; Lea, P.J.; Gardestrm, P. Photorespiration Contributes to Stomatal Regulation and Carbon Isotope Fractionation: A Study with Barley, Potato and Arabidopsis Plants Deficient in Glycine DecarBoxylase. Photosynth. Res. 2004, 81, 139–152. [Google Scholar] [CrossRef]
  27. Li, H.; Shi, Q.; Wan, Y.; Shi, H.; Imin, B. Using Sentinel-2 Images to Map the Populus Euphratica Distribution Based on the Spectral Difference Acquired at the Key Phenological Stage. Forests 2021, 12, 147. [Google Scholar] [CrossRef]
  28. Shi, H.; Shi, Q.; Zhou, X.; Imin, B.; Li, H.; Zhang, W.; Kahaer, Y. Effect of the Competition Mechanism of between Co-Dominant Species on the Ecological Characteristics of Populus Euphratica under a Water Gradient in a Desert Oasis. Glob. Ecol. Conserv. 2021, 27, e01611. [Google Scholar] [CrossRef]
  29. Thomas, F.M.; Bruelheide, H.; Foetzki, A.; Gries, D.; Runge, M. Ecological Basis for a Sustainable Management of the Indigenous Vegetation in a Central-Asian Desert: Presentation and First Results. J. Appl. Bot. 2000, 74, 212–219. [Google Scholar]
  30. Li, T.; Luo, G.; Dong, K.; Peng, L.; Dai, Y. Water Usage of Populus Euphratica in Different Development Stages Grown near the Riverbank at the Tail of the Keriya River. Chin. J. Ecol. 2021, 40, 989–997. [Google Scholar] [CrossRef]
  31. Marhaba, N.; Bilal, E.; Shi, Q.; Yue, D.; Shi, H. Water Sources of Tamarix sp. Seedlings at the Daryaboyi Oasis in the Hinterland of Desert. J. Arid. Land Resour. Environ. 2021, 35, 159–166. [Google Scholar] [CrossRef]
  32. Cyffka, B.; Wang, J.; Halik, U.; Osman, K.; Peng, S. Study on DBH-Structure of Populus Euphratica and their Spatial Distribution in the Lower Reaches of the Tarim River. Chin. Bull. Bot. 2008, 25, 728–733. [Google Scholar]
  33. Li, C.; Guo, J.; Zeng, F.; Guo, Z. Shoot and Root Architectural Variance and Adaptability of in Different Ages. J. Desert Res. 2015, 35, 365–372. [Google Scholar] [CrossRef]
  34. Schultz, N.M.; Griffis, T.J.; Lee, X.H.; Baker, J.M. Identification and Correction of Spectral Contamination in H2/H1 and O18/O16 Measured in Leaf, Stem, and Soil Water. Rapid Commun. Mass Spectrom. 2011, 25, 3360–3368. [Google Scholar] [CrossRef] [PubMed]
  35. Phillips, D.L.; Gregg, J.W. Source Partitioning Using Stable Isotopes: Coping with too Many Sources. Oecologia 2003, 136, 261–269. [Google Scholar] [CrossRef] [PubMed]
  36. Wang, Y.; Chen, Y.; Li, W.; Wang, R.; Zhou, Y.; Zhang, J. Water Sources of Typical Desert Riparian Plants in the Lower Reaches of Tarim River. J. Desert Res. 2017, 37, 1150–1157. [Google Scholar] [CrossRef]
  37. Liu, S.; Chen, Y.; Chen, Y.; Friedman, J.M.; Hati, J.H.A.; Fang, G. Use of H2 and O18 Stable Isotopes to Investigate Water Sources for Different Ages of Populus Euphratica along the lower Heihe River. Ecol. Res. 2015, 30, 581–587. [Google Scholar] [CrossRef]
  38. Ma, Z.; Chen, X.; Wang, Q.; Li, P.; Jiapaer, G. Retrieval of Leaf Biochemical Properties by Inversed Prospect Model and HyperSpectral Indices: An Application to Populus Euphratica Polymorphic Leaves. J. Arid Land 2012, 4, 52. [Google Scholar] [CrossRef] [Green Version]
  39. Overdieck, D.; Ziche, D.; Yu, R.D. Gas Exchange of Populus Euphratica Leaves in a Riparian Zone. J. Arid Land 2013, 5, 1–11. [Google Scholar] [CrossRef] [Green Version]
  40. Cao, D.; Li, J.; Huang, Z.; Baskin, C.C.; Baskin, J.M.; Hao, P. Reproductive Characteristics of a Populus Euphratica Population and Prospects for its Restoration in China. PLoS ONE 2012, 7, e39121. [Google Scholar] [CrossRef] [Green Version]
  41. Wu, F.; Li, J.; Li, J.; Cheng, C.; Wang, X. The Characteristics of Root Suckers of Populus Euphratica Oliv. in Three Habitats of Ejina Oasis. Acta Ecol. Sin. 2008, 28, 4703–4709. [Google Scholar] [CrossRef]
  42. Tsheboeng, G.; Murray-Hudson, M.; Kashe, K. Response of Riparian Plant Communities to Distance from Surface Water in the Okavango Delta, Botswana. Afr. J. Ecol. 2017, 55, 402–410. [Google Scholar] [CrossRef]
  43. Wang, R.; Zhao, C.; Wang, D.; Fu, S.; Zhou, T. Water Use Strategies of Populus Euphratica and Tamarix Ramosissima at Different Ages in Tarim River Basin. J. Soil Water Conserv. 2017, 31, 157–163. [Google Scholar] [CrossRef]
  44. Pierret, A.; Maeght, J.L.; Clément, C.; Montoroi, J.P.; Hartmann, C.; Gonkhamdee, S. Understanding Deep Roots and their Functions in Ecosystems: An Advocacy for more Unconventional Research. Ann. Bot. 2016, 118, 621–635. [Google Scholar] [CrossRef] [PubMed] [Green Version]
  45. Wu, Y.; Zhou, H.; Zheng, X.; Li, Y.; Tang, L. Seasonal Changes in the Water Use Strategies of Three Co-Occurring Desert Shrubs. Hydrol. Process. 2014, 28, 6265–6275. [Google Scholar] [CrossRef]
  46. Nardini, A.; Casolo, V.; Dal, B.A.; Savi, T.; Stenni, B.; Bertoncin, P.; Zini, L. Rooting Depth, Water Relations and Non-Structural Carbohydrate Dynamics in Three Woody Angiosperms Differentially Affected by an Extreme Summer Drought. Plant Cell Environ. 2016, 39, 618–627. [Google Scholar] [CrossRef]
  47. Farquhar, G.; Richards, R. Isotopic Composition of Plant Carbon Correlates with Water-Use Efficiency of Wheat Genotypes. Aust. J. Plant Physiol. 1984, 11, 539–552. [Google Scholar] [CrossRef]
  48. Ma, W.; Wu, S. Responses of Net Photosynthetic Rate of Populus Euphratica at Different Ages Toecological and Physiological Factors. J. Yunnan Univ. 2020, 42, 1004–1013. [Google Scholar]
  49. Zheng, Y.; Zhao, Z.; Zhou, J.; Zhou, H.; Liang, Z.; Luo, Z. The Importance of Slope Aspect and Stand Age on the Photosynthetic Carbon Fixation Capacity of Forest: A Case Study with Black Locust (Robinia Pseudoacacia) Plantations on the Loess Plateau. Acta Physiol. Plant 2011, 33, 419–429. [Google Scholar] [CrossRef]
  50. Brown, R.H.; Byrd, G.T. Relationships between Specific Leaf Weight and Mineral Concentration among Genotypes. Field Crop. Res. 1997, 54, 19–28. [Google Scholar] [CrossRef]
  51. Reich, P.B.; Wright, I.J.; Bares, J.C.; Craine, J.M.; Oieksyn, J.; Walter, M.B.; Reich, P.B.; Westoby, M. The Evolution of Plant Functional Variation: Traits, Spectra, and Strategies. Int. J. Plant Sci. 2003, 164, S143–S164. [Google Scholar] [CrossRef]
  52. Carl, C.; Biber, P.; Veste, M.; Landgraf, D.; Pretzsch, H. Key Drivers of Competition and Growth Partitioning among Robinia Pseudoacacia L. Trees. For. Ecol. Manag. 2018, 430, 86–93. [Google Scholar] [CrossRef]
  53. Ale, R.; Zhang, L.; Li, X.; Raskoti, B.B.; Pugnaire, F.I.; Luo, T. Leaf δ13C as an Indicator of Water Availability along Elevation Gradients in the Dry Himalayas. Ecol. Indic. 2018, 94, 266–273. [Google Scholar] [CrossRef]
  54. Liu, M.; Shi, J.; Wang, X.; Aijier, A. Photosynthetic and Transpiration Characteristics of Natural Populus Euphratica Forests in Different Habitats in the Middle Reaches of Tahe River. J. Northwest For. Coll. 2021, 36, 9–15. [Google Scholar] [CrossRef]
  55. Deng, W.; Li, X.; Zhang, X.; Ye, W.; Andrea, F.; Michael, R. The Studies about the Photosynthetic Response of the Four Desert Plants. Acta Ecol. Sin. 2003, 23, 598–605. [Google Scholar] [CrossRef]
  56. Bhusal, N.; Lee, M.; Lee, H.; Adhikari, A.; Kim, H.S. Evaluation of Morphological, Physiological, and Biochemical Traits for Assessing Drought Resistance in Eleven Tree Species. Sci. Total Environ. 2021, 779, 146466. [Google Scholar] [CrossRef] [PubMed]
  57. Cao, S.; Feng, Q.; Su, Y.; Chang, Z.; Xi, H. Research on the Water Use Efficiency and Foliar Nutrient Status of Populus Euphratica and Tamarix Ramosissima in the Extreme Arid Region of China. Environ. Earth Sci. 2011, 62, 1597–1607. [Google Scholar] [CrossRef]
Figure 1. Location of the study sites.
Forests 13 00236 g001
Figure 2. Variations in the vertical profiles of soil water content (A) and δ18O values (B) at the 0–300 cm soil layers in 2019 and 2020 (mean ± SD, n = 3).
Forests 13 00236 g002
Figure 3. The δ18O values of xylem water for Populus euphratica Oliv. (A,B) and Tamarix chinensis Lour. (C) in 2019 and 2020. The different lowercase letters indicate significant differences at the different growth stages for a given species (p < 0.05), n = 5.
Forests 13 00236 g003
Figure 4. Variation in the percentage contribution of potential water sources for P. euphratica (A,B) and T. chinensis (C) at different growth stages in 2019 and 2020.
Forests 13 00236 g004
Figure 5. Variation in leaf δ13C values of P. euphratica (A) and T. chinensis (B) at different growth stages in 2019 and 2020.
Forests 13 00236 g005
Table 1. Basic characteristics of sample trees in August 2019 (mean value ± standard deviation, n = 5).
SpeciesGrowth StagesAverage Tree Height (m)Average Diameter at Breast Height (cm)Average Canopy Width (m)
Populus euphratica Oliv.Young trees3.84 ± 1.408.75 ± 1.832.52 ± 0.35
Mature trees8.64 ± 0.8932.41 ± 3.665.78 ± 1.47
Overmature trees9.62 ± 1.2658.76 ± 12.359.57 ± 3.52
Tamarix chinensis Lour.Young shrubs0.79 ± 0.250.56 ± 0.28
Mature shrubs2.01 ± 0.402.99 ± 2.12
Overmature shrubs2.85 ± 0.415.80 ± 3.15
Table 2. Characteristics of the variations of δ18O in potential water sources during the study period (mean value ± standard deviation).
δ18O20192020
River water −7.43 ± 0.65‰
Shallow soil water (0–140 cm)−1.29 ± 3.22‰−2.39 ± 4.65‰
Deep soil water (140–300 cm)−5.92 ± 0.50‰−7.06 ± 0.86‰
Groundwater −5.72 ± 0.07‰−6.26 ± 0.18‰
Publisher’s Note: MDPI stays neutral with regard to jurisdictional claims in published maps and institutional affiliations.

