Article

Tree-to-Shrub Shift Benefits the Survival of Quercus mongolica Fisch. ex Ledeb. at the Xeric Timberline

1
MOE Laboratory for Earth Surface Processes, College of Urban and Environmental Sciences, Peking University, Beijing 100871, China
2
Institute of Microbiology, Chinese Academy of Sciences, Beijing 100871, China
*
Author to whom correspondence should be addressed.
Forests 2022, 13(2), 244; https://doi.org/10.3390/f13020244
Submission received: 24 November 2021 / Revised: 23 January 2022 / Accepted: 1 February 2022 / Published: 5 February 2022

Abstract

:
Woody species are either trees or shrubs, with the exception of approximately 9.2% “trub” species exhibiting both tree and shrub growth forms. Little is known thus far about the ecological importance of plant growth-form plasticity under a drying climate. Quercus mongolica Fisch. ex Ledeb., a dominant tree species of temperate forests in East Asia, typically shows tree-to-shrub growth-form shifts at the xeric timberline and is suitable to test whether growth-form plasticity can physiologically benefit plant drought acclimation. We quantified the tree architecture, drought stress, physiological drought tolerance, and nonstructural carbohydrates of Q. mongolica trees and shrubs on the opposite slope of the same mountain at the xeric timberline in July 2018. Compared with Q. mongolica trees on shady slopes, the shrubs on sunny slopes had less available water to use and were more severely threatened by drought. Moreover, the shrubs had stronger tolerance to drought but still tended to have less nonstructural carbohydrate accumulation. The tree-to-shrub shift effectively benefits the survival of Q. mongolica under a dry climate and may strongly contribute to forest dynamics and even fire regimes under climate drying, especially for sensitive ecosystems such as the xeric timberline, which will be vulnerable under future climate change scenarios.

1. Introduction

Woody plants commonly grow in either a tree form with a tall and single stem or a shrub form with multiple short basal resprouts. However, it was reported that approximately 9.2% of woody species have both forms, as recorded in the global plant trait database [1]. Multiple potential growth forms should allow woody plants to have better environmental acclimation and survive in more diverse environments than those with weak morphological plasticity [2]. However, there have only been limited studies revealing how growth-form plasticity helps plants acclimate to harsh environments, such as the shrubby form that helps Acacia karroo Hayne in arid areas to prevent access to large herbivores [3] and that helps trees at the upper timberline tolerate extremely cold and windy altitudinal environments [4]. In regions with frequent fire disturbance, shrubby-form Quercus spp. with rapid resprouting can be an adaptation strategy [5], as well as a potential combustion booster [6]. Whether tree-to-shrub growth form transformation benefits drought acclimation of woody plants remains an open question, which needs to be addressed through combining studies from tree physiological, architectural, and environmental aspects [7,8].
Shrubs have been reported to live in generally drier environments, showing stronger drought-threatened performance and stronger physiological drought tolerance than tree species in interspecific comparisons [9,10]. However, interspecific comparisons cannot distinguish whether the performance differences were the result of physiological acclimation or phylogenetic differences. Extracting the intraspecies comparison can directly answer whether the tree-to-shrub shift is a plant drought acclimation strategy physiologically benefiting species survival under the climate-drying trend.
Previous work reported a clear tree-to-shrub shift of Quercus mongolica Fisch. ex Ledeb. at the xeric timberline [11], where the forests were threatened by long-term water limitation [12,13]. Surprisingly, in some places, we found that mature Q. mongolica trees and shrubs coexisted in a very small region. Q. mongolica trees are often distributed on shady slopes of mountains [14], while Q. mongolica shrubs usually form pure shrublands on sunny slopes (Figure 1, Figure A1). Given the consistency between the growth form shifts and the water balance differences between the shady and sunny slopes at the xeric timberline [8], it is reasonable to believe that the shrub growth form benefits the survival of Q. mongolica on sunny slopes so that they can live in more arid niches. Thus, the local Q. mongolica tree-to-shrub shift is a suitable case to test the hypothesis that growth-form plasticity can physiologically improve plant drought acclimation.

2. Materials and Methods

2.1. Sampling Design

The study area is located in the Saihan Wula National Nature Reserve, a nature reserve at the xeric timberline in Inner Mongolia, China (44°12′ N, 118°44′ E). Logging, grazing, and fire disturbances have been strictly prevented in the reserve since 1997. Available water differences are large between the sunny and shady slopes in this region because the evaporation on sunny slopes can be several times higher than that on shady slopes with the same precipitation amount [8].
Two 25 m × 25 m plots, the ‘shrub’ plot on the sunny slope and the ‘tree’ plot on the shady slope, were set in the mature Q. mongolica forests in the reserve (Figure 1, Table 1). The ‘shrub’ plot was in a pure Q. mongolica forest without any other woody plants, while in the ‘tree’ plot, Q. mongolica occupied over 70% of the total woody plant coverage, and Populus davidiana Dode and Betula platyphylla Sukaczev also existed in the forest. Tree architecture measurements, hydraulic trait measurements, and leaf and fine root sampling were executed for five trees per plot in July 2018 (see supplementary data). Soil bulk density and field capacity were measured using the ring knife method for each plot in July 2019. No obvious evidence of fire, grazing, logging, severe insect attack, or any other disturbances was found within or around the two plots.

2.2. Soil Available Water Calculation and Physical Property Measurement

We calculated the potential evaporation (from the open water surface) of sampled plots according to the solar radiation amounts with formulas recorded in [8] and the ARCMAP 10.2.2 (ESRI, Redlands, CA, USA) command HILLSHADE. Furthermore, we estimated the potential available water of the plots as the difference between precipitation and potential evaporation. The obtained soil available water was only a coarse estimation for the water supply to vegetation. However, it could perfectly reveal the differences in local water balance between the two plots due to slope and aspect variances between them. Considering that the slope of the sampled plots was similar (Table 1), the impacts of slope runoff and soil flow on the available water amount were neglected during comparison. The mean annual precipitation of the study area was obtained from the WorldClim database (https://www.worldclim.org, accessed on 24 November 2021), while the 30 m digital elevation model of the study area was obtained from the ASTER GDEM (https://yceo.yale.edu/aster-gdem-global-elevation-data, accessed on 24 November 2021).
Soil samples were collected using the ring knife method in July 2019. In each plot, we dug a 1 m × 1 m soil profile to ensure that it reached the bedrock below the soil layer. We collected three undisturbed soil samples with ring knifes in the profile at 5 cm, 15 cm, and 25 cm depths. Soil bulk density and field capacity were measured in the laboratory. The soil bulk density and field capacity of the plots were determined as the mean value of the nine samples in each plot.

2.3. Tree Age and Chromosome Ploidy Measurements

Tree age was measured for all sampled trees in July 2018 to ensure that the forests and the sampled trees were mature (over 40 years) [16] and of the same age. Two orthogonal cores were collected from each tree reaching the pith of the tree; the core with more tree rings was regarded as the age of the tree.
To eliminate the possibility that there are intrinsic chromosome ploidy differences between tree-shaped and shrubby-shaped Q. mongolica, we tested their chromosome ploidy. Plant DNA extraction was executed with a plant DNA extraction kit (Beijing Feimo Biological Technology Co., Ltd., Beijing, China) following the manufacturer’s instructions. The extracted plant DNA was used as the template for TaqMan fluorescence quantitative polymerase chain reaction (PCR) [17]. The endogenous genes on different chromosomes of Q. mongolica, NDH8 and RPL23, were used for DNA amplification, while qPCR ndh8-F/R and qPCR rpl23-F/R were used as the primers during PCA (Table A1). Quantitative standard curves were drawn to detect the copy number (Table A2) [17]. Finally, the ploidy differences between the samples were quantified as the obtained random gene copy number after fluorescence quantitative PCR.

2.4. Tree Architecture Measurement

Tree height, basal resprout number, and leaf area were measured for the sampled trees. Tree height was measured accurately with a tower ruler. Basal resprout number was counted at a height of 0.5 m. Mature and complete leaves were collected randomly from the sampled trees and scanned within 8 hours after sampling, and the leaf area was measured using MATLAB 9.10.0.1602886 (R2021a) (MathWorks, Natick, MA, USA). For each sampled tree, we measured the average leaf area of five leaves. After scanning, the leaf samples were dried at 65 °C for 48 h, ground into powder, and used for further carbon isotope and nonstructural carbohydrate measurements.

2.5. Hydraulic Architecture Measurement

Midday leaf water potential (Ψmid), percent loss of stem hydraulic conductivity (PLC), and leaf turgor loss point (Ψtlp) were measured for all sampled trees. Ψmid was measured at midday to quantify the minimum water potential and thus the strongest water stress that the individual tree reached under natural conditions [18]. PLC reflected the damage drought caused to the plant hydraulic architecture [19], while Ψtlp was the leaf water potential at which the leaf wilted and became physiologically dysfunctional, representing the ability of leaves to tolerate drought [20,21]. Ψmid was measured using an HR 33T dew point microvoltmeter (Wescor Inc. An Elitech Company, Puteaux, France). Ψtlp was measured using a vapor pressure osmometer (Wescor Inc. An Elitech Company, Puteaux, France) [22]. Actual (Kh) and maximum hydraulic conductivity (Kmax) were measured as the flushing rate of ultrafiltered water passing through the stem segments under pressure differences of approximately 0.05 MPa, in which Kmax was measured after the stem was flushed with 20 mM KCl solution at 0.1 MPa for 30 min [23,24]. Then, PLC was calculated with the following formula:
PLC = [(Kmax − Kh)]/Kmax

2.6. Leaf Carbon Isotope Measurement

Leaf δ13C indicated leaf water use efficiency [25]. A lower value of δ13C indicated a stronger limitation of stomatal conduction to the intensity of photosynthesis, caused by reduced water potential [26]. The formula of δ13C isotope was:
δ13C = − {R(13C/12C)samples − R(13C/12C)standard}/R(13C/12C)standard
where R(13C/12C)samples was the ratio of 13C/12C of samples, while R(13C/12C)standard represented the ratio of international standard material Pee Dee Belemnite (PDB).

2.7. Nonstructural Carbohydrate Measurement

Leaf and fine root nonstructural carbohydrates were measured with the ground leaf and fine root samples of each tree. The extraction process was executed following the anthrone-sulfuric acid method [27,28], while the measurement was conducted with colorimetric methods [29]. Nonstructural carbohydrates in this study were defined as free, low-molecular-weight sugars (fructose, glucose, and sucrose) and starch [29]. Total nonstructural carbohydrates (TNC) were calculated as the sum of the soluble sugars and starches.

2.8. Statistical Analysis

Due to the small sample size, part of the measurement data did not obey a normal distribution; therefore, we used a nonparametric method, the Wilcoxon rank-sum test, to quantify the physiological differences between the two growth forms. All statistical analyses and figure graphing were performed in R version 4.1.0 (R Development Core Team).

3. Results

3.1. Chromosomeploidy of Q. mongolica Trees and Shrubs

There was no significant difference between the relative fluorescence expression of Q. mongolica trees and shrubs, indicating that the chromosome ploidy of Q. mongolica trees on shady slopes and shrubs on sunny slopes were the same.

3.2. Architecture of Q. mongolica Trees and Shrubs

The Q. mongolica trees and shrubs had large differences in their architecture, even though their ages were similar (approximately 60 years) (Table 1). First, the basal resprout number of Q. mongolica trees on shady slopes was significantly lower than that of shrubs on sunny slopes (p = 0.01, Figure 2a), in which the median resprout number of the Q. mongolica tree plot was 1.0, while that of the shrub plot was as high as 10.0. Furthermore, the Q. mongolica trees were significantly taller than the shrubs (6.20 m vs. 4.30 m; p = 0.01, Figure 2b). Moreover, the leaves of the Q. mongolica trees tended to be much larger than those of the shrubs (p = 0.01, Figure 2c), with a median 13.65 cm2 leaf area for the trees and a 6.85 cm2 leaf area for the shrub leaves.

3.3. Soil Available Water of Q. mongolica Trees and Shrubs

The soil available water of the Q. mongolica tree plot was much more than that of the shrub plot, while water available for the shrub individuals on the sunny slope was extremely limited according to the water balance calculation. The astronomical solar radiation in the study area was 314.33 W/m2, and the direct solar radiation in this region was approximately 115.64 W/m2. After correction and calculation, the potential evaporation for the tree plot on the shady slope was 173 mm, while the evaporation for the shrub plot on the sunny slope was 429 mm. Considering that the mean annual precipitation in the study area was 426 mm for 1970–2000, the soil available water for the Q. mongolica tree plot was approximately 253 mm per year, while the soil available water for the shrub plot was approximately zero.
The soil thickness of the Q. mongolica shrub plot was only 0.24 m on average, which was much thinner than that of the tree plot (0.49 m on average) (Table 1). In addition, the soil bulk density of the Q. mongolica shrub plot was significantly higher than that of the tree plot (p < 0.001). Correspondingly, the field capacity of the shrub plot was significantly lower than that of the tree plot (p = 0.001). In general, the soil water-holding capacity of the shrub plot was much weaker than that of the tree plot, which further limited the water amount available for growth of Q. mongolica.

3.4. Quantification of Drought Stress in Q. mongolica Trees and Shrubs

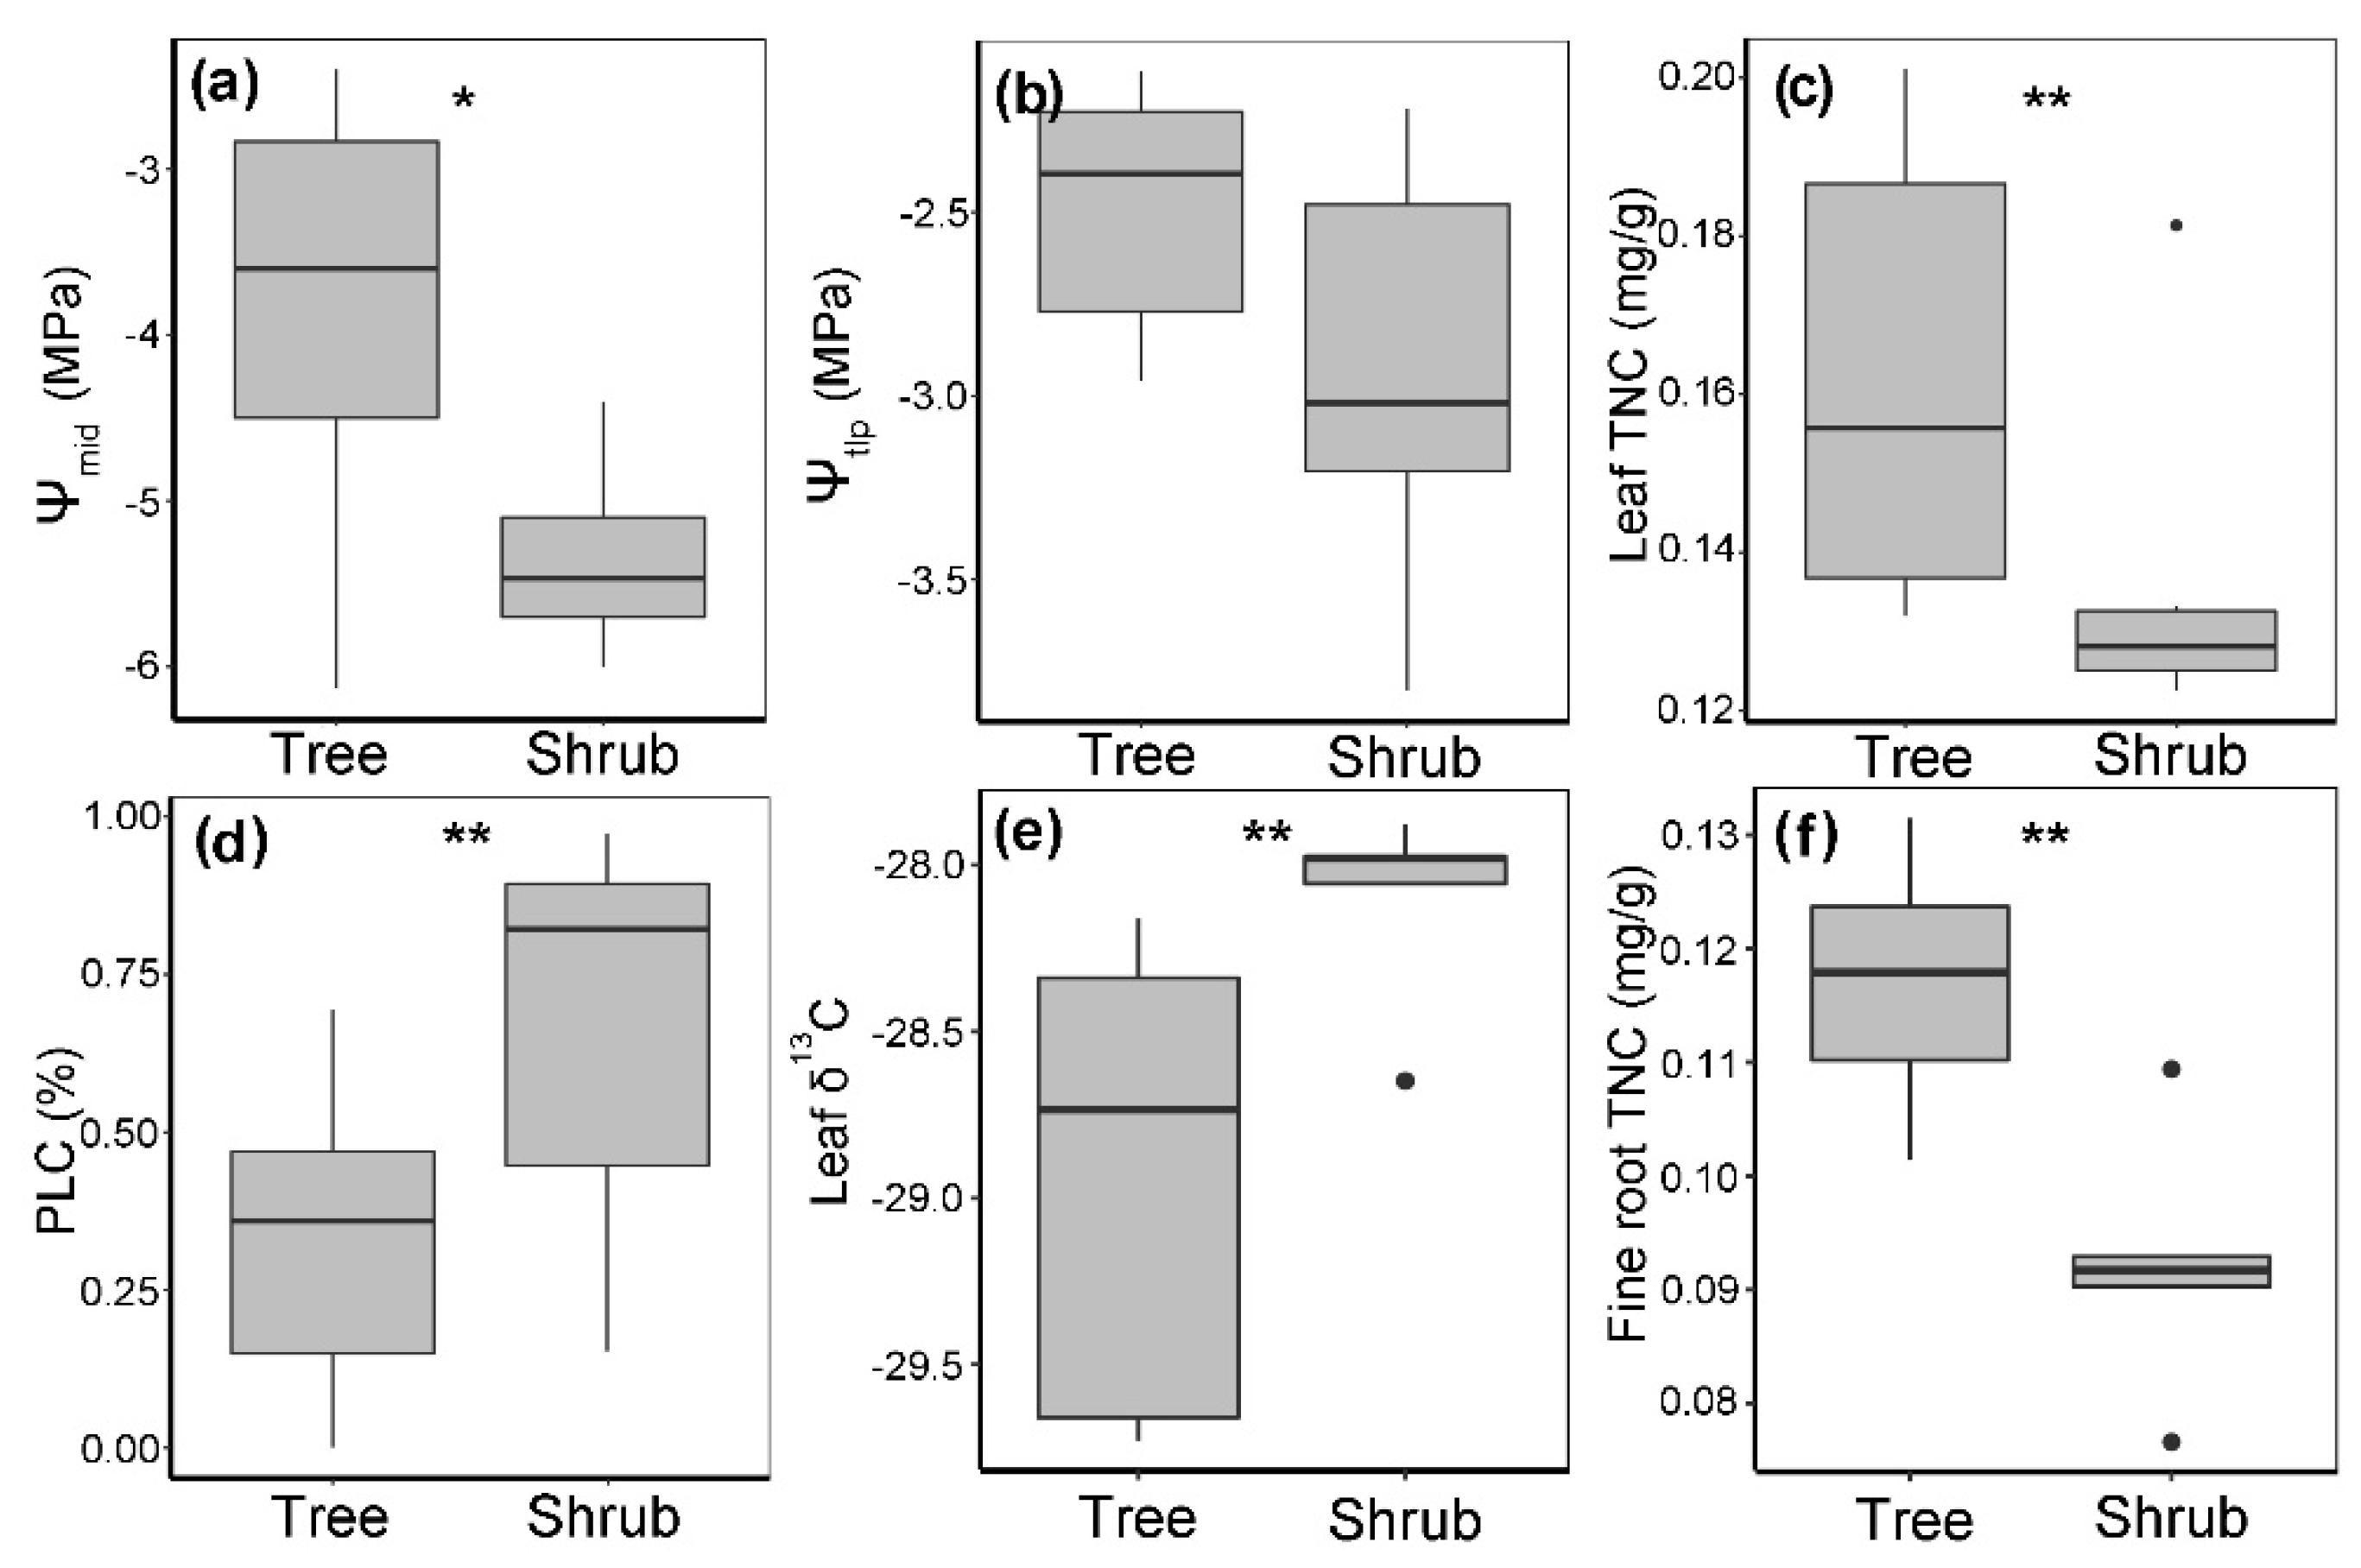
Quercus mongolica shrubs on sunny slopes experienced more severe water deficit, and their hydraulic conductance system was more heavily damaged than the trees on shady slopes, with significantly lower Ψmid (p = 0.06, Figure 3a) and higher PLC (p = 0.02, Figure 3d). The median Ψmid of leaves from tree individuals on the shady slope was −3.60 MPa, while Ψmid of leaves from shrub individuals on the sunny slope was −5.45 MPa. Quercus mongolica shrubs experienced 80% stem hydraulic conductivity loss (median PLC = 0.82), while the situation for the tree plot was much better, with a PLC = 0.36.

3.5. Drought Tolerance of Q. mongolica Trees and Shrubs

Responding to less available water and stronger drought stress, Q. mongolica shrubs on sunny slopes tended to have more powerful drought tolerance than trees on shady slopes. The median leaf Ψtlp of the shrub individuals,−3.02 MPa, was lower than that of the tree individuals,−2.39 MPa, although the difference was not significant (p = 0.16, Figure 3b), indicating that the leaves of the shrub individuals tended to keep their physiological function working with a more negative water potential. The median leaf δ13C of shrub individuals was higher than that of Q. mongolica trees (−27.98 vs.−28.73; p = 0.03, Figure 3e), indicating that shrub individuals had a higher water use efficiency than tree individuals.

3.6. Nonstructural Carbohydrates of Q. mongolica Trees and Shrubs

Quercus mongolica shrubs on sunny slopes had significantly lower leaf TNC (p = 0.04, Figure 3c) and fine root TNC (p = 0.02, Figure 3f) than trees on shady slopes, indicating that a strong water deficit on sunny slopes reduced the nonstructural carbohydrate accumulation of Q. mongolica shrubs. The median leaf TNC of the tree plot was 0.16 mg/g, while that of the shrub plot was 0.13 mg/g. Similarly, the average fine root TNC of the tree plot was 0.12 mg/g, while that of the shrub plot was only 0.09 mg/g.

4. Discussion and Concluding Remarks

4.1. The Tree-to-Shrub Shift Physiologically Improves Plant Drought Tolerance

Compared with the tree growth form, the shrub form enables Q. mongolica on sunny slopes to have stronger physiological tolerance to more intense drought stress at the xeric timberline. For Q. mongolica shrubs, short heights can reduce the water potential differences between roots and leaves [26,30], thus reducing the hydraulic failure risks to the stem [31]. Multiple basal resprouts can benefit plants with the redundancy effect, i.e., shrub-form plants with multiple basal resprouts can reduce mortality risks by replacing the dead segments with small metabolic cost and keep the individual alive [32]. Smaller leaves can lower the transpiration water loss for plants, thus increasing plant water use efficiency [33]. Optimizing physiological performance through plant architecture, the shrub growth form enables Q. mongolica to maintain hydraulic safety with long-term water deficit on sunny slopes at the xeric timberline.
The strong growth form plasticity helps Q. mongolica expand its water niche without chromosome ploidy variations, settling in the xeric environment where ordinary tree species cannot survive. The more abundant solar radiation on sunny slopes causes greater evaporation than on nearby shady slopes; thus, less soil water is available for vegetation at the xeric timberline [8]. To survive on sunny slopes, Q. mongolica shifts from tree to shrub form. Shrub individuals successfully establish and form pure Q. mongolica patches on sunny slopes, although their nonstructural carbohydrate accumulation for drought resistance cannot be as high as that of trees on shady slopes. Such a locally large hydraulic enhancement has also been reported in Atriplex canescens (Pursh) Nutt. previously, which was associated with the plant ploidy transition from diploid, tetraploid to hexaploid cytotypes [23]. Instead of ploidy variations, Q. mongolica in the xeric timberline achieved drought tolerance improvement with powerful tree architecture plasticity.

4.2. Implications for Fire Ecology

Quercus spp. have been proven to have an extremely strong resprout capacity [34,35], thus being able to achieve a tree-to-shrub shift under threatened environments, and these species include Q. pyrenaica Willd. [35], Q. ilex L. [36], and Q. coccifera L. [5]. Many studies have been devoted to the vigor of Quercus resprouting after fire disturbance or heavy browsing. In comparison, the effect of tree-to-shrub growth form variations on plant drought tolerance has attracted less attention previously. However, when seeing these ecological processes on a larger temporal and spatial scale, both the high frequency of fire disturbance and the open environment being suitable for ungulate herbivory are the products of climate drought. Thus, the advances of the shrubby Quercus under fire and browsing disturbances can both be seen as parts of its drought tolerance strategy.
Nevertheless, the shrub-form Q. mongolica in xeric environments may serve as a combustion booster that increases the regional fire risks because of its high aboveground biomass and litter accumulation, short forest canopy, high resin content, low water content, and high fuel continuity [6,37,38,39], which may further affect vegetation dynamics and change the vegetation structure. It should be noted that fire disturbance has been strictly prevented in our plots since the nature reserve was established in 1997, but we do not have data on forest dynamics over a longer historical period. It may be possible that Q. mongolica eliminated other native drought-tolerant species, such as Armeniaca sibirica (L.) Lam., Ostryopsis davidiana Decne., and Spiraea salicifolia L., and formed pure forest patches on the sunny slope with the help of frequent fire disturbances. The tree-to-shrub growth form shift has the potential to play an important role in regional vegetation dynamics and even in the fire regime. Approximately 9.2% of tree species have the ability to transform to shrubs [1]. Vegetation composed of species with high growth-form plasticity is more likely to have a higher fire risk in the context of climate warming and drying, which urgently needs to be identified and to receive more attention.

4.3. Further Considerations

Our results reveal that the tree-to-shrub growth form shift is an effective drought acclimation strategy that can physiologically improve the drought tolerance of Q. mongolica, benefiting its survival under extreme drought at the xeric timberline. It remains unclear whether the observed tree-to-shrub variation is the result of genetic differences and reproductive isolation. Genetic differentiation and reproductive isolation may occur via four processes: geographic isolation, isolation during flowering, isolation after pollination, and selection intensity during their lifetime [40]. In this research, the Q. mongolica trees and shrubs were distributed with small geographic distances, which can exclude the possibility of geographic isolation. The dates of Q. mongolica tree and shrub flowering are both early and mid-June, with shrubs flowering 3–4 days earlier than the trees. There is an approximately 10-day overlap between the flowering dates of the two growth forms; thus, flowering dates causing reproductive isolation are also unlikely to exist. For isolation after pollination and selection intensity during their lifetime, however, we can only exclude the possibility of ploidy-caused isolation but not pollination failure due to differences in zygotic genotypes or the difference in ecological selective forces between plots. Common garden tests may be required to verify these effects in future studies.
For most woody plants, the growth form is either tree or shrub, while there are still some woody species with high growth-form plasticity, such as Quercus spp., that are able to flexibly shift from trees to shrubs [1]. In the context of a warming and drying climate that threatens the world’s forest vegetation [31,41], woody species with high growth-form plasticity may have a larger advantage than we have expected, which may further influence future regional vegetation dynamics and even the fire regime. It is urgently necessary to quantify global woody plant growth-form plasticity, which may effectively improve the accuracy of forest dynamic prediction and assist future forest management under climate change, especially for sensitive ecosystems such as woody vegetation close to the xeric timberline [42]. Object-oriented databases [37,39] combining global plant traits, such as the TRY plant trait database, and forest survey databases, such as the sPlot global vegetation database, are expected to provide us with a shortcut to fill this knowledge gap. Such an integrated database can potentially become a powerful knowledge information system providing scientists, managers, and the public with sufficient knowledge about the current distribution, physiological plasticity, and potential future development of the species that they are interested in [37,39].

Supplementary Materials

The following are available online at https://www.mdpi.com/article/10.3390/f13020244/s1, Supplementary data: all the plant trait data used in this article.

Author Contributions

Conceptualization, J.D. and H.L.; methodology, J.D., S.L. and Y.Q.; writing—original draft preparation, J.D.; writing—review and editing, J.D.; visualization, J.D.; supervision, H.L.; project administration, H.L.; and funding acquisition, H.L. All authors have read and agreed to the published version of the manuscript.

Funding

This research was funded by the National Natural Science Foundation of China, grant number No. 41790422 and 42161144008.

Data Availability Statement

Data used in the article are all presented in the supplementary data.

Acknowledgments

We are grateful for assistance from Saihan Wula National Nature Reserve during fieldwork.

Conflicts of Interest

The authors declare no conflict of interest.

Appendix A

Table A1. Primer information for fluorescence quantitative polymerase chain reaction.
Gene NamePrimerProduct Length (bp)Primer Amplification Efficiency
NDH8qPCR ndh8-F: TCATCACTGTCGGAATTGGGT922.08
qPCR ndh8-R: TTATCGAACGAACCGCACTC
RPL23qPCR rpl23-F: ATCGGGATCAACTAGGACAGA1742.1
qPCR rpl23-R: CCCATTCTTCTACCCTTTCCCG
Table A2. Primer amplification efficiency standard curve.
Gene NameNDH8RPL23
Slope−3.15−3.21
Efficiency2.082.10
Error0.180.12
R20.991.00
Y intercept16.1915.75
Figure A1. Tree architecture traits of the Quercus mongolica shrubs and trees in the HHT and XJ regions. The points show the mean value of the plots, while the vertical lines show the standard deviation. The stars show the results of Student’s t test: ***, p < 0.01; **, p < 0.05; *, and p < 0.1. For each plot, n = 20.
Forests 13 00244 g0a1

References

  1. Scheffer, M.; Vergnon, R.; Cornelissen, J.H.C.; Hantson, S.; Holmgren, M.; van Nes Egbert, H.; Xu, C. Why trees and shrubs but rarely trubs? Trends Ecol. Evol. 2014, 29, 433–434. [Google Scholar] [CrossRef] [PubMed]
  2. Vincent, G.; Harja, D. Exploring ecological significance of tree crown plasticity through three-dimensional modelling. Ann. Bot. 2007, 101, 1221–1231. [Google Scholar] [CrossRef] [PubMed] [Green Version]
  3. Archibald, S.; Bond, W.J. Growing tall vs growing wide: Tree architecture and allometry of Acacia karroo in forest, savanna, and arid environments. Oikos 2003, 102, 3–14. [Google Scholar] [CrossRef]
  4. Wieser, G.; Tausz, M. Current concepts for treelife limitation at the upper timberline. In Trees at their Upper Limit: Treelife Limitation at the Alpine Timberline; Wieser, G., Tausz, M., Eds.; Springer: Amsterdam, The Netherlands, 2007; pp. 1–18. [Google Scholar]
  5. Malanson, G.P.; Trabaud, L. Vigour of post-fire resprouting by Quercus Coccifera L. J. Ecol. 1988, 76, 351–365. [Google Scholar] [CrossRef]
  6. Krivtsov, V.; Legg, C. Modelling soil moisture deficit and moisture content of ground vegetation: Progress towards development of a fire weather index system appropriate to the UK. Fire Technol. 2011, 47, 539–548. [Google Scholar] [CrossRef]
  7. Matyas, C.; Vendramin, G.G.; Fady, B. Forests at the limit: Evolutionary-genetic consequences of environmental changes at the receding (xeric) edge of distribution. Report from a research workshop. Ann. For. Sci. 2009, 66, 800. [Google Scholar] [CrossRef]
  8. Liu, H.Y.; He, S.Y.; Anenkhonov, O.A.; Hu, G.Z.; Sandanov, D.V.; Badmaeva, N.K. Topography-controlled soil water content and the coexistence of forest and steppe in northern China. Physcal Geogr. 2012, 33, 561–573. [Google Scholar] [CrossRef]
  9. Ogaya, R.; Peñuelas, J.; Asensio, D.; Llusià, J. Chlorophyll fluorescence responses to temperature and water availability in two co-dominant Mediterranean shrub and tree species in a long-term field experiment simulating climate change. Environ. Exp. Bot. 2011, 71, 123–127. [Google Scholar] [CrossRef]
  10. Niinemets, Ü. Global-scale climatic controls of leaf dry mass per area, density, and thickness in trees and shrubs. Ecology 2001, 82, 453–469. [Google Scholar] [CrossRef]
  11. Dai, J.Y.; Liu, H.Y.; Wang, Y.C.; Guo, Q.H.; Hu, T.Y.; Quine, T.; Green, S.; Hartmann, H.; Xu, C.Y.; Liu, X.; et al. Drought-modulated allometric patterns of trees in semi-arid forests. Commun. Biol. 2020, 3, 1–8. [Google Scholar] [CrossRef]
  12. Dulamsuren, C.; Hauck, M.; Bader, M.; Osokhjargal, D.; Oyungerel, S.; Nyambayar, S.; Runge, M.; Leuschner, C. Water relations and photosynthetic performance in Larix sibirica growing in the forest-steppe ecotone of northern Mongolia. Tree Physiol. 2009, 29, 99–110. [Google Scholar] [CrossRef] [PubMed] [Green Version]
  13. Allen, C.D.; Macalady, A.K.; Chenchouni, H.; Bachelet, D.; McDowell, N.; Vennetier, M.; Kitzberger, T.; Rigling, A.; Breshears, D.D.; Hogg, E.H.T.; et al. A global overview of drought and heat-induced tree mortality reveals emerging climate change risks for forests. For. Ecol. Manag. 2010, 259, 660–684. [Google Scholar] [CrossRef] [Green Version]
  14. Krestov, P.V. Forest vegetation of easternmost Russia (Russian Far East). In Forest Vegetation of Northeast Asia; Kolbek, J., Šrůtek, M., Box, E.O., Eds.; Springer: Amsterdam, The Netherlands, 2003; pp. 93–180. [Google Scholar]
  15. Xu, X.T.; Wang, Z.H.; Rahbek, C.; Sanders, N.J.; Fang, J.Y. Geographical variation in the importance of water and energy for oak diversity. J. Biogeogr. 2016, 43, 279–288. [Google Scholar] [CrossRef]
  16. Gao, W.B.; Ding, W.; Li, S.; Wang, J.Z.; Chen, X.B. Study on site suitable to Quercus mongolica in natural hag in Changbai Mountain forest region. J. Beihua Univ. (Nat. Sci.) 2000, 1, 77–81. (In Chinese) [Google Scholar]
  17. Yang, D.Y.; Guo, L.R.; Yang, X.K.; Yang, Y.C.; Chen, H.M.; Deng, P.J. A method freed from endogenous reference gene for estimating copy number of transgenes in genetically mod ified plants by TaqMan quantitative PCR. Chin. J. Health Lab. 2008, 6, 992–996. (In Chinese) [Google Scholar]
  18. Bartlett, M.K.; Klein, T.; Jansen, S.; Choat, B.; Sack, L. The correlations and sequence of plant stomatal, hydraulic, and wilting responses to drought. Proc. Natl. Acad. Sci. USA 2016, 113, 13098–13103. [Google Scholar] [CrossRef] [Green Version]
  19. Adams, H.D.; Zeppel, M.J.B.; Anderegg, W.R.L.; Hartmann, H.; Landhäusser, S.M.; Tissue, D.T.; Huxman, T.E.; Hudson, P.J.; Franz, T.E.; Allen, C.D. A multi-species synthesis of physiological mechanisms in drought-induced tree mortality. Nat. Ecol. Evol. 2017, 1, 1285–1291. [Google Scholar] [CrossRef]
  20. Li, X.M.; Blackman, C.J.; Choat, B.; Duursma, R.A.; Rymer, P.D.; Medlyn, B.E.; Tissue, D.T. Tree hydraulic traits are coordinated and strongly linked to climate-of-origin across a rainfall gradient. Plant Cell Environ. 2018, 41, 646–660. [Google Scholar] [CrossRef]
  21. Maréchaux, I.; Bartlett, M.K.; Sack, L.; Baraloto, C.; Engel, J.; Joetzjer, E.; Chave, J. Drought tolerance as predicted by leaf water potential at turgor loss point varies strongly across species within an Amazonian forest. Funct. Ecol. 2015, 29, 1268–1277. [Google Scholar] [CrossRef]
  22. Bartlett, M.K.; Scoffoni, C.; Ardy, R.; Zhang, Y.; Sun, S.W.; Cao, K.F.; Sack, L. Rapid determination of comparative drought tolerance traits: Using an osmometer to predict turgor loss point. Methods Ecol. Evol. 2012, 3, 880–888. [Google Scholar] [CrossRef]
  23. Hao, G.Y.; Lucero, M.E.; Sanderson, S.C.; Zacharias, E.H.; Holbrook, N.M. Polyploidy enhances the occupation of heterogeneous environments through hydraulic related trade-offs in Atriplex canescens (Chenopodiaceae). New Phytol. 2013, 197, 970–978. [Google Scholar] [CrossRef] [PubMed]
  24. Zwieniecki, M.A.; Holbrook, N.M. Diurnal variation in xylem hydraulic conductivity in white ash (Fraxinus americana L.), red maple (Acer rubrum L.) and red spruce (Picea rubens Sarg.). Plant Cell Environ. 1998, 21, 1173–1180. [Google Scholar] [CrossRef] [Green Version]
  25. Qiu, S.; Liu, H.Y.; Zhao, F.J.; Liu, X. Inconsistent changes of biomass and species richness along a precipitation gradient in temperate steppe. J. Arid Environ. 2016, 132, 42–48. [Google Scholar] [CrossRef]
  26. Koch, G.W.; Sillett, S.C.; Jennings, G.M.; Davis, S.D. The limits to tree height. Nature 2004, 428, 851–854. [Google Scholar] [CrossRef]
  27. Guo, Q.; Li, J.Y.; Zhang, Y.X.; Zhang, J.X.; Lu, D.L.; Korpelainen, H.; Li, C.Y. Species-specific competition and N fertilization regulate non-structural carbohydrate contents in two Larix species. For. Ecol. Manag. 2016, 364, 60–69. [Google Scholar] [CrossRef]
  28. Yemm, E.W.; Willis, A.J. The estimation of carbohydrates in plant extracts by anthrone. Biochem. J. 1954, 57, 508–514. [Google Scholar] [CrossRef] [Green Version]
  29. Liu, H.Y.; Shangguan, H.L.; Zhou, M.; Airebule, P.; Zhao, P.W.; He, W.Q.; Xiang, C.L.; Wu, X.C. Differentiated responses of nonstructural carbohydrate allocation to climatic dryness and drought events in the Inner Asian arid timberline. Agric. For. Meteorol. 2019, 271, 355–361. [Google Scholar] [CrossRef]
  30. Midgley, J.J. Is bigger better in plants? The hydraulic costs of increasing size in trees. Trends Ecol. Evol. 2003, 18, 5–6. [Google Scholar] [CrossRef]
  31. McDowell, N.G.; Allen, C.D. Darcy’s law predicts widespread forest mortality under climate warming. Nat. Clim. Chang. 2015, 5, 669–672. [Google Scholar] [CrossRef]
  32. Cruiziat, P.; Cochard, H.; Ameglio, T. Hydraulic architecture of trees: Main concepts and results. Ann. For. Sci. 2002, 59, 723–752. [Google Scholar] [CrossRef] [Green Version]
  33. Toscano, S.; Ferrante, A.; Romano, D. Response of Mediterranean ornamental plants to drought stress. Horticulturae 2019, 5, 6. [Google Scholar] [CrossRef] [Green Version]
  34. Perea, R.; López-Sánchez, A.; Pallarés, J.; Gordaliza, G.G.; González-Doncel, I.; Gil, L.; Rodríguez-Calcerrada, J. Tree recruitment in a drought- and herbivory-stressed oak-beech forest: Implications for future species coexistence. For. Ecol. Manag. 2020, 477, 118489. [Google Scholar] [CrossRef]
  35. Valbuena-Carabaña, M.; Gil, L. Genetic resilience in a historically profited root sprouting oak (Quercus pyrenaica Willd.) at its southern boundary. Tree Genet. Genomes 2013, 9, 1129–1142. [Google Scholar] [CrossRef]
  36. Peña-Rojas, K.; Aranda, X.; Joffre, R.; Fleck, I. Leaf morphology, photochemistry and water status changes in resprouting Quercus ilex during drought. Funct. Plant Biol. 2005, 32, 117–130. [Google Scholar] [CrossRef]
  37. Krivtsov, V.; Vigy, O.; Legg, C.; Curt, T.; Rigolot, E.; Lecomte, I.; Jappiot, M.; Lampin-Maillet, C.; Fernandes, P.; Pezzatti, B. Fuel modelling in terrestrial ecosystems: An overview in the context of the development of an object-orientated database for wild fire analysis. Ecol. Model. 2009, 220, 2915–2926. [Google Scholar] [CrossRef]
  38. Pausas, J.G.; Keeley, J.E.; Schwilk, D.W. Flammability as an ecological and evolutionary driver. J. Ecol. 2017, 105, 289–297. [Google Scholar] [CrossRef]
  39. Legg, C.; Pezzatti, G.; Rigolot, E.; Vigy, O.; Lecomte, I.; Mårell, A.; Krivtsov, V. Development of an object-orientated database for wildfire modelling. Model. Monit. Manag. For. Fires 2008, 119, 39–47. [Google Scholar]
  40. Sun, Y.; Abbott, R.J.; Li, L.; Li, L.; Zou, J.; Liu, J. Evolutionary history of Purple cone spruce (Picea purpurea) in the Qinghai–Tibet Plateau: Homoploid hybrid origin and Pleistocene expansion. Mol. Ecol. 2014, 23, 343–359. [Google Scholar] [CrossRef]
  41. Hartmann, H.; Moura, C.F.; Anderegg, W.R.L.; Ruehr, N.K.; Salmon, Y.; Allen, C.D.; Arndt, S.K.; Breshears, D.D.; Davi, H.; Galbraith, D. Research frontiers for improving our understanding of drought-induced tree and forest mortality. New Phytol. 2018, 218, 15–28. [Google Scholar] [CrossRef] [Green Version]
  42. Seddon, A.W.R.; Macias-Fauria, M.; Long, P.R.; Benz, D.; Willis, K.J. Sensitivity of global terrestrial ecosystems to climate variability. Nature 2016, 531, 229–232. [Google Scholar] [CrossRef] [Green Version]
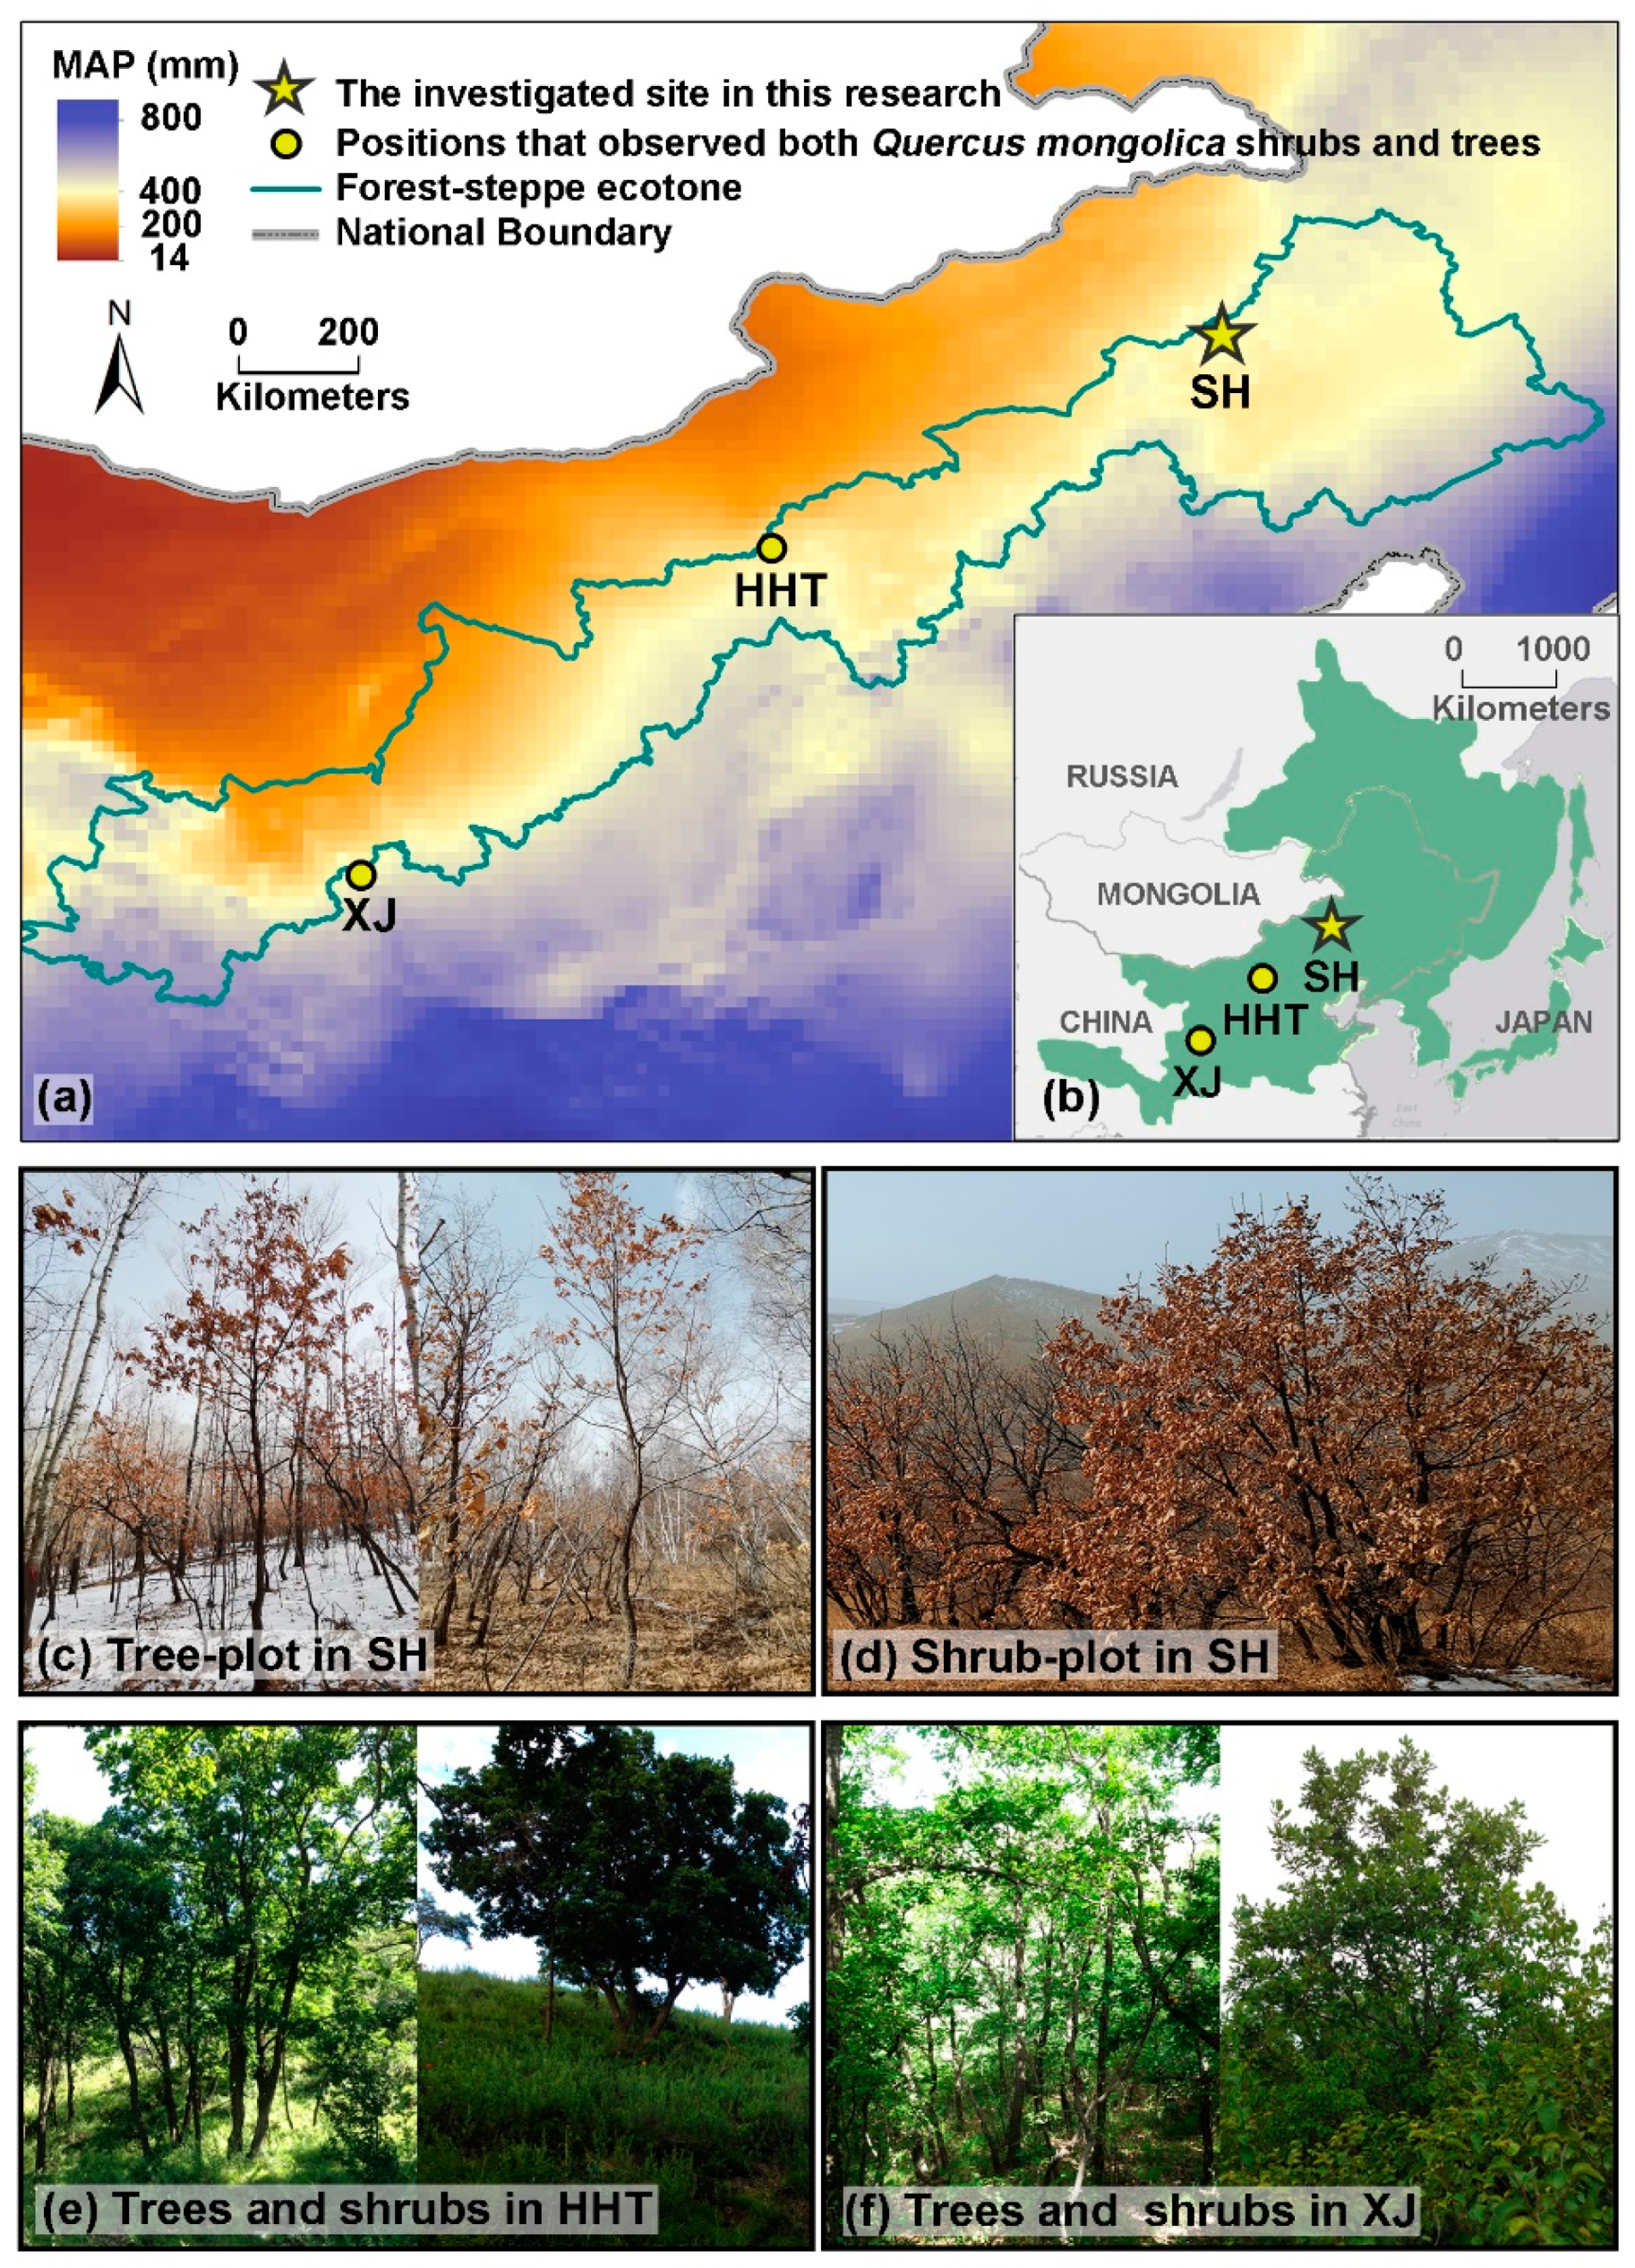
Figure 1. (a) The location of the investigated site and mean annual precipitation (MAP) pattern in the semiarid region. (b) The green area shows the natural distribution of Quercus mongolica globally [15]. Yellow stars in Panels (a,b) show the locations where the investigated Q. mongolica tree and shrub plots are located in the SH region. Yellow circles show the places where similar abrupt tree-to-shrub shifts were discovered during previous investigation. (c,d) Quercus mongolica trees on shady slopes and shrubs on sunny slopes in the SH region. Photos were taken by J. Dai in March 2021. (e,f) Quercus mongolica trees and shrubs in HHT and XJ, respectively. Photos were taken by J. Dai in July 2016.
Forests 13 00244 g001
Figure 2. Box plots show the plant morphological differences between Quercus mongolica trees and shrubs for (a) number of resprouts, (b) tree height, and (c) leaf area. The horizontal lines represent the 25%, 50%, and 75% quantiles. The vertical lines show the 5% and 95% quantile. The stars show the results of a Wilcoxon rank-sum test: ***, p < 0.01; **, p < 0.05.
Forests 13 00244 g002
Figure 3. Box plots show the difference between drought stress, tolerance, and nonstructural carbohydrate performance of Quercus mongolica trees and shrubs. We report (a) midday leaf water potential (Ψmid) and (d) percentage loss of stem hydraulic conductivity (PLC) as the drought stress that plants are bearing; (b) leaf turgor loss point (Ψtlp) and (e) leaf δ13C as plant drought tolerance ability; and plant (c) leaf and (f) fine root total nonstructural carbohydrate (TNC) of Q. mongolica individuals. The horizontal lines represent the 25%, 50%, and 75% quantiles. The vertical lines show the 5% and 95% quantile. The stars show the results of a Wilcoxon rank-sum test: **, p < 0.05; *, p < 0.1.
Forests 13 00244 g003
Table 1. Basic Information for the Quercus mongolica Tree and Shrub Plots.
Plot nameLatitude (°N)Longitude (°E)Altitude (m a.s.l.)Slope (°)AspectAverage tree age (years)
Tree44.22118.74119512North60
Shrub44.22118.7512076South58
Plot nameBulk
density (g/cm3)
Field capacity (%)Soil depth (m)
Tree1.0441.560.49
Shrub1.1932.690.24
Publisher’s Note: MDPI stays neutral with regard to jurisdictional claims in published maps and institutional affiliations.