Article

Incompatibility Phylogenetic Signals between Double-Digest Restriction Site-Associated DNA Sequencing and Plastid Genomes in Chinese Curcuma (Zingiberaceae)—A Recent Qinghai–Tibetan Plateau Diversification Genera

1
College of Life Science, Sichuan Agricultural University, Yaan 625014, China
2
School of Geography and Resources, Guizhou Education University, Guiyang 550018, China
3
Faculty of Agriculture, Forestry and Food Engineering, Yibin University, Yibin 644000, China
4
College of Science, Sichuan Agricultural University, Yaan 625014, China
*
Authors to whom correspondence should be addressed.
These authors have contributed equally to this work.
Forests 2022, 13(2), 280; https://doi.org/10.3390/f13020280
Submission received: 18 December 2021 / Revised: 1 February 2022 / Accepted: 7 February 2022 / Published: 10 February 2022
(This article belongs to the Section Genetics and Molecular Biology)

Abstract

:
Curcuma is of high economic value, credited to its medicinal, edible, and ornamental properties, which possess all signatures of adaptability, and rapid radiation, especially species of Curcuma (Chinese Curcuma, a recent Qinghai–Tibetan Plateau diversification genera) scattered in China. However, little is known about the incongruent phylogenetic signals within this genera from different inheritance patterns that will militate against the further development of this genera. In this research, we applied complete chloroplast genome data together with double-digest restriction site-associated DNA sequencing data (ddRAD-seq) strategy to investigate phylogenetic signals of Chinese Curcuma species, clustering using two RAD analysis pipelines (STACKS and pyRAD). Phylogenetic trees were obtained from each locus based on the maximum likelihood (ML) and multispecies coalescent (BEAST) methods. For visual comparison, multi-method and different datasets were used to infer the phylogeny. We discovered inconsistent relationships for the Chinese Curcuma with varying degrees of support using different methods and datasets.

1. Introduction

Rapid diversification is common in natural landscapes, such as mountain ranges and archipelagos [1]. The intense uplift of the Qinghai–Tibetan Plateau (QTP) and adjoining mountain ranges are one of these natural landscapes rich in biodiversity resources providing numerous foods and herbs [2,3,4,5,6]. Presently, the phylogeny of taxa in QTP is not enough [7,8]. Moreover, it is difficult to infer phylogenetic relationships and incompatibility because of the low and conflicting signals in both genes and species of the trees within taxa in QTP. Recently, scientists have discovered that the phylogeny and divergence of Chinese Curcuma are related to the intense uplift of the QTP [9].
As one of the complex genera in the Zingiberaceae family, Curcuma has been used in a vast range of medicinal, edible, and horticultural species since eons ago [10,11]. The genera have about ten species in China (two species, C. viridiflora, and C. exigua may be extinct, with C. flaviflora being scarce and difficult to collect) [12]. Chinese Curcuma are distributed from Tibet to South China (most of them are mainly distributed in the Hengduan Mountains Areas of QTP) [9]. However, poor diagnostic characteristics of morphology (the high level of similarity in flora and the existence of morphological intermediates in leaflets and rhizomes) among Chinese Curcuma spp., the phylogeny and taxonomy are still intractable [13,14,15,16]. For example, based on the sizes of pollen, Chinese Curcuma is divided into two groups, the sizes of pollen of C. sichuanensis, C. zanthorrhiza, C. phaecaulis, C. flaviflora, C. wenyujin, C. elata, and C. amarrisima < 3 μm, while others of C. yunnanensis, C. longa, and C. aromatica > 3 μm [17]. Based on account of oil cells, vascular bundles, and xylem vessels, Chinese Curcuma can be divided into three groups (Group I: C. kwangsiensis and C. exigua, Group II: C. xanthorrhiza, C. longa, and C. sichuanensis, Group III: C. wenyujin, C. aromatica, C. phaeocaulis, C. zedoaria, and C. yunnanensis) [18]. Based on some key identification features of Chinese Curcuma (hair distribution, stoma density, and epidermal cells in leaf), it can be divided into three groups (Group I: C. longa, C. sichuanensis, C. wenyujin, and C. xanthorrhiza; Group II: C. kwangsiensis and C. exigua; Group III: C. aromatica, C. chuanyujin, C. zedoaria, C. phaeocaulis, and C. yunnanensis) [19]. Therefore, identification of Curcuma only by morphological characteristics will lead to a state of uncertainty in taxonomic inference [13]. Thus, it is necessary to use new techniques to classify them in a clear criteria principle.
Currently, molecular method (e.g., DNA markers) is used to explore the phylogeny of Chinese Curcuma, and the phylogenetic relationships of Chinese Curcuma are still unclear [10,20]. Based on six mitochondrial DNA genes, the phylogenetic relationship within Chinese Curcuma was preliminarily inferred (C. sichuanensis, C. amarissima, C. longa, and C. wenyujin had a close relationship, while the relationships of C. yunnanensis, C. kwangsiensis, C. phaeocaulis, C. aromatic, and C. chuanhuangjiang were close) [14]. Research showed that C. sichuanensis originated from the mutation of C. longa [15]. Chen et al. (2014) used five DNA regions to infer the phylogenetic relationships of Curcuma collected from Myanmar and China, but their discriminatory power showed major potential drawbacks (not enough barcoding gaps) in inferring these genera [13]. Overall, barcode regions lack enough variation sites to recover phylogeny and divergence of Curcuma. Therefore, new approaches are needed to recover the evolutionary patterns of Curcuma [21,22].
Recently, next-generation sequencing (NGS) has made significant progress and increased phylogenetic analysis, proving better than the traditional sequencing techniques [23,24,25]. It encompasses a number of procedures, including restriction site-associated DNA sequencing (RAD and ddRAD) and genotyping-by-sequencing (GBS and ddGBS), producing larger amounts of genomic sequence data quickly and effectively [26,27,28]. These techniques can produce several phylogenetically informative forms of tens of thousands of loci, and phylogeneticists have applied them to resolve intractable problems in the phylogenetic studies of organisms [29,30,31,32]. Compared with GBS, which produces fragments using a single restriction enzyme, the double-digest restriction site-associated DNA sequencing (ddRAD-seq) generates fragments using two enzymes, thereby producing plenty of DNA loci and larger amounts of SNPs has been proven to be effective in rebuilding phylogenetic relationships and recent evolutionary history, especially within closely related species [33,34,35,36,37]. Organelle genomes are widely used in the phylogeny of complex taxa [38,39,40,41]. The chloroplast passed down via maternal lineage is a crucial organelle and plays an essential role in the life of plants [42]. Chloroplast genomes vary in size from 120 to 220 kb and have a typical quadripartite circular structure comprising a large single-copy region (LSC), a small single-copy region (SSC), and a pair of inverted repeats (IRs) that separates the LSC and SSC. The characteristics of chloroplast genomes are slow mutation rate, haploid inheritance, and small genome size, and those features are often used to clarify phylogeny [43,44,45,46,47].
The whole chloroplast genome and ddRAD-seq have been widely used to solve various kinds of phylogenetic problems in plants [48]. The phylogenomic signals produced by comparing the chloroplast genome and ddRAD-seq could be used to explain species diversity and evolution [49,50]. Additionally, during a short period, the descendants of rapid divergence and diversification burst tended to interbreed before reproductive barriers and led to inconsistent phylogenetic signals [37]. Chinese Curcuma seems to have experienced recent diversification along with the uplift of QTP [9]. Are there any conflicting phylogenomic signals in Chinese Curcuma between the nuclear genome and plastid genome? In this study, we examined the phylogenetic utility of chloroplast genome data and ddRAD-Seq to infer the phylogeny of Chinese Curcuma and discussed the incompatibility of phylogenetic signals.

2. Materials and Methods

2.1. Plant Material and DNA Extraction

Twelve Curcuma species for ddRAD-seq were used in this study (specimens’ information in Table 1). The young, healthy fresh leaves were desiccated in silica gel and collected from Xishuangbanna Tropical Botanical Garden, Chinese Academy of Sciences, and identified by Mr. Jianping Wang. Liquid nitrogen was used to freeze the leaves, and then the leaves were stored at −80 °C. All samples were deposited at the herbarium of Sichuan Agriculture University (SICAU). The total genomic DNA from fresh leaves was extracted using the cetyltrimethylammonium bromide (CTAB) methods [51]. The extracted DNA quantity was visualized using gel electrophoresis, and the Nanodrop 2000C spectrophotometry was used for DNA quantification. Only when the quality met > 100 ng/μL for DNA could the total genomic DNA be used for library construction [52]. The chloroplast genome of the 12 Curcuma species was obtained from GenBank as previously published (Table S1) [47].

2.2. Sequencing and Clustering

The enzymes NlaIII (5′-CATG-3′) and EcoRI (5′-GAATTC-3′) were used for DNA digestion, and the resulting fragments were ligated to a barcode adaptor and a common adaptor with compactable sticky ends. The targeting fragments were kept within acceptable bounds of 300–400 bp in size. For the ddRAD-seq library preparation, each individual was sequenced using Illumina Novaseq 6000 System sequencer of Genepioneer Biotechnologies Co. Ltd., Nanjing, China, to generate 150 bp paired-end reads, and about 1 Gb raw data were generated. The software pipeline STACKS and pyRAD were used to process the raw data from the ddRAD data [53,54]. STACKS focused on population-level analysis, and the pyRAD concentrated on variations across clades (species or higher) using a global clustering and alignment method, detecting clusters with high levels of divergence. Despite the differences, the results of STACKS and pyRAD were considered comparable [55].
We applied the STACKS 2.53 pipeline to genotype and once again identified the loci from short-read sequences. Raw reads were de-multiplexed and filtered using the “process radtags” module. In the maximum likelihood (ML) model, “ustacks” was executed to merge short reads into loci (each sample). The parameter was set to “ustacks” (−m = 3 and −M = 4 options), “cstacks” (−n = 6 option). Finally, the modules for the loci of each sample were “sstacks”. We set default parameters to evaluate the sensitivity of the results.
The parameters in pyRAD were: Nucleotides with Phred scores of <20 were coded as unknown bases (N), and sequences with >5% N’s were discarded. The sequences were clustered within samples of 90% similarity via the uclust function in USEARCH [56]. Clusters of less than six sequences were discarded, and the minimum number of individuals per cluster was set to two. Heterozygous locus among more than three samples was discarded. The remaining clusters were treated as loci and assembled into a phylogenetic matrix.

2.3. Phylogenetic Analyses

To infer phylogenies with the ddRAD data, we selected four datasets from two software pipelines (STACKS and pyRAD): (1) the super-matrix included all loci (726807 in STACKS and 121647 in pyRAD) concatenated into and pad out with N; and (2) the concatenated dataset with full coverage among samples (only 8574 loci in STACKS and 902 loci in pyRAD). The RAxML v.8.2.12 [57] analyzed the four datasets, with C. alismatifolia used as an outgroup. The best-fit models (GTR) of nucleotide substitution were selected in jModelTest 2 2.1.6 based on the Akaike Information Criterion (AIC) [58,59]. According to the calculation, we analyzed the dataset of super-matrix (1) and (2) with branch support estimated using 1000 bootstrap replicates.
To get alignment in different regions of two datasets (coding sequence and complete chloroplast genome sequence) for constructing the phylogenetic tree, we used MAFFT software to perform multiple sequence alignment [60]. The chloroplast genomes of 12 Curcuma species were used to infer phylogenetic relationships. We analyzed the two datasets using the ML method in RAxML v.8.2.12 [57] in the best model (GTR). C. alismatifolia was used as an outgroup.

2.4. The Inference of Combination with Multi-Locus Species Trees

The BEAST 1.7.5 [61] was used to estimate the species trees from the coding sequence region, 8574 loci and 902 loci (see results) from 12 samples. In Bayesian analysis, the model “relaxed clock” and Markov chain Monte Carlo were used to estimate the posterior distribution, and the overall species tree ran 200 million generations, and every 1000 steps ensured an effective sample size in each parameter greater than 200. The output file was assessed for convergence using Tracer1.5 [62]. The phylogenetic tree used TreeAnnotator1.5.3 to discard 10% as burnin. Finally, the trees were visualized in FigTree1.1.2.

2.5. Consistency Analysis of Inferred Trees

Different resulting trees and pair-wise comparisons of tree topologies were assessed and performed, respectively, using the Compare2Trees software [63]. By calculating an overall topological score (%), this method can compare different trees (pair-wise) and determine how similar or different the topologies are. We input each tree into the program, comparing two at a time in a Bewick format with only branch lengths labeled.

3. Results

3.1. Sequence Characters

An average of 1.47 Gb raw data was returned for 12 Curcuma species. Raw reads of the founder lines were deposited in the National Center for Biotechnology Information with BioProject ID: PRJNA745037. After filtering the Illumina raw reads, 61,432,010 first paired-end reads were retained. Through a cluster of consensus sequences, we received 726,807 unique loci across all samples with 8574 loci present in STACKS, and 121,647 unique loci across all samples with 902 loci present in pyRAD. Each sample in the super-matrix dataset had 180,846,851 (in STACKS) and 34,836,589 (in pyRAD) base pairs (those missing were coded as N’s), resulting in a total of 2,163,675 (in STACKS) and 258,467 (in pyRAD) base pairs. Each value in the 8574 loci (in STACKS) and 902 loci (in pyRAD) had full coverage across taxa.
The complete chloroplast genomes from 12 Curcuma samples ranged in size from 162,024 (C. wenyujin) to 162,715 bp (C. alismatifolia) (Table S1), including LSC region ranging in size from 86,921 (C. wenyujin) to 87,416 bp (C. alismatifolia), SSC region ranging in size from 15,509 (C. alismatifolia) to 15,700 bp (C. zanthorrhiza), and IRs ranging in size from 29,718 (C. wenyujin) to 29,897 bp (C. alismatifolia). The coding sequences and complete chloroplast genomes were used to infer the phylogenetic trees.

3.2. Phylogenetic Inference

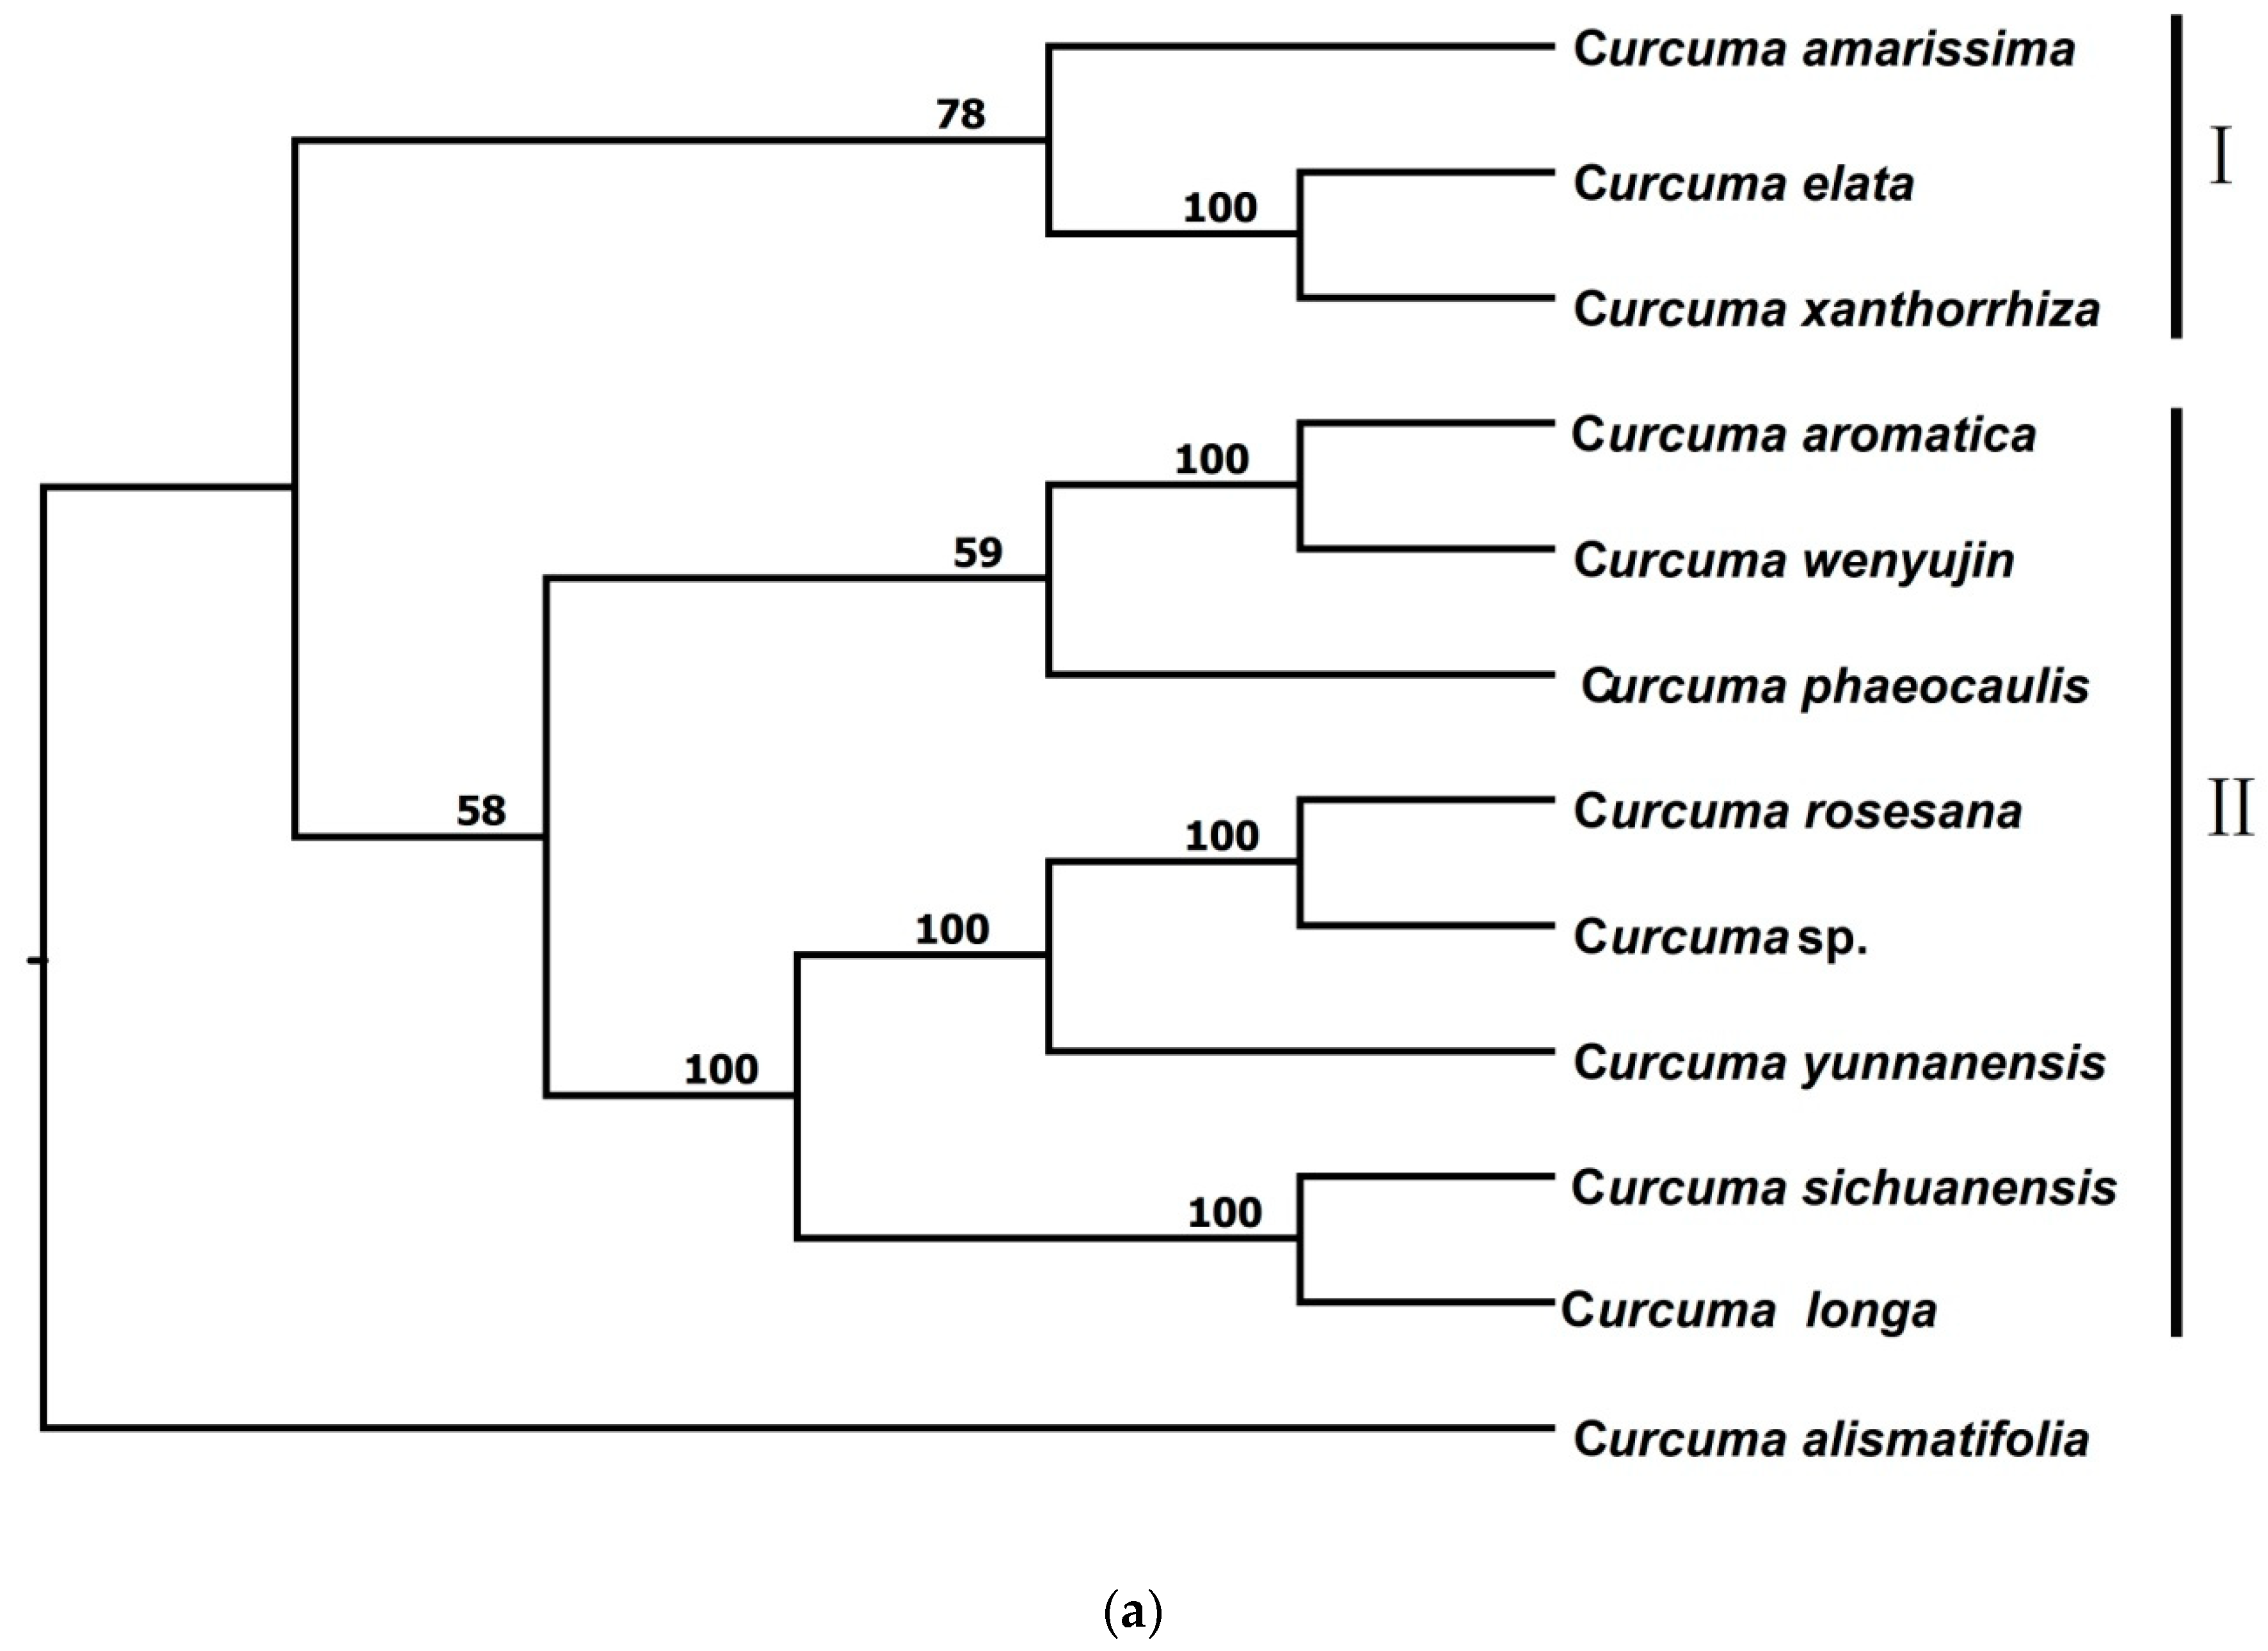
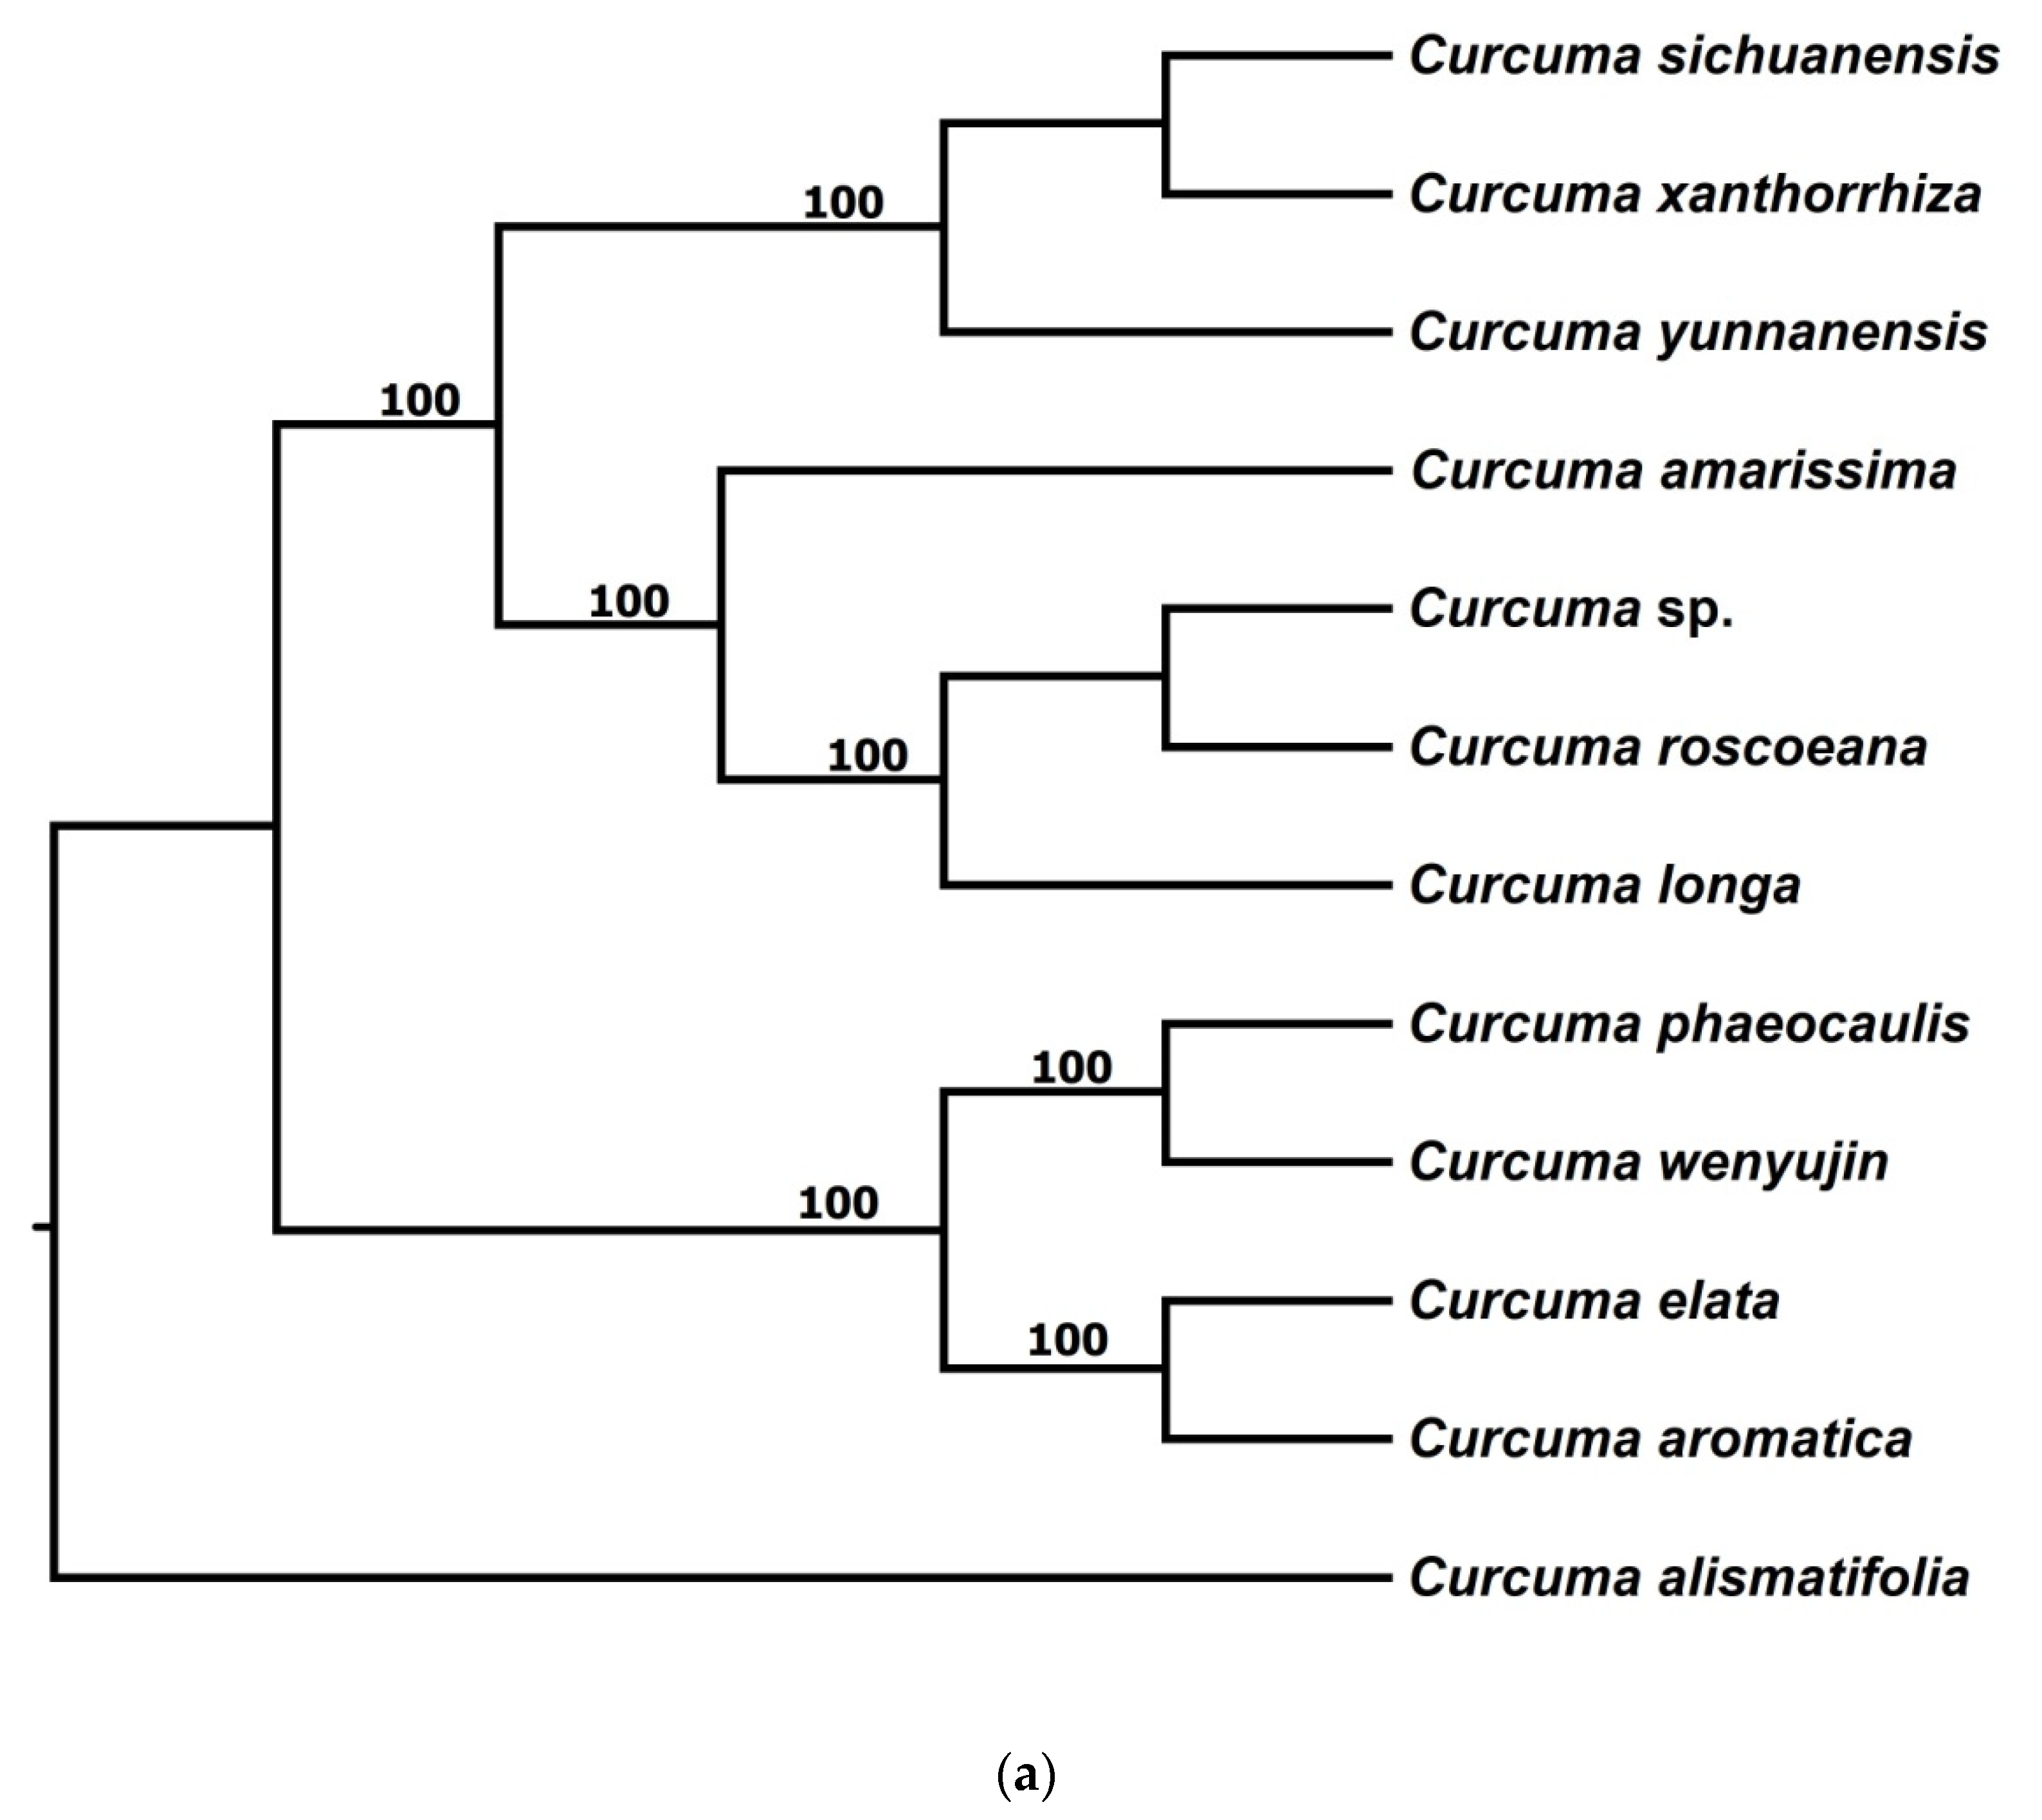
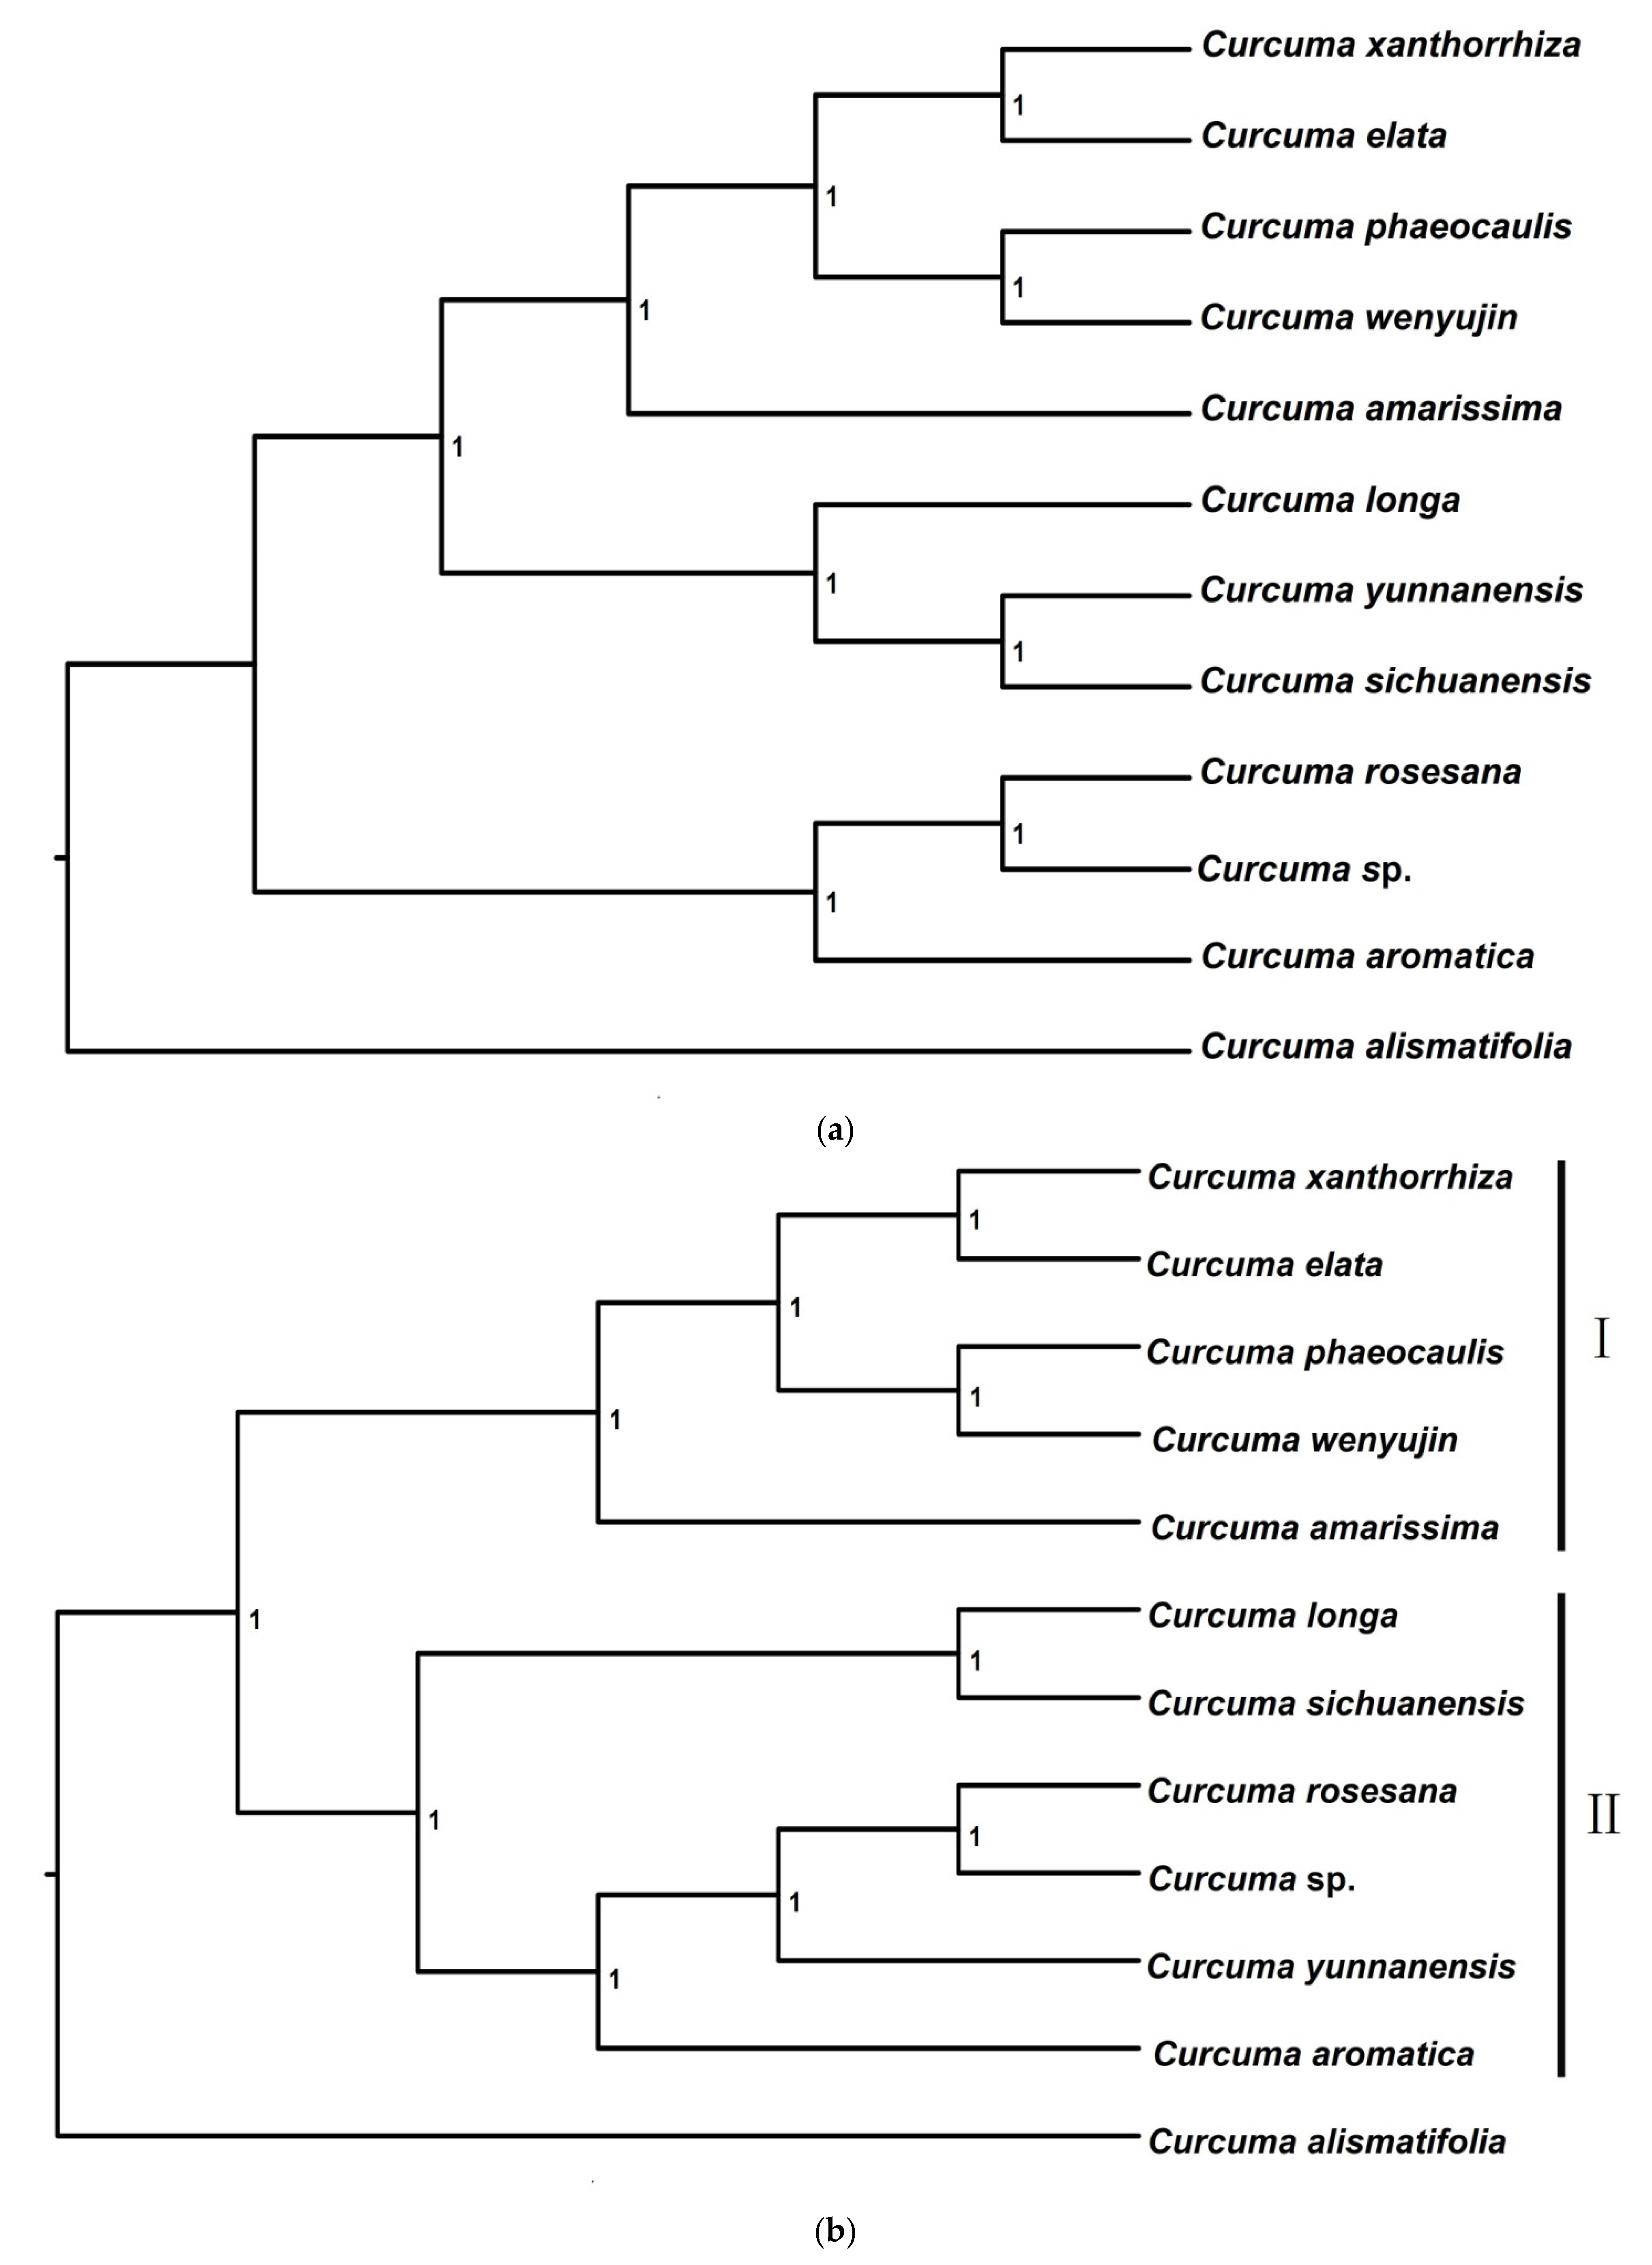
3.2.1. Phylogenetic Trees from pyRAD

The ML analyses of the two datasets by pyRAD generated different clades (topology) with overall bootstrap support values, in which five of nine clades were more than 90%, one clade was between 65% and 50%, and three clades were less than 50% in the full concatenated super-matrix data ML tree (Figure 1a). High support values (7 clades > 90%, 2 clades > 65%, and none < 50%) were obtained in the concatenated 902 loci ML tree (Figure 1b). In Figure 1a, Group I consisted of C. longa, C. sichuanensis, C. sp., C. rosesana, and C. yunnanensis; Group II consisted of C. wenyujin, C. aromatic, C. amarissima, C. phaeocaulis, C. elata, and C. xanthorrhiza. Meanwhile, in Figure 1b, the Group I consisted of C. yunnanensis, C. sichuanensis, C. sp., C. rosesana, C. longa, C. amarissima, and C. aromatica; Group II consisted of C. phaeocaulis, C. wenyujin, C. xanthorrhiza, and C. elata.

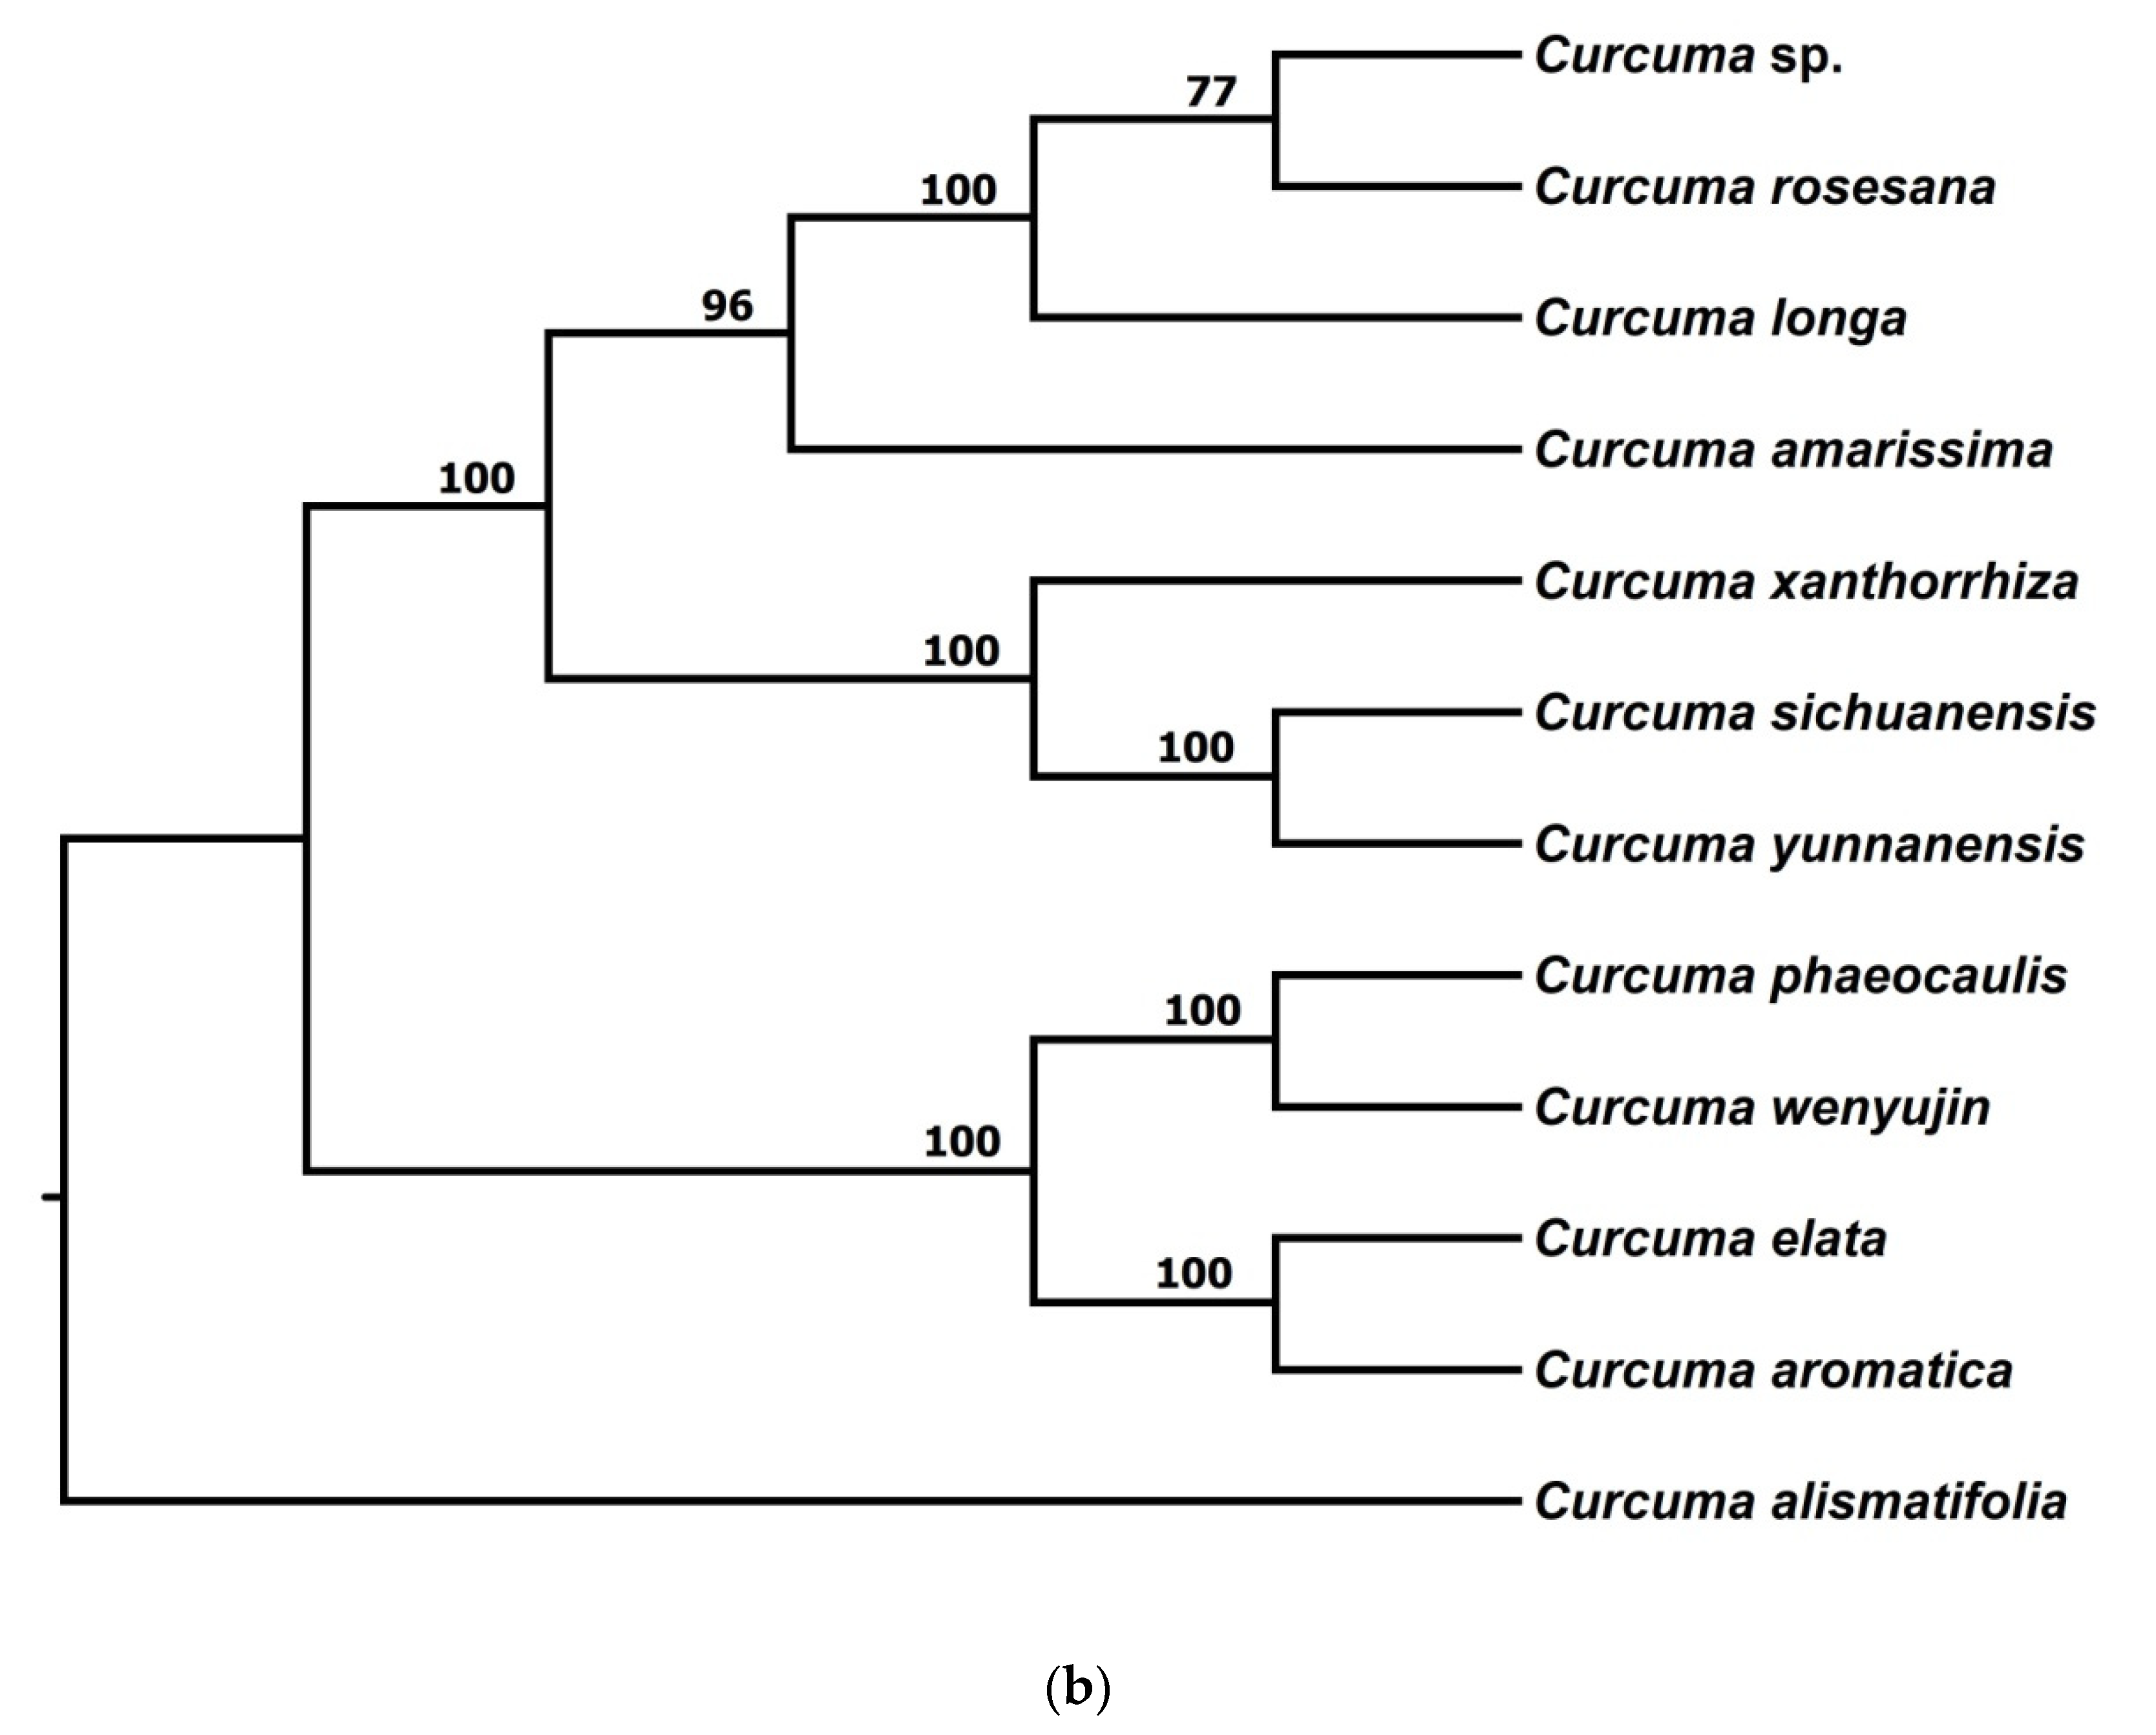
3.2.2. Phylogenetic Trees from STACKS

The topologies in phylogenetic trees with bootstrap support values from STACKS showed obvious differences (Figure 2a,b). In the full concatenated super-matrix data ML tree (Figure 2a), the bootstrap support values of six clades > 90%, one clade > 75%, and two clades > 50%. Meanwhile, in the concatenated 8574 loci ML tree, the bootstrap support values were four clades > 90%, five clades > 80%. In Figure 2a, the Chinese Curcuma was divided into two groups: Group I consisted of C. elata, C. xanthorrhiza, and C. amarissima, while Group II consisted of C. aromatica, C. wenyujin, C. phaeocaulis, C. rosesana, C. sp., C. yunnanensis, C. sichuanensis, and C. longa. In Figure 2b, Group I consisted of C. xanthorrhiza, C. elata, C. phaeocaulis, and C. wenyujin, the Group II consisted of C. sp., C. rosesana, C. aromatica, C. yunnanensis, C. longa, C. sichuanensis, and C. amarissima. Moreover, the STACKS-ML trees (Figure 2a,b) recovered incongruous clades with higher bootstrap support values than those in the pyRAD-ML tree (Figure 1a,b).

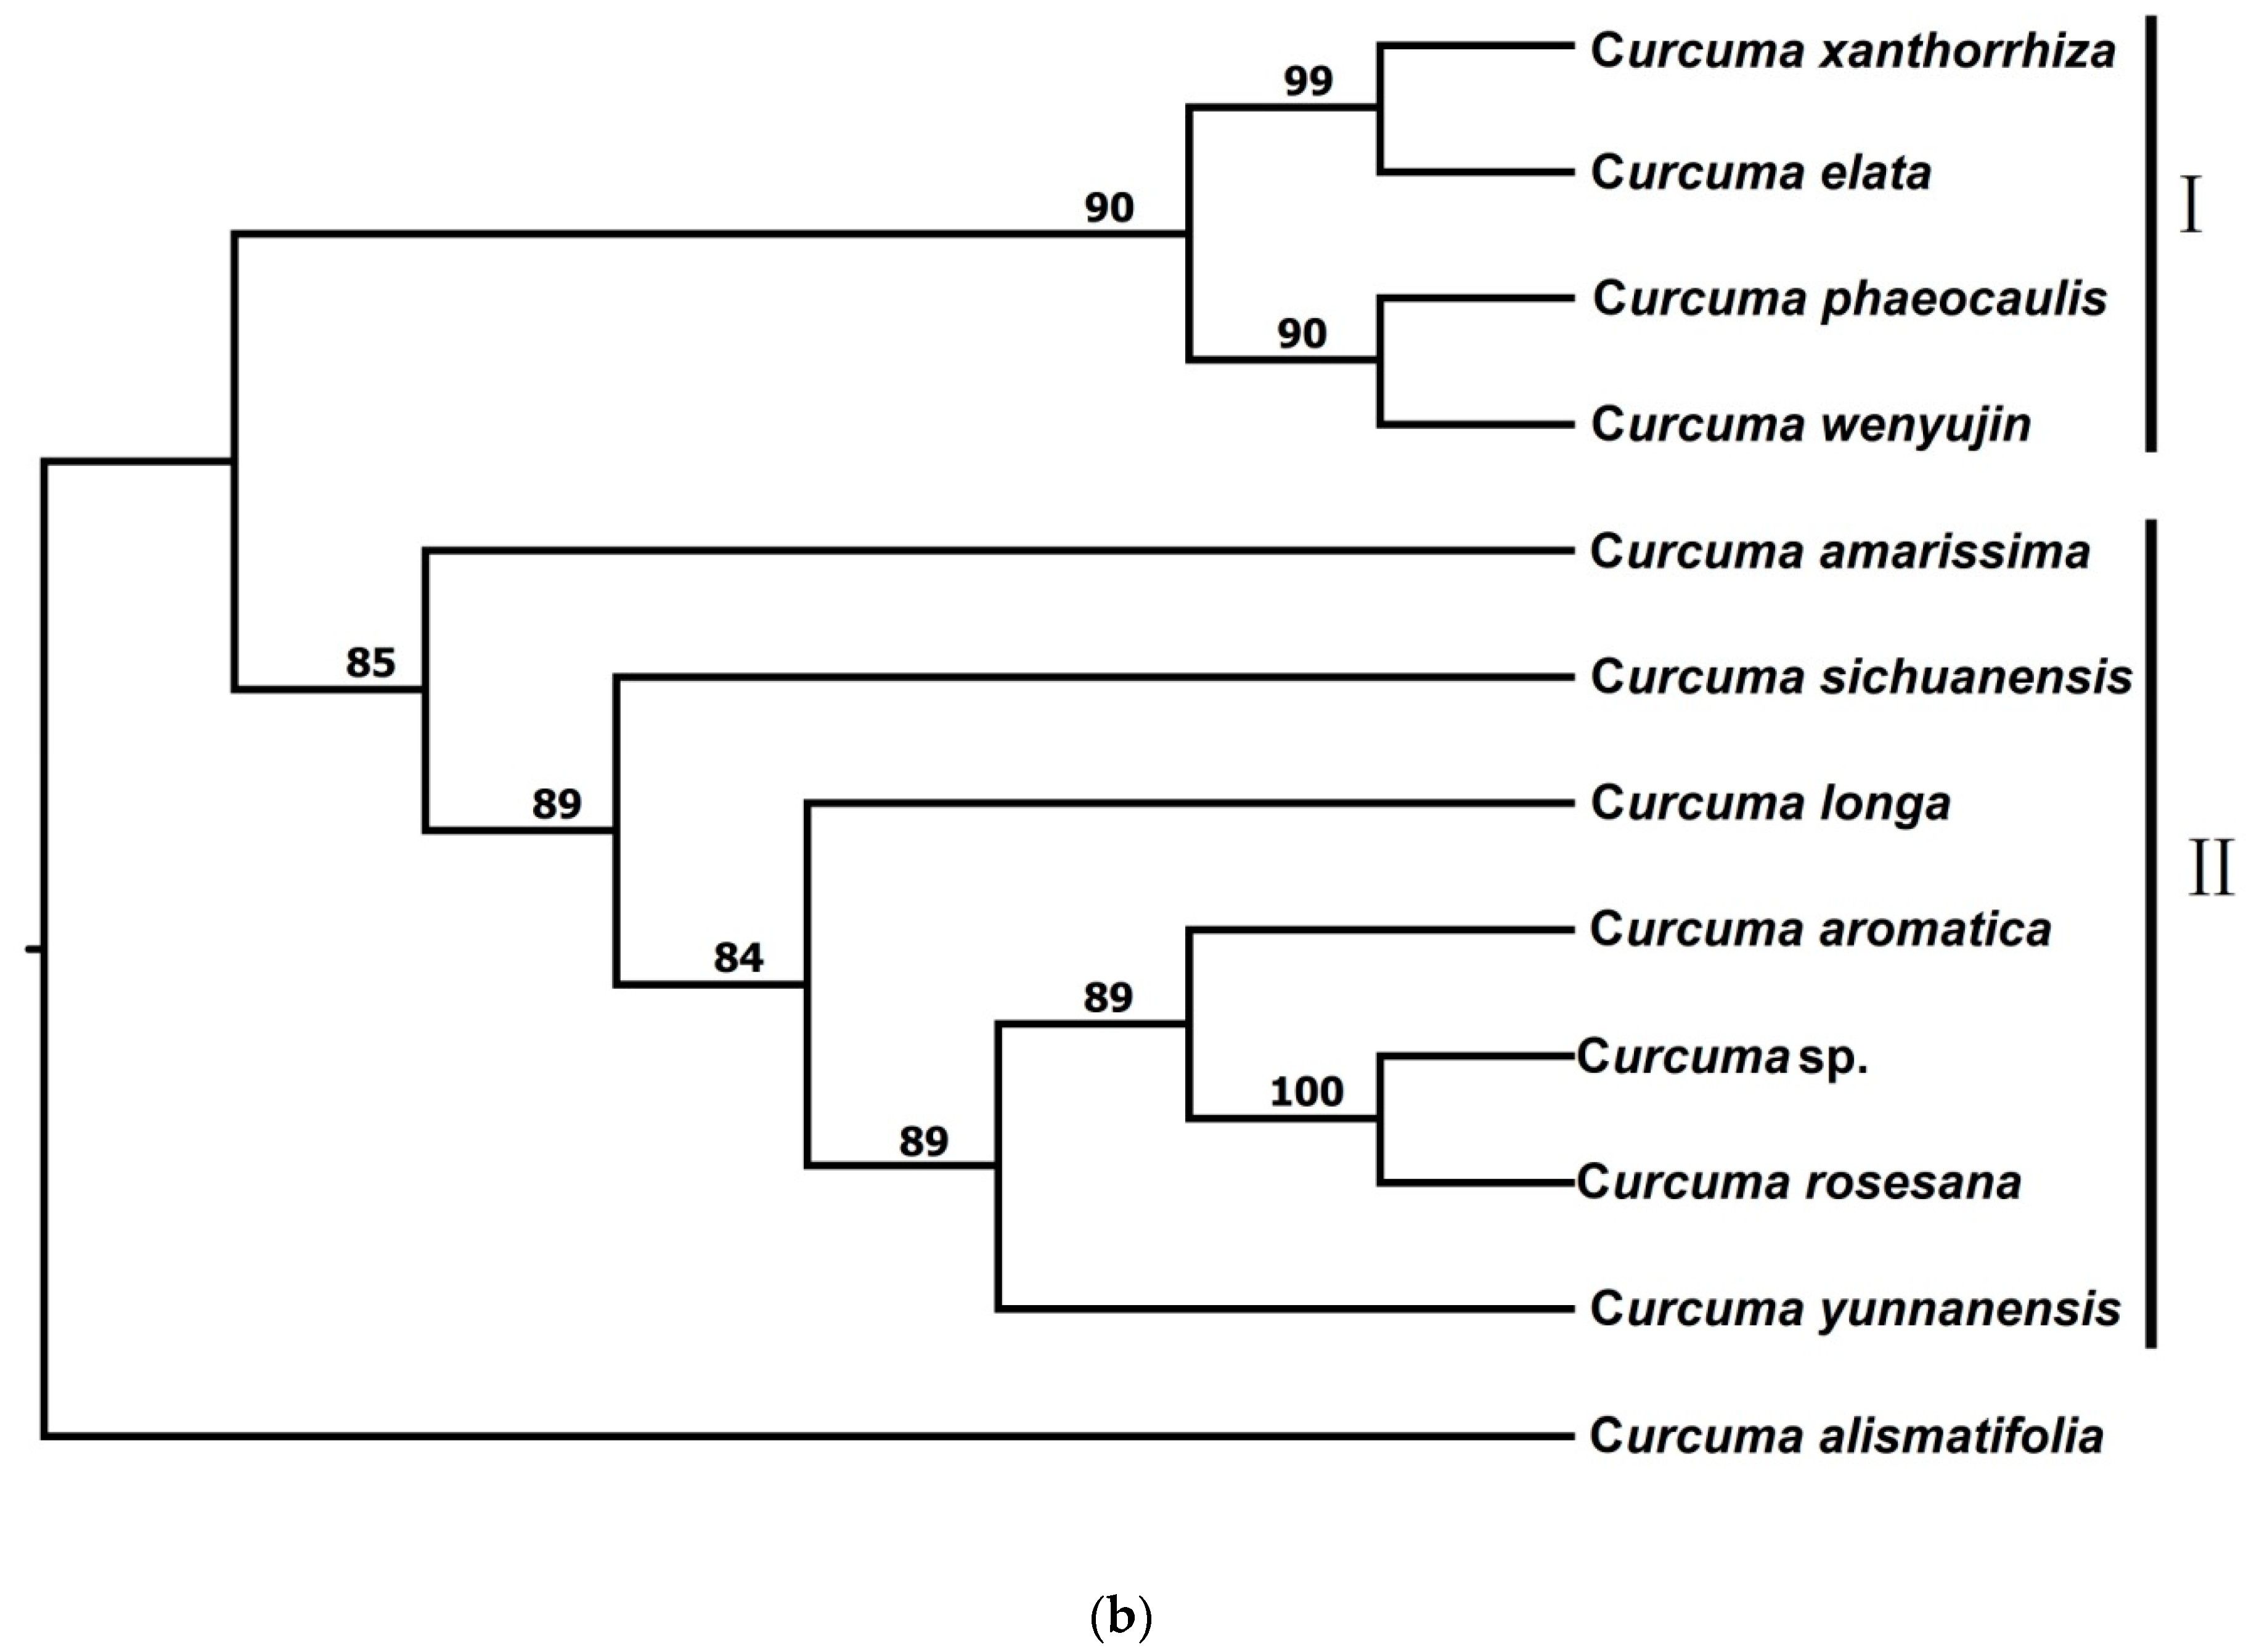
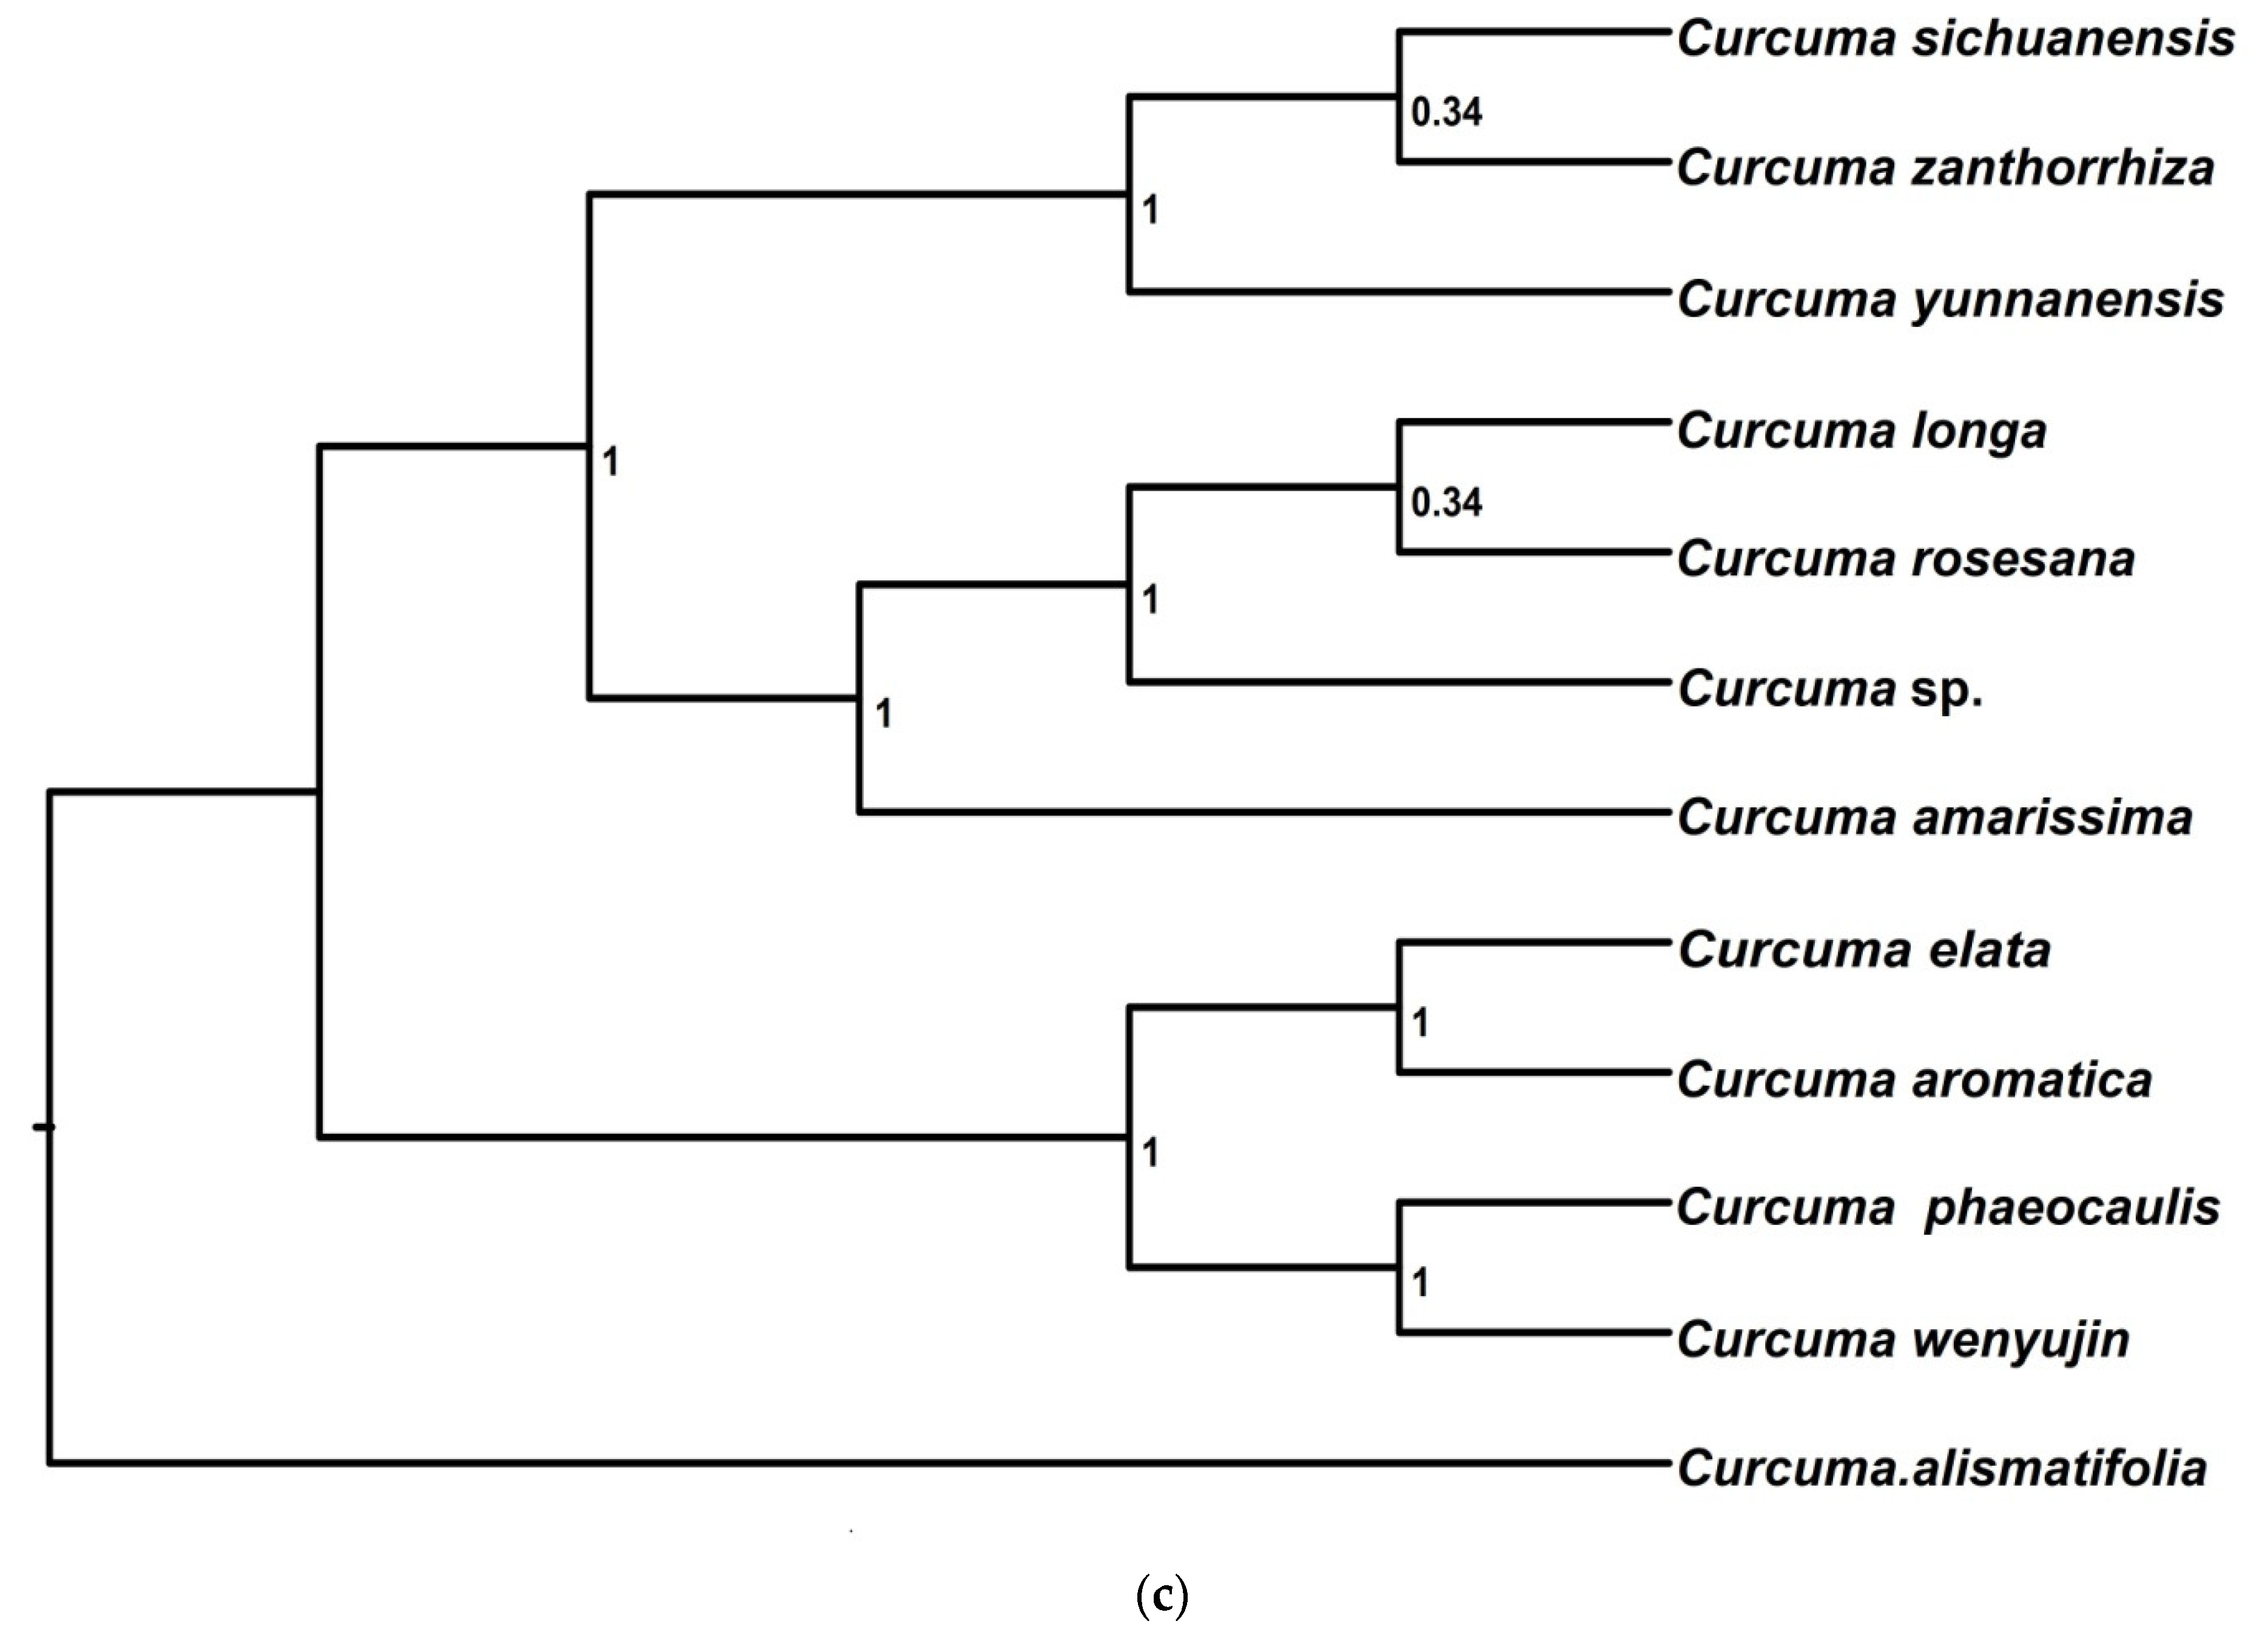
3.2.3. Phylogenetic Trees from Chloroplast Genome Data

The CP-ML trees (nine clades obtained) were constructed by the datasets of both the coding sequences (Figure 3a) and complete chloroplast genome sequences (Figure 3b), which showed a nearly unanimous topology. Based on the coding sequence region (Figure 3a), the tree formed nine clades recovered with high bootstrap support values (7 clades > 90%, 2 clades < 50%). The bootstrap support values in complete chloroplast genomes sequenced ML tree was, eight clades > 90%, one clade > 75% (Figure 3b). In Figure 3a, the relationship between C. sichuanensis and C. xanthorrhiza was < 50%, and the clade consisting of these two was nested within C. yunnanensis with 100%. This was different in Figure 3b, where C. sichuanensis was sister to C. yunnanensis, and the clade consisting of these two was nested within C. xanthorrhiza.

3.2.4. Species Tree Inference

The species tree generated different maximum clade credibility (MCC) topology than each ML tree. In the pyRAD-MCC tree (Figure 4a), all clades had a posterior probability (pp) > 0.99, and the topology was ((((((C. xanthorrhiza, C. elata), (C. phaeocaulis, C. wenyujin)), C. amarissima), ((C. yunnanensis, C. sichuanensis), C. longa)), ((C. sp., C. rosesana), C. aromatica)), C. alismatifolia), which was different from the topology in Figure 1b. In the STACKS-MCC tree (Figure 4b), the Chinese Curcuma species were divided into two groups with robust PP: Group I (including C. xanthorrhiza clade, C. elata clade, C. phaeocaulis clade, C. wenyujin clade, and C. amarissima clade) with pp = 1; Group II (including C. longa clade, C. sichuanensis clade, C. rosesana clade, C. sp. clade, C. yunnanensis clade, and C. aromatica clade) with pp = 1. In the CP-MCC tree (Figure 4c), only two clades had a pp of <0.40, and the rest was >0.99. The topology of species tree recovered in a slightly different topology of ML trees, such as C. longa and C. rosesana were sisters in Figure 4c, while C. rosesana was sister to C. sp. in Figure 3a.

3.2.5. Inconsistency of Inferred Trees

In Table 2, the topological scores are used to show how consistently the datasets infer the same tree using different phylogenetic inference methods. The pair-wise comparisons of all trees using ddRAD and chloroplast genome data (super-matrix ML, partitioned loci ML, coding sequence ML, complete chloroplast genomes sequence ML, and multi-locus species tree) were rated by overall topological scores, and the percentage of each tree topology was representative of the percent similarity. In this study, the scores ranging from 85% to 100% were defined as “consistency” and those <85% were defined as “inconsistency”.

4. Discussion

4.1. Phylogenetic Incompatibility and Biological Implications

Generally, The trees inferred using ddRAD and chloroplast genome data showed inconsistency. The ML tree of ddRAD and chloroplast genome data returned the entirely different tree (3 of 34 values > 85%) in Table 2. In the pyRAD-ML trees, the topology in Figure 1a was inconsistent with that in Figure 1b, with a score of 52.0%, and its topological scores were 44.7–76.1% compared with those of other trees. In the STACKS-ML trees, the two topological scores were 64.0%, revealing inconsistency between Figure 2a,b, and 45.7–76.1% compared with those of other trees. The score of CP-ML trees (Figure 3a,b) was 92.60% in “consistency”. Internally, the topological scores of MCC with the BEAST tree in “consistency” were 81.5% (Figure 4a,b), 56.3% (Figure 4a–c), and 54.1% (Figure 4b,c). The large-scale orogeny often leads to the rapid diversification of species, which tends to cause phylogenetic incompatibility [37]. Recently, Liang et al. (2021) [9] inferred that an initial divergence of Chinese Curcuma in the Hengduan Mountains of QTP occurred in the Miocene (~7.45 Mya), and the interspecific divergence of Chinese Curcuma occurred in ca. 4–2 Mya (in the Pliocene) when the third intense uplift of QTP changed the geographical environment, climate, and species distribution/divergence in China and eastern Asia [64]. Based on our dataset, the incompatibility between nuclear-ddRAD and chloroplast data was recovered among the species of Curcuma, mainly appearing in the nuclear vs. chloroplast data trees. The chloroplast genomes are highly conserved and have slow mutation rates. The chloroplast data trees recovered using the two datasets were practically consistent. However, the nuclear-ddRAD data trees showed incompatibility in different software pipelines. Topological incompatibility among the six datasets (corresponding to chloroplast and ddRAD) was also distinct in the visualization of topological scores (Table 2). Phylogenetic analysis of our chloroplast genome and ddRAD data corroborated the rapid diversification of the interspecific divergence of Chinese Curcuma, which resulted in the inconsistency in topologies [65]. Altogether, Curcuma in the QTP showed a complex history of ecological diversification in this study, which is consistent with a previous study [9].
Moreover, polyploidization and hybridization are common in nature, and the relationships among them were complex, particularly among close species. Most Curcuma (e.g., C. aromatica and C. kwangsiensis) were considered to be of (paleo) polyploid origin [10,66]. The incompatibility in Chinese Curcuma occurs within a given evolutionary lineage that might be a consequence of polyploidization and hybridization.

4.2. The Genomic Data for Inferring the Phylogeny of Curcuma

Inferring phylogenetic relationships among closely related and rapid diversifying lineages is a current crucial issue, and NGS might help overcome such questions [46,47,54,67]. As one of the NGS techniques, ddRAD is a superior method for the systematic study of closely related species [24]. In this research, the big data of nuclear-ddRAD and chloroplast genome were used to explore the rapid diversification of Curcuma in QTP, which represents a significant increase in data amounts compared with previous studies [9,10,13,14,15,66]. Additionally, different datasets from genomic data were compared to infer incongruent results and argue against using only a single tree inference ratiocination in previous studies [68]. The conflicting phylogenomic signals for species relationships occurred in the phylogenetic trees using the genomic datasets with multiple tree methods introduced in this study.
With the rapid development of genomic techniques, it is easy to obtain big genomic data. However, selecting an appropriate or optimal analysis method remains difficult. Two significant analytical methods were needed to analyze the combined data: (1) the datasets used in a concatenated or partitioned super-matrix and (2) how much missing data (N) could be permitted in the datasets during analysis. However, a common phenomenon of the combined data is that large genomic datasets outweigh phylogenetic tree discordance [37,69,70], which instigates an ongoing discussion. To solve this problem, Tonini et al. (2015) reported that coalescent methods could perform well as a super-matrix [71]. Moreover, for the rapid diversification and ancient radiation of plants, the concatenation approach is preferred over other methods [72]. According to this study, the BI-tree obtained in BEAST showed well-supported evidence compared with that obtained with other methods (e.g., MP tree and ML tree) using the concatenated datasets.

5. Conclusions

It can be concluded that using a genomic approach to sequence more accessions per species and related species in QTP will increase the reliability of Chinese Curcuma’s phylogenetic relationships and their evolutionary history. The phylogenetic incompatibility arising from the nuclear and chloroplast data trees supports the previous hypotheses that the third intense uplift of QTP might have accelerated the interspecific divergence of Curcuma in China. Hence, to better clarify the evolutionary history of Curcuma, the inclusion of more taxa will be vital.

Supplementary Materials

The following are available online at https://www.mdpi.com/article/10.3390/f13020280/s1, Table S1: The GenBank accession numbers of the chloroplast genome of 12 Curcuma.

Author Contributions

H.L., J.D. and R.Y. designed the experiments and analyzed the data. H.L. wrote the original manuscript. G.G. and J.D. collected the plant materials. L.Z. and C.D. assisted with manuscript preparation. All authors have read and agreed to the published version of the manuscript.

Funding

This study was supported by the Science and Technology Department of Guizhou Province (Qiankehejichu [2017] 1138), Guizhou Province Education Department (Qianjiaohe KY [2016] 221), and National Natural Science Foundation of China (Grant no. 32001390).

Data Availability Statement

These plant materials are required for the collection of plant individuals. The plant materials are maintained in accordance with the institutional guidelines of Xishuangbanna Tropical Botanical Garden, Chinese Academy of Sciences, China. The Raw Reads are available in NCBI BioProject ID: PRJNA745037. The GenBank accession numbers of chloroplast genome are available in NCBI: MT395655, MT395645, MT395646, MT395649, MT395651, MT395644, MT395657, MT395653, MT395650, MT395652, MT395654 and MT395647.

Acknowledgments

We are grateful to Chuanbei Jiang (Genepioneer Biotechnologies Co. Ltd., Nanjing, China) for assistance in ddRAD library preparation and for helping us run pyRAD, STACKS and kindly providing additional help in assembly programs. My sincere gratitude also goes to Keyan Zhang (Xishuangbanna Tropical Botanical Garden, Chinese Academy of Sciences, Yunnan, China) for valuable comments for this study.

Conflicts of Interest

The authors declare no conflict of interest.

References

  1. Givnish, T. Adaptive radiation and molecular systematics: Aims and conceptual issues. In Molecular Evolution and Adaptive Radiation; Givnish, T.J.S.K., Ed.; Cambridge University Press: New York, NY, USA, 1997; pp. 1–54. [Google Scholar]
  2. Li, J. The Qinghai-Tibet Plateau Uplifting and Environmental Evolution in Asia: Article Collection of Academician; Science Press: Beijing, China, 2006. [Google Scholar]
  3. Liu, X.; Dong, B. Influence of the Tibetan Plateau uplift on the Asian monsoon-arid environment evolution. Chin. Sci. Bull. 2013, 58, 4277–4291. [Google Scholar] [CrossRef] [Green Version]
  4. Hoorn, C.; Mosbrugger, V.; Mulch, A.; Antonelli, A. Biodiversity from mountain building. Nat. Geosci. 2013, 6, 154. [Google Scholar] [CrossRef]
  5. Wen, J.; Zhang, J.-Q.; Nie, Z.-L.; Zhong, Y.; Sun, H. Evolutionary diversifications of plants on the Qinghai-Tibetan Plateau. Front. Genet. 2014, 5, 4. [Google Scholar] [CrossRef] [Green Version]
  6. Favre, A.; Päckert, M.; Pauls, S.U.; Jähnig, S.C.; Uhl, D.; Michalak, I.; Muellner-Riehl, A.N. The role of the uplift of the Qinghai-Tibetan Plateau for the evolution of Tibetan biotas. Biol. Rev. 2015, 90, 236–253. [Google Scholar] [CrossRef] [PubMed]
  7. Xing, Y.W.; Ree, R.H. Uplift-driven diversification in the Hengduan Mountains, a temperate biodiversity hotspot. Proc. Natl. Acad. Sci. USA 2017, 114, E3444–E3451. [Google Scholar] [CrossRef] [Green Version]
  8. Fan, D.M.; Yue, J.P.; Nie, Z.L.; Li, Z.M.; Comes, H.P.; Sun, H. Phylogeography of Sophora davidii (Leguminosae) across the ‘Tanaka-Kaiyong Line’, an important phytogeographic boundary in Southwest China. Mol. Ecol. 2013, 22, 4270–4288. [Google Scholar] [CrossRef]
  9. Liang, H.; Deng, J.; Gao, G.; Ding, C.; Zhang, L.; Xu, K.; Wang, H.; Yang, R. Inferring the Phylogeny and Divergence of Chinese Curcuma (Zingiberaceae) in the Hengduan Mountains of the Qinghai–Tibet Plateau by Reduced Representation Sequencing. Forests 2021, 12, 520. [Google Scholar] [CrossRef]
  10. Záveská, E.; Fér, T.; Šída, O.; Krak, K.; Marhold, K.; Leong-Škorničková, J. Phylogeny of Curcuma (Zingiberaceae) based on plastid and nuclear sequences: Proposal of the new subgenus Ecomata. TAXON 2012, 61, 747–763. [Google Scholar] [CrossRef]
  11. Kress, W.J.; Prince, L.M.; Williams, K.J. The phylogeny and a new classification of the gingers (Zingiberaceae): Evidence from molecular data. Am. J. Bot. 2002, 89, 1682–1696. [Google Scholar] [CrossRef]
  12. Nian, L.; Telin, W. Notes on Curcuma in China. J. Trop. Subtrop. Bot. 1999, 7, 146–150. [Google Scholar]
  13. Chen, J.; Zhao, J.; Erickson, D.L.; Xia, N.; Kress, W.J. Testing DNA barcodes in closely related species of Curcuma (Zingiberaceae) from Myanmar and China. Mol. Ecol. Resour. 2015, 15, 337–348. [Google Scholar] [CrossRef] [PubMed]
  14. Deng, J.B.; Ding, C.; Zhang, L.; Zhou, Y.; Yang, R. Relationships among six herbal species (Curcuma) assessed by four isozymes. Phyton 2011, 80, 181–188. [Google Scholar]
  15. Deng, J.B.; Ding, C.; Zhang, L.; Yang, R.; Yang, R. Authentication of three related herbal species (Curcuma) by DNA barcoding. J. Med. Plants Res. 2011, 5, 6401–6406. [Google Scholar]
  16. Deng, J.; Liang, H.; Zhang, L.; Zhang, W.; Zhang, G.; Luo, X.; Yang, R.; Ahmad, K.S. Evaluation on genetic relationships among China’s endemic Curcuma L. herbs by mtDNA. Phyton 2018, 87, 156–161. [Google Scholar]
  17. Chen, J.; Xia, N.-H. Pollen morphology of Chinese Curcuma L. and Boesenbergia Kuntz (Zingiberaceae): Taxonomic implications. Flora-Morphol. Distrib. Funct. Ecol. Plants 2011, 206, 458–467. [Google Scholar] [CrossRef]
  18. Xiao, X.-H.; Shu, G.-M.; Li, L.Y.; Fang, Q.M.; Xia, W.J.; Su, Z.W. Histological and morphological studies on the rhizomes of Curcuma. China J. Chin. Mater. Med. 2004, 29, 395–399. [Google Scholar]
  19. Xiao, X.-H.; Zhao, Y.-L.; Jin, C.; Shu, G.-M.; Fang, Q.-M.; Shu, Z.W. Histological and morphological studies on leaves of Curcuma in China. China J. Chin. Mater. Med. 2004, 29, 203–207. [Google Scholar]
  20. Záveská, E.; Fér, T.; Šída, O.; Marhold, K.; Leong-Škorničková, J. Hybridization among distantly related species: Examples from the polyploid genus Curcuma (Zingiberaceae). Mol. Phylogenetics Evol. 2016, 100, 303–321. [Google Scholar] [CrossRef]
  21. Cao, H.; Sasaki, Y.; Fushimi, H.; Komatsu, K. Molecular Analysis of Medicinally-Used Chinese and Japanese Curcuma Based on 18S rRNA Gene and trnK Gene Sequences. Biol. Pharm. Bull. 2001, 24, 1389–1394. [Google Scholar] [CrossRef] [Green Version]
  22. Steven, G.; Subramanyam, R. Testing plant barcoding in a sister species complex of pantropical Acacia (Mimosoideae, Fabaceae). Mol. Ecol. Resour. 2009, 9, 172–180. [Google Scholar] [CrossRef]
  23. Lemmon, E.M.; Lemmon, A.R. High-Throughput Genomic Data in Systematics and Phylogenetics. Annu. Rev. Ecol. Evol. Syst. 2013, 44, 99–121. [Google Scholar] [CrossRef] [Green Version]
  24. Harvey, M.G.; Smith, B.T.; Glenn, T.C.; Faircloth, B.C.; Brumfield, R.T. Sequence capture versus restriction site associated DNA sequencing for shallow systematics. Syst. Biol. 2016, 65, 910–924. [Google Scholar] [CrossRef] [PubMed] [Green Version]
  25. Godden, G.T.; Jordon-Thaden, I.E.; Chamala, S.; Crowl, A.A.; García, N.; Germain-Aubrey, C.C.; Heaney, J.M.; Latvis, M.; Qi, X.; Gitzendanner, M.A. Making next-generation sequencing work for you: Approaches and practical considerations for marker development and phylogenetics. Plant Ecol. Divers. 2012, 5, 427–450. [Google Scholar] [CrossRef]
  26. Baird, N.A.; Etter, P.D.; Atwood, T.S.; Currey, M.C.; Shiver, A.L.; Lewis, Z.A.; Selker, E.U.; Cresko, W.A.; Johnson, E.A. Rapid SNP Discovery and Genetic Mapping Using Sequenced RAD Markers. PLoS ONE 2008, 3, e3376. [Google Scholar] [CrossRef]
  27. Poland, J.A.; Brown, P.J.; Sorrells, M.E.; Jannink, J.-L. Development of High-Density Genetic Maps for Barley and Wheat Using a Novel Two-Enzyme Genotyping-by-Sequencing Approach. PLoS ONE 2012, 7, e32253. [Google Scholar] [CrossRef] [PubMed] [Green Version]
  28. Elshire, R.J.; Glaubitz, J.C.; Sun, Q.; Poland, J.A.; Kawamoto, K.; Buckler, E.S.; Mitchell, S.E. A Robust, Simple Genotyping-by-Sequencing (GBS) Approach for High Diversity Species. PLoS ONE 2011, 6, e19379. [Google Scholar] [CrossRef] [Green Version]
  29. McCormack, J.E.; Hird, S.M.; Zellmer, A.J.; Carstens, B.C.; Brumfield, R.T. Applications of next-generation sequencing to phylogeography and phylogenetics. Mol. Phylogenetics Evol. 2013, 66, 526–538. [Google Scholar] [CrossRef]
  30. Eaton, D.A.; Spriggs, E.L.; Park, B.; Donoghue, M.J. Data from: Misconceptions on missing data in RAD-seq phylogenetics with a deep-scale example from flowering plants. Syst. Biol. 2016, 66, 399–412. [Google Scholar] [CrossRef] [Green Version]
  31. Massatti, R.; Reznicek, A.A.; Knowles, L.L. Utilizing RADseq data for phylogenetic analysis of challenging taxonomic groups: A case study in Carex sect. Racemosae. Am. J. Bot. 2016, 103, 337–347. [Google Scholar] [CrossRef] [Green Version]
  32. Hipp, A.L.; Manos, P.S.; González-Rodríguez, A.; Hahn, M.; Kaproth, M.; McVay, J.D.; Avalos, S.V.; Cavender-Bares, J. Sympatric parallel diversification of major oak clades in the Americas and the origins of Mexican species diversity. New Phytol. 2018, 217, 439–452. [Google Scholar] [CrossRef] [Green Version]
  33. Liu, J.-X.; Zhou, M.-Y.; Yang, G.-Q.; Zhang, Y.-X.; Ma, P.-F.; Guo, C.; Vorontsova, M.S.; Li, D.-Z. ddRAD analyses reveal a credible phylogenetic relationship of the four main genera of Bambusa-Dendrocalamus-Gigantochloa complex (Poaceae: Bambusoideae). Mol. Phylogenetics Evol. 2020, 146, 106758. [Google Scholar] [CrossRef] [PubMed]
  34. Lin, H.-Y.; Hao, Y.-J.; Li, J.-H.; Fu, C.-X.; Soltis, P.S.; Soltis, D.E.; Zhao, Y.-P. Phylogenomic conflict resulting from ancient introgression following species diversification in Stewartia s.l. (Theaceae). Mol. Phylogenetics Evol. 2019, 135, 1–11. [Google Scholar] [CrossRef] [PubMed]
  35. Spriggs, E.L.; Eaton, D.A.R.; Sweeney, P.W.; Schlutius, C.; Edwards, E.J.; Donoghue, M.J. Restriction-Site-Associated DNA Sequencing Reveals a Cryptic Viburnum Species on the North American Coastal Plain. Syst. Biol. 2019, 68, 187–203. [Google Scholar] [CrossRef] [PubMed]
  36. Hauser, D.A.; Keuter, A.; McVay, J.D.; Hipp, A.L.; Manos, P.S. The evolution and diversification of the red oaks of the California Floristic Province (Quercus section Lobatae, series Agrifoliae). Am. J. Bot. 2017, 104, 1581–1595. [Google Scholar] [CrossRef] [PubMed] [Green Version]
  37. Vargas, O.M.; Ortiz, E.M.; Simpson, B.B. Conflicting phylogenomic signals reveal a pattern of reticulate evolution in a recent high-Andean diversification (Asteraceae: Astereae: Diplostephium). New Phytol. 2017, 214, 1736–1750. [Google Scholar] [CrossRef] [PubMed] [Green Version]
  38. Li, D.-M.; Zhu, G.-F.; Xu, Y.-C.; Ye, Y.-J.; Liu, J.-M. Complete Chloroplast Genomes of Three Medicinal Alpinia Species: Genome Organization, Comparative Analyses and Phylogenetic Relationships in Family Zingiberaceae. Plants 2020, 9, 286. [Google Scholar] [CrossRef] [Green Version]
  39. Gui, L.; Jiang, S.; Xie, D.; Yu, L.; Huang, Y.; Zhang, Z.; Liu, Y. Analysis of complete chloroplast genomes of Curcuma and the contribution to phylogeny and adaptive evolution. Gene 2020, 732, 144355. [Google Scholar] [CrossRef]
  40. Gonçalves, D.J.; Simpson, B.B.; Ortiz, E.M.; Shimizu, G.H.; Jansen, R.K. Incongruence between gene trees and species trees and phylogenetic signal variation in plastid genes. Mol. Phylogenetics Evol. 2019, 138, 219–232. [Google Scholar] [CrossRef]
  41. Saarela, J.M.; Burke, S.V.; Wysocki, W.P.; Barrett, M.D.; Clark, L.G.; Craine, J.M.; Peterson, P.M.; Soreng, R.J.; Vorontsova, M.S.; Duvall, M.R. A 250 plastome phylogeny of the grass family (Poaceae): Topological support under different data partitions. PeerJ 2018, 6, e4299. [Google Scholar] [CrossRef]
  42. Neuhaus, H.E.; Emes, M.J. Nonphotosynthetic metabolism in plastids. Annu. Rev. Plant Biol. 2000, 51, 111–140. [Google Scholar] [CrossRef]
  43. Palmer, J.D.; Jansen, R.K.; Michaels, H.J.; Chase, M.W.; Manhart, J.R. Chloroplast DNA Variation and Plant Phylogeny. Ann. Mo. Bot. Gard. 1988, 75, 1180. [Google Scholar] [CrossRef]
  44. Gu, C.; Ma, L.; Wu, Z.; Chen, K.; Wang, Y. Comparative analyses of chloroplast genomes from 22 Lythraceae species: Inferences for phylogenetic relationships and genome evolution within Myrtales. BMC Plant Biol. 2019, 19, 281. [Google Scholar] [CrossRef] [PubMed]
  45. Rogalski, M.; Vieira, L.D.N.; Fraga, H.; Guerra, M.P. Plastid genomics in horticultural species: Importance and applications for plant population genetics, evolution, and biotechnology. Front. Plant Sci. 2015, 6, 586. [Google Scholar] [CrossRef] [PubMed] [Green Version]
  46. Liang, H.; Chen, J. Comparison and Phylogenetic Analyses of Nine Complete Chloroplast Genomes of Zingibereae. Forests 2021, 12, 710. [Google Scholar] [CrossRef]
  47. Liang, H.; Zhang, Y.; Deng, J.; Gao, G.; Ding, C.; Zhang, L.; Yang, R. The Complete Chloroplast Genome Sequences of 14 Curcuma Species: Insights Into Genome Evolution and Phylogenetic Relationships Within Zingiberales. Front. Genet. 2020, 11, 802. [Google Scholar] [CrossRef] [PubMed]
  48. Guo, C.; Ma, P.F.; Yang, G.Q.; Ye, X.Y.; Guo, Y.; Liu, J.X.; Liu, Y.L.; Eaton, D.A.; Guo, Z.H.; Li, D.Z. Parallel ddRAD and genome skimming analyses reveal a radiative and reticulate evolutionary history of the temperate bamboos. Syst. Biol. 2021, 70, 756–773. [Google Scholar] [CrossRef] [PubMed]
  49. Sun, M.; Soltis, D.E.; Soltis, P.S.; Zhu, X.; Burleigh, J.G.; Chen, Z. Data from: Deep phylogenetic incongruence in the angiosperm clade Rosidae. Mol. Phylogenetics Evol. 2015, 83, 156–166. [Google Scholar] [CrossRef]
  50. Seehausen, O. Hybridization and adaptive radiation. Trends Ecol. Evol. 2004, 19, 198–207. [Google Scholar] [CrossRef]
  51. Zhang, X.; Zhou, T.; Kanwal, N.; Zhao, Y.; Bai, G.; Zhao, G. Completion of Eight Gynostemma BL. (Cucurbitaceae) Chloroplast Genomes: Characterization, Comparative Analysis, and Phylogenetic Relationships. Front. Plant Sci. 2017, 8, 1583. [Google Scholar] [CrossRef] [Green Version]
  52. Yang, G.-Q.; Chen, Y.-M.; Wang, J.-P.; Guo, C.; Zhao, L.; Wang, X.-Y.; Guo, Y.; Li, L.; Li, D.-Z.; Guo, Z.-H. Development of a universal and simplified ddRAD library preparation approach for SNP discovery and genotyping in angiosperm plants. Plant Methods 2016, 12, 39. [Google Scholar] [CrossRef] [Green Version]
  53. Catchen, J.; Hohenlohe, P.A.; Bassham, S.; Amores, A.; Cresko, W.A. Stacks: An analysis tool set for population genomics. Mol. Ecol. 2013, 22, 3124–3140. [Google Scholar] [CrossRef] [PubMed] [Green Version]
  54. Eaton, D.; Ree, R.H. Inferring Phylogeny and Introgression using RADseq Data: An Example from Flowering Plants (Pedicularis: Orobanchaceae). Syst. Biol. 2013, 62, 689–706. [Google Scholar] [CrossRef] [PubMed] [Green Version]
  55. Qi, Z.-C.; Yu, Y.; Liu, X.; Pais, A.; Ranney, T.G.; Whetten, R.W.; Xiang, J. Phylogenomics of polyploid Fothergilla (Hamamelidaceae) by RAD-tag based GBS-insights into species origin and effects of software pipelines. J. Syst. Evol. 2015, 53, 432–447. [Google Scholar] [CrossRef]
  56. Edgar, R.C. Search and clustering orders of magnitude faster than BLAST. Bioinformatics 2010, 26, 2460–2461. [Google Scholar] [CrossRef] [Green Version]
  57. Stamatakis, A. RAxML-VI-HPC: Maximum likelihood-based phylogenetic analyses with thousands of taxa and mixed models. Bioinformatics 2006, 22, 2688–2690. [Google Scholar] [CrossRef]
  58. Darriba, D.; Taboada, G.L.; Doallo, R.; Posada, D. jModelTest 2: More models, new heuristics and parallel computing. Nat. Methods 2012, 9, 772. [Google Scholar] [CrossRef] [Green Version]
  59. Guindon, S.; Gascuel, O. A Simple, Fast, and Accurate Algorithm to Estimate Large Phylogenies by Maximum Likelihood. Syst. Biol. 2003, 52, 696–704. [Google Scholar] [CrossRef] [Green Version]
  60. Katoh, K.; Kuma, K.I.; Toh, H.; Miyata, T. MAFFT version 5: Improvement in accuracy of multiple sequence alignment. Nucleic Acids Res. 2005, 33, 511–518. [Google Scholar] [CrossRef]
  61. Heled, J.; Drummond, A.J. Bayesian Inference of Species Trees from Multilocus Data. Mol. Biol. Evol. 2010, 27, 570–580. [Google Scholar] [CrossRef] [Green Version]
  62. Drummond, A.J.; Rambaut, A. BEAST: Bayesian evolutionary analysis by sampling trees. BMC Evol. Biol. 2007, 7, 214. [Google Scholar] [CrossRef] [Green Version]
  63. Nye, T.M.W.; Liò, P.; Gilks, W.R. A novel algorithm and web-based tool for comparing two alternative phylogenetic trees. Bioinformatics 2005, 22, 117–119. [Google Scholar] [CrossRef] [PubMed]
  64. Biasatti, D.; Wang, Y.; Gao, F.; Xu, Y.; Flynn, L. Paleoecologies and paleoclimates of late cenozoic mammals from Southwest China: Evidence from stable carbon and oxygen isotopes. J. Southeast Asian Earth Sci. 2012, 44, 48–61. [Google Scholar] [CrossRef]
  65. Sun, K.; Liu, Q.-Y.; Wang, A.; Gao, Y.-W.; Zhao, L.-C.; Guan, W.-B. Comparative Analysis and Phylogenetic Implications of Plastomes of Five Genera in Subfamily Amyridoideae (Rutaceae). Forests 2021, 12, 277. [Google Scholar] [CrossRef]
  66. Leong-Škorničková, J.; Šída, O.; Jarolímová, V.; Sabu, M.; Fér, T.; Trávníček, P.; Suda, J. Chromosome Numbers and Genome Size Variation in Indian Species of Curcuma (Zingiberaceae). Ann. Bot. 2007, 100, 505–526. [Google Scholar] [CrossRef] [Green Version]
  67. Mario, F.M.; Greg, M.; Beatriz, V.; Llorenç, S.; Pablo, V.; Glover, B.J. Resolving Recent Plant Radiations: Power and Robustness of Genotyping-by-Sequencing. Syst. Biol. 2017, 2, 2. [Google Scholar]
  68. Lee, J.Y.; Joseph, L.; Edwards, S.V. A Species Tree for the Australo-Papuan Fairy-wrens and Allies (Aves: Maluridae). Syst. Biol. 2012, 61, 253–271. [Google Scholar] [CrossRef] [Green Version]
  69. Wagner, C.E.; Keller, I.; Wittwer, S.; Selz, O.M.; Mwaiko, S.; Greuter, L.; Sivasundar, A.; Seehausen, O. Data from: Genome-wide RAD sequence data provide unprecedented resolution of species boundaries and relationships in the Lake Victoria cichlid adaptive radiation. Mol. Ecol. 2022, 3, 787–798. [Google Scholar]
  70. Dupuis, J.R.; Brunet, B.M.T.; Bird, H.M.; Lumley, L.M.; Fagua, G.; Boyle, B.; Levesque, R.; Cusson, M.; Powell, J.A.; Sperling, F.A.H. Genome-wide SNPs resolve phylogenetic relationships in the North American spruce budworm (Choristoneura fumiferana) species complex. Mol. Phylogenet Evol. 2017, 111, 158–168. [Google Scholar] [CrossRef]
  71. Tonini, J.; Moore, A.; Stern, D.; Shcheglovitova, M.; Ortí, G. Concatenation and Species Tree Methods Exhibit Statistically Indistinguishable Accuracy under a Range of Simulated Conditions. PLoS Curr. 2015, 7, 7. [Google Scholar] [CrossRef]
  72. Bombonato, J.R.; do Amaral, D.T.; Silva, G.A.R.; Khan, G.; Moraes, E.M.; da Silva Andrade, S.C.; Eaton, D.A.R.; Alonso, D.P.; Ribolla, P.E.M.; Taylor, N.; et al. The potential of genome-wide RAD sequences for resolving rapid radiations: A case study in Cactaceae. Mol. Phylogenetics Evol. 2020, 151, 106896. [Google Scholar] [CrossRef]
Figure 1. Phylogenetic trees of Curcuma inferred from maximum likelihood (ML) using (a) full concatenated super-matrix dataset and (b) concatenated 902 loci dataset by pyRAD. The ML bootstrap values were presented on the species clade. Only bootstrap values greater than 50 are shown. In Figure 1a, Group I consisted of C. longa, C. sichuanensis, C. sp., C. rosesana, and C. yunnanensis; Group II consisted of C. wenyujin, C. aromatic, C. amarissima, C. phaeocaulis, C. elata, and C. xanthorrhiza. In Figure 1b, Group I consisted of C. yunnanensis, C. sichuanensis, C. sp., C. rosesana, C. longa, C. amarissima, and C. aromatica, and Group II consisted of C. phaeocaulis, C. wenyujin, C. xanthorrhiza, and C. elata.
Forests 13 00280 g001aForests 13 00280 g001b
Figure 2. Phylogenetic trees of Curcuma inferred from maximum likelihood (ML) using (a) full concatenated super-matrix data and (b) concatenated 8574 loci by STACKS. The ML bootstrap values were presented on the species clade. Only bootstrap values greater than 50 are shown. In Figure 2a, Group I consisted of C. elata, C. xanthorrhiza, and C. amarissima; Group II consisted of C. aromatica, C. wenyujin, C. phaeocaulis, C. rosesana, C. sp., C. yunnanensis, C. sichuanensis, and C. longa. In Figure 2b, Group I consisted of C. xanthorrhiza, C. elata, C. phaeocaulis, and C. wenyujin; Group II consisted of C. sp., C. rosesana, C. aromatica, C. yunnanensis, C. longa, C. sichuanensis, and C. amarissima.
Forests 13 00280 g002aForests 13 00280 g002b
Figure 3. Phylogenetic trees of Curcuma inferring from maximum likelihood (ML) based on the chloroplast genome constructed using (a) coding sequence and (b) complete chloroplast genome sequence. The maximum likelihood bootstrap values were on the species clade. Only bootstrap values greater than 50 are shown.
Forests 13 00280 g003aForests 13 00280 g003b
Figure 4. Phylogeny from multi-locus tree inference method: MCC tree in BEAST recovered with (a) 902 loci for pyRAD, (b) 8574 loci for STACKS, and (c) coding gene for chloroplast genome, the posterior probabilities for each clade. The posterior probabilities were on the species clade. In Figure 4b, Group I consisted of C. xanthorrhiza, C. elata, C. phaeocaulis, C. wenyujin, and C. amarissima, and Group II consisted of C. longa, C. sichuanensis, C. rosesana, C. sp., C. yunnanensis, and C. aromatica.
Forests 13 00280 g004aForests 13 00280 g004b
Table 1. List of 12 Curcuma species names, with source details and total loci after processing with ipyRAD and STACKS.
SpeciesVoucher NumberLocalityTotal Loci After pyRADTotal Loci after STACKSPloidy Level
C. xanthorrhiza38, 2003, 0324Thailand47,24034,5623
C. elata00, 2005, 0073 Yunnan, China50,78432,4303
C. yunnanensisC29064Yunnan, China51,89634,0113
C. alismatifolia38, 2003, 0354Thailand47,06222,6223
C. amarissima00, 2009, 0882Yunnan, China49,62333,9743
C. sichuanensis00, 2001, 2519 Yunnan, China53,50834,7973
C. aromatica00, 2007, 0944Yunnan, China46,83737,1553
C. wenyujin00, 2010, 0862Guangxi, China59,17237,9423
C. longa00, 2008, 0868Yunnan, China52,46735,5043
C. rosesana00, 2001, 1412Guangdong, China53,48931,6333
C. sp.00, 2004, 0191 Guangdong, China59,82433,0123
C. phaeocaulis00, 2000, 0695Yunnan, China56,54838,1114
Table 2. Topological scores (%) calculated using Compare 2 Trees, showing the similarity between tree topologies with the corresponding figure numbers.
. pyRADSTACKSChloroplast Genomes
Full concatenated super-matrix with ML (Figure 1a)Concatenated loci with ML (Figure 1b)MCC with BEAST (Figure 4a)Full concatenated super-matrix with ML (Figure 2a)Concatenated loci with ML (Figure 2b)MCC with BEAST (Figure 4b)Coding sequence with ML (Figure 3a) Complete chloroplast genomes with ML (Figure 3b)MCC with BEAST (Figure 4c)
pyRADFull concatenated super-matrix with ML (Figure 1a) 52.00%55.30%76.10%56.10%69.00%50.50%50.50%44.80%
Concatenated loci with ML (Figure 1b) 70.30%53.50%69.90%66.30%72.40%76.70%65.40%
MCC with BEAST (Figure 4a) 61.50%78.90%81.50%57.50%63.30%56.30%
STACKSFull concatenated super-matrix with ML (Figure 2a) 64.00%75.60%50.90%50.90%45.70%
Concatenated loci with ML (Figure 2b) 83.30%58.40%57.90%52.50%
MCC with BEAST (Figure 4b) 55.10%55.10%54.10%
Chloroplast genomescoding sequence with ML (Figure 3a) 92.60%92.60%
complete chloroplast genomes with ML (Figure 3b) 85.20%
MCC with BEAST (Figure 4c)
Publisher’s Note: MDPI stays neutral with regard to jurisdictional claims in published maps and institutional affiliations.

