Abstract
Herein, the coupling interactions between moisture and temperature on the microwave absorption of poplar were investigated quantitatively under microwave heating at 2450 MHz. The inverse physics problems have been solved based on the microwave heating curve of poplar wood by a genetic algorithm approach. Meanwhile, the quantitative characterization equation of the microwave absorption power of poplar was obtained. The accuracy of the microwave absorption power equation was verified experimentally, and the interaction mechanism was explained. The results indicated that the microwave absorption power increased with temperature and decreased with a higher original moisture content. Compared with that, the temperature influenced the microwave absorption of poplar wood slightly more than the initial moisture content.
1. Introduction
Microwaves are electromagnetic waves with a frequency range of 300 MHz–300 GHz and can transmit information or energy. In terms of information dissemination, microwave technology is used in radar, radio astronomy, satellite communications, and other fields [1]. For energy transmission, microwave technology is used in microwave heating and wireless power transmission. Microwave power will convert to heat while objects absorbed microwave energy. Because of its selectivity, even and rapid heating, and sensitive control, it has been widely used in the food industry [2,3], chemical industry [4,5], agricultural products processing [6,7], and other fields [8,9].
Microwave heating generates heat through high-frequency reciprocating motion and friction of dipole moments within a dielectric. The efficiency of conversion from microwave energy into thermal energy is indicated by the absorption power of a dielectric [10,11]. The heat generated by microwaves in a dielectric is related to the microwave frequency f, the vacuum permittivity ε0, the dielectric loss factor ε″, and the electric field strength E. Due to their complex structures and compositions, the dielectric properties of biomass materials are closely related to the material composition, structure, moisture, temperature, and microwave frequency. The dielectric loss factor of biomass materials is related to their physical properties and external conditions. Generally, the dielectric loss factor increases with the internal water [12,13], salt [14,15], and temperature [14,16,17], but decreases with the external microwave frequency [14]. The electric field strength is usually quantitatively described by Lambert’s law [18]. Remmen et al. [19] showed that the electric field strength of the microwave field was related to the relative permittivity, dielectric loss factor, microwave frequency, and penetration depth of the dielectric. Wood, as a typical porous biomass material, contains a certain amount of water. Microwave drying [20,21,22] or puffing [23,24,25] wood will affect the wood treatment effect because of moisture and temperature change. To quantitatively characterize the microwave absorption power P of biomass dielectric materials, a comprehensive understanding of the highly coupled relationship between the dielectric properties and electric field strength of the dielectric materials is necessary. This requires simultaneously measuring the dielectric properties and electric field strength when biomass materials are heated by microwaves to investigate their interactions; however, due to the limitations of measurement equipment, studies in this area have rarely been conducted.
In this study, the heating curves of poplar wood with different initial moisture contents during microwave heating and Fourier’s law of heat conduction were used to construct a genetic algorithm for inverse physics problems to compute the microwave absorption power of wood. By that, the effect of temperature and moisture contents on poplar microwave absorption power was analyzed. Then, a quantitative characterization equation for describing the coupled interactions between temperature and moisture on the microwave absorption power of poplar was constructed.
2. Mathematical Model
In this paper, Fourier’s law of heat conduction was used to describe the heat transfer in microwave-treated wood. Considering the energy conservation equation, the heat transfer control equation of poplar during microwave heating is shown in Equation (1):
The microwave absorption power p in Equation (1) is
The initial conditions of the governing Equation (1) is
The boundary conditions are
In the formula above, T is the temperature (°C), z is a spatial coordinate, (m), t is time, (s), p is the internal microwave absorption power of wood (V/m3), c is the specific heat capacity (J/(kg·°C)), λ is the thermal conductivity (W/(m·°C)), ρ is the density of wood specie (kg/m3), h is the surface heat transfer coefficient (W/(m2·°C)), the subscript e represents the environment, and 0 represents the initial time.
The inverse problem of microwave absorption power is relative to the corresponding positive problem of microwave heating wood, and its solution must be consistent with the corresponding positive problem. That is, in the inverse problem of microwave field absorption power, the temperature distribution, density, specific heat capacity, thermal conductivity, surface heat transfer coefficient, and other conditions are known at any given time and location during microwave heating, but the specific p in Equation (1) is unknown. After the wood microwave absorption power is determined, it is substituted into Equation (1), and the same initial and boundary conditions are set. The temperature distribution at any point obtained by the forward heat conduction problem should be the same as the known temperature distribution in the inverse problem; therefore, we can transform the solution of the inverse microwave absorption power problem into an optimization problem, i.e., searching for the optimal characterization equation of the microwave absorption power in the wood within a certain range. Thus, when this equation is applied to heat transfer problems, the residual sum of squares is the smallest between the calculated temperature of observation points and the measured temperature of known observation points in the inverse heat conduction problem.
To design an algorithm for the inverse problem of microwave field intensity, it is necessary to determine the function of the microwave absorption power of the wood in Equation (1). We assume that the microwave absorption power of wood is a function of temperature and moisture content, i.e., p (T, W). In this study, a polynomial function is used to characterize the relationship between microwave absorption power and moisture and temperature, as shown in Equation (6).
The algorithm was written in Fortran, and the basic steps of the solution are shown in Figure 1.
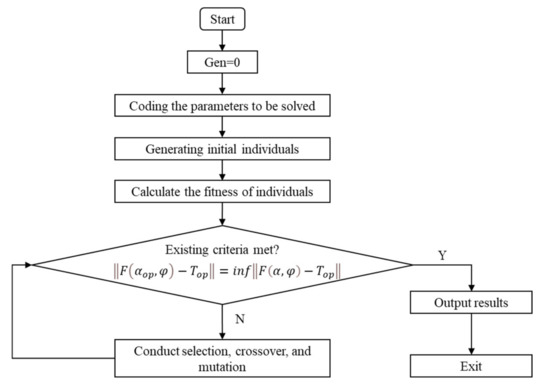
Figure 1.
Flow chart of the genetic algorithm.
We need to explain here that, as shown in Figure 1, to calculate the individual fitness, combined with the numerical methods based on type (3) on the initial conditions and boundary conditions (4) and (5) to solve the partial differential Equation (1), each specified point temperature must be calculated. Then, compared the temperature values of calculation temperature values for each monitoring points and the experimental observed values, the best approximation αop within the allow region must be found to minimize the difference between the function value and the observed temperature value under the corresponding mode parameter.
3. Materials and Methods
The plantation fast-growing poplar samples (Yueyang, Hunan provence, 5 years) with a constant dimension of 60 (length) × 60 (width) × 60 mm3 (thickness), with four smooth surfaces, were obtained and then stored in an indoor environment for fulfilling the air-drying process. During this process, the transverse section of wood sample was sealed with epoxy resin (Elantas E-6103 Epoxylite®, ELANTAS PDG, Inc., St. Louis, MO, USA) for preventing the moisture rapid evaporation, resulting in an uneven moisture distribution. After the wood samples reached the expected moisture content, they were then sealed in a seal bag and stored in the freezer (Xuecun, BD/BC-798, −18 °C).
Before the microwave heating experiment, a hole with a 1 mm diameter and a 10 mm depth was drilled in the center of the side of specimens, and then the specimens were weighed. Optical fiber was inserted into the hole for temperature online monitoring (Opsens, Tempsen, OPSENS SOLUTIONS INC., Quebec City, QC, Canada). The specimen was put into a four-port feed-in wood microwave heating device for testing, as shown in Figure 2. The test conditions were the following: a microwave power of 3982 W and a heating time of 14–40 s.
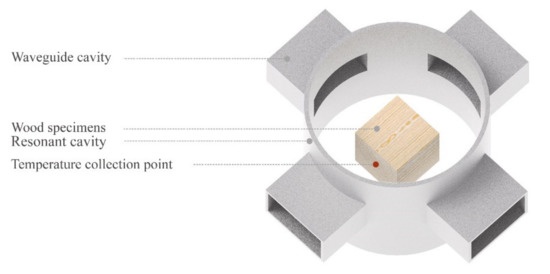
Figure 2.
Schematic diagram of microwave heating wood experiment.
A stated condition that needs to be emphasized here is that the water migration inside the wood was not considered during the inverse physics algorithm constructing. Therefore, the microwave heating was stopped when the acquisition temperature number reached 100 °C. To reduce the impact of water migration, epoxy resin was used to seal the longitudinal ends of the wood, and the maximum temperature inside the wood was not allowed to exceed 100 °C. During the experiment, the temperature of the wood heating process was automatically collected by a computer in 2.1 s intervals. The specimen was taken out after the microwave heating process stopped, weighed again, and then placed into an oven at 103 ± 2 °C to dry until absolute dryness. The initial moisture content of the specimen before microwave heating was calculated from the absolute dry mass of the test piece.
4. Results and Discussion
4.1. The Influence of Moisture Content on Heat Transfer during Microwave Treatment
The microwave heating curves at the 10 mm position of the poplar specimen side with different initial moisture contents are shown in Figure 3. With a higher initial moisture content, the wood temperature showed a smaller increase. The heating rate can reach a maximum of 6.49 °C/s when the initial moisture content of the specimen was 49%. The lowest heating rate of 2.21 °C/s was reached at an initial moisture content of 134%. In addition, the specimens with an initial moisture content of 49% and 87% showed a rapid jump at 80 °C, which could not be observed in the other moisture contents. This phenomenon shown inhere probably related to the smaller volume of free water in the wood cell cavity at the middle to low moisture contents. The moisture in the cell walls vaporized rapidly and then dispersed in the cell cavity when the temperature exceeded 80 °C. When microwaves penetrated the water vapor in the cell cavity, the energy loss was less than that of the microwaves penetrating liquid water at low temperatures in the early stage, resulting in the rapid increase in heat at 80 °C. In contrast, specimens with high water contents had more free water in the cell cavity. The space for the liquid water vaporization was limited; therefore, the most of them still remained in the liquid state, and no rapid increase in the temperature occurred at 80 °C.
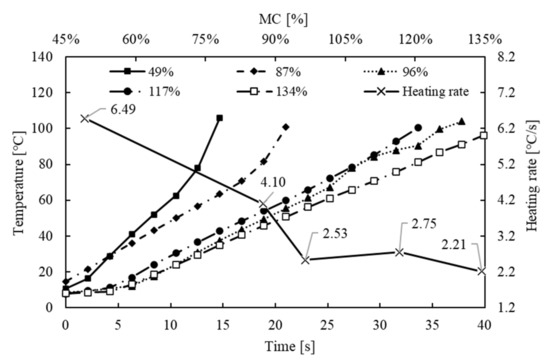
Figure 3.
Heat transfer patterns of poplar wood with different initial moisture contents.
4.2. The Influence of Temperature on the Intensity of the Microwave Electric Field
Guan et al. [13] and Zhou et al. [16] reported that, during microwave heating of wood, the dielectric properties of biomass dielectric materials changed with temperature. In this study, to quantitatively analyze the influence of temperature on the microwave absorption power of poplar wood, the temperature rise curve of the specimen with 49% moisture for regression analysis was selected. The result curves were obtained based on the data which were collected every 2.1 s, and each sampling cycle contained eight data points. To calculate the microwave absorption power, eight data points were used as the individuals in the algorithm. Equation (6) contained nine parameters to be estimated, and the moisture content of each specimen was constant during every single experiment. Thus, Formula (6) can be simplified. Let:
Then, Equation (6) can be expressed as
According to Equation (10), the microwave absorption power inside the wood exhibited a nonlinear relationship with the temperature. The function contained three unknown parameters, so each individual had three parameters to be estimated (b0, b1, b2). The ranges all located in the range [0–1,000,000]. The thermal conductivity and specific heat capacity in Equation (1) were taken from previous studies [26]:
After 1000 generations of genetic iteration, the estimated microwave absorption power p of the poplar specimen with 49% moisture content was:
According to Equation (13), the microwave absorption power of poplar during microwave heating was plotted against temperature (Figure 4), which showed that the microwave absorption power goes up while increasing the temperature. The research results of Zhou et al. [16] and Ishida et al. [27] showed that the dielectric loss factor of wood increased with the temperature, and according to Equation (2), an increase in the dielectric loss factor upon increasing the temperature inevitably increased the microwave absorption power. In addition, the electric field strength of microwaves in the wood was affected by the wood’s conductivity. The water molecules adsorbed on the surface of hemicellulose and lignin had a higher chance to dissociate due to the increased temperature, resulting in a depressed activation energy so that the obtained number of carriers and the wood conductivity both increased. Moreover, under the same external voltage, the carriers required a lower dissociation energy, and the internal electric field intensity E had a smaller loss. Thus, according to Equation (2), as temperature increased, the electric field intensity was less attenuated, which more rapidly increased the temperature.
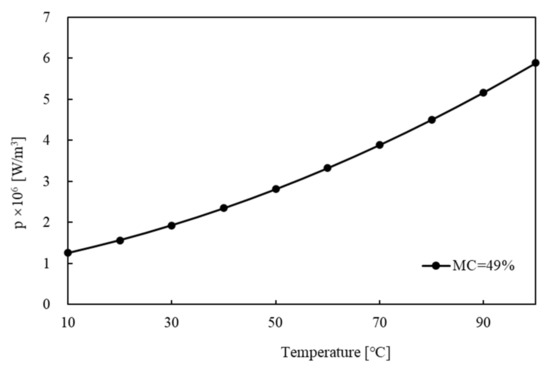
Figure 4.
The relationship between temperature and microwave absorption power of poplar specimens with 49% moisture content during microwave heating.
To validate the microwave absorption power Equation (13), a numerical simulation calculation program was written by using Fortran integrating the conservation Equation (1), initial value Equation (3), boundary conditions Equations (4) and (5), and the microwave absorption power Equation (13) to solve the positive physical problem during the heat transfer process of the microwave wood heating. In here, the temperature predicted by the numerical simulation program, as shown in Figure 5, was adopted to compare the experiments obtained by the online monitoring. Based on the derived microwave absorption power equation, the overall goodness of fit between the predicted temperatures and experimentally measured values was acceptable. The cumulative root mean square error of the eight datasets was 2.42, suggesting that the simulated values were relatively close to the experimentally measured values. The results indicated that our microwave absorption power equation based on genetic algorithm back-calculation could quantitatively characterize the microwave heating of wood.
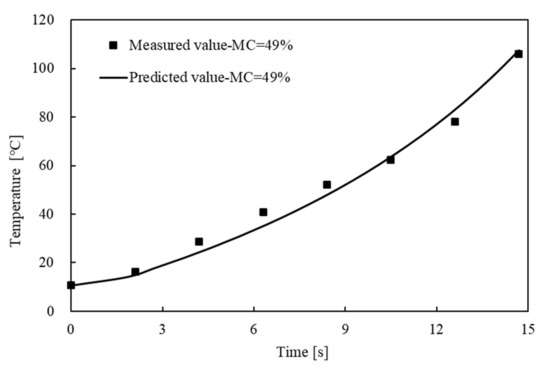
Figure 5.
Comparison of measured temperature distribution value and model prediction value of 49% moisture content specimen.
To more clearly characterize the internal heat distribution and migration of the poplar specimen with 49% moisture content during microwave heating, the numerically simulated data were visualized, as shown in Figure 6. Along the spatial coordinates (i.e., the thickness of wood samples), the overall temperature of the specimen was generally lower on the outside and higher on the inside, i.e., the temperature close to the boundary was slightly lower, which was consistent to the researches by Zielonka (1997, 1998) [28,29] and Li (2008) [22]. The major reason was that the heat inside the wood dissipated into the surrounding air through natural convection at the boundary, which decreased the temperature at the boundary. Along the time axis, the internal temperature of the wood at the same thickness at any time showed a parabolic shape. The internal temperature of the poplar specimen with a 49% initial moisture content reached 100 °C after microwave heating for 15 s at 3982 W.
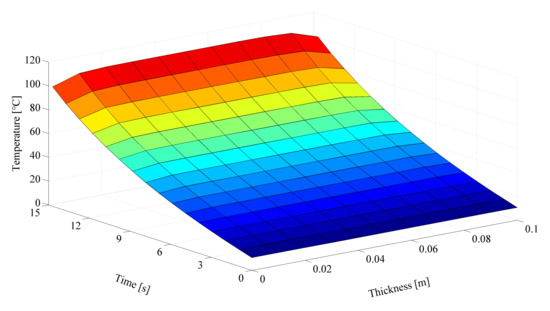
Figure 6.
Heat conduction of poplar wood with 49% moisture content during microwave heating.
4.3. The Influence of Temperature and Moisture on the Microwave Electric Field Intensity
Based on the literatures report, the moisture in wood can significantly impact the dielectric properties of wood [16,17]. To investigate the influence of temperature and moisture on the microwave absorption power of wood, the temperature increase inside the wood with different initial moisture contents was measured during the experiments. Using the computation method described in the previous section, after 1000 generations of the genetic algorithm, the microwave absorption power equations for poplar wood with moisture contents of 87%, 96%, 117%, and 134% were obtained. Parameters and mean square root errors of the microwave absorption power equations for each moisture content are shown in Table 1.

Table 1.
Parameters of electric field intensity function at different moisture contents.
For Table 1, the microwave absorption power equations of specimens with initial moisture contents of 87%, 96%, 117%, and 134% were substituted into the program to solve the heat transfer problem during microwave wood heating, and the results were plotted in Figure 7. The regression results of specimen temperature at different moisture contents were mildly different, showing that the initial moisture contents of 87% and 96% had large mean square errors, with a cumulative root mean square error exceeding 3 °C. For 87% moisture content, the later heating stage had a poor goodness of fit. Differently, the middle and later heating stages had a poor goodness of fit under the sample water content at 96%. Nevertheless, those errors were related to the poplar wood with an uneven distribution of moisture.
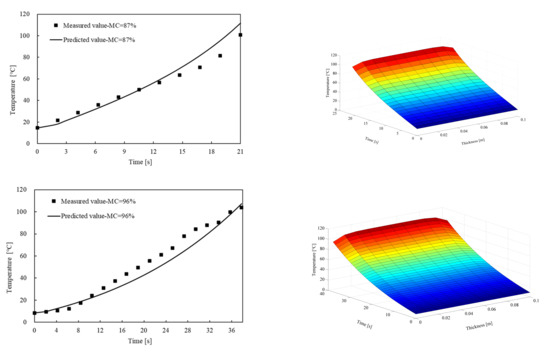
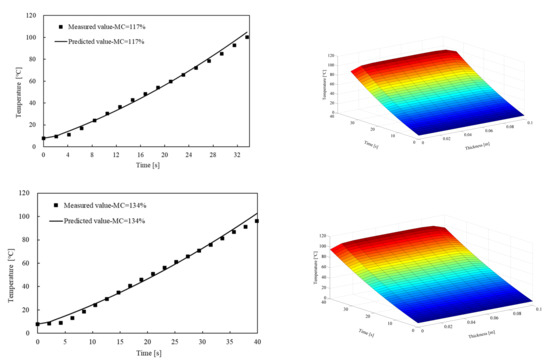
Figure 7.
Distribution and comparison of model-predicted and experimentally measured temperatures of specimens with different initial moisture contents.
According to the internal temperature distribution patterns of specimens with different moisture contents, at a certain location, the temperature distribution along the time axis was parabolic. With different moisture contents, the slopes of the parabola were slightly different, but the overall trends were that, upon increasing the moisture content, the slope of the parabola became less steep and the heating rate decreased.
Herein, the sample microwave absorption power under different moisture contents was collected and then plotted in Figure 8 to quantitatively analyze the influence of internal moisture and temperature on the microwave absorption power. Figure 8 shows the relationship between microwave absorption power and initial moisture contents, thus indicating a positive correlation. This is mainly due to the fact that dielectric properties of wood increased at a higher temperature, which then increased the microwave absorption power. This was likely because ion polarization required a higher energy at higher moisture contents; therefore, under the same external electric field, the energy was attenuated when passing through the wood. Thus, the internal microwave field was weakened. According to Equation (2), a weaker microwave field caused a lower microwave absorption power. Generally, the higher the initial moisture content, the less the wood microwave field absorption power was affected by the temperature.
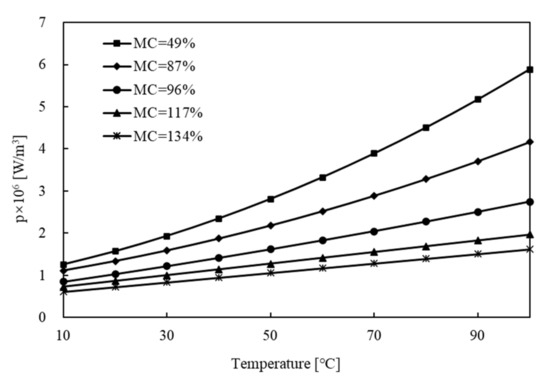
Figure 8.
Microwave field intensity of poplar wood with different moisture contents at different temperatures.
In Equations (6) and (10), when addressing the influence of temperature on the microwave absorption power, the moisture content was a known value without detailed decomposition. Three overall parameters—b0, b1, and b2—were used to characterize the influence of temperature on the microwave absorption power at a certain moisture content. Now it was necessary to reconstruct the influence of moisture on microwave absorption power, based on the different parameter values corresponding to different initial moisture contents in Table 1. We conducted a regression analysis according to Equations (7)–(9), for fitting, and the results are shown in Figure 9.
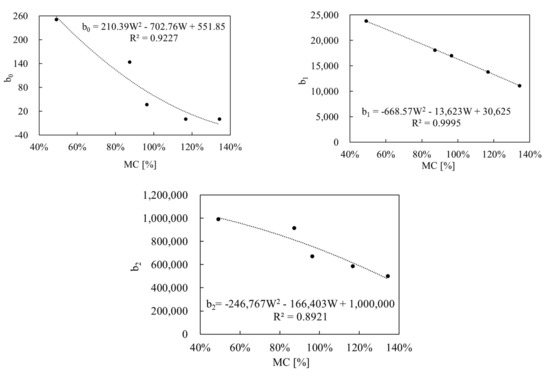
Figure 9.
Results of regressions with different parameters and moisture contents.
By substituting the data in Figure 9 into Equation (6), we obtained the equation to quantitatively characterize the microwave absorption power during the microwave heating of poplar wood (14). Changes in the microwave absorption power of poplar wood with temperature and moisture contents are shown in Figure 10. The influence of moisture on the microwave absorption power was smaller in the low temperature region (20–60 °C) than in the high temperature region (70–100 °C). The influence of temperature on the microwave absorption power was smaller in the high moisture content region (90–130%) than in the low moisture content region (40–90%). In general, the influence of temperature on microwave absorption power was slightly greater than internal moisture.
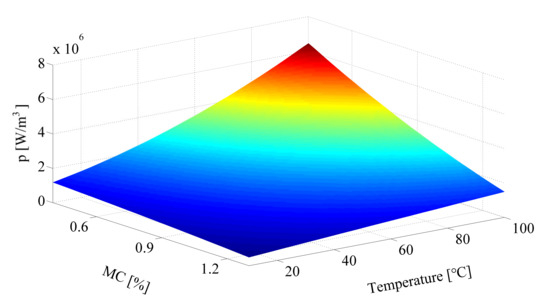
Figure 10.
Changes in the microwave absorption power with temperature and moisture contents.
5. Conclusions
Herein, we suggested a method to quantitatively interpret the microwave absorption power p of wood and to quantitatively analyze the interactive effects of internal moisture and temperature on the microwave absorption power of wood. This method was based on the curves of experimental data from the microwave heating of poplar with different initial moisture contents.
According to Fourier’s law of heat conduction, the microwave absorption power, as an unknown variable, was utilized here, and then a genetic algorithm was adopted for inverse physics problems to inversely calculate the microwave absorption power and interpret the influence of temperature on the microwave absorption power of poplar wood. Based on the microwave absorption power at different moisture contents, the influence of moisture on the microwave absorption power of poplar wood was reconstructed. Finally, a coupling interactive relationship between temperature and moisture on the microwave absorption power of poplar wood was obtained. The results show that the microwave absorption power of poplar wood increased with temperature, while it decreases at higher moisture contents. The influence of temperature on the microwave absorption power of poplar wood was slightly greater than that of the initial moisture content.
Author Contributions
Conceptualization, X.H., J.L. and D.W.; methodology, X.H. and D.W.; software, X.H. and D.W.; validation, J.L., X.L.; formal analysis, D.W.; writing—original draft preparation, D.W., X.H. and X.C.; writing—review and editing, X.L., J.L., X.H. and X.C.; supervision, X.L.; project administration, X.H. and X.L.; funding acquisition, X.H. and X.L. All authors have read and agreed to the published version of the manuscript.
Funding
This research was funded by The National Natural Science Foundation of China (31700486), The Scientific Research Fund of Hunan Provincial Education Department (16B280), The Hunan Provincial Natural Science Foundation of China (2016JJ3185), The Science and Technology Innovation Program of Hunan Province (2020RC4049), and The Science and Technology Innovation Program of Hunan Province (2021RC4062).
Data Availability Statement
Not Applicable.
Conflicts of Interest
The authors declare no conflict of interest.
References
- Adamski, W.; Kitlinski, M. On measurements applied in scientific researches of microwave heating process. Meas. Sci. Rev. 2001, 1, 199–203. [Google Scholar]
- Luo, G.; Song, C.; Pu, H.; Li, Z.; Xu, W.; Raghavan, G.S.V.; Chen, H.; Jin, G. Optimization of the microwave drying process for potato chips based on the measurement of dielectric properties. Dry. Technol. 2019, 37, 1329–1339. [Google Scholar] [CrossRef]
- Ren, X.; Wang, L.; Xu, B.; Wei, B.; Liu, Y.; Zhou, C.; Ma, H.; Wang, Z. Influence of microwave pretreatment on the flavor attributes and oxidative stability of cold-pressed rapeseed oil. Dry. Technol. 2019, 37, 397–408. [Google Scholar] [CrossRef]
- Montes, I.; Sanabria, D.; García, M.; Castro, J.; Fajardo, J. A Greener Approach to Aspirin Synthesis Using Microwave Irradiation. J. Chem. Educ. 2006, 83, 628–631. [Google Scholar] [CrossRef]
- Devece, C.; Rodríguez-López, J.N.; Fenoll, L.G.; Tudela, J.; Catalá, J.M.; de los Reyes, E.; García-Cánovas, F. Enzyme inactivation analysis for industrial blanching applications: Comparison of microwave, conventional, and combination heat treatments on mushroom polyphenoloxidase activity. J. Agric. Food Chem. 1999, 47, 4506–4511. [Google Scholar] [CrossRef]
- Cao, X.; Zhang, M.; Fang, Z.; Mujumdar, A.S.; Jiang, H.; Qian, H.; Ai, H. Drying Kinetics and Product Quality of Green Soybean under Different Microwave Drying Methods. Dry. Technol. 2017, 35, 240–248. [Google Scholar] [CrossRef]
- Zhou, J.; Yang, X.; Zhu, H.; Yuan, J.; Huang, K. Microwave drying process of corns based on double-porous model. Dry. Technol. 2019, 37, 92–104. [Google Scholar] [CrossRef]
- Li, L.; Jiang, X.; Bian, Z.; Wang, J.; Wang, F.; Song, Z.; Zhao, X.; Ma, C. Microwave drying performance of lignite with the assistance of biomass-derived char. Dry. Technol. 2019, 37, 173–185. [Google Scholar] [CrossRef]
- Ge, J.; He, Y.; Zhu, Y.; Wang, Z.; Zhang, K.; Huang, Z.; Cen, K. Combined conventional thermal and microwave drying process for typical Chinese lignite. Dry. Technol. 2019, 37, 813–823. [Google Scholar] [CrossRef]
- Nastaj, J.F.; Witkiewicz, K.; Wilczynska, B. Experimental and simulation studies of primary vacuum freeze-drying process of random solids at microwave heating. Int. Commun. Heat Mass Transf. 2008, 35, 430–438. [Google Scholar] [CrossRef]
- Celen, S.; Kahveci, K. Microwave Drying Behaviour of Tomato Slices. Czech J. Food Sci. 2013, 31, 132–138. [Google Scholar] [CrossRef] [Green Version]
- Zhou, B.; Avramidis, S. On the loss factor of wood during radio frequency heating. Wood Sci. Technol. 1999, 33, 299–310. [Google Scholar] [CrossRef]
- Daian, G.; Taube, A.; Birnboim, A.; Shramkov, Y.; Daian, M. Measuring the dielectric properties of wood at microwave frequencies. Wood Sci. Technol. 2005, 39, 215–223. [Google Scholar] [CrossRef]
- Uan, D.G.; Cheng, M.; Wang, Y.; Tang, J. Dielectric Properties of Mashed Potatoes Relevant to Microwave and Radio-frequency Pasteurization and Sterilization Processes. J. Food Sci. 2004, 69, FEP30–FEP37. [Google Scholar] [CrossRef]
- Al-Holy, M.; Wang, Y.; Tang, J.; Rasco, B. Dielectric properties of salmon (Oncorhynchus keta) and sturgeon (Acipenser transmontanus) caviar at radio frequency (RF) and microwave (MW) pasteurization frequencies. J. Food Eng. 2005, 70, 564–570. [Google Scholar] [CrossRef]
- Calay, R.K.; Newborough, M.; Probert, D.; Calay, P.S. Predictive equations for the dielectric properties of foods. Int. J. Food Sci. Technol. 1994, 29, 699–713. [Google Scholar] [CrossRef]
- Wang, Y.; Tang, J.; Rasco, B.; Kong, F.; Wang, S. Dielectric properties of salmon fillets as a function of temperature and composition. J. Food Eng. 2008, 87, 236–246. [Google Scholar] [CrossRef]
- Ohlsson, T.; Risman, P.O. Temperature Distribution of Microwave Heating-Spheres and Cylinders. J. Microw. Power 1978, 13, 302–309. [Google Scholar] [CrossRef]
- Van Remmen, H.H.J.; Ponne, C.T.; Nijhuis, H.H.; Bartels, P.V.; Kerkhof, P.J.A.M. Microwave Heating Distributions in Slabs, Spheres and Cylinders with Relation to Food Processing. J. Food Sci. 2010, 61, 1105–1114. [Google Scholar] [CrossRef]
- Antti, A.L.; Perré, P. A microwave applicator for online wood drying: Temperature and moisture distribution in wood. Wood Ence Technol. 1999, 33, 123–138. [Google Scholar] [CrossRef]
- Chen, Y.-L.; Han, S.-J.; Yu, H.-Y.; Liu, Z.-J.; Zhang, B.-G.; Yao, G.-L.; Zhao, F.-J.; Li, X.-L.; He, H.-K.; Shen, Y.-B.; et al. Temperature distribution inside wood during microwave-vacuum drying. J. Beijing For. Univ. 2006, 28, 128–131. [Google Scholar]
- Li, X.-J.; Zhang, B.-G.; Li, W.-J. Microwave-Vacuum Drying of Wood: Model Formulation and Verification. Dry. Technol. 2008, 26, 1382–1387. [Google Scholar] [CrossRef]
- Przewloka, S.R.; Hann, J.A.; Vinden, P. Assessment of commercial low viscosity resins as binders in the wood composite material Vintorg. Eur. J. Wood Wood Prod. 2007, 65, 209–214. [Google Scholar] [CrossRef]
- Torgovnikov, G.; Vinden, P. High-intensity microwave wood modification for increasing permeability. For. Prod. J. 2009, 59, 84–92. [Google Scholar]
- Torgovnikov, G.; Vinden, P. Microwave Wood Modification Technology and Its Applications. For. Prod. J. 2010, 60, 173–182. [Google Scholar] [CrossRef]
- Fyhr, C.; Rasmuson, A. Some aspects of the modelling of wood chips drying in superheated steam. Int. J. Heat Mass Transf. 1997, 40, 2825–2842. [Google Scholar] [CrossRef]
- Ishida, Y.; Yōshino, M.; Takayanagi, M.; Irie, F. Dielectric studies on cellulose fibers. J. Appl. Polym. Sci. 2010, 1, 227–235. [Google Scholar] [CrossRef]
- Zielonka, P.; Gierlik, E.; Matejak, M. The comparison of experimental and theoretical temperature distribution during microwave wood heating. Eur. J. Wood Wood Prod. 1997, 55, 395–398. [Google Scholar] [CrossRef]
- Zielonka, P.; Dolowy, K. Microwave drying of spruce: Moisture content, temperature and heat energy distribution. For. Prod. J. 1998, 48, 77–80. [Google Scholar]
Publisher’s Note: MDPI stays neutral with regard to jurisdictional claims in published maps and institutional affiliations. |
© 2022 by the authors. Licensee MDPI, Basel, Switzerland. This article is an open access article distributed under the terms and conditions of the Creative Commons Attribution (CC BY) license (https://creativecommons.org/licenses/by/4.0/).