Abstract
Kandelia candel is the most widely distributed tree species on the southeast coast of China and is also the main afforestation tree species along the coastal wetland. In recent years, inorganic nitrogen pollution has become increasingly severe, and investigating the effects of nitrogen input on methane emissions in Kandelia candel–soil systems has become significant from a global change perspective. However, the effect of nitrogen input on methane emissions in coastal wetland systems is still uncertain. The field tidal environment is complex and varied, and thus it is difficult to accurately control the amount of nitrogen in the system. Therefore, in order to accurately assess the effects of different concentrations of foreign nitrogen input on methane emission fluxes in a Kandelia candel–soil system, we use indoor tidal simulation experimental devices and design two simulation systems with and without plant planting to explore the difference of methane emission flux in this system under five nitrogen input concentrations: N0 (0 g N·m−2·a−1), N1 (5 g N·m−2·a−1), N2 (10 g N·m−2·a−1), N3 (20 g N·m−2·a−1), and N4 (30 g N·m−2·a−1). The results showed that: (1) The introduction of Kandelia candel promoted methane emissions in coastal wetland ecosystem. Under each nitrogen application concentration, the mean CH4 emission flux in the planting group was 42.98%, 65.59%, 40.87%, 58.93% and 39.23% higher than that in the non-planting group, respectively. (2) Nitrogen input significantly promoted methane emissions in both planted and non-planted environments, and the promoting effect showed as follows: N4 > N3 > N2 > N1 > N0. (3) After the introduction of Kandelia candel, the contribution of Kandelia candel and soil microorganisms to methane emissions was different under different concentrations of nitrogen addition. The contribution rate of Kandelia candel to CH4 emission flux of Kandelia candel–soil system ranged from 10.74% to 60.25%, with an average contribution rate of 37.30%. The changed soil microbes contributed 39.75% to 89.26% to the CH4 emission flux in the Kandelia candel–soil system, with an average contribution rate of 62.60%. Under N3 nitrogen application concentration, the emission flux of plant was the largest, which was significantly higher than that of the soil microbial pathway; at other concentrations, the methane emissions from the soil microbial pathway were greater than that of the plant pathway, and the contribution rate to the plant–soil system reached 60.25%. The results of this study provide an important basis for improving the estimation accuracy of carbon emissions in coastal waters and formulating policies for the restoration and protection of coastal wetlands.
1. Introduction
The situation of global change is increasingly serious. CH4 is the second largest greenhouse gas in the atmosphere after CO2, and its contribution rate of greenhouse effect is about 23% [1]. In the past 20 years, the rate of increase in the concentration of CH4 in the atmosphere is 100 times that of CO2 [2], and the concentration of atmospheric methane is still increasing at a rate of 1.0–1.2% per year [3]. The wetland ecosystem is a huge carbon pool on land and the main natural source of CH4 emissions [4,5]. Recent reports show that half of global methane emissions come from highly variable aquatic ecosystems [6], therefore, tidal flat wetlands play an important role in the study of carbon cycling in global ecosystems [7].
Estuary wetlands are located in the transition zone between land and sea. With the rapid economic development, inorganic nitrogen has become the most important factor exceeding the standard in coastal waters [8]. The ocean tides, atmospheric dry and wet deposition, and inland nitrogen input have made it an enriched area of nitrogen [9], and the input of exogenous nitrogen has been increasing [10,11,12]. Studies have confirmed that a high nitrogen input will change the system’s greenhouse gas emissions and may even exacerbate global warming [13].
As one of the important types of tidal flat wetland, the mangrove wetland is considered to be an effective way to purify pollutants in coastal waters. In the past 20 years, a large amount of sewage and wastewater have been discharged into China’s coastal waters without limit, and inorganic nitrogen has exceeded the main standard factor [14]. For mangrove plants in a state of “nitrogen thirst”, once an external source of nutrients is input, the growth of mangrove plants will be promoted within a certain range [15]. The effects of the nitrogen input on carbon emissions of a wetland system are complex, including promotion [16,17], inhibition [18,19], or having an insignificant impact [20], which is the result of the combined effects of multiple mechanisms [1,13,16,21,22,23]. Exactly how nitrogen input affects carbon emissions from mangrove ecosystems is still inconclusive. The field tidal flat environment is complex and changeable, and the input of exotic nutrients is continuously diverse, so it is difficult to carry out experiments to simulate the effect of nitrogen input in the field. As a result, there are few reports on the systematic study of the effect of nitrogen input on the methane emissions in mangrove wetland system at home and abroad. Existing studies have mainly focused on CH4 emissions from existing mangrove wetland ecosystems [24,25,26,27,28,29], without considering the impact of external sources. Early studies have focused on methane emissions from soils. In recent years, scholars have begun to pay attention to methane emissions in mangrove plants, such as Zhang et al. (2019) and Chen et al. (2018), but these studies are mainly focused on the above-ground parts. Plant–soil microbes are a closely linked with the micro-ecological whole, and methane emissions are closely related to the role of plant root exudates; to estimate the carbon emissions of the ecosystem only based on the carbon emissions from the above-ground parts of plants and the bare land under mangroves may lead to carbon loss or sink. Exactly how nitrogen input affects the carbon emissions of the mangrove-plant–soil system and the contribution of the plant–soil microbe components are still unclear.
In the context of global change, mangrove restoration has been stepped up all over the world, and a large number of mangrove plants have been introduced into tidal flat coastal wetlands. There is no report on the impact of increased external nitrogen input on the system’s carbon emissions while promoting the growth of mangrove plants. Ventilation tissue is one of the important ways of methane emission. While nitrogen promotes the increase in plant growth, does its aeration tissue increase correspondingly? Does the flux of methane emissions through plants also increase? Some scholars have found that, while plant biomass increases, the amount of carbon that the soil can store may decrease. This mutual relationship may reduce the soil’s carbon sequestration ability [30]. Under the dual-carbon goal, increasing the afforestation of mangrove plants will effectively help to increase blue carbon sinks or increase carbon emissions to a certain extent. This scientific issue needs to be discussed urgently.
Methane emissions in the ecosystem are mediated by microorganisms [4]. The introduction of plants not only changes the composition and activity of microorganisms in the system, but also increases methane emission pathways in the system (plant aerenchyma is also an important pathway of methane emission). Therefore, we rely on the indoor tide simulation laboratory to set up three types of soil system (K. candel plant–soil system with plant group, pure soil system with plant group, and pure soil system without plant group), and controlled five nitrogen addition concentrations. Through the simulation study, the following scientific questions are answered: (1) What is the impact of the introduction of mangrove plants on the methane emission of coastal wetlands; (2) What is the regularity of the methane emission intensity of each system in the days after nitrogen addition; (3) How much is the contribution of plants, soil and microbial components to system methane emissions. The results of this study provide a scientific basis for revealing whether the expansion of mangrove afforestation area increases carbon sink or carbon emissions under the background of increasing nitrogen input, and also provides the estimation accuracy of carbon emissions in the near-shore sea and the recovery of coastal wetlands and provides an important basis for the development of protection policies.
2. Materials and Methods
2.1. Tidal Simulation Experiment
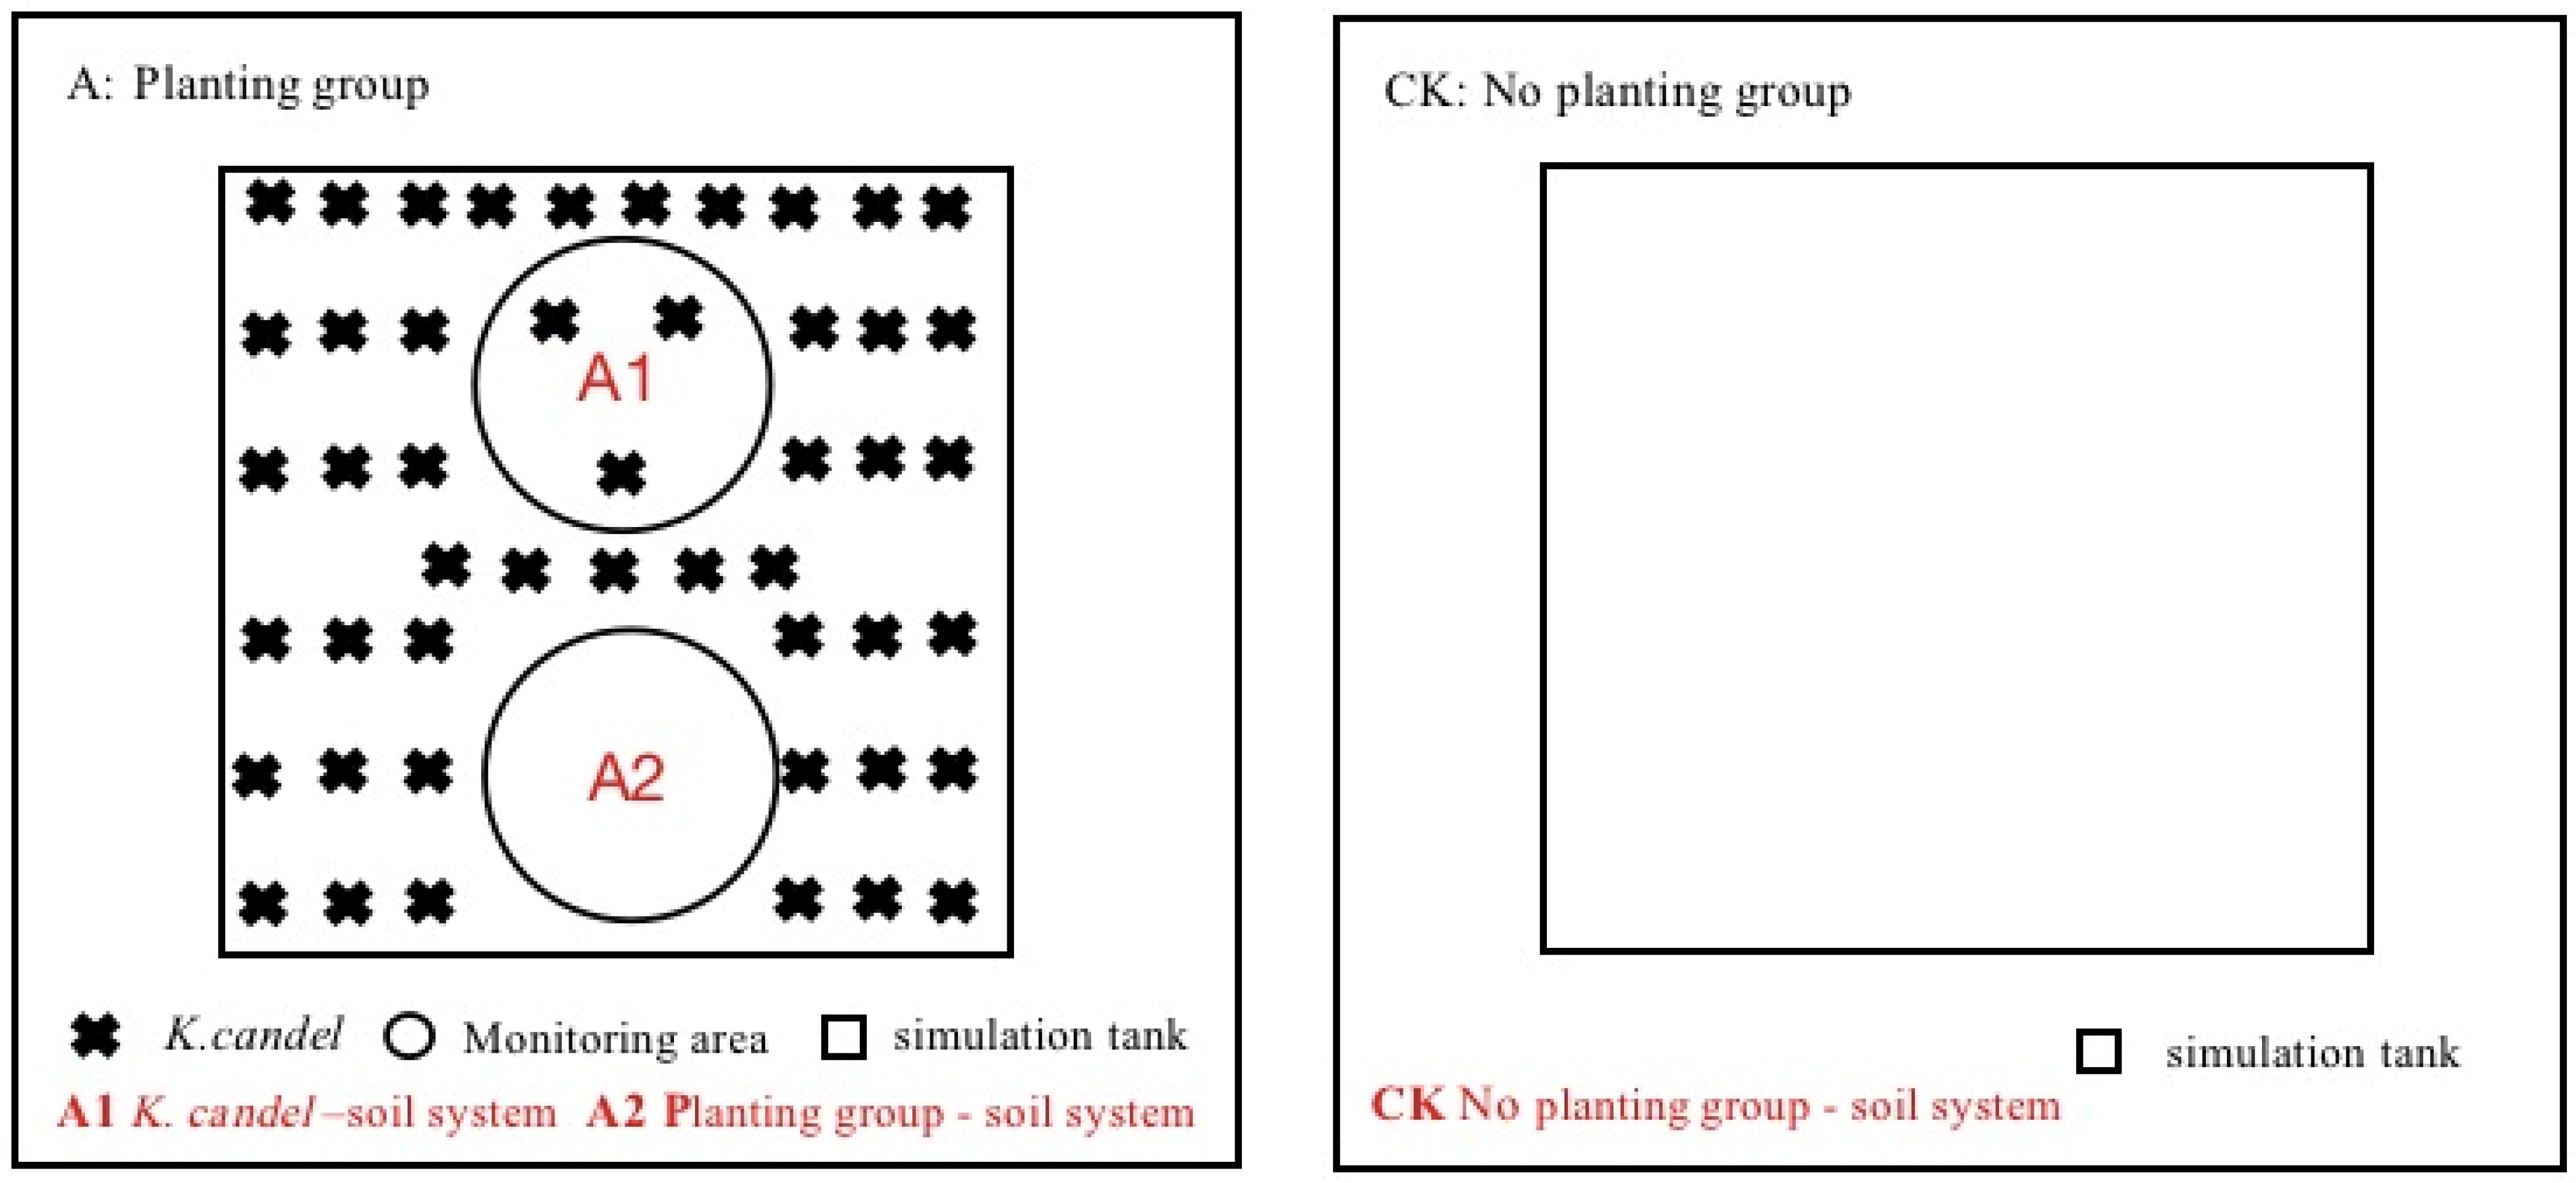
This experiment set three types of systems: K. candel–soil system (A1), planting group–soil system (A2, pure soil system with plant group) and no planting group–soil system (CK) (see Figure 1 for details). The methane emission pathways of the ecosystem mainly include soil and plant pathways; therefore, the A1 system in this experimental design reflected the methane emissions of the entire system, including methane emissions from plant pathways and soil pathways. The A2 system, which is the area of pure soil without plants in the planting group, focused on the methane emissions from non-plant pathways after the introduction of plants. The CK system was the methane emission from soil in the absence of plants. The difference of methane emission flux between the A1 system and the A2 system reflected the methane emission from the plant pathway, and the difference between the A2 and the CK systems reflected the methane emission after the change of soil microbial composition and activity. This experiment relied on the tide simulation laboratory of the Fujian Academy of Forestry. The tidal simulation system was composed of an automatic tidal simulation trough device and control system. The automatic tidal simulation trough device is divided into upper trough and lower trough: the upper trough is simulated grass (length × width × height = 1.0 m × 1.0 m × 1.0 m) and the lower trough is storage tank. The medium in the simulation tank was obtained from the wetland of the estuary of Quanzhou Bay, and the water tank contained seawater with a salt concentration of 12% [31]. The simulation tank was connected to the lower tank through a water pump and a drain valve. Since the distribution area of Kandelia candel forests in the Quanzhou Bay estuary wetland is mostly half-diurnal tide, the tide form of this experiment as set as half-diurnal tide. A one half-diurnal tide was circulated every 12 h, and two half-diurnal tides were flooded every day for each treatment. The flooding method was submerged flooding, and the flooding duration was 4 h.
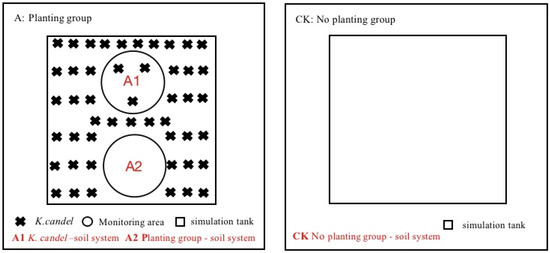
Figure 1.
Tide simulation system.
2.2. Culture Medium, Kandelia candel Nursery and Nitrogen Treatment
The experimental culture medium was taken from the wetland of the estuary of Quanzhou Bay, and a 0–30 cm soil layer was used. Before the start of the cultivation experiment, the system was operated for one month. The soil properties of the undisturbed soil in the simulated experiment are shown in Table 1. The hypocotyl of the simulated seedlings were taken from the estuaries wetland of Quanzhou Bay, and planted in sandy soil in mid-April 2019. At the two-leaf stage, the healthy seedlings with similar size were selected and transplanted into the simulated tank in late May, with 48 seedlings in each simulated trough. The project set up three systems, and five nitrogen input levels, and each treatment had three repetitions. The project set up three systems, five nitrogen input levels, and each group was repeated three times. We used a NH4NO3 solution to input nitrogen into the simulation tank, and the mean value of total nitrogen deposition in Xiamen, which is close to Quanzhou Bay, is 1.89 g N·m−2·a−1 (annual nitrogen application per square meter). This research was based on 2 g N·m−2·a−1 [32], which was multiplied by 2.5 times, 5 times, 10 times, and 20 times, and five nitrogen concentrations were set as follows: N0, N1, N2, N3, and N4, with concentration values of 0, 5, 10, 20, and 30 g N·m−2·a−1, respectively. From 27 May 2019 to 27 October 2019, nitrogen was applied equally six times, and the same amount of water was applied on 28 June, 30 June, 2 July and 4 July 2019. The corresponding results were measured on 6 July, 8 July, and 10 July 2019.

Table 1.
Soil physicochemical properties of the simulated experimental soil.
2.3. Gas Collection, Measurement, and Calculation
In this experiment, the static box method was used to observe the methane emission flux of the K. candel–soil system, planting group–soil system, and the no planting group–soil system during the non-ebb and non-high tide stage. The static box was composed of opaque corrosion-resistant Polyvinyl chloride board with a cylindrical base and a top box. The top box was 35 cm in height, with a built-in electric fan and thermometer. The base was 80 cm in height and 25 cm in diameter. A medical needle was used to collect 100 mL of gas, which was then pumped into an aluminum foil sampling bag for gas measurements. In order to ensure that the air above the sampling point was fully exchanged with the surrounding air before the next sampling, the gas concentration was restored to the environmental base level. The upper box covering the sampler was opened after each gas collection and closed until the next gas collection. After the collected gas samples were brought back to the laboratory, they were stored in the dark and refrigerated, and the concentration of CH4 in the samples was measured by gas chromatography. The CH4 detector was a hydrogen flame ionization detector (FID), the carrier gas was N2, the flow rate was 30 mL/min, the fuel gas was H2, the flow rate was 30 mL/min, the air was the auxiliary gas, and the flow rate was 300 mL/min. The detector temperature was 250 °C, the separation column temperature was 60 °C, and the inlet heater temperature was 105 °C. The CH4 flux emitted into the atmosphere was calculated according to the following formula [33]:
Treatments were replicated three times, and the flux data were subjected to analysis of variance and multiple comparison test modules to analyze the differences in CH4 emission fluxes under different environments and different nitrogen treatments using SPSS25.0 (IBM Corp., Armonk, NY, USA).
3. Results
3.1. The Impact of Kandelia candel on Coastal Wetland CH4 Emissions
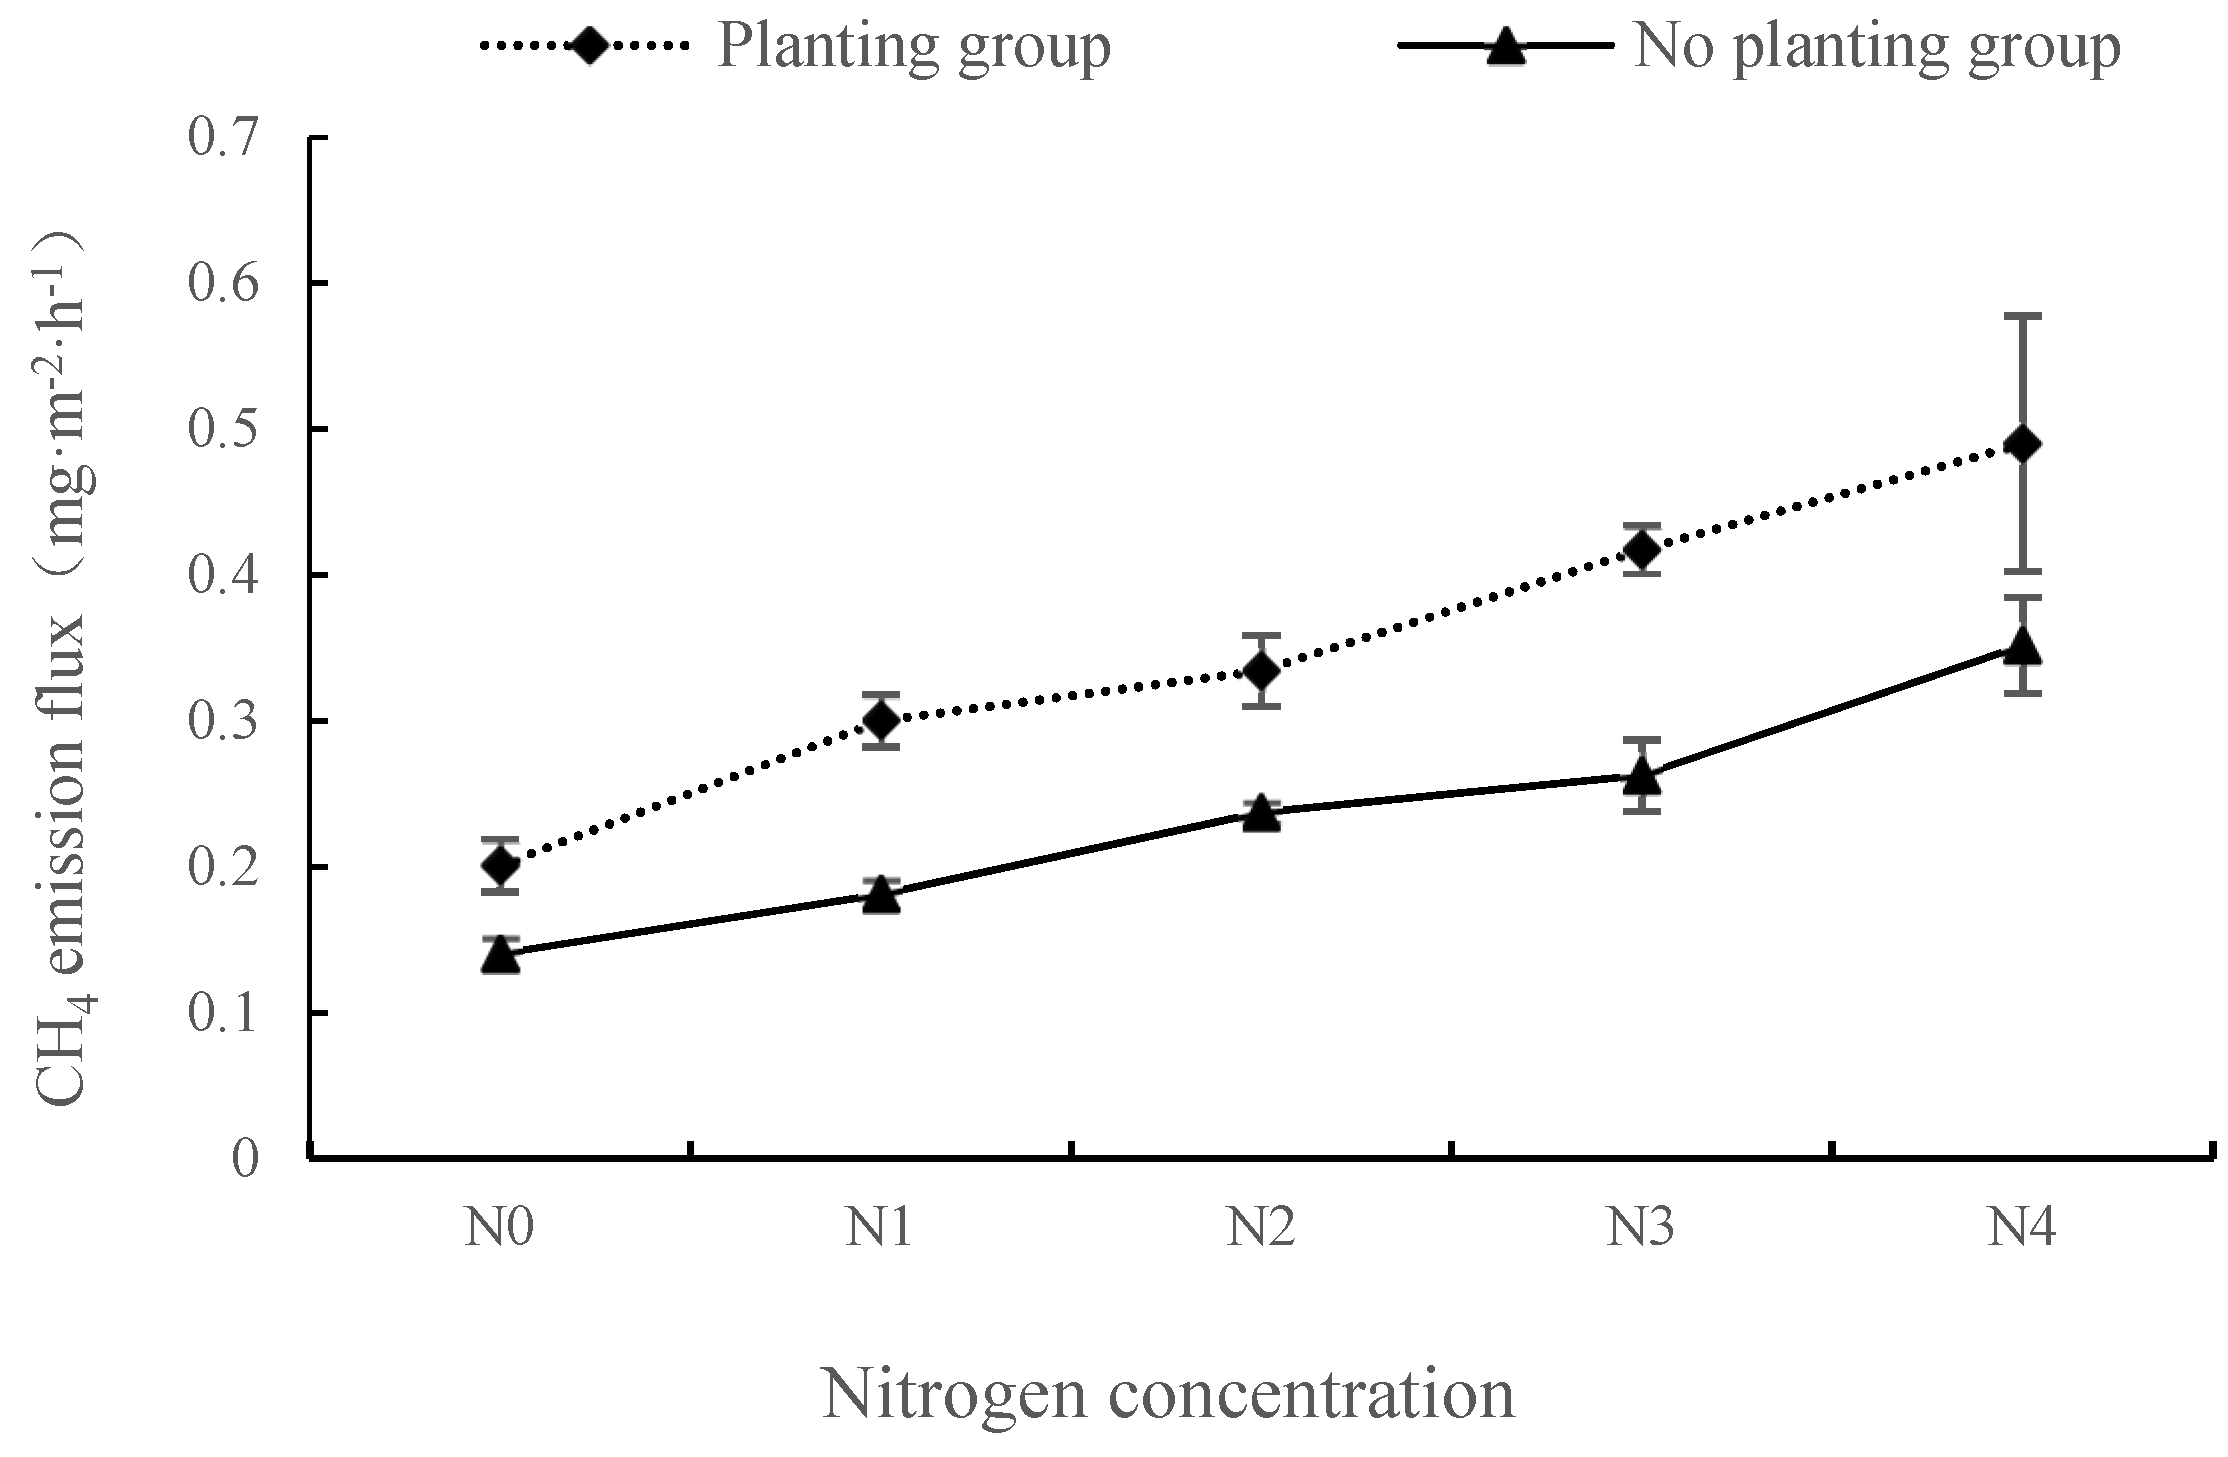
Under different nitrogen concentration treatments, the CH4 emission flux change characteristics of groups with and without plants are shown in Figure 2. In both the presence and absence of plant, the CH4 emission fluxes increased gradually with the increase of nitrogen concentration, and there was a significant difference between the two groups under the five nitrogen concentrations (p < 0.01). The mean values of CH4 emission fluxes in both the presence and absence of plant reached a peak at the N4 concentration, and the flux was 0.490 mg·m−2·h−1 and 0.352 mg·m−2·h−1, respectively. In the plant group, the maximum amount of CH4 emissions appeared under the N1 concentration (0.099 mg·m−2·h−1); in the no plant group, the largest increment under N4 concentration treatment was 0.089 mg·m−2·h−1. Under different nitrogen application concentrations, the mean CH4 emission fluxes in planting group were 42.98%, 65.59%, 40.87%, 58.93% and 39.23% higher than those in the non-planting group, respectively. Therefore, nitrogen input can promote CH4 emissions in wetland ecosystem. Under different nitrogen input concentrations, plant presence promoted CH4 emissions in the wetland ecosystem, and the effect was most significant under N1 nitrogen concentration.
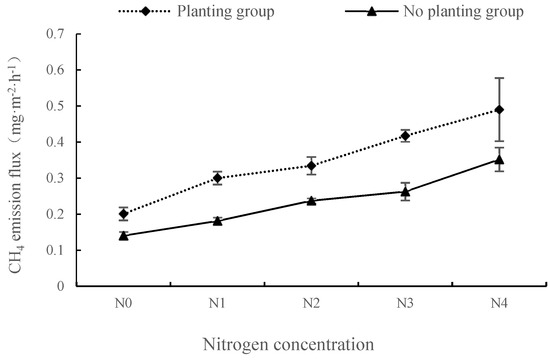
Figure 2.
Changes of methane emission fluxes under different nitrogen concentrations in plants with and without plants.
3.2. CH4 Emission Rules of Different Systems
The CH4 emission flux of different systems under different nitrogen concentration treatment showed similar volatility change characteristics with culture time (Figure 3). Nitrogen addition promoted the CH4 emission of three systems, and the mean CH4 emission flux at five nitrogen application concentrations was: N4 > N3 > N2 > N1 > N0. Each nitrogen concentration reached the emission peak on the 10th day of culture. Subsequently, the CH4 emission flux of the system at each nitrogen concentration decreased; the CH4 emission flux increases with the culture time, but the promotion begins to decrease after exceeding a period of incubation time. The mean emission of CH4 from the three systems was represented as Kandelia candel–soil system > planting group–soil system > no planting group–soil system. In the Kandelia candel–soil system, N1, N2, N3 and N4 nitrogen concentrations increased by 60.22%, 75.39%, 136.93%, and 156.17% over the mean control N0 CH4 emission flux, respectively. The one-way analysis of variance revealed that the N0 control and N1 were not significantly different from N 1 and not between N3 and N4 (p > 0.05); in others groups, they were extremely significant (p < 0.01). For the planting group–soil system, at the N1, N2, N3, and N4 nitrogen input levels, the emission flux of CH4 increased by 38.19%, 57.20%, 77.57%, and 131.08% compared with the control group N0, respectively. The control group N0 showed more significant facilitation than N1, N2, N3, and N4 (p < 0.01); no significant difference was observed between N1 and N2 (p > 0.05). In the no planting group–soil system, N1, N2, N3, and N4 nitrogen concentrations were increased by 28.99%, 68.93%, 86.90%, and 150.40% over the mean control N0 methane emission flux, respectively. The control group N0 was very significant and different from N2, N3, and N4 (p < 0.01), but the control groups N0 and N1 were not significant.
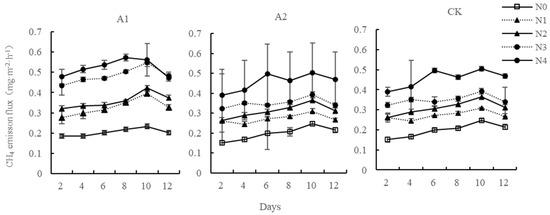
Figure 3.
Changes of methane emission flux from the Kandelia candel–soil system after nitrogen addition. Kandelia candel–soil system (A1); Planting group–soil system (A2); No planting group–soil system (CK).
3.3. The CH4 Emission Contribution of Kandelia candel and Microorganisms under Nitrogen Addition
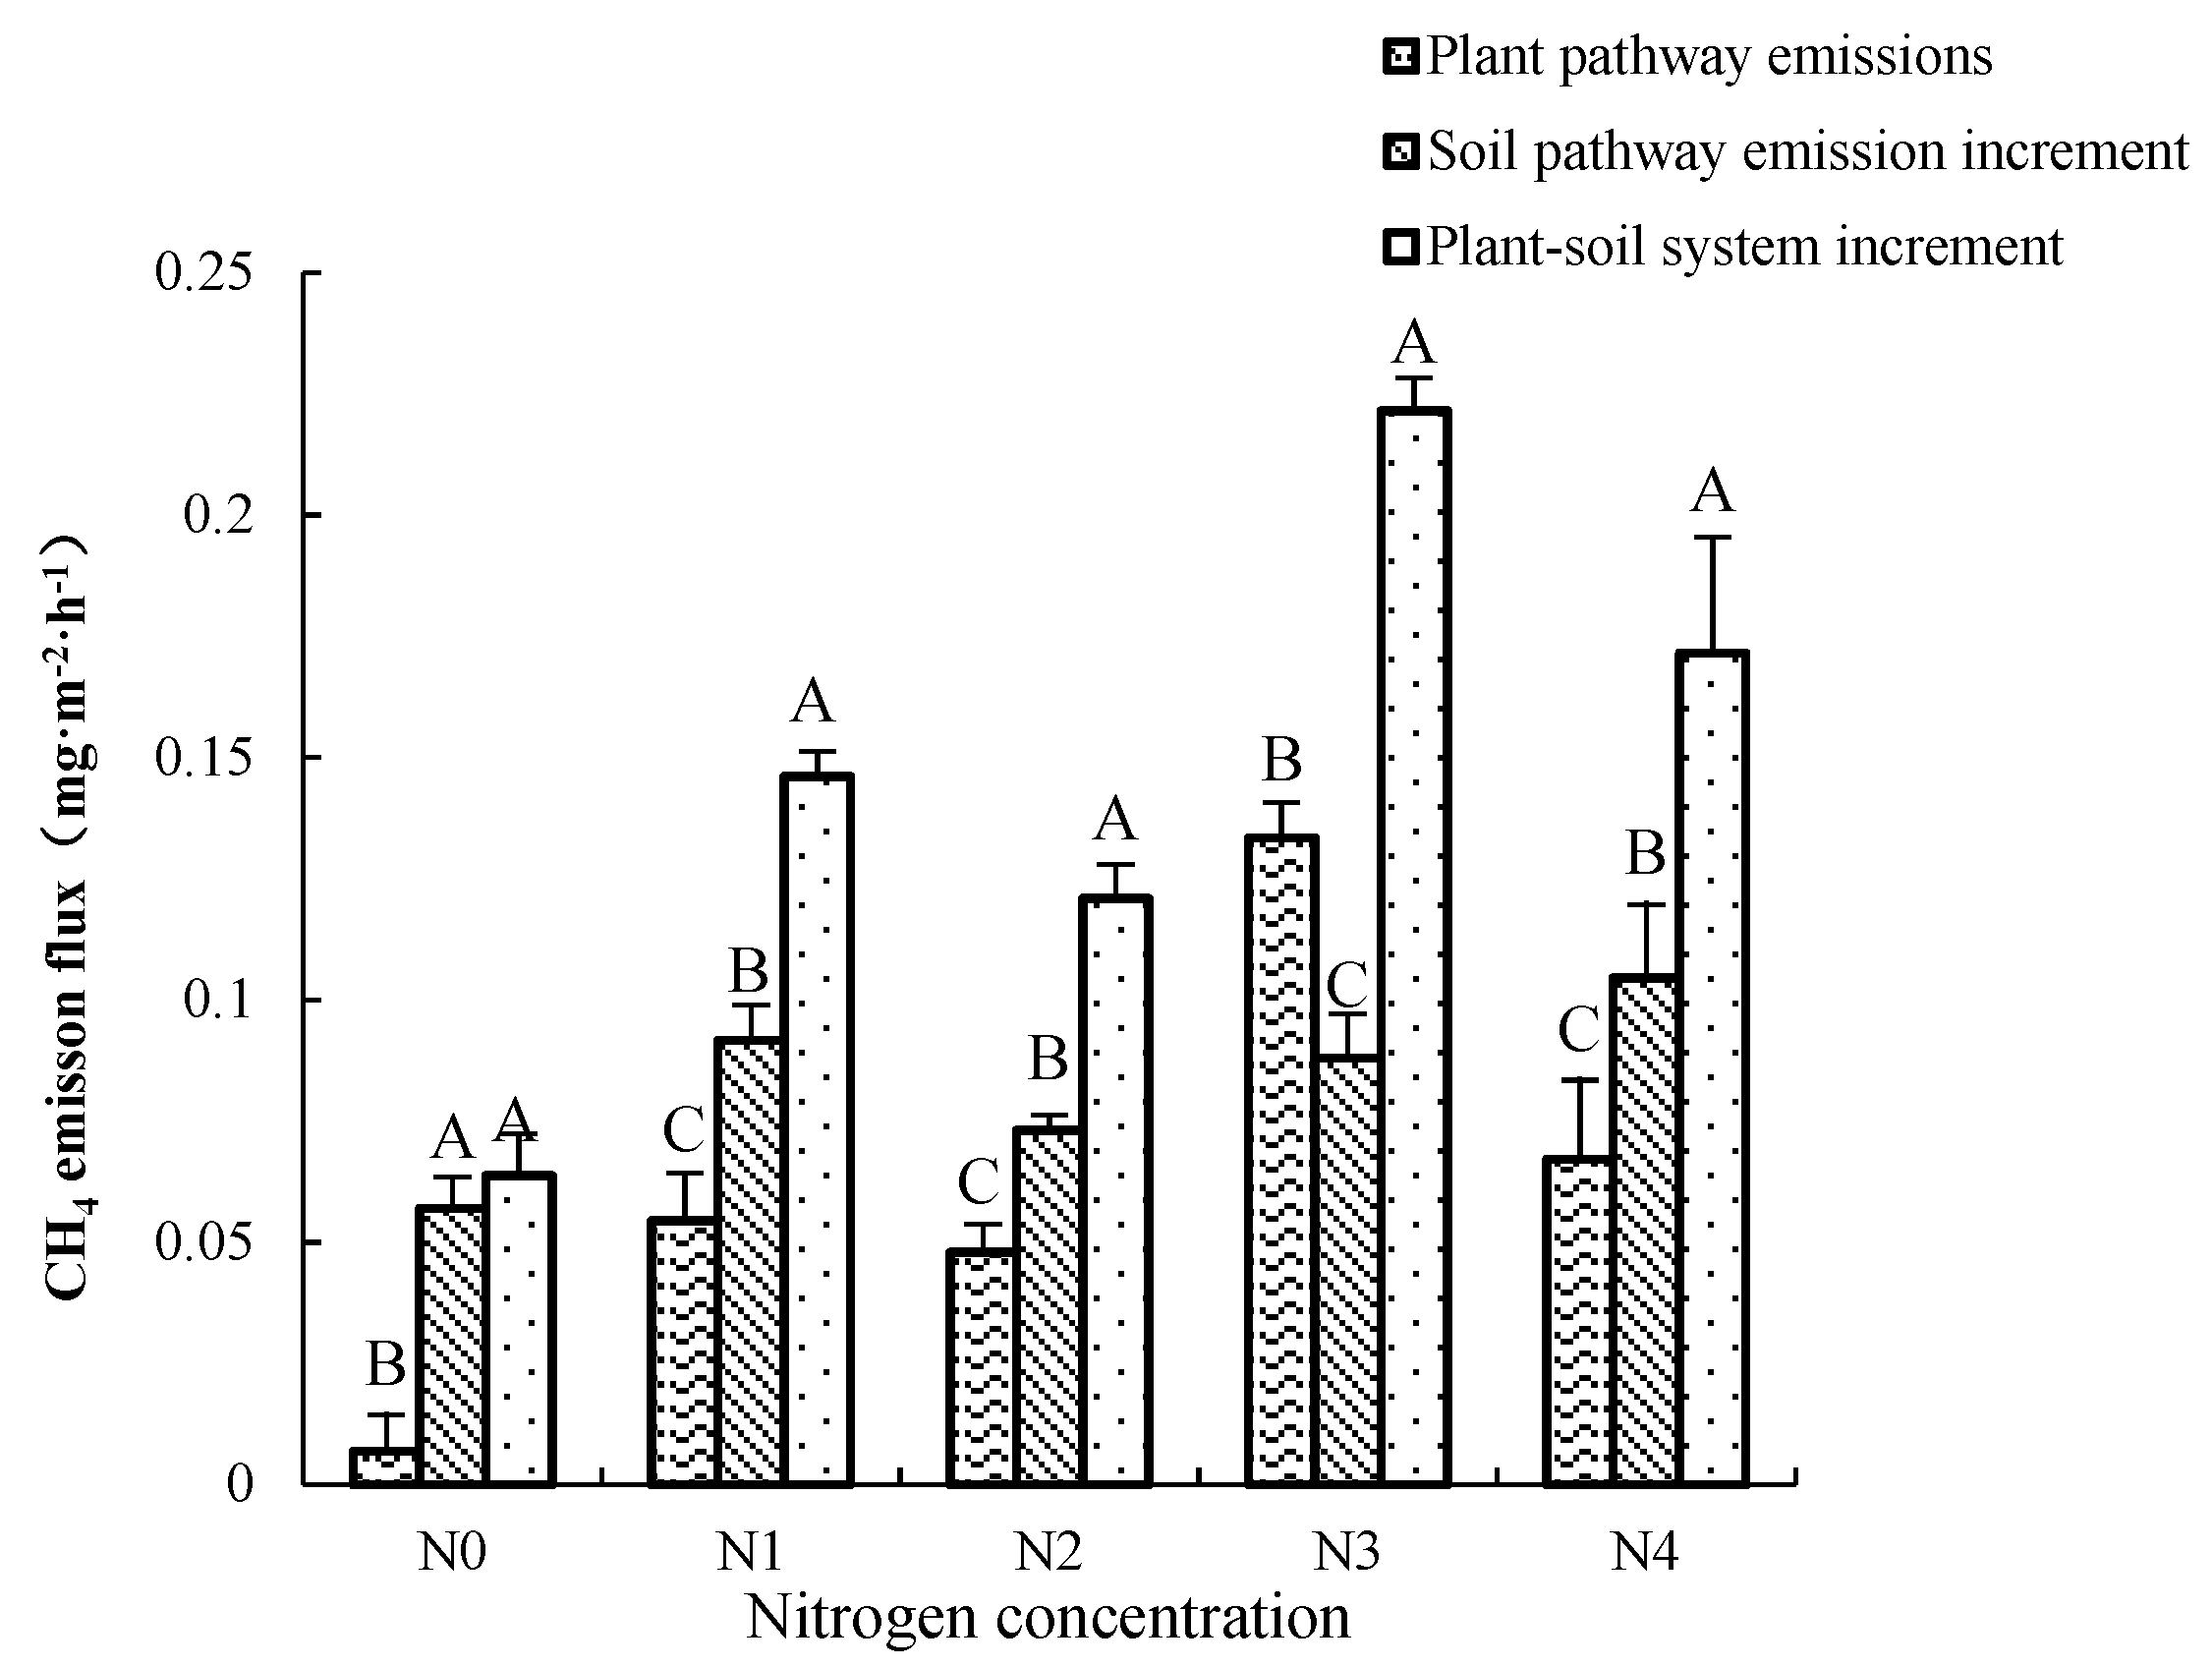
We set three different environmental conditions for the K. candel plant–soil system (A1), the planting group–soil system (A2) and the non-planting group–soil system (CK). Through the difference of emissions between the systems, the increased methane emission flux of the plant pathway and the microbial pathway in the soil after the introduction of plants was calculated (See Figure 4). The difference between A1 and A2 reflects the methane produced by the plant pathway, and the difference between A2 and CK reflects the methane emission of soil microorganisms changed by the introduction of plants. The average CH4 emission flux of the A1 is 0.145 ± 0.081 mg·m−2·h−1; the contribution rate of the transmission of the A1 to the CH4 emission flux of the A1 is between 10.74%~60.25%; the average contribution rate is 37.30%, and the average CH4 emission flux during the cultivation period is 0.062 ± 0.072 mg·m−2·h−1. The contribution rate of methane emission increased by soil pathway due to microbial changes to the CH4 emission flux in the A1 system is from 39.75% to 89.26%, with an average contribution rate of 62.60%, and the average value of CH4 emission flux is 0.083 ± 0.026 mg·m−2·h−1. Under N0 treatment, the increased methane from the soil pathway (0.007 mg·m−2·h−1) was about 8.314 times that produced by the Kandelia candel plant pathway (0.057 mg·m−2·h−1). There were significant differences between the two approaches (p < 0.01). Under N1, N2, and N4 treatments, the methane flux by the Kandelia candel plant pathway had a significant increased, but it was still significantly lower than the methane produced by the soil pathway (p < 0.01). Different from the N0 control group, the methane gas produced by the three groups of soil microbial pathways was also significantly different from the total methane gas produced by the A1 (p < 0.01). We also found that, at the concentration of N3, the methane gas emissions produced by the Kandelia candel plant were the largest (0.048 mg·m−2·h−1), which was significantly higher than the increase in methane emissions from the soil pathway (0.073 mg·m−2·h−1). This result was different from other nitrogen treatments.

Figure 4.
Comparison of methane emission fluxes from microbial pathways in plants and soil. Different uppercase letters indicate the difference between different places.
3.4. Environmental Factors Analysis
Soil temperature and box temperature and CH4 emission flux were negatively related (Table 2). Among them, there was a significant negative correlation between the box temperature and CH4 emission flux of the planting group (p < 0.05), while the negative correlation between the box temperature and CH4 emission of the no planting group was not significant (p > 0.05). Except for N0 and N3, the soil temperature in the planting group had a significant negative correlation with CH4 emissions under other nitrogen concentrations (p < 0.05). There was no significant negative correlation in the no planting group (p > 0.05).
Table 2.
Pearson correlation and significance analysis between environmental factors and CH4 flux.
The soil salinity under various nitrogen concentrations showed fluctuating characteristics with the increase in incubation date; there was no significant difference between soil salinity and CH4 emission flux in groups with and without plants (p > 0.05). According to the correlation analysis (Table 2), the soil salinity and CH4 emission flux were negatively correlated with the N2 treatment in the planting group, but N2 was positively correlated. In the non-planting group, the soil salinity under N0, N2, and N3 nitrogen concentrations is positively correlated with CH4 emission flux, and negatively correlated with other nitrogen concentrations. Under the environment with and without plants, the correlation between soil conductivity and CH4 emission flux was not significant (p > 0.05). Among them, soil conductivity and CH4 emission flux were positively correlated with N0 and N2 nitrogen concentrations in the planting group. The concentration was negatively correlated, and the performance results were different from those of the planting group. In the non-planting group, there was a negative correlation between soil conductivity and CH4 emission flux at each nitrogen concentration.
4. Discussion
4.1. Kandelia candel Promotes CH4 Emissions from Coastal Wetland Ecosystems
Vegetation plays a role in transporting gas and providing required substrates during the methane emission process of wetlands. Plants provide substrates for methanogens through their root litter and exudates. The CO2 produced by plant respiration and root exudates are an important substrate for methane production [34]. Nitrogen input affects CH4 emissions by promoting plant productivity and biomass. Wetlands transmit CH4 gas to the atmosphere through soil–water–plants, and plants can transmit 50% to 90% of the CH4 produced in the soil to the atmosphere [35]. Some studies have shown that the presence of plants increase the emissions of CH4 flux from coastal wetlands [36,37]. The results are consistent with this study. We found that under five nitrogen concentration treatments, the CH4 emission flux of the plant group was significantly higher than that of the no plant group: as the nitrogen treatment concentration increases, the CH4 emission increases. The cause of this result may have been: (1) nitrogen input promotes the growth of autumn eggplant plants, thus the root exudates in the soil increase, and the organic residues also increase, resulting in an increase in substrates and microorganisms, and an increase in the emission flux of CH4. (2) Nitrogen input promotes plant productivity and biomass in plants, which in turn affects CH4 emissions [38]. The increased biomass can generate the substrates required for CH4 [1], which in turn promotes CH4 emissions. (3) Plants change the soil C/N to change the microbial activity in the soil, accelerate the decomposition of root exudates, and at the same time promote the decomposition of organic matter in the soil, which in turn affects CH4 emissions [37].
In the analysis of the homeostasis data of the soil with and without plants, the research team found that under the condition of nitrogen application, the microbial steady state of the planted group is the sensitive state, while the microbial steady state without the planted group was absolute homeostasis. Additionally, the soil microbial biomass carbon and microbial biomass nitrogen of the planted group were higher than those of the unplanted group. The reason may be that, during the growth of Kandelia candel plants, nitrogen input leads to the increase and accumulation of plant root biomass and secretions, which provides more abundant substrates for methanogens; organic substrates are the only source of energy for methanogens with carbon sources, and the activity and function of soil microorganisms are directly determined by the abundance of substrates [39]. This result is caused by changes in substrates and microbial biomass.
4.2. Nitrogen Addition Promotes CH4 Emission Fluxes
This study compared the CH4 emission fluxes of three systems under five different nitrogen concentration treatments, and the results show that the three systems have different degrees of promotion effect on CH4 emissions under different nitrogen input levels, which is expressed as: N4 > N3 > N2 > N1 > N0. There are several possible explanations for this: (1) nitrogen input changes the biomass in the system and affects the supply of C and N available to the soil by plants. Short-term nitrogen input stimulates the activity of soil microorganisms. The organic carbon in the soil can provide substrates for the production of CH4. The abundance of soil directly determines the activity of soil microorganisms and enzymes as well as the performance of their functions, which in turn promoted CH4 emissions [37]. (2) The NH4+ in the NH4NO3 solution promoted the production potential of the tidal flat CH4, and NO3− also has a promotion of the emissions of the tidal flat CH4. Under the combination of the two solutions, the CH4 emission flux increased after nitrogen input [40]. (3) There are a large number of microorganisms in the soil, and their metabolism and life activities require nitrogen. With the input of nitrogen, the lack of nitrogen content in the original environment was alleviated, and a richer substrate environment was provided for the growth of microorganisms. This improved the activity of the microorganisms in the soil, which in turn promoted CH4 emissions [39,41].
Studies have shown that the average methane emissions from a K. candel plant–soil system are 45.41%, 80.62%, 50.97%, 84.34%, 48.76% higher than that of no planting group–soil system at each nitrogen concentration. The cause of this result may have been that nitrogen deposition causes the increased accumulation of root biomass and secretions of K. candel, which provides more abundant substrate supply for methane-producing bacteria and increases the amount of CH4 produced in wetlands [42]. K. candel have a well-developed aeration tissue and nitrogen input promotes the growth of K. candel, increases the number of aeration tissues of the plants, and causes the CH4 emissions of K. candel to increase [43]. The mean value of CH4 emissions in the planting group–soil system were 40.54%, 50.56%, 30.78%, 33.52%, and 29.70% higher than that in the non-planting group–soil system under N0~N4, respectively. The reason may be that the presence of the planting group–soil system due to the surrounding K. candel plants changed the microbial activity in the soil and stimulated the decomposition of the soil organic matter, while promoting the number of methanogens, resulting in more CH4 [44]. Some studies have shown that nitrogen sinks increase the nitrogen content in wetland soil, which increases the oxidative capacity of wetland soil, thus inhibiting CH4 emissions [10]. The cause of this difference may be due to the difference in the soil, such as differences in microorganisms, organic matter, and pH, resulting in the distinctive difference between the results.
4.3. Kandelia candel and Soil Microorganisms CH4 Emission Fluxes
We conducted to distinguish the contribution of plants and soil microorganisms by setting three different environments. There are microorganisms in the three systems; the difference is that the introduction of K. candel changed the original microbial environment, resulting in the difference in the final methane emission flux. The contribution rate is 10.74% to 60.25%, and the average contribution rate is 37.40% during the cultivation period. The average CH4 emission flux emitted by the plant pathway, during the period, was 0.062 ± 0.072 mg·m−2·h−1. Chen Kunlong (2018) in the Minjiang River found that the annual contribution of 26.99% to 97.47% was 66.87% [29], while Liu et al. (2011) found only 18.10% in reed wetland [45]. All are within the range of the plant contribution rate of the results of this study, but there are certain differences in the average contribution rate. We can see that different environmental conditions have certain differences between different plant species. The N3 nitrogen concentration had the largest emission flux and contributed 60.25% to the K. candel plant–soil system, probably due to the productivity level and their largest biomass at this concentration, the highest microbial activity in the soil, most conducive to the production, and release of CH4.
The experiment found that there is a certain difference in the emission fluxes of A2 and CK due to the introduction of autumn eggplant plants. The reason may be that the introduction of plants changed the original microbial activity in the soil or increased the microbial biomass. Except for N3 concentration, the microbial pathway was significantly higher than the contribution of soil microorganisms, which was was 39.75%~89.726%, and the contribution rate was 62.60%. The average value of CH4 emission flux in the culture period was 0.083 ± 0.026 mg·m−2·h−1. The emission flux increases with the increase of the nitrogen concentration, indicating that the nitrogen input enhances the microbial activity in the soil, provides it with a more abundant substrate environment, and promotes its growth. Pangala et al. found that the mean CH4 emission flux in rainforest was 0.0329 ± 0.0078 mg·m−2·h−1 and the peatland pellet emission flux was 0.7 ± 0.5 g·m−2·h−1. Both are lower than the CH4 emitted by the soil microorganisms in this study [46], and the results of the study by Tian Dan et al. in the mangrove forests of the Yingluo Harbor in Guangxi indicate that the CH4 emission flux from the soil is 7.30 mg·m−2·h−1~27.20 mg·m−2·h−1, which is significantly higher than the results of this experimental study [47]. The substrates that produce CH4 in the soil mainly come from the soil organic substances and organic substances released or imported from the outside. The richness of the substrates will directly affect the emission of CH4 [37]. The difference between the tropical rainforest wetland and the results of this study may be due to the different organic carbon content in the soil. The tropical rainforest has a large annual rainfall and strong soil leaching. A large amount of organic matter in the soil is washed away by rain, while the Yingluogang mangrove wetland in Guangxi is significant. The reason for the higher than the results of this study may be that the temperature is higher than the indoor tide simulation laboratory of this study.
4.4. The Relationship between CH4 Emission Fluxes and Its Impacting Factors
Temperature is an important environmental factor affecting CH4 emission in wetland, which mainly affects the methane emissions of ecosystems by affecting plant transport and methane emission capacity and changing soil microbial activity. This experiment shows that the soil temperature, box temperature, and atmospheric temperature are all negatively correlated with CH4 emission flux at each nitrogen concentration. Wang Qing et al. [48] found that the suitable atmospheric temperature for CH4 emissions in the Dongtan wetland in Chongming, China, is between 19 and 31 °C, and the suitable soil temperature for methane emission is between 25 and 27 °C; when the temperature is higher than this in the range, CH4 flux shifts to a lower level. The soil temperature during the cultivation period is between 27.93 °C and 30.75 °C, and the atmospheric temperature is between 28.1 °C and 36.9 °C. It may be that the higher temperature during the cultivation period has suppressed the methane emission of the system to a certain extent.
Salinity is an important environmental factor that affects many ecological processes in wetlands. Soil salinity mainly affects the CH4 emission flux of the system indirectly by influencing plant activities and microbial activities. Salt water will bring a large amount of sulfate. On the one hand, salt water will bring a large amount of sulfate, and when wetland soil is in an anaerobic environment, sulfate will compete with methanogens for substrates, leading to a decrease in CH4 production [49]. On the other hand, a large number of SO42− electron receptors accompanying salt water continuously replace methanogens to produce CH4, resulting in a slower CH4 production rate and reduced CH4 emissions [50]. In this study, the CH4 emission flux of the control group in the planting group was significantly negatively correlated with soil salinity and soil electrical conductivity, but there was no significant correlation under other nitrogen concentrations, indicating that the correlation between soil salinity and conductivity and CH4 emission flux was weakened after nitrogen input. Li Dongdong [9] found that the CH4 emission flux was significantly negatively correlated with soil conductivity and soil salinity in both freshwater and brackish wetlands in the estuarine wetlands of eastern Fujian in southeast China. Poffenbarger et al. [49] also reached a consistent conclusion in estuarine wetlands. We also found that the conductivity of the K. candel planting group was lower than that of the non-planting group, which may be caused by the change of microbial activity in the soil caused by plant root exudates or the presence of plants, which can be further studied in the future. Soil conductivity not only affects the production of CH4, but also affects the gas transport of plants. Conductivity is one of the important indicators to measure the condition of soil anaerobic environment. It has been found that, at lower levels of Eh, plant aerenchyma will become developed, thus affecting the transmission of CH4 [51,52].
5. Conclusions
Kandelia candel plants promote CH4 emissions from coastal wetland ecosystems. With and without plants, the CH4 emission flux gradually increased with the increase in nitrogen concentration, and there was a very significant difference between the two groups under the treatment of five nitrogen concentrations (p < 0.01). At each nitrogen concentration, the average CH4 emission flux of the planting group was 42.98%, 65.59%, 40.87%, 58.93%, 39.23% higher than that of the no planting group. Nitrogen input promotes CH4 emissions from wetland ecosystems; under different concentrations of nitrogen input, the presence of plants promotes CH4 emissions from wetland ecosystems, and it is most significant under the treatment of N1 nitrogen concentration.
Different N input concentrations promoted the system CH4 emission: as the nitrogen concentration increases, the promotion effect increases. N1, N2, N3 and N4 treatment increased the average system CH4 emission flux by 44.11%, 67.09%, 102.35%, 145% and 145.54%, respectively. The effect of nitrogen input on the CH4 emission in the K. candel plant–soil system was N4 > N3 > N2 > N1, and the emission peak was reached on the 10th day of cultivation at each nitrogen concentration.
The contribution rate of the CH4 emission flux of K. candel plant to the K. candel plant–soil system is 10.74%∼60.25%, with an average contribution rate of 37.40%. The contribution rate of the transport of soil microorganisms to the CH4 emission flux of K. candel plant–soil system is between 39.75%∼89.26%, with an average contribution rate of 62.60%. Under the N3 concentration, the CH4 emission flux of K. candel plants was the largest, which was significantly higher than the methane gas produced by the soil microbial pathway, the methane produced by the K. candel plant pathways under other nitrogen concentrations was significantly lower than the methane produced by the soil microorganisms. In the future, it can be further explored whether the introduction of plants changed the activity of the original microorganisms in the soil or the microbial biomass in the soil, or both.
The impact of nitrogen input on CH4 emissions from wetland ecosystems has significant temporal and spatial heterogeneity. After nitrogen input, different observation times and different observation seasons may cause different impact results; there are differences between indoor simulated tide experiments and natural ecosystems, the future research should be expanded and combined with field investigation to conduct comprehensive analysis, and further supplement and refine the research results.
Author Contributions
Conceptualization, H.Y. and F.T.; methodology, H.Y. and F.T.; software, C.F.; validation, D.H., W.Y. and H.Y.; formal analysis, C.F. and H.Y.; investigation, H.Y., J.H. and X.Y.; resources, H.Y.; data curation, C.F.; writing—original draft preparation, C.F.; writing—review and editing, H.Y., W.Y. and D.H.; visualization, C.F.; supervision, H.Y.; project administration, H.Y. and F.T.; funding acquisition, H.Y. All authors have read and agreed to the published version of the manuscript.
Funding
This work was supported by the Fujian Provincial Public Welfare Scientific Institutions Project (2019R1009-3).
Institutional Review Board Statement
No applicable.
Informed Consent Statement
No applicable.
Data Availability Statement
The data presented in this study are available on request from the coreesponding author.
Conflicts of Interest
The authors declare no conflict of interest.
References
- Hu, M.; Tong, C. Effects of nitrogen enrichment on the greenhouse gas fluxes in natural wetlands and the associated mechanism: A review. Chin. J. Ecol. 2014, 33, 1969–1976. [Google Scholar]
- Guirui, Y. Global Change and Carbon Cycle and Carbon Storage in Terrestrial Ecosystem; China Meteorological Press: Beijing, China, 2003. [Google Scholar]
- Segers, R. Methane production and methane consumption: A review of processes underlying wetland methane fluxes. Biogeochemistry 1998, 41, 23–51. [Google Scholar] [CrossRef]
- Gu, H.; Xiao, F.; He, Z.; Yan, Q. Microbial-mediated methane emission mechanisms in wetlands. Acta Microbiol. Sin. 2018, 58, 618–632. [Google Scholar]
- Saarnio, S.; Saarinen, T.I.M.O.; Vasander, H.; Silvola, J. A moderate increase in the annual CH4 efflux by raised CO2 or NH4NO3 supply in a Boreal oligotrophic mire. Glob. Chang. Biol. 2001, 6, 137–144. [Google Scholar] [CrossRef]
- Rosentreter, J.A.; Borges, A.V.; Deemer, B.R.; Holgerson, M.A.; Liu, S.; Song, C.; Melack, J.; Raymond, P.A.; Duarte, C.M.; Allen, G.H. Half of global methane emissions come from highly variable aquatic ecosystem sources. Nat. Geosci. 2021, 14, 225–230. [Google Scholar] [CrossRef]
- Tao, B.; Chen, Y. Effects of nitrogen forms on the stability of soil organic carbon in wetlands: A review. Ecol. Environ. Sci. 2016, 25, 162–167. [Google Scholar]
- Quanzhou Environmental Protection Bureau. 2017 Quanzhou Environmental Quality Bulletin; Quanzhou Environmental Protection Bureau: Guangzhou, China, 2017.
- Li, D. Effects of Simulated Nitrogen Deposition on CO2 and CH4 Emissions from Freshwater and Brackish Marshes in the Min River Estuary; Fujian Normal University: Fuzhou, China, 2018. [Google Scholar]
- Liu, X.M.; Gao, T.T.; Zhang, Z.J.; Tan, K.X.; Jin, Y.B.; Zhao, Y.J.; Chao, L.I. The mitigation effects of exogenous dopamine on low nitrogen stress in Malus hupehensis. J. Integr. Agric. 2020, 19, 2709–2724. [Google Scholar] [CrossRef]
- Mou, X. Response of Key Processes of Carbon and Nitrogen Cycle to Nitrogen Addition in the Min River Estuarine Wetland; Graduate School of Chinese Academy of Sciences (Northeast Institute of Geography and Agroecology): Beijing, China, 2013. [Google Scholar]
- Li, R.; Chang, R. Effect of external nitrogen additions on soil organic carbon dynamics and the mechanism. Chin. J. Plant Ecol. 2015, 39, 1012–1020. [Google Scholar]
- Mou, X.; Liu, X.; Tong, C.; Sun, Z. Responses of CH4 emissions to nitrogen addition and Spartina alterniflora invasion in Minjiang River estuary, southeast of China. Chin. Geogr. Sci. 2014, 24, 562–574. [Google Scholar] [CrossRef] [Green Version]
- Ministry of Ecology and Environment of the People’s Republic of China. 2020 Bulletin on the State of China’s Marine Ecological Environment; Ministry of Ecology and Environment of the People’s Republic of China: Beijing, China, 2021.
- Zheng, K.Z.; Chen, G.; Zheng, X.W.; Chen, G.Z. Wastewater treatment with constructed mangrove wetland system: A review. Chin. J. Ecol. 2009, 28, 138–145. [Google Scholar]
- Song, C.C.; Wang, Y.Y.; Wang, Y.S.; Zhao, Z.C. Dynamics of CO2, CH4 and N2O emission fluxes from mires during freezing an thawing season. Environ. Sci. 2005, 26, 7–12. [Google Scholar]
- Granberg, Q.; Sundh, I.; Svensson, B.H.; Nilsson, M. Effects of temperature, and nitrogen and sulfur deposition, on methane emission from a Boreal Mire. Ecology 2001, 82, 1982–1998. [Google Scholar] [CrossRef]
- Zeng, C.; Wang, W.; Tong, C. Effects of different exogenous electron acceptors and salt import on methane production potential of estuarine marsh soil. Geogr. Res. 2008, 25, 1321–1330. [Google Scholar]
- Cai, Z.; Xing, G.; Yan, X.; Xu, H.; Tsuruta, H.; Yagi, K.; Minami, K. Methane and nitrous oxide emissions from rice paddy fields as affected by nitrogen fertilisers and water management. Plant Soil 1997, 196, 7–14. [Google Scholar] [CrossRef]
- Fechner, E.J.; Hemond, H.F. Methane transport and oxidation in the unsaturated zone of a Sphagum peatland. Glob. Biogeochem. Cyecles 1992, 6, 33–44. [Google Scholar] [CrossRef]
- Allen, D.E.; Dalal, R.C.; Rennenberg, H.; Meyer, R.L.; Reeves, S.; Schmidt, S. Spatial and temporal variation of nitrous oxide and methane flux between subtropical mangrove sediments and the atmosphere. Soil Biol. Biochem. 2007, 39, 622–631. [Google Scholar] [CrossRef]
- Chen, G.C.; Tam, N.F.Y.; Ye, Y. Summer fluxes of atmospheric greenhouse gases N2O, CH4 and CO2 from mangrove soil in South China. Sci. Total Environ. 2010, 408, 2761–2767. [Google Scholar] [CrossRef]
- Chen, G.C.; Tam, N.F.Y.; Ye, Y. Spatial and seasonal variations of atmospheric N2O and CO2 fluxes from a subtropical mangrove swamp and their relationships with soil characteristics. Soil Biol. Biochem. 2012, 48, 175–181. [Google Scholar] [CrossRef]
- Cui, S. Interrelationship between Methane Dynamics and Environmental Factors in Kandelia candel Mangrove Wetland; Xiamen University: Xiamen, China, 1998. [Google Scholar]
- Lu, C.Y.; Ye, Y.; Huang, Y.S.; Tan, F.Y. Methane flux of mangrove communities in Niaodongzhai Harbor, Hainan. Acta Microbiol. Sin. 2000, 24, 87–90. [Google Scholar]
- Lu, C.Y.; Jin, L.; Ye, Y.; Ye, G.F. Diurnal variation of soil respiration and its temperature sensitivity in Kandelia candel mangrove wetland. J. Xiamen Univ. (Nat. Sci.) 2012, 51, 793–797. [Google Scholar]
- Gao, C.; Hu, J.; Yan, K.; Xin, K. Carbon dioxide and methane emission fluxes from soil in mangrove forest in Dongzhaigang, Hainan. Wetl. Sci. 2017, 15, 7. [Google Scholar]
- Zhang, Y.; Hu, W.; Luo, M.; Tong, C.; Huang, J. Carbon, nitrogen, and phosphorus dynamics an hydrolytic enzyme activities during foliar litter decomposition of Kandelia candel in a mangrove population of the Min river estuary. Acta Ecol. Sin. 2019, 39, 13. [Google Scholar]
- Chen, K. Methane Emission Flux of Kandelia candel Mangrove Ecosystem in Minjiang Estuary and Its Contribution; Fujian Normal University: Fuzhou, China, 2018. [Google Scholar]
- Terrer, C.; Phillips, R.P.; Hungate, B.A.; Rosende, J.; Pett-Ridge, J.; Craig, M.E.; van Groenigen, K.J.; Keenan, T.F.; Sulman, B.N.; Stocker, B.D.; et al. A trade-off between plant and soil carbon storage under elevated CO2. Nature 2021, 591, 599–603. [Google Scholar] [CrossRef] [PubMed]
- Wang, L.; Pan, D.; Lv, X.; Cheng, C.L.; Li, J.; Liang, W.; Xing, J.; Chen, W. A multilevel investigation to discover why Kandeliacandel thrives in high salinity: Phenylpropanoids and amino acids under salt stress. Plant Cell Environ. 2016, 39, 2486–2497. [Google Scholar] [CrossRef] [PubMed]
- Huang, Q. Atmospheric nitrogen deposition in Xiamen city. Energy Environ. 2018, 1, 63–66. [Google Scholar]
- Liao, J. Analysis of Methane and Carbon Dioxide Emission Flux from Reed Wetland in the Estuary of Minjiang River; Fujian Normal University: Fuzhou, China, 2010. [Google Scholar]
- Zhou, W.; Wang, J.; Liu, J. Study on the relation of plant biomass and CH4, N2O emission in the wetland of Sanjiang Plain. J. Univ. Chin. Acad. Sci. 2006, 23, 736–743. [Google Scholar]
- Chen, H.; Zhou, S.; Wu, N.; Wang, Y.F.; Luo, P.; Shi, F.S. Advance in studies on production, oxidation and emission flux of methane from wetlands. Chin. J. Appl. Environ. Biol. 2006, 12, 726–733. [Google Scholar]
- Hirota, M.; Senga, Y.; Seike, Y.; Nohara, S.; Kunii, H. Fluxes of carbon dioxide, methane and nitrous oxide in two contrastive fringing zones of coastal lagoon, Lake Nakaumi, Japan. Chemosphere 2007, 68, 597–603. [Google Scholar] [CrossRef]
- Jiang, H.; Sun, Z.; Song, H. A preliminary study on methane production potential of soil in tidal wetlands of the Yellow River estuary and its responses to organic matter and nitrogen import. Wetl. Sci. 2012, 10, 451–458. [Google Scholar]
- Hu, M.; Tong, C.; Zou, F. Effects of nitrogen input on CH4 production, oxidation and transport in soils, and mechanisms: A review. Acta Pratacult. Sin. 2015, 24, 204–212. [Google Scholar]
- Wu, L.; Ma, K.; Li, Q.; Ke, X.; Lu, Y. Composition of archaeal community in a paddy field as affected by rice cultivar and N fertilizer. Microb. Ecol. 2009, 58, 819–826. [Google Scholar] [CrossRef] [PubMed]
- Hu, M. Effects of Enrichement of Nitrogen and Sulfate Load on CH4 and CO2 Fluxes from the Cyperus malaccensis Marsh in the Min River Estuary; Fujian Normal University: Fuzhou, China, 2016. [Google Scholar]
- Dai, Z.; Yu, M.; Chen, H.; Zhao, H.; Huang, Y.; Su, W.; Xia, F.; Chang, S.X.; Brookes, P.C.; Dahlgren, R.A.; et al. Elevated temperature shifts soil N cycling from microbial immobilization to enhanced mineralization, nitrification and denitrification across global terrestrial ecosystems. Glob. Chang. Biol. 2020, 26, 5267–5276. [Google Scholar] [CrossRef] [PubMed]
- Song, C.C.; Zhang, L.H.; Wang, Y.Y.; Zhao, Z.C. Annual dynamics of CO2, CH4, N2O emission from freshwater marshes and affected by nitrogen fertilization. Environ. Sci. 2006, 27, 2369–2375. [Google Scholar]
- Joabsson, A.; Christensen, T.R. Methane emissions from wetlands and their relationship with vascular plants: An Arctic example. Glob. Chang. Biol. 2010, 7, 919–932. [Google Scholar] [CrossRef]
- Xu, X.; Zhao, Y.; Zou, X.; Tang, D.; Liu, D. Advances in the research on methane emissions of coastal saline wetlands in China. J. Nat. Resour. 2015, 30, 1594–1605. [Google Scholar]
- Liu, Z. Methane Transport by Reed Wetland Plants in the Estuary of Minjiang River; Fujian Normal University: Fuzhou, China, 2011. [Google Scholar]
- Pangala, S.R.; Moore, S.; Hornibrook, E.R.; Gauci, V. Trees are major conduits for methane egress from tropical forested wetlands. New Phytol. 2013, 197, 524–531. [Google Scholar] [CrossRef]
- Tian, D. Study on CH4 and CO2 Emission Fluxes from Mangrove Soils in Yingluo Harbor, Guangxi; Guangxi Normal University: Guilin, China, 2012. [Google Scholar]
- Wang, Q.; Liu, M.; Hou, L.; Cheng, S. Temporal and spatial differences of CO2, CH4 and N2O emissions in Dongtan Wetland of Chongming. Geogr. Res. 2010, 29, 935–946. [Google Scholar]
- Poffenbarger, H.J.; Needlman, B.A.; Megonigal, J.P. Salinity influence on methane emissions from tidal marshes. Wetlands 2011, 31, 831–842. [Google Scholar] [CrossRef]
- Tremblay, A.; Varfalvy, L.; Garneau, M.; Roehm, C. Greenhouse Gas Emissions-Fluxes and Processes: Hydroelectric Reservoirs and Natural Environments; Apress: New York, NY, USA, 2005; Volume 7, pp. 111–127. [Google Scholar]
- Zhang, Y. Research progress on methane emissions from wetlands. Chin. J. Environ. Eng. 1998, 1, 39–48. [Google Scholar]
- Hao, Q.J.; Wang, Y.S.; Song, C.C.; Liu, G.R.; Wang, Y.Y.; Wang, M.X. Study of CH4 emission from wetlands in Sanjiang Plain. J. Soil Water Conserv. 2004, 18, 194–199. [Google Scholar]

Publisher’s Note: MDPI stays neutral with regard to jurisdictional claims in published maps and institutional affiliations. |
© 2022 by the authors. Licensee MDPI, Basel, Switzerland. This article is an open access article distributed under the terms and conditions of the Creative Commons Attribution (CC BY) license (https://creativecommons.org/licenses/by/4.0/).