Abstract
We analyzed the abundance of benthic algae in nine forested headwater watersheds in south-central Chile to study the relationship between the variability of the abundance of benthic algae and physicochemical parameters and forest cover factors. Between 10 November 2015 and 18 August 2016, we sampled benthic algae and physicochemical parameters in the streams and characterized forest cover factors in each of the study watersheds. We found that physicochemical parameters and forest cover factors have contrasting effects on abundance. More specifically, the following observations were made: (1) maximum diversity and abundance occurred in watersheds covered with Pinus radiata, (2) seasonal ranks did not influence the abundance of benthic algae, (3) benthic algae abundance is controlled by rank dissimilarities in type of vegetation, solar radiation, volume, density age, canopy openness, native forest area, plantation area and harvested area, and (4) regression analysis of genera exhibited significant variability with physicochemical parameters (water temperature, pH, ammonium, nitrate, phosphorus, solar radiation) and forest cover factors (volume, density, age, native forest area, plantation area and harvested area); however, these effects were not seen in all genera. Factors related to the benthic algae compartment showed the highest sensitivity to forest cover, emphasizing their value as biological indicators of water quality and stream ecological integrity.
1. Introduction
At a local scale, headwater stream systems, flow patterns, temperature and substrates appear to be the key variables that influence the conditions experienced by benthic algae [1]. Other more immediate impacts might be related to flow patterns (via terrain slope and roughness), temperature (via elevation and climate-dependent riparian vegetation), the geological environment and land use [2,3]. Additionally, the availability of light and the productivity of streams act as controlling factors for the composition of benthic algae at various riparian vegetation widths [4,5]. These conditions directly influence the streams’ habitats and can be used to predict species composition [1]. Ref. [6] recognized the effect of light as a limiting factor for benthic primary productivity in riverine ecosystems. The composition of benthic algae can be related to water chemistry (pH, stream conductivity and nutrient concentrations), and factors such as substrate, light availability, and flow velocity [7,8,9,10].
The mid-latitude terrestrial ecosystems of the Chilean Coastal Range are characterized by a climate with dry summers and by highly productive forests of fast-growing exotic species (specifically Pinus radiata D. Don and Eucalyptus globulus Labill), which currently occupy 2.4 million hectares [11]. In these watersheds, stream benthic algae are strongly influenced by riparian vegetation through multiple forest cover processes acting on different spatial and temporal scales. For example, discharge and solute and seston loads respond to rainfall and forest cover, soil, and geology physiography at the scale of the watershed, while stream hydraulics, light and organic inputs tend to be more sensitive to terrain slope, roughness, and the conditions of the riparian zone [1,12,13,14].
While the effects of intensive forest plantation on benthic algae seem clear in the northern hemisphere [15,16], the understanding of their impact on southern mid-latitude ecosystems such as those in Chile is far from complete, particularly when comparing different forest-management plantation systems. Numerous environmental evaluations of benthic algae communities have been used as stress or habitat-type indicators [17]. Studies of benthic algae in forests demonstrated that changes of algae composition were caused by increased light availability following harvest [18]. Shifts between species were partly explained by higher concentrations of nitrogen and phosphorus and an increased turbidity and stream conductivity of harvested watersheds [15,16]. On the other hand, several studies focusing on benthic algae compositions as an indicator for stream-water conditions demonstrated that ion concentrations exerted an important control on the composition of benthic communities [19,20].
From the ecological and socioeconomic points of view, the expansion of planted forests has been questioned due to its impact on biodiversity [21]. Understanding the relationship between benthic algae and forest cover factors, as well as their temporal evolution is therefore crucial in developing integrated biodiversity management policies in intensive managed plantations. The present study focuses on the relationships between forest cover, riparian vegetation, and streams to determine benthic algae composition and their variation under different forest cover schemes and conditions in the watershed headwaters. The main aim was to investigate whether physicochemical parameters or forest cover caused significant changes in algae abundance and community composition.
We hypothesized that physicochemical parameters, i.e., pH, stream conductivity, nutrient concentrations, light availability and flow velocity, caused by forest cover led to changes in algal abundance and community composition. Specifically, we predicted that forest cover would change community composition, at higher forest plantation volume, density and age, or decrease algal abundance due to canopy openness limiting light. Alternatively, we studied the potential seasonal effect in the abundance of benthic algae.
2. Materials and Methods
2.1. Study Area
The study was conducted in nine watersheds located in the Chilean Coastal Range in the Biobío Region (Figure 1) which corresponds to the central hydroclimatic zone of Chile.
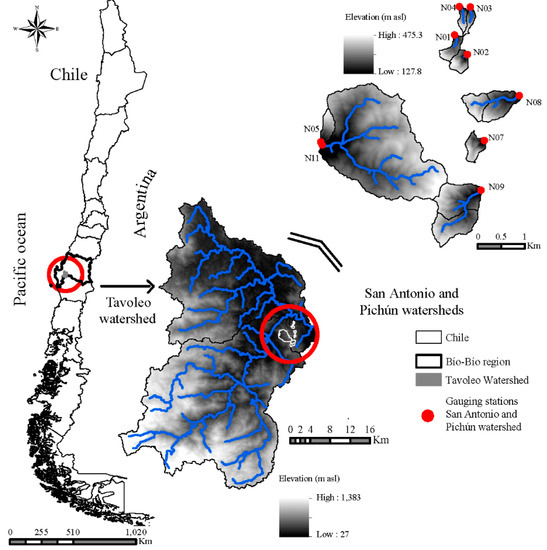
Figure 1.
Sampling since 10 November 2015, and 18 August 2016 of benthic algae communities in nine study watersheds, located in San Antonio and Pichún higher-order watersheds, Chilean Coastal Range, Biobío region.
The study watersheds are located 3 km west of the town of Nacimiento (37°28′ S, 72°42′ W) and are part of the higher-order San Antonio and Pichún watersheds. The hydrology and climate of the watersheds have been monitored since 2008. Past hydrologic investigations at Pichún and San Antonio focused on the effects of forest cover activities on water yield [22,23,24,25], peak flows [26], stream flow responses to earthquakes [27] and the accumulation of in-stream wood in low-order forested streams [28]. Detailed site descriptions of the higher- and lower-order watersheds in this hydrologic system are given by [22,27].
The study watersheds are characterized by a subtropical Mediterranean climate with dry summers. Mean long-term annual rainfall is estimated to be 1381 mm, most of which (95%) occurs between April and September during frequent and prolonged low- to moderate-intensity frontal storms. The long-term rainfall record is marked by inter-annual variations, and its spatial distribution is orographically controlled by the topography of the coastal mountain range, with elevations of up to 1383 m.a.s.l., mean slopes from 14 to 22° but exceeding 60° along the channel networks and road cuts, promoting active gully formation and erosion [27]. During rainfall events, the plantations in the study watersheds are generally immersed in mist or clouds due to their relatively low altitude (233–389 m.a.s.l). On average, 25.5% (16.3 to 41.3%) of the annual rainfall turns into highly responsive runoff.
The Mediterranean climate has wet, mild winters and exceptionally dry, warm to hot summers [29]. The temperature ranges from less than −3 °C (winter) to more than 40 °C (summer), with an annual average of 13 °C [11,27]. The physiographic characteristics of all watersheds are summarized in Table 1. The watersheds are characterized by granitic bedrock covered by clayey to loamy soils and have areas of between 0.07 and 4.1 km2. The average slope is between 27 and 44% over an elevation range of 233 to 368 m.a.s.l. The drainage density ranges from 2.2 to 7.7 km/km2.

Table 1.
Physicochemical and forest cover parameters of studied watersheds.
The watersheds are mainly covered by plantation forests of the genera Eucalyptus and Pinus (Table 1). The vegetation cover varies from 57.5 to 92.7% for planted forests and from 4.1 to 40.9% for natural forests. The fluvial channels in all watersheds are bounded by a 15–70 m wide riparian zone with native forests and some Pinus radiata specimens that have invaded the area by natural regeneration during previous rotations [30,31].
The soil exhibits a thin herbaceous cover (<25%) mainly composed of grasses that usually perish during the summer because of water deficit [22]. The shrub cover under the most developed plantations is rather dispersed and mostly composed of the genera Aristotelia L’Her and Rubus Schott, as well as some arboreal genera such as Luma apiculata Burret, Peumus boldus Molina, Persea lingue Miers ex Bertero Nees and Nothofagus dombeyi Mirb.
The watersheds soil type is a clayey to loamy Luvisol with a variable structure on a small scale due to fragments of bedrock within the topsoil, which is a complex distribution of recent and former root systems (Table 1) [27]. Truncated soil profiles exposing low conductive B-horizons and evidence of recent incision indicate active soil erosion and landsliding, and disturbance by timber harvest, e.g., [32].
2.2. Physiographic Variables and Forest Cover in the Study Watersheds
We used detailed LiDAR (1 m resolution DEM) to calculate the physiographic variables, including watershed area (km2), average watershed slope (G [%], the median value of slopes for all grid cells in a watershed, and elevation (m.a.s.l.) [31]. Photointerpretation of LiDAR images provided the characterization of forest use, as follows: the areas of planted and native forests and roads; harvested land; and the average width of the riparian zone (m). For each of the analyzed parameters, the different forest cover uses (plantation, native forests, roads, harvested and riparian zone) in each watershed were digitized in polygons using the vector layer method. Once the layers were digitized, the respective areas were calculated in relation to the total area of each watershed to obtain the percentage of different land uses [11,31].
The distance (m) between the vector layers corresponding to the main fluvial channel and the outer limit of the riparian zone was used to create a raster layer for calculating the average width of the riparian areas [31]. The identification of planted species was performed by image recognition and validated by field check to confirm the identified species. Finally, the age of planting (year), the planting volume (m3/ha), the planting density (trees/ha) and the soil type were obtained through digital coverage (format shape) support from Forestal Mininco S.A. The landscape variables are summarized in Table 1.
2.3. Stream Physicochemical Parameters
Stream water samples for the analysis of nitrate, nitrite, ammonium, and soluble phosphorus concentrations were collected in 500 mL bottles once every 45 days between 10 November 2015 and 18 August 2016. The samples were subjected to segmented flow analyses using a SKALAR module and standard APHA methods (2005), as follows: the 4500 E standard method (2005) was used for instream nitrate-nitrogen (NO3-N), nitrite-nitrogen (NO2-N) and ammonium-nitrogen (NH4-N), with NO3-N and NO2-N concentration with an L.D. of 0.002 mg N/L and for NH4-N concentration with an L.D. of 0.003 mg N/L. The 4500 blue ascorbic acid method (2005) was used for soluble phosphorus (PO4-P) concentration with an L.D. of 0.002 mg P/L. Water temperature, dissolved oxygen, pH, conductivity, and turbidity were measured at each site using a calibrated brand WTW® model 350i multiparameter probe.
Digital hemispherical canopy photographs were taken above each algae collection point (one photo per habitat type), using a Sony Alpha 37 camera equipped with a fisheye lens. The hemispherical canopy photographs were overlain by the sun-path to calculate the total amount of solar radiation (MJm−2), the amount transmitted through openings in the canopy (SRt) (Mols m−2 d−1) and the percent openings in the canopy (%) [16,33]. According to [16,34], each photograph was processed and analyzed with a gap light analyzer (GLA). (See Table S1. Additional supporting information, Gap light analyzer (GLA) program setup).
2.4. Benthic Algae
Benthic algae were sampled in all nine of the studied watersheds upstream of the fluviometric control points (Thompson type concrete dumps with a V of 60°) between 10 November 2015 and 18 August 2016. Non-qualitative sampling was carried out using artificial substrates of plastic paper that firmly adhered to porcelain tile blocks of 22.1 × 28 cm that were standardized in color, texture, and size and immersed at the sampling sites. The block was placed at the bottom of the river, between the stones, at a depth of approximately 50 cm. The block remained at the bottom of the river for a period of 45 days. The sheet material was transferred using a soft bristle brush, and the resulting suspension was collected and preserved in bottles with 10% Lugol’s solution. All fixed samples were stored, protected from light and in a cool place (<15 °C). In the laboratory, a quantitative analysis of the samples that included a count of the benthic algae genera (diversity) and total individuals present of benthic algae (abundance) was carried out via subsample extraction from the field specimen. A drop of the suspension was placed with a Pasteur pipette between a slide and coverslip to be observed under an inverted microscope with a digital camera attached [35]. We counted >1000 cells as total samples at ×100-magnification. The taxonomic (genera) identification was conducted on the basis of the specialized bibliography in [35,36,37,38] and the specialized literature for each group from studies including [36,39,40,41,42,43,44,45,46,47,48,49,50,51].
2.5. Data Analysis
All statistical analyses were performed using the R software package [52]. Kruskal–Wallis (KW) non-parametric tests were used to derive the statistical significance of differences (p ≤ 0.05) of diversity (count of the benthic algae genera) and abundance (total individuals present).
We correlated the abundance data (total individuals present and genera categorization) with physicochemical parameters, canopy, solar radiation, and forest cover data described in Table 1 using linear regression (linear correlation coefficient (R) and results were considered statistically significant if the p ≤ 0.05).
The analysis of similarity (ANOSIM) was used to evaluate whether there was a significant difference between two or more groups of sampling units [53]. ANOSIM provides a robust measure of magnitude of abundance change associated with each factor (physiochemical parameters, canopy, solar radiation, and forest cover characteristics), having excised any possible effect from the factor(s) it is crossed with, irrespective of whether the factors interact or not [53]. There is no replication, as there are no within-group dissimilarities. Instead, the effect of the factor (physiochemical parameters, canopy, solar radiation, and forest cover characteristics) is determined by assessing whether there is evidence of a common pattern among the different levels of abundance when examined for each of the levels of the factor [54].
ANOSIM was calculated using Bray–Curtis distances with 999 Monte Carlo permutations [16,53], which compares the similarities of the abundance with different physiochemical parameters, canopy, solar radiation, and forest cover characteristics. Specifically, the following were examined: a box plot of rank dissimilarities (R (slope)) among the nine sites of the abundance against a) the four seasons ranks (Autumn: April and May; Winter: July and August; Spring: November and December; Summer: January and March), (b) type vegetations ranks (Eucalyptus globulus and Pinus radiata), (c) native forest area ranks, (d) plantation area ranks, (e) harvested area ranks, (f) canopy openness ranks, (g) solar radiation transmitted ranks, (h) planting volume ranks, (i) planting density ranks and (j) age of planting ranks, from a serial ordering model of groups..
3. Results
3.1. Benthic Algae
Although all sites exhibited substantial variability, the maximum diversity (count of the genera) and abundance (total individuals present) occurred on watersheds covered with Pinus radiata. During the first sampling at the beginning of the study, diversity ranged from 0 (N07) to 9 (N01). Diversity increased during the study, reaching a maximum of 29 cumulative genera in watershed N07 covered with Eucalyptus globulus, and 54 cumulative genera in watershed N02 covered with Pinus radiata (Figure 2a). The total abundance increased during the study, reaching a minimum of 7 and maximum of 275 cumulative individuals (Figure 2b). During the study, no significant differences in the diversity between watersheds could be estimated (p = 0.4); however, significant differences were found in total abundance (p = 0.002).
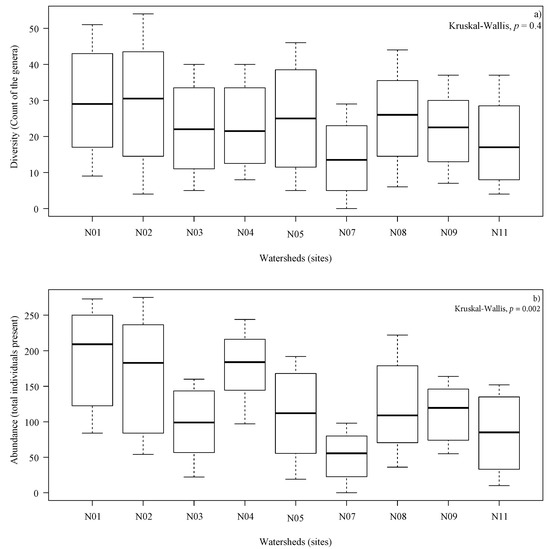
Figure 2.
(a) Distribution of diversity (count of the genera) and (b) Distribution of abundance (total individuals present) in each watershed collected, 8 samples per watershed during sampling between 10 November 2015 and 18 August 2016. In (a,b), p-value using Kruskal–Wallis nonparametric test. The line within each box indicates the median value, box ends are the 25th and 75th percentiles, and the whiskers show the largest value within a 1.5 interquartile range from third quartile and the minimum value.
The resulting data matrix can be seen in Table 2. In total, 22 different genera were categorized from the nine watersheds (eight samples per watershed). The most common benthic algae were Gomphonema Ehrenberg, Closterium Brébisson, Fragilaria Lyngbye and Navicula Bory.
Table 2.
Resulting data matrix in total there were 22 different genera categorized from the 9 watersheds.
3.2. Anosim
The alternative hypothesis analyzed in this study provided no statistical evidence that seasonal ranks influenced the abundance of benthic algae. The ANOSIM indicated R (slope) = 0.02, p = 0.2, (Figure 3a). As there was no seasonal variation within sites, data from each study area were combined to account for the general site-specific composition of algae assemblages.
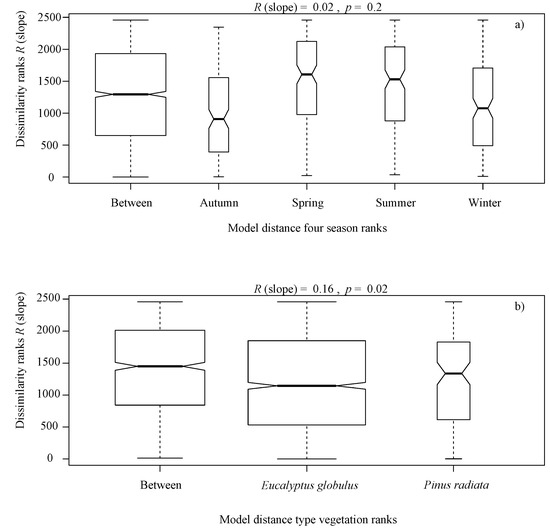
Figure 3.
Box plot of rank dissimilarities (R (slope)) among the 9 sites against the four seasons ranks (Autumn, Winter, Spring and Summer) (a), and type vegetation ranks (Eucalyptus globulus and Pinus radiata) (b), from a serial ordering model of groups.
It is noteworthy that overall, the benthic algae is controlled with forest cover factors, indicating significant differences in terms of the type of vegetation ranks (Eucalyptus globulus and Pinus radiata) (R (slope) = 0.16, p = 0.02, Figure 3b), native forest area ranks (R (slope) = 0.24, p = 0.001, Figure 4a), plantation area ranks (R (slope) = 0.25, p = 0.001, Figure 4b), harvested area ranks (R (slope) = 0.18, p = 0.001, Figure 4c), canopy openness ranks (R (slope) = 0.25, p = 0.001, Figure 4d), solar radiation transmitted ranks (R (slope) = 0.24, p = 0.001, Figure 4e), planting volume ranks (R (slope) = 0.25, p = 0.001, Figure 4f), planting density ranks (R (slope) = 0.24, p = 0.001, Figure 4g) and age of planting ranks (R (slope) = 0.15, p = 0.001, Figure 4h), from a serial ordering model of groups.
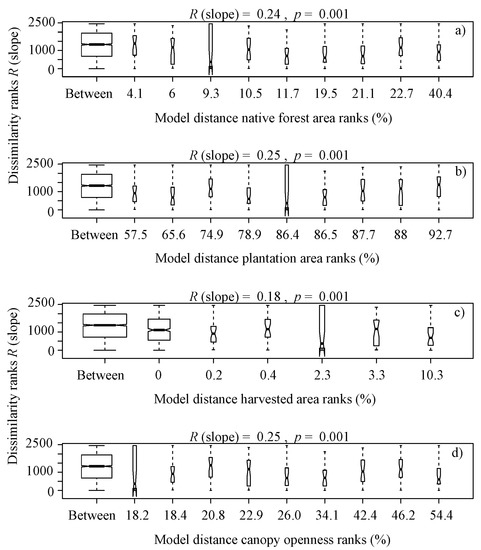
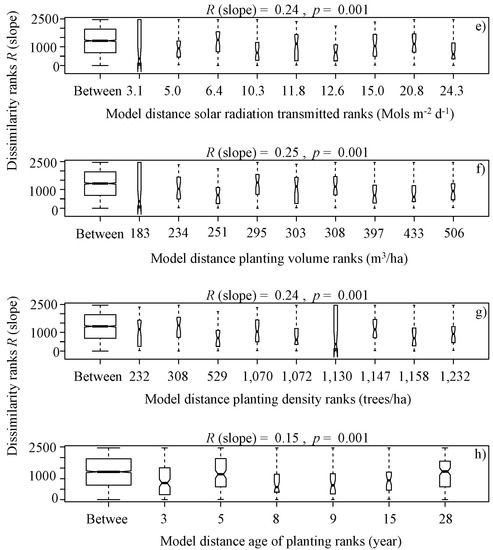
Figure 4.
Box plot of rank dissimilarities (R (slope)) among the 9 sites against native forest area ranks (a), plantation area ranks (b), harvested area ranks (c), canopy openness ranks (d), solar radiation transmitted ranks (e), planting volume ranks (f), planting density ranks (g) and age of planting ranks (h), from a serial ordering model of groups.
A relationship between the abundance and water-quality ranks was not found (i.e., abundance response between watersheds is highly variable), initially suggesting that, in general, the observed abundance may be mostly related to land use/cover rather than to changes in water quality.
3.3. Linear Regression on Benthic Algae Assemblage
The linear regression shows a non-significant negative slope relation between ammonium (R = −0.56, p = 0.1), native forest area (R = −0.5, p = 0.1), harvested area (R = −0.29, p = 0.4), planting volume (R = −0.11, p = 0.7), planting density (R = −0.79, p = 0.01) and width of riparian zone (R = −0.57, p = 0.1) (Figure 5). However, this linear slope specifically corresponds to a reduction in the abundance of the genera Gyrosigma Hassall, Nitzschia Hassall, Cosmarium Corda ex Ralfs and Melosira Agardh, and a positive slope with pH (R = 0.59, p = 0.1), nitrate (R = 0.69, p = 0.04), nitrite (R = 0.63, p = 0.5), plantation area (R = 0.54, p = 0.1), fraction of road’s area (R = 0.32, p = 0.3) and planting age (R = 0.64, p = 0.06).
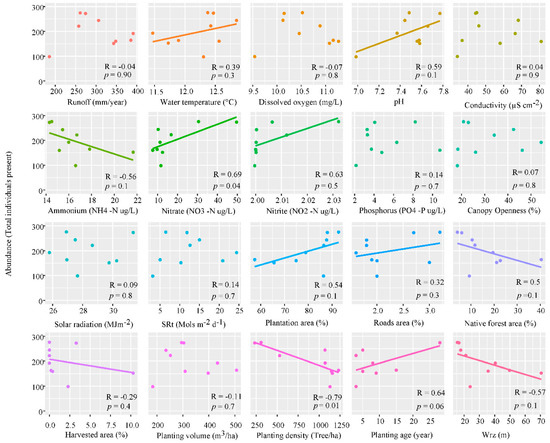
Figure 5.
Linear regression of abundance, at the 9 sampling stations, against the physicochemical parameters; runoff (mm/year), water temperature (°C), dissolved oxygen (mg/L), pH, conductivity (µS cm−2), ammonium (NH4-N µg/L), nitrate (NO3-N µg/L), nitrite (NO2-N µg/L), soluble phosphorus (PO4-P µg/L) solar radiation (MJm−2) and solar radiation transmitted (SRt) (Mols m−2 d−1), and land cover data; canopy openness (%), plantation area (%), fractions of roads area (%), native forest area (%), harvested area (%), planting volume (m3/ha), plantation density (tree/ha), age plantation (year) and width riparian zone (Wrz) (m), p-value ≤ 0.05.
The nine sampling (described in Table 3) stations show a significant negative slope in the abundance of Cymbella Ehrenberg with increasing pH (R = −0.74, p = 0.02), Diatoma Bory with plantation area (R = −0.73, p = 0.02), Diploneis Ehrenberg ex Cleve with planting density (R = −0.73, p = 0.03), Gyrosigma Hassall with water temperature (R = −0.66, p = 0.05), and Mastogloia Thwaites ex W. Smith with increasing planting density (R = −0.78, p = 0.01). A significant positive slope was observed in the abundance of Cyclotella Brébisson with phosphorus concentration (R = 0.86, p = 0.006); Diatoma Bory with increasing native forest area (R = 0.86, p = 0.003); Diploneis Ehrenberg ex Cleve with age of planting (R = 0.86, p = 0.003), planting volume (R = 0.85, p = 0.004), nitrate (R = 0.75, p = 0.02) and solar radiation (R = 0.67, p = 0.05); Hannaea Ehrenberg with ammonium concentration (R = 0.86, p = 0.003), fractions of harvested area (R = 0.94, p = 0.002) and width of the riparian zone (R = 0.78, p = 0.01); Mastogloia Thwaites ex W. Smith with age of planting (R = 0.82, p = 0.01), planting volume (R = 0.79, p = 0.01), nitrate (R = 0.75, p = 0.02) and solar radiation (R = 0.76, p = 0.02); Pinnularia Ehrenberg with water temperature (R = 0.68, p = 0.05); Rhoicospheria Grunow with nitrate concentration (R = 0.73, p = 0.02); and Stauroneis Ehrenberg with nitrate (R = 0.86, p = 0.003) and the fraction of roads (R = 0.83, p = 0.01).
Table 3.
Linear regression of genera described in Table 2, at the 9 sampling stations against the physicochemical parameters and forest cover data, linear correlation coefficient (R) and p-value ≤ 0.05.
4. Discussion
It proves challenging to determine whether land cover, water conditions or sunlight exert the greatest influence on the abundance of benthic algae genera. All these factors might exert a strong influence on the assemblage structure of its abundance in complex ecosystems and their ability to adapt to large-scale environmental changes. Intensive forest plantations have been found to be responsible for a series of negative effects on stream systems [23,24,25,28], each of which may affect abundance in different ways [5,6,19,20]. The use of herbicides to prepare the soil prior to planting and the application of pesticides to combat the pathologies that affect the plantations [55,56] also may affect abundance.
This research found that that higher percentages of forest plantation (>50%) lead to a higher diversity, characterized by facilitating the growth of benthic algae genera, which may serve as a reliable indicator of forest ecosystem quality.
To understand how biotic organisms respond to these components, we must understand the nature of the streams. A multitude of factors operate at various spatial and temporal scales [57]. Incorporating a hierarchical framework, including temporal structure and spatial heterogeneity may strongly influence the assemblage structure across an understanding of complex ecosystems and the ability to deal with large-scale environmental changes.
Our study is the first in the Chilean Coastal Range to compare the effect of forest management on the structural and functional attributes of small streams. Final harvest removed the forest cover, and associated soil erosion and changes in hidromorphology led to a major reorganization of algae communities (Pseudanbaena, cyanobacteria) [5,6,19,20].
The influence of total light transmitted through the canopy is associated with the cover type, which can influence the light levels received by the benthic algae in the stream. Dense forest covers reduce the amount of incoming energy and nutrients, shifting the abundance of algal groups [18]. We observed that when canopy openness was higher than 25%, the abundance of benthic algae was greater (positively correlation with Diploneis Ehrenberg ex Cleve, Mastogloia Thwaites ex W. Smith and Gyrosigma Hassall), but when canopy openness was less than 25%, benthic algae was less abundant, which is associated with less light. The influence of watershed-scale disturbances such as timber harvest was correlated with community changes, which were explained by the total light transmitted through the canopy and associated with the cover type as compared to unharvested watersheds [15].
Nutrient availability (soluble phosphorus, ammonium, and nitrate) is most strongly correlated with the abundance of the Hannaea Ehrenberg, Diploneis Ehrenberg ex Cleve, Cyclotella Brébisson, Rhoicosphenia Grunow, and Stauroneis Ehrenberg [58,59]. In general, study sites are low-nutrient systems, and we found that many genera detected in this system are often associated with nutrient-poor waters, i.e., Cocconeis Ehrenberg, Achnantes Agardh and Diatoma Bory [16,60].
These results may be used in future studies to predict the available energy for primary consumers and trade-offs between gross primary productivity and community assemblage [16]. By viewing our stream community as a system organized and developed around forest management [21,61,62], stream communities can be viewed as systems that are organized within this habitat. While the uniqueness of the sites is a general feature of these watersheds, and since forestry practices are tailored for each specific site, more studies are needed to describe biological communities and to facilitate the design of forest/water management strategies (i.e., increasing riparian buffer width, implementing sediment retention measures) aimed at the conservation of aquatic biota, while at the same time maintaining the productivity of planted forests.
5. Conclusions
Overall, the results suggest that observed abundance is determined by forest use/cover rather than to changes in water-quality parameters. This study is relevant to support the already ongoing discussions related to forest management intended to minimize the impact of forest cover on abundance of genera. The study focused on small watersheds, as they are likely to be especially affected by land use. The use of abundance of genera demonstrated the potential of a quantitative analysis. At sites where watersheds are planted at a rate of 50% or more, it is especially important that strategies are enacted to reduce potential damage to small watersheds, including the application of discontinuous forestry and maintenance or an increase in the width of the riparian zone.
Such activities will likely help to reduce toxicity algae in watersheds, which is of benefit to maintain water quality both for aquatic communities and downstream water management. Future work should concentrate on understanding how intensive forest plantation practices might interact with the flow pathways that contribute to ammonium, nitrite, nitrate, and phosphorus concentrations.
Supplementary Materials
Following supporting information can be downloaded at: https://www.mdpi.com/article/10.3390/f13030378/s1, Table S1: Gap light analyzer (GLA) program setup).
Author Contributions
G.B. contributed to the project idea development, methodology, results and prepared the manuscript (writing the original draft, reviewing and editing, collecting and preparing the figures); A.I. supervised the research, revised-editing the manuscript and project administration; H.U. revised-editing the manuscript; S.B. and O.P. supervised the methodology of benthic algae and revised-editing the manuscript. All authors have read and agreed to the published version of the manuscript.
Funding
This research received no external funding.
Acknowledgments
The authors thank the Graduate School of the Faculty of Forest Sciences and Natural Resources of the Universidad Austral de Chile for their support and infrastructure. The authors acknowledge the interest and support of Forestal Mininco S.A. in the development of this research. The authors acknowledge the support PhD scholarship from Comisión Nacional de Investigación Científica y Tecnológica (CONICYT).
Conflicts of Interest
The authors declare no conflict of interest and ethical statements.
References
- Burcher, C.; Valett, H.; Benfield, E. The land-cover cascade: Relationships coupling land and water. Ecology 2007, 88, 228–242. [Google Scholar] [CrossRef]
- Hynes, H.B.N. The stream and its valley. Verh. Int. Ver. Limnol. 1975, 19, 1–15. [Google Scholar] [CrossRef]
- Likens, G.E.; Bormann, F.H.; Pierce, R.S.; Reiners, W.A. Recovery of a deforested ecosystem. Science 1978, 199, 492–496. [Google Scholar] [CrossRef] [PubMed]
- Stevenson, R.J. Scale-dependent determinants and consequences of benthic algal heterogeneity. J. N. Am. Benthol. Soc. 1997, 16, 248–262. [Google Scholar] [CrossRef]
- Julian, J.P.; Doyle, M.W.; Stanley, E.H. Empirical modelling of light availability in rivers. J. Geophys. Res. 2008, 113, G03022. [Google Scholar] [CrossRef]
- Julian, J.P.; Stanley, E.H.; Doyle, M.W. Basin-scale consequences of agricultural land use on benthic light availability and primary production along a sixth-order temperate river. Ecosystems 2008, 11, 1091–1105. [Google Scholar] [CrossRef]
- Patrick, R.; Reimer, C. The diatoms of the United States. Vol. 1. Monogr. Acad. Nat. Sci. Phila. 1966, 1, 1–688. [Google Scholar]
- Round, F.E. The Ecology of Algae; Cambridge University Press: New York, NY, USA, 1981. [Google Scholar]
- Stevenson, R.J.; Bothwell, M.L.; Lowe, R.L. Algal Ecology: Freshwater Benthic Ecosystems; Academic Press, Inc.: San Diego, CA, USA, 1996. [Google Scholar]
- Potapova, M.G.; Charles, D.F. Distribution of benthic diatoms in us rivers in relation to conductivity and ionic composition. Freshw. Biol. 2003, 48, 1311–1328. [Google Scholar] [CrossRef]
- Barrientos, G.; Herrero, A.; Iroumé, A.; Mardones, O.; Batalla, R.J. Modelling the Effects of Changes in Forest Cover and Climate on Hydrology of Headwater Catchments in South-Central Chile. Water 2020, 12, 1828. [Google Scholar] [CrossRef]
- Snelder, T.H.; Biggs, B.J.F. Multiscale river environment classification for water resources management. J. Am. Water Resour. Assoc. 2002, 38, 1225–1239. [Google Scholar] [CrossRef]
- Allan, J.D. Landscapes and rivers capes: The influence of land use on stream ecosystems. Annu. Rev. Ecol. Evol. Syst. 2004, 35, 257–284. [Google Scholar] [CrossRef]
- Winemiller, K.O.; Flecker, A.S.; Hoeinghaus, D.J. Patch dynamics and environmental heterogeneity in lotic ecosystems. J. N. Am. Benthol. Soc. 2010, 29, 84–99. [Google Scholar] [CrossRef]
- Naymik, J.; Pan, Y.; Ford, J. Diatom assemblages as indicators of timber harvest effects in coastal oregon streams. J. N. Am. Benthol. Soc. 2005, 24, 569–584. [Google Scholar] [CrossRef]
- Atkinson, C.L.; Cooper, J.T. Benthic algal community composition across a watershed: Coupling processes between land and wáter. Aquat. Ecol. 2016, 50, 315–326. [Google Scholar] [CrossRef]
- Smucker, N.J.; Vis, M.L. Diatom biomonitoring of streams: Reliability of reference sites and the re-sponse of metrics to environmental variations across temporal scales. Ecol. Indic. 2011, 11, 1647–1657. [Google Scholar] [CrossRef]
- Hansmann, E.W.; Phinney, H.K. Effects of logging on periphyton in coastal streams of Oregon. Ecology 1973, 54, 194–199. [Google Scholar] [CrossRef]
- Hill, B.H.; Herlihy, A.T.; Kaufmannc, P.R.; DeCelles, S.J.; Vander Borgh, M.A. Assessment of streams of the eastern united states using a periphyton index of biotic integrity. Ecol. Indic. 2003, 2, 325–338. [Google Scholar] [CrossRef]
- Wang, Y.K.; Stevenson, R.J.; Metzmeier, L. Development and evaluation of a diatom-based Index of Biotic Integrity for the Interior Plateau Ecoregion, USA. J. N. Am. Benthol. Soc. 2005, 24, 990–1008. [Google Scholar] [CrossRef]
- Sharma, R.; Nehren, U.; Ajijur Rahman, S.; Meyer, M.; Rimal, B.; Aria Seta, G.; Baral, H. Modeling Land Use and Land Cover Changes and Their Effects on Biodiversity in Central Kalimantan, Indonesia. Land 2018, 7, 57. [Google Scholar] [CrossRef]
- Huber, A.; Iroume, A.; Mohr, C.; Frene, C. Effect of Pinus radiata and Eucalyptus globulus plantations on water resource in the Coastal Range of Biobio region, Chile. Bosque 2010, 31, 219–230. [Google Scholar] [CrossRef]
- Mohr, C.H.; Coppus, R.; Iroumé, A.; Huber, A.; Bronstert, A. Runoff generation and soil erosion processes after clear cutting. J. Geophys. Res. 2013, 118, 814–831. [Google Scholar] [CrossRef]
- Iroumé, A.; Soto-Schönherr, S. Efectos Hidrológicos de la Tala Rasa. Capítulo 2 En Tamaño de la Tala Rasa en Plantaciones Forestales: Efectos y Regulación, 1st ed.; Niklitschek, M., Ed.; Editorial Universitaria: Santiago, Chile, 2015; pp. 63–83. [Google Scholar]
- Soto-Schönherr, S.; Iroumé, A. How much water do Chilean forests use? A review of interception losses in forest plot studies. Hydrol. Process. 2016, 30, 4674–4686. [Google Scholar] [CrossRef]
- Iroumé, A.; Palacios, H.; Bathurst, J.; Huber, A. Runoff and peakflows after clearcutting and the establishment of a new plantation in an experimental catchment, southern Chile. Bosque 2010, 31, 117–128. [Google Scholar]
- Mohr, C.; Montgomery, D.; Huber, A.; Bronstert, A.; Iroumé, A. Streamflow response in small up-land catchments in the Chilean coastal range to the MW 8.8 Maule earthquake on 27 February 2010. J. Geophys. Res. 2012, 117, F02032. [Google Scholar] [CrossRef]
- Iroumé, A.; Ruiz-Villanueva, V.; Picco, L. Breakdown of instream wood in low order forested streams of the Southern Chilean mountain ranges. For. Ecol. Manag. 2017, 401, 17–32. [Google Scholar] [CrossRef]
- Lionello, P.; Malanotte-Rizzoli, P.; Boscolo, R.; Alpert, P.; Artale, V.; Li, L.; Luterbacher, J.; May, W.; Trigo, R.; Tsimplis, M.; et al. The Mediterranean climate: An overview of the main characteristics and issues. Dev. Earth Environ. Sci. 2006, 4, 1–26. [Google Scholar] [CrossRef]
- Ulloa, H.; Iroumé, A.; Lenzi, M.A.; Andreoli, A.; Álvarez, C.; Barrera, V. Large wood in two catchments from the Coastal Mountain range with different land use history. Bosque 2011, 32, 235–245. [Google Scholar] [CrossRef]
- Barrientos, G.; Iroumé, A. The effects of topography and forest management on water storage in catchments in south-central Chile. Hydrol. Processes 2018, 32, 3225–3240. [Google Scholar] [CrossRef]
- Montgomery, D.R.; Schmidt, K.M.; Greenberg, H.M.; Dietrich, W.E. Forest clearing and regional landsliding. Geology 2000, 28, 311–314. [Google Scholar] [CrossRef]
- Taylor, S.L.; Roberts, S.C.; Walsh, C.J.; Hatt, B.E. Catchment urbanisation and increased benthic algal biomass instreams: Linking mechanisms to management. Freshw. Biol. 2004, 49, 835–851. [Google Scholar] [CrossRef]
- Frazer, G.W.; Canham, C.D.; Lertzman, K.P. Gap Light Analyzer (GLA), Version 2.0: Imaging Software to Extract Canopy Structure and Gap Light Transmission Indices from True-Colour Fisheye Photographs, User’s Manual and Program Documentation; Simon Fraser University, Burnaby, British Columbia and the Institute of Ecosystem Studies: Millbrook, NY, USA, 1999. [Google Scholar]
- Parra, O.; Bicudo, C.M. Algas de Aguas Continentales: Introducción a la Biología y Sistemática; Ediciones Universidad de Concepción: Santiago, Chile, 1996; 268p. [Google Scholar]
- Parra, O. Desmidiáceas de Chile, I. Desmidiáceas de la Región de Concepción y alrededores. Gayana Bot. 1975, 30, 3–90. [Google Scholar]
- Parra, O.; González, M. Guía bibliográfica y distribución de las cianófitas de Chile (excluyendo el Continente Antártico). Gayana Bot. 1976, 32, 1–55. [Google Scholar]
- Parra, O.O. Desmidiáceas de Chile II. Nuevas Desmidiáceas para la Región de Concepción. Bol.-Soc. Biol. Concepc. 1977, 51, 193–201. [Google Scholar]
- Geitler, L. Cyanophyceae in Rabenhorst’s Kryptogamen flora. Leipzig 1932, 14, 1196. [Google Scholar]
- Bourrelly, P. Les Algues D’eau Douce. I. Algues Vertes, 2nd ed.; N. Boubée et Cie: Paris, France, 1972. [Google Scholar]
- Starmach, K. Chlorophyta III. Flora Slodkowodna Polski, 10; Akademia Nauk: Warszawa, Poland, 1972. [Google Scholar]
- Parra, O.; Gonzalez, M. Catálogo de las algas dulceacuícolas de Chile. Pyrrophyta, Chrysop-hyta-Chrysophyceae, Chrysophyta-Xanthophyceae, Rhodophyta, Euglenpophyta y Chlrophyta. Gayana Bot. 1977, 33, 1–102. [Google Scholar]
- Parra, O.O.; Gonzalez, H.; Gonzalez, M. A comparison of epiphytic diatom assemblages attached to filamentous algae in lotic freshwater habitats of Chile. Gayana Bot. 1984, 41, 85–117. [Google Scholar]
- Komarek, I.; Fott, B. Chlorococcales. In Das Phytoplankton des su/3wassers-Systematik und Biologie. Teil 7. Chlorococcales. E.; Huber-Pestalozzi, G., Ed.; Schweizerbart’sche Verlagsbuchhandlung: Stuttgart, Germany, 1983. [Google Scholar]
- Kociolek, J.; Stoermer, E. Taxonomy, Ultrastructure and Distribution of Gomphoneis herculeana, G. eriense and Closely Related Species (Naviculales: Gomphonemataceae). Proc. Acad. Nat. Sci. Phila. 1988, 140, 24–97. [Google Scholar]
- Round, E.; Crawford, R.M.; Mann, D.G. The Diatoms, Biology and Morphology of the Genera; Cambridge University Press: Cambridge, UK, 1990; 747p. [Google Scholar]
- Rivera, P. Diatomeas de agua dulce de Concepción y alrededores. Gayana Bot. 1974, 28, 3–134. [Google Scholar]
- Rivera, P.; Parra, O.; González, M.; Dellarossa, V.; Orellana, M. Manual Taxonómico del Fitoplancton de Aguas Continentales. IV. Bacillariophyceae; Editorial Universidad de Concepción: Concepción, Chile, 1982; 97p. [Google Scholar]
- Rivera, P. A Guide for References and Distribution for the Class Bacillariophyceae in Chile between 18°28′ S and 58° S. Bibl. Diatomol. 1983, 3, 386. [Google Scholar]
- Rivera, P. Estado del conocimiento de las diatomeas dulce acuícolas de Chile. Gayana 2006, 70, 1–7. [Google Scholar]
- Rivera, P.; Basualto, S.; Cruces, F. Acerca de la diatomea Didymosphenia geminata (Lyngbye) M. Sch-midt: Su morfología y distribución en Chile. Gayana Bot. 2013, 70, 154–158. [Google Scholar] [CrossRef]
- R Core Team. R: A Language and Environment for Statistical Computing; R Foundation for Statistical Computing: Vienna, Austria, 2013; Available online: http://www.R-project.org/ (accessed on 18 August 2016).
- Clarke, K.R. Nonparametric multivariate analyses of changes in community structure. Aust. J. Ecol. 1993, 18, 117–143. [Google Scholar] [CrossRef]
- Clarke, K.R.; Warwick, R.M. Similarity-based testing for community pattern: The 2-way layout with no replication. Mar. Biol. 1994, 118, 167–176. [Google Scholar] [CrossRef]
- QMI—Management Systems Registration. Estándar de Manejo Forestal Sustentable CERTFOR; Reporte de Auditoria 2° Seguimiento; Bosques ARAUCO: Santiago, Chile, 2005; 11p. [Google Scholar]
- Frene, C.; Nuñez, M. Hacia un nuevo Modelo Forestal en Chile. Revista Bosque Nativo. 2010, 47, 25–35. [Google Scholar]
- Mallory, M.A.; Richardson, J.S. Complex interactions of light, nutrients and consumer density in a stream periphyton-grazer (tailed frog tadpoles) system. J. Anim. Ecol. 2005, 74, 1020–1028. [Google Scholar] [CrossRef]
- Biggs, B.J.F.; Smith, R.A. Taxonomic richness of stream benthic algae: Effects of flood disturbance and nutrients. Limnol. Oceanogr. 2002, 47, 1175–1186. [Google Scholar] [CrossRef]
- Cardinale, B.J.; Hillebrand, H.; Charles, D.F. Geographic patterns of diversity in streams are pre-dicted by a multivariate model of disturbance and productivity. J. Ecol. 2006, 94, 609–618. [Google Scholar] [CrossRef]
- Segura-García, V.; Cantoral-Uriza, E.A.; Israde, I.; Maidana, N. Diatomeas epilíticas como indicadores de la calidad del agua en la cuenca alta del río Lerma, México. Hidrobiológica 2012, 22, 16–27. [Google Scholar]
- Frissell, C.A.; Liss, W.J.; Warren, C.E.; Hurley, M.D. A hierarchical framework for stream habitat classification viewing streams in a watershed context. Environ. Manag. 1986, 10, 199–214. [Google Scholar] [CrossRef]
- Poff, N.L. Landscape filters and species traits: Towards mechanistic understanding and prediction in stream ecology. J. N. Am. Benthol. Soc. 1997, 16, 391–409. [Google Scholar] [CrossRef]


Publisher’s Note: MDPI stays neutral with regard to jurisdictional claims in published maps and institutional affiliations. |
© 2022 by the authors. Licensee MDPI, Basel, Switzerland. This article is an open access article distributed under the terms and conditions of the Creative Commons Attribution (CC BY) license (https://creativecommons.org/licenses/by/4.0/).