Abstract
Forest managers need site productivity estimates for tree species growing in mixed stands. Models developed in the past are generally for pure stands and don’t factor in the effects of climate change on site productivity. Therefore, site index (SI) models were developed for black spruce (Picea mariana Mill. B.S.P.) and trembling aspen (Populus tremuloides Michx.) trees grown in natural origin mixed stands. For this, 186 trees (93 black spruce and trembling aspen each) were sampled from 31 even-aged natural mixed stands (sites) (3 trees/species/site) across Ontario, Canada. Stand height growth models were developed by incorporating climate variables during growth for each species. Stem analysis data collected from sampled trees were used to develop these models. A mixed effects modelling approach was used to fit the models. The relationship between SIs of black spruce and trembling aspen grown in mixed stands was analyzed by calculating correlation coefficients and plotting black spruce SIs against those of trembling aspen. Climate effects on site productivity were evaluated by predicting stand heights for 4 geographic areas of Ontario for the period 2021 to 2080. Three emissions scenarios reflecting different amounts of heat at the end of the century (i.e., 2.6, 4.5, and 8.5 watts m−2) were used in the stand height growth models developed here for evaluation. Climate effects were more pronounced for trembling aspen than black spruce only in the far west. The relationship between SIs of black spruce and trembling aspen trees grown in natural origin mixed stands could not be described using a linear/nonlinear mathematical function. The models developed here can be used to estimate stand height and SI of black spruce and trembling aspen trees grown in natural origin mixed stands in a changing climate. In the absence of climate data, models fitted without climate variables can be used to estimate SI of both species.
1. Introduction
Site index (SI) is a widely used measure of forest site productivity. It is defined as stand height (average height of dominant and codominant trees) at a specified stand age [1]. Stand height is also known as top height, defined as the average height of a specified number (e.g., 20 or 100) of the tallest and thickest trees per ha in a stand. Estimated values of growth, mortality, and tree recruitment in a stand could be influenced by site productivity [2]. Most stand level growth and yield models that are used in developing forest management plans are driven by SI. Therefore, accurate estimates of SI are vital to making informed forest management decisions.
Site index depends on site characteristics, species, growing environment, and climate [3]. Therefore, most SI models are species specific and apply to even-aged monoculture stands. In multi-species stands, growth may be affected by altered access to site resources, interspecific competition, or other factors [4]. Interactions between tree species can be dynamic, changing spatially and temporally with variability in climatic, soil and stand conditions [5]. Similarly, mixing in tree species can increase stand productivity, density, and growth efficiency [6]. Thurm and Pretzsch [7] reported that the productivity increased significantly in European beech (Fagus sylvatica) and Douglas-fir (Pseudotsuga menziesii) mixed stands than in pure stands. Thus, SI models developed for pure stands may not be valid for mixed stands. Furthermore, if trees of one or more species growing in mixed stands are not appropriate (too small) for SI models, developing them for each tree species may not be possible [8]. In such cases, SI of one species has been estimated in terms of the SI of another species [4].
Forest managers could have a SI equation for the leading tree species but not for the second leading species. If the SI of one species can be expressed in terms of SI of another that it is growing with, SI conversion equations can be developed to estimate the SI of the second species. In this case, trees from the second species do not need to be sampled to develop SI equations, saving time and resources. However, the SIs of all tree species growing together are not necessarily correlated. In this situation, conversion equations cannot be developed and SI equations are needed for all species in a given stand to calculate wood supply [9].
Recent studies showed that climate had significant effects on site productivity of jack pine (Pinus banksiana Lamb.), black spruce (Picea mariana Mill. B.S.P.) [10], white spruce (Picea glauca (Moench) Voss) [11], red pine (Pinus resinosa Ait.) [12], and white pine (Pinus strobus L.) [3] plantations and jack pine and black spruce natural origin mixed stands [13]. Therefore, climate sensitive SI models are required for each tree species to accurately estimate wood supply. These models are also useful for developing climate change adaptation/mitigation plans.
The objectives of this study were to (1) analyze climate effects on site productivity of black spruce and trembling aspen (Populus tremuloides Michx.) trees grown in natural origin mixed stands in Ontario, Canada, (2) develop stand height/SI models for these tree species by incorporating climate variables, (3) assess the effects of future climate scenarios on stand height growth of these tree species, (4) compare species-specific height growth between pure and mixed stands, and (5) investigate the relationship between SIs of black spruce and trembling aspen trees grown in natural origin mixed stands. If the relationship is linear or nonlinear, SI conversion equations will be developed.
2. Methods
2.1. Height and Age Data
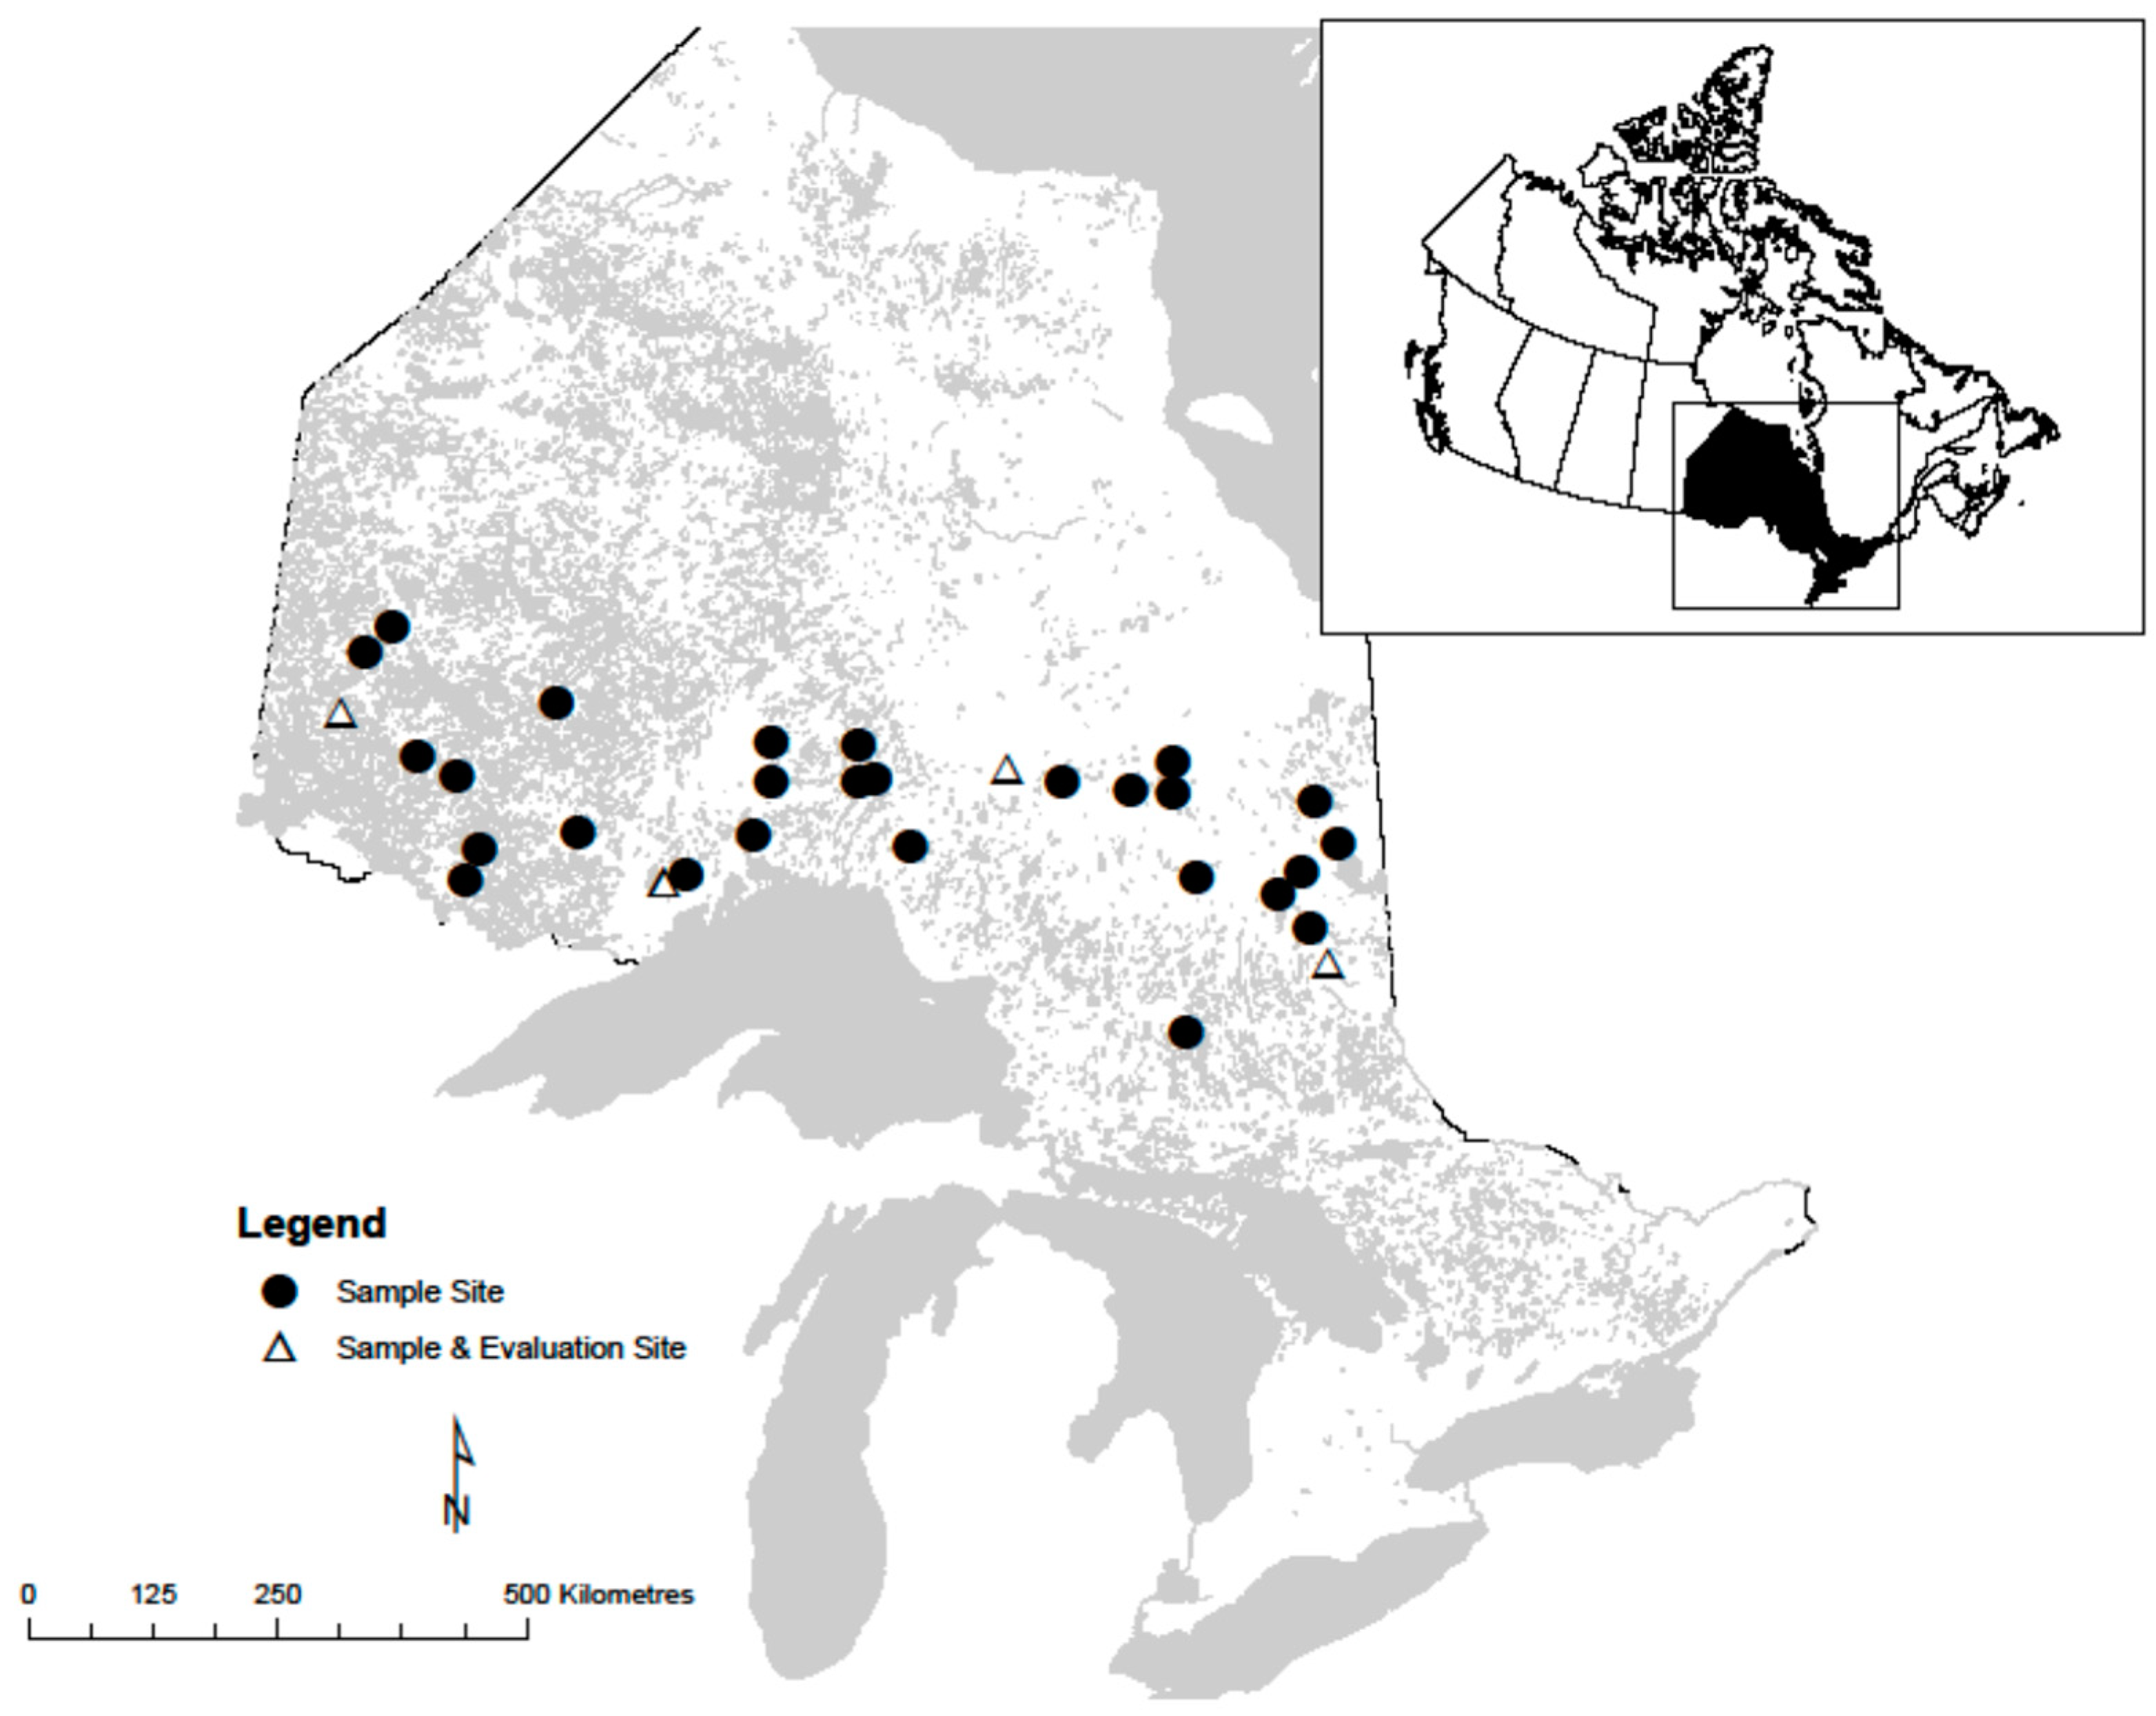
Stem analysis was conducted to obtain height-age data used in this study. Thirty-one even-aged natural origin mixed species stands were sampled for stem analysis from across the study species’ range in Ontario (Figure 1). These stands were dominated by black spruce (43%) and trembling aspen (23%) with a substantial balsam fir (Abies balsamea (L.) Mill.) component (24%) but minimal other species (10%; mix of jack pine, white spruce, and birch (Betula spp.)).
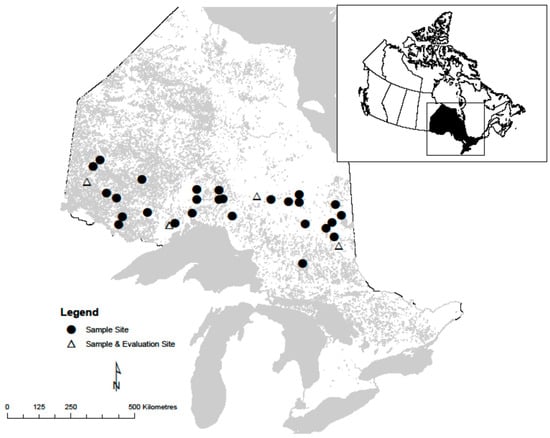
Figure 1.
Distribution of natural origin black spruce and trembling aspen sites sampled across northern Ontario, Canada.
In this study, stand height was defined as the average height of dominant and codominant trees. Three 100 m2 circular temporary sample plots (TSPs) were established at each stand and one largest diameter (at breast height) non-veteran tree of each study species was selected and sampled from each plot. Only trees without visible deformities, such as forks, major stem injuries, and dead or broken tops were included in the sample. Disks were cut at 0.15, 0.5, 0.9, and 1.3 m from ground level from each sampled tree. More disks were cut at 10% intervals from the remaining height of the tree (between breast height and tip), resulting in 13 disks per tree from each species.
A unique code was assigned to each sampled tree and disk. All disks sampled from a tree were placed into a large breathable bag. These bags were transported to a lab in Thunder Bay, Ontario, and stored at −10 °C until 24 h before the disks were prepared (sanded) for ring analysis. After preparation, the major and minor axes (diameters) that were perpendicular to one another and passed through the pith were measured. From the major (r1) and minor (r2) axes geometric mean radius (r) was calculated (i.e., r = (r1 × r2)0.5) on each disk. Two radii that matched this geometric mean and were at least 90° apart were located and marked. All these measurements were made inside bark. The disks were then scanned and saved at a minimum resolution of 720 dpi. Scanned images were analyzed for ring number and diameter growth using WINDENDROTM software (2014c, Regent Instruments, Montreal, QC, Canada, 2014).
Subedi and Sharma [14] used jack pine and black spruce plantation stem analysis data to analyze 6 techniques developed to identify the end of annual height growth and found Graves’ [15] method to be best for these tree species. Therefore, height at a given age along the bole of each tree was determined using this technique. For each tree, annual height growth was calculated to obtain the height growth series needed to develop height growth models. Height of each tree was plotted against its age to assess indications of early height growth suppression, top breakage, or dieback. No defects were evident in any of the sample trees so data from all 186 trees (93 black spruce and 93 trembling aspen) was analyzed.
All black spruce and trembling aspen trees were grown in natural stands. As a result, height growth before breast height was irregular. Number of years to reach breast height varied from 2 to 29 years for black spruce and 1 to 10 years for trembling aspen. Therefore, unless otherwise specified, age from breast height (breast height age, BHA; in years) and height from breast height were used for all analyses reported in this study.
Since height growth before trees reached breast height was irregular, BHA of trees sampled from 3 plots from a site did not necessarily reach a particular BHA during the same calendar year. However, climate variables are tied to a specific calendar year. Therefore, if we combined height growth to obtain site scale observation by calculating mean stand height from 3 plots, climate effects could not be analyzed as the height growth would have been averaged across years. As a result, growth series from 3 plots from a site were not combined. This resulted in 93 total height-age growth series for each species. Table 1 displays summary statistics of sampled trees used in this study for total height, diameter at breast height (DBH), total age, BHA, and the climate variable significant in stand height growth model. However, the SI values shown in the table were obtained by calculating mean heights of 3 trees sampled from a site at BHA 50 for each species. Since trembling aspen trees on one site were younger than 50 years, only 30 SI are listed for this tree species.

Table 1.
Summary statistics (N = number of samples; SD = standard deviation) for mean diurnal temperature range (MDTR), total height, DBH, total age, breast height age (BHA), and site index (SI) for black spruce and trembling aspen trees from northern Ontario, Canada, used in this study.
2.2. Climate Data
Sample plots used here were far from weather stations. Therefore, Canadian climate models [16] were applied to obtain estimates of climate variables for each plot location. ANUSPLINE based on corrected Canadian weather station data [17,18] was applied in these models to generate continuous climate grids that included many stations in Ontario. Mean seasonal and annual values of climate variables were estimated for each location for each year starting when the sample tree reached breast height to 2020.
Climate variables used in this study included estimates of annual, quarterly (consecutive 3-month periods), and monthly values of mean, minimum, and maximum total precipitation, and air temperatures for each year. Estimates for start, end, and length of the growing season and the sum of growing degree days were also included. These variables were estimated using a base temperature of 5 °C. The growing season was defined as the time between the day after 1 March when mean daily temperature was ≥5 °C for 5 consecutive days and the day after 1 August when minimum daily temperature was ≤2 °C. Site related variables (longitude, latitude, and elevation) were also evaluated with climate variables. This resulted in a total of 68 site and climate variables. Estimates for all climate variables were provided by Dan McKenney (2021, Canadian Forest Service, pers. comm.).
2.3. Stand Height/Site Index Models
The height-age relationship of a tree is nonlinear. Therefore, nonlinear mathematical models are commonly used to express the relationship. These models are typically derived from fractional or exponential functions [19]. The most common function that is derived from the fractional group to describe height development over time is Hossfeld IV [19]. Similarly, the Chapman-Richards growth function that is obtained from the exponential group is the most commonly used function to describe the height-age relationship (see [20,21,22,23]). Several variants of these functions are derived based on assumptions made and initial conditions applied.
Sharma [13] evaluated three variants of Chapman-Richards function formulated using generalized algebraic difference approach by assuming its parameters as a function of site (see [24]) using the data from jack pine and black spruce natural mixed stands. In his evaluation, Sharma included a variant of Hossfeld’s base function that has been widely used to model height-age relationship. He found the variant of the Hossfeld’s function, also known as McDill-Amateis growth function (see [25], p. 126), superior to others in terms of fit statistics and predictive accuracy. Therefore, this function was used to model the height-age relationship of black spruce and trembling aspen in this study. The mathematical form of McDill-Amateis growth function is:
where, H and H0 are heights at ages A and A0, respectively, α0 and α1 are model parameters and ε is the error term. This model has also been used in other studies that evaluated climate effects on site productivity and developed stand height growth models by incorporating climate variables for boreal tree species in eastern Canada [3,8,9,10]. In general, α0 defines the asymptote of the curve and α1 determines the shape (also called the rate parameter).
Parameters of Equation (1) were expressed in terms of climate variables to examine and model the climate effects on height growth. A variance function was specified to address the heteroscedasticity in the data set [26]. Two variance functions (exponential and power) were considered and the one resulting in the smallest Akaike information criterion (AIC) [27] value was selected.
Finally, Pearson correlation coefficients between SIs of black spruce and trembling aspen were calculated and the SI of black spruce was plotted against the SI of trembling aspen to graphically explore the relationship between SIs of these tree species. Observed values of SI (stand height at BHA 50) were used for this analysis.
2.4. Model Fitting and Evaluation
Height-age data obtained from each tree by stem analysis are hierarchical, as observations are nested in trees and trees are nested in plots. Therefore, measurements in a plot are dependent and correlated. However, measurements among plots are independent. The autocorrelation in the data set can be addressed by using a mixed-effects modelling approach [28]. If required, models can be fit by adding a correlation structure [29]. Equation (1) was first fit without climate variables and random effects in SAS [30] for both species. Random effects associated with the asymptote and rate parameter were then included in fitting the models.
Elevation, latitude, and longitude were designated into one group (site) and the climate variables were divided into 2 groups (temperature and precipitation). The site and climate variables were introduced to the model sequentially from each group. First, all temperature-related variables were introduced one by one. The variable that was significant (α = 0.05) and resulted in the smallest AIC value was selected as the first temperature related climate variable to be introduced in the model. Unless otherwise specified, the p-value less than 0.05 (α = 0.05) has been considered significant in this study.
All precipitation-related variables were then added into the model one at a time in the presence of the first temperature related climate variable. The variable that was significant in the regression and produced the lowest AIC value was selected as the second climate variable to be added from the precipitation group. Similarly, site related variables were introduced into the model one at a time in the presence of temperature and/or precipitation variables. Two-way interactions and quadratic transformations of the site and climate variables were also introduced into the model. The site and climate variables and their interactions and transformations that were both significant in the regression and improved the fit statics were included in the stand height growth model.
A mixed-effects model was formulated by successively adding random effects parameters to fixed-effects parameters. The mixed-effects model was evaluated based on goodness-of-fit criteria such as AIC, model residuals, and log-likelihood (twice the negative log-likelihood) ratio. The model with the smallest goodness-of-fit value was considered best. Possible heteroscedasticity was checked by estimating residuals (observed − predicted) from the model for each growth series calculated for all 1-year growth periods and plotting them against predicted stand heights for both species.
To evaluate climate effects on future stand height growth, stand heights were estimated for both species using the model with climate variables for 4 regions: in the east (near Timmins), in the centre (near Hearst), in the west (near Thunder Bay), and in the far west (near Kenora) of northern Ontario (see Figure 1). These heights were estimated under 3 emissions scenarios known as representative concentration pathways (RCPs). Under these pathways, different levels of warming (2.6, 4.5, and 8.5 Watts/m2) are produced at the end of the century using the Canadian model [16]. The projected values of climate variables that were significant in the regression were used to evaluate climate effects. For visual analysis, height growth curves were generated for the 2021 to 2080 growth period.
3. Results and Discussion
Equation (1) was first fit to the height-age data using NLMIXED in SAS without random effects parameters for both black spruce and trembling aspen trees. Random effects associated with the asymptote and rate parameters were then included in the fit (Table 2). The fit statistics (AIC and MSE) improved significantly by including the random effects. Both random effects associated with the asymptote and rate parameter were significant at the stand scale. The height growth model with random effects at the stand scale is written as:
where, Hij is the stand height at age Aij (jth observations at series i), Hik is the stand height at age Aik at the same series (kth observations at series i and j ≠ k), b0i and b1i are the stand-scale random effects associated with α0 and α1, respectively, and εij is the error term for the jth tree of ith stand. Both random effects, b0i and b1i, have a normal distribution with zero mean and variances σ02 and σ12, respectively (i.e., b0i ~ N(0, σ02) and b1i ~ N(0, σ12) ), and are independent of εij ~ N(0, σ2). Other variables were as previously defined.
Table 2.
Parameter estimates, standard errors (SE), fit statistics (MSE (σe2), variance of b0 (σ02), variance of b1 (σ12), covariance of b0 and b1 (σ0 σ1), and Akaike’s information criterion (AIC) for Equation (2) for black spruce and trembling aspen trees from Ontario, Canada.
Equation (2) does not factor in climate effects. To investigate the effects of climate on stand height growth, parameters (α0 and α1) in Equation (2) were expressed in terms of climate variables. As mentioned earlier, climate variables were divided into 2 groups (temperature and precipitation) and site-specific variables (latitude, longitude, and elevation) were put into a third group. Both parameters (α0 and α1) in Equation (2) were expressed in terms of all 68 variables from each group successively.
When fitted independently, most temperature and precipitation related variables were significant in the regression. However, the asymptote (α0) for black spruce and the rate parameter (α1) for trembling aspen expressed as a linear function of mean diurnal temperature range (MDTR) turned out to produce the best fit (lowest values of MSE and AIC) in the presence of random effects. In the presence of MDTR, none of the other precipitation, temperature, or site related variables were significant for both species. Similarly, no quadratic transformations or climate variables interactions were significant for explaining the asymptote and rate parameter for both species. As a result, the final mixed effects models with climate variables are written as:
for black spruce, and
for trembling aspen, where, α2 is the parameter associated with MDTR and all other variables are as defined earlier. Estimated values of parameters for Equations (3) and (4) are presented in Table 3. All estimates were significant (p < 0.01) and incorporating MDTR significantly improved fit statistics for both species. Therefore, climate effects on height growth of black spruce and trembling aspen trees grown in natural mixed stands can be explained using Equations (3) and (4), respectively.
Table 3.
Parameter estimates, standard errors (SE), fit statistics (MSE (σe2), variance of b0 (σ02), variance of b1 (σ12), covariance of b0 and b1 (σ0 σ1), power variance (δ), and Akaike’s information criterion (AIC) for black spruce (Equation (3)) and trembling aspen (Equation (4)) trees from Ontario, Canada.
The coefficient of MDTR (α2) was negative for both species. However, MDTR decreases with the change in climate. Therefore, decreasing MDTR will positively affect the asymptote of height growth of black spruce and the rate of height growth for trembling aspen. Residual plots (not shown here) of heights showed some signs of heteroscedasticity for trembling aspen. Two variance functions (power and exponential) were evaluated to address heteroscedasticity in the data. The power function to the height was significant in the regression and resulted in smaller AIC for trembling aspen. However, the power to the height was not significant for black spruce, confirming results from residual plots. The estimated value of the weight (power of height) for trembling aspen was negative. The AIC value decreased significantly by introducing weight into the model for this tree species.
Climate effects on future stand height growth were evaluated by estimating heights using Equations (3) and (4) for 4 sites in Ontario for the 2021 to 2080 growth period. These heights were estimated under the 3 emissions scenarios (RCPs) described earlier. Average heights of sampled trees from all 31 sites at BHA 3 and annual values of MDTR projected under 3 emissions scenarios were used as initial values and climate variable, respectively, in developing these height profiles for each species. Estimated heights were plotted against BHA for both species (Figure 2 and Figure 3).
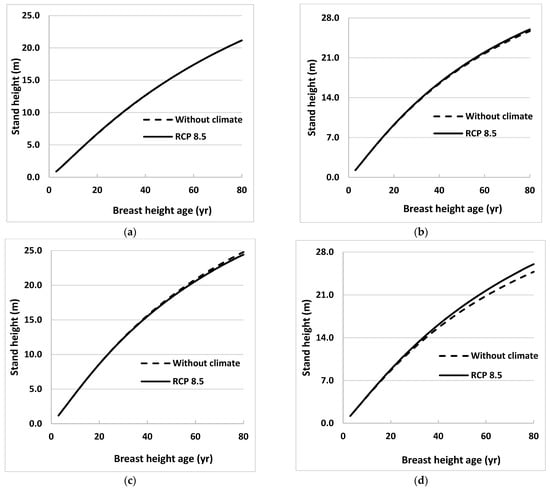
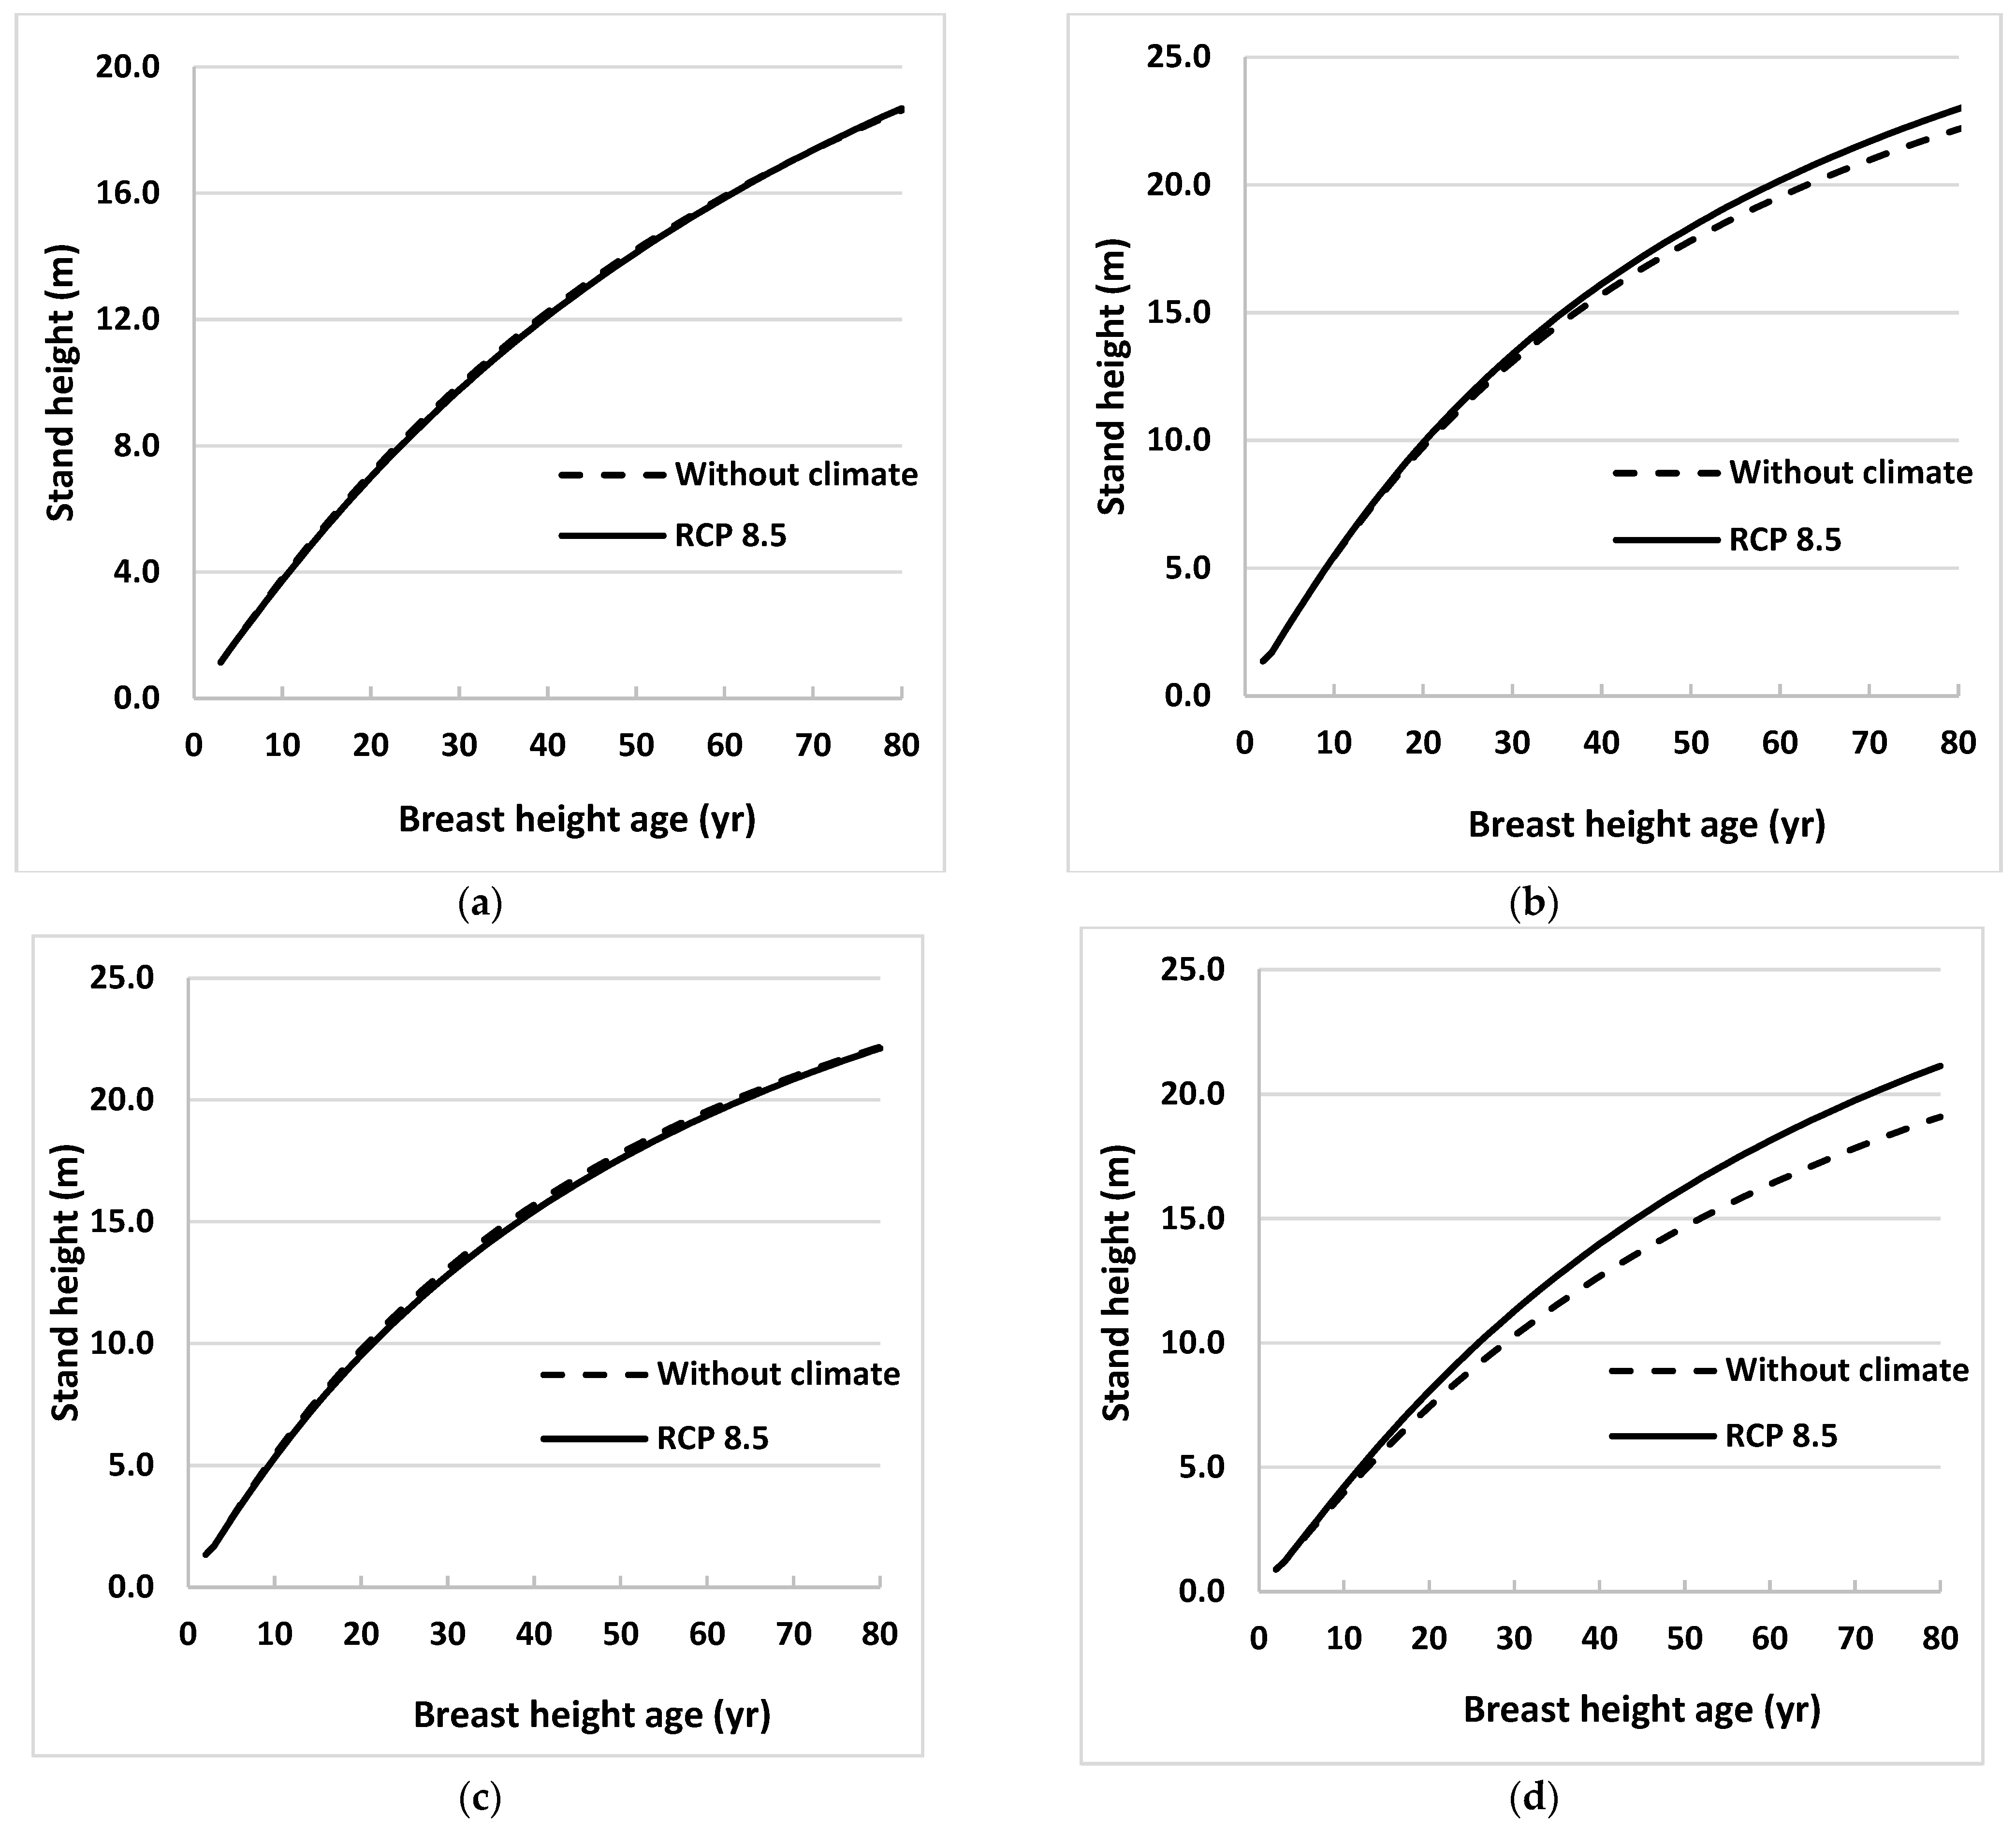
Figure 2.
Stand height profiles for natural origin black spruce trees generated using projected values of climate variables for the period 2021 to 2080, assuming that climate remains stable (without climate) or warms (RCP 8.5), in Equation (3) for (a) eastern (near Timmins), (b) central (near Hearst), (c) western (near Thunder Bay), and (d) far western (near Kenora), ON, Canada. Climate variables were projected for locations close to sample sites using 3 emissions trajectories known as representative concentration pathways (RCPs).
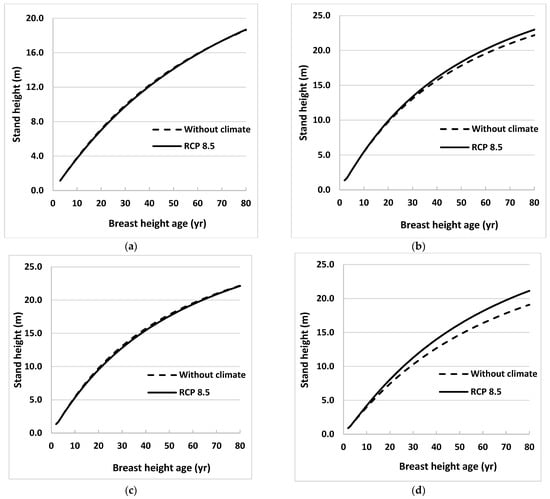
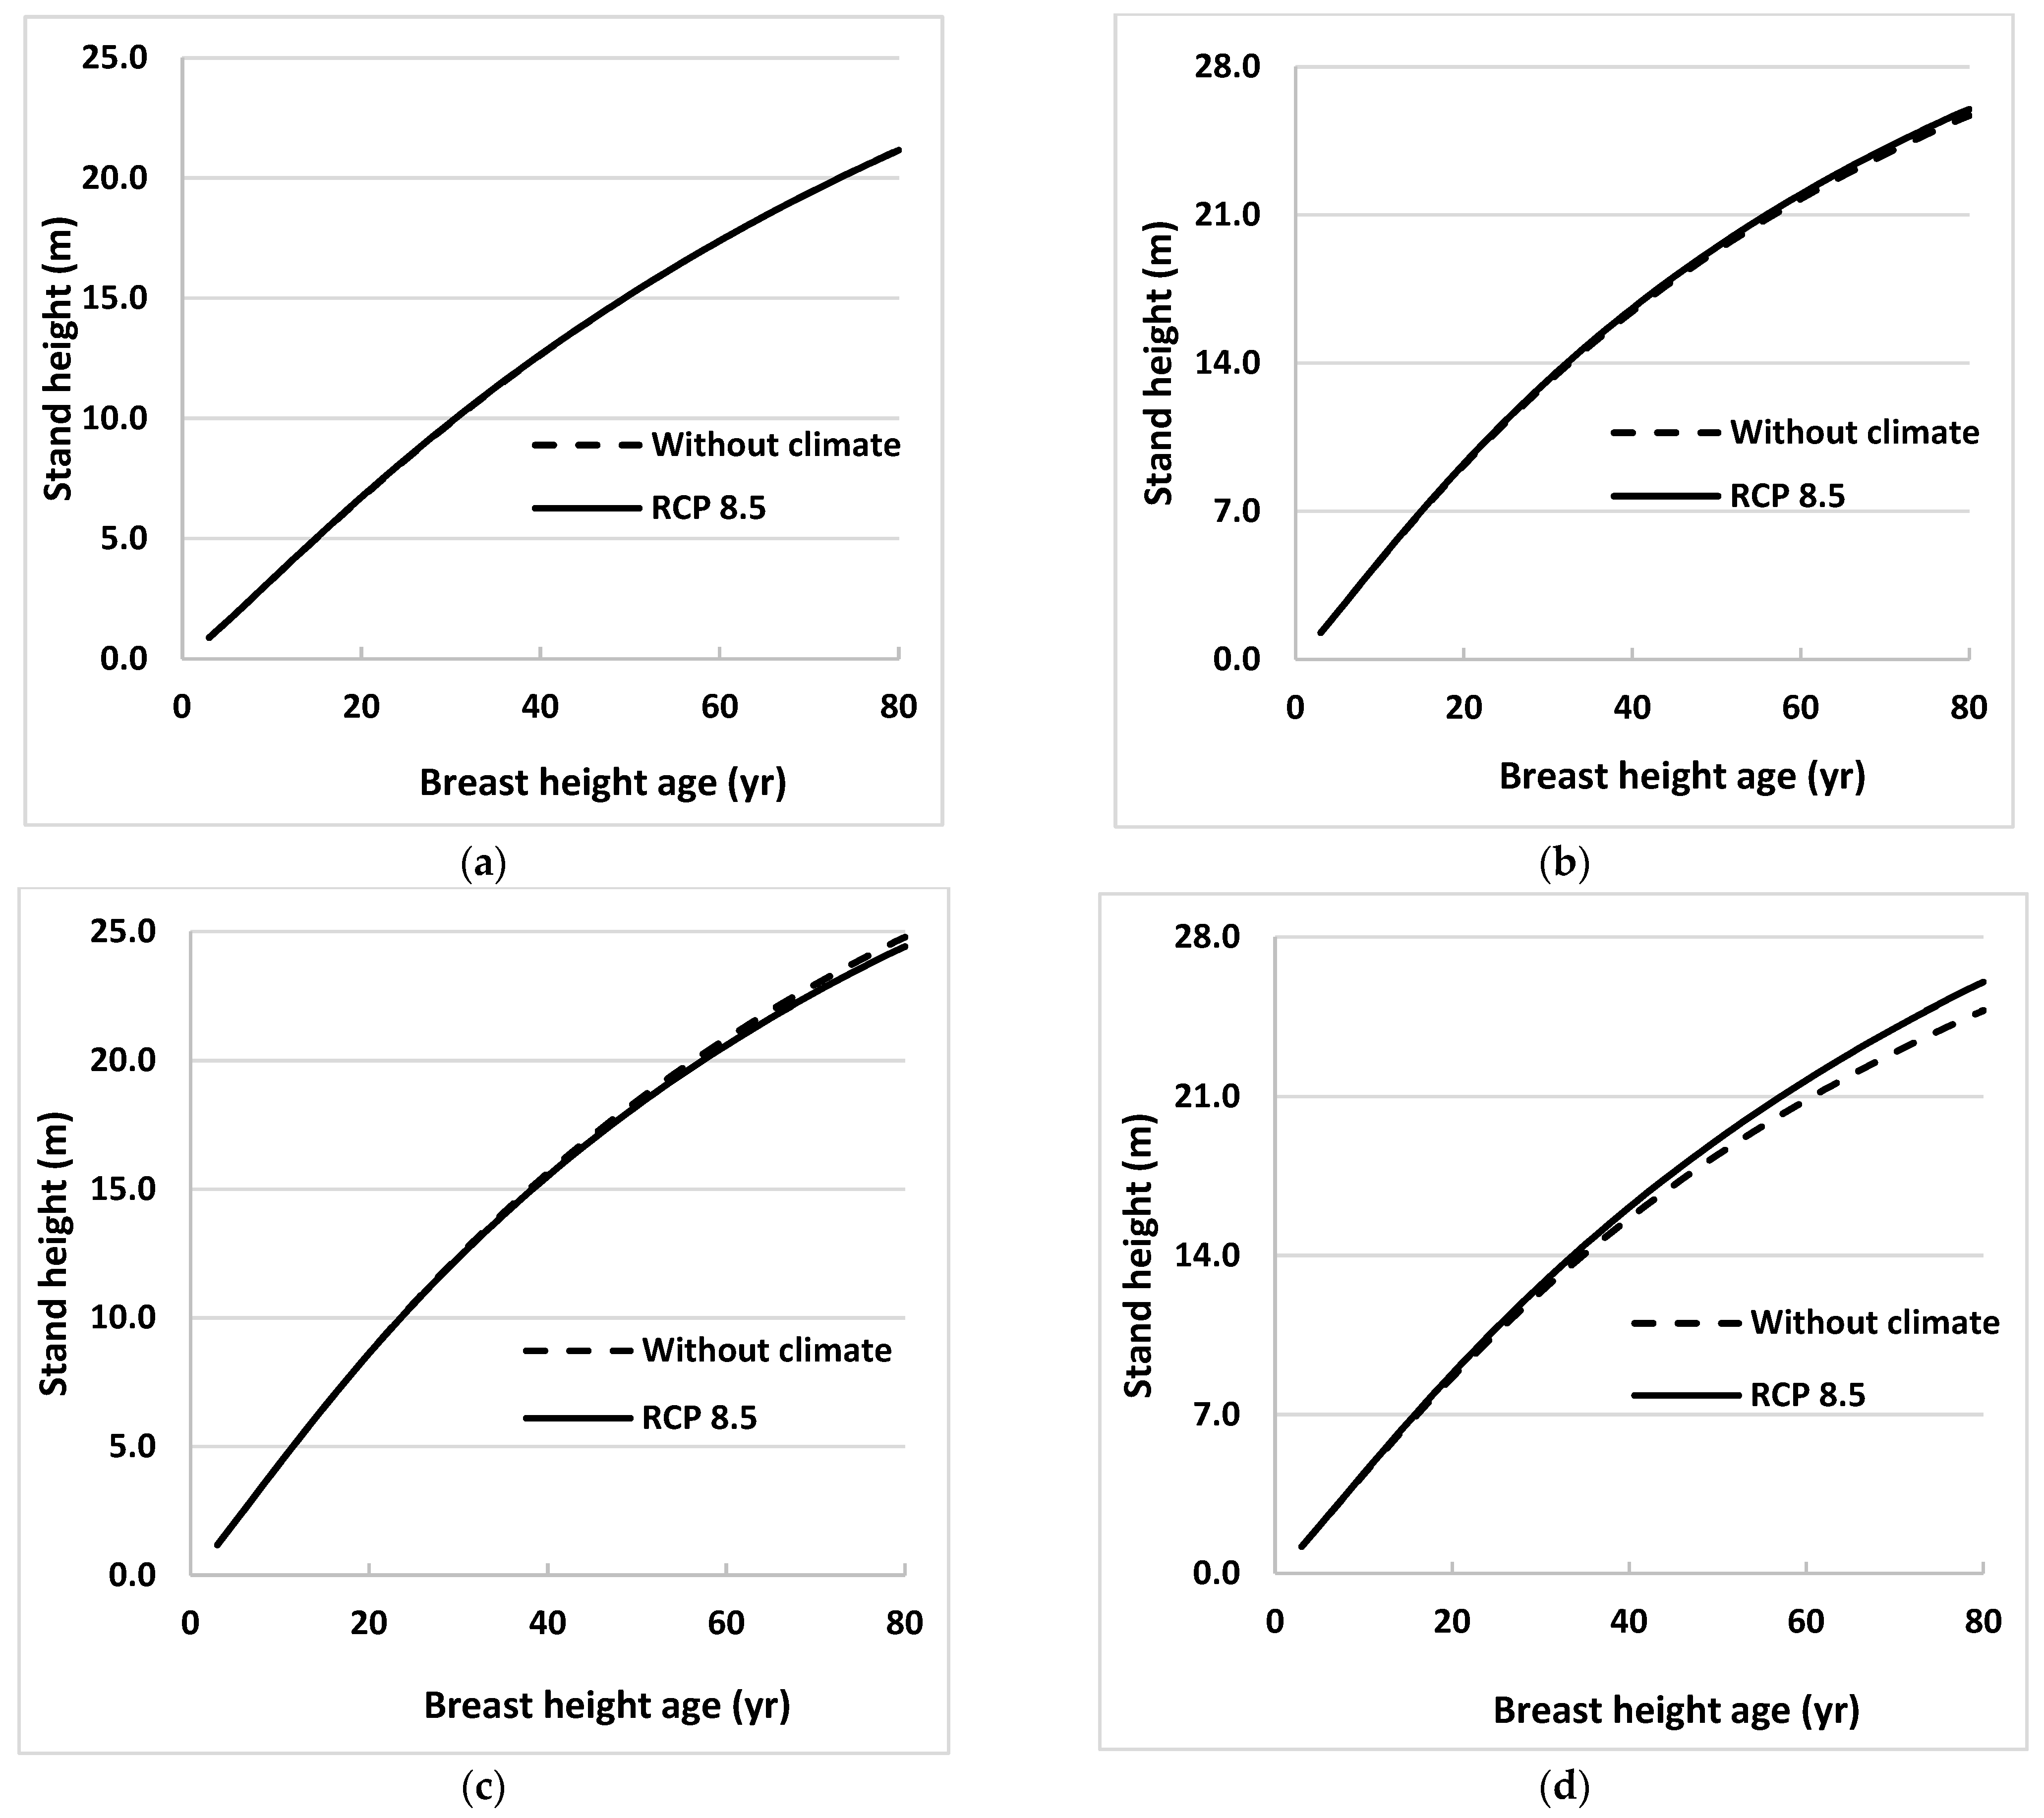
Figure 3.
Stand height profiles for natural origin trembling aspen trees generated using projected values of climate variables for the period 2021 to 2080, assuming that climate remains stable (without climate) or warms (RCP 8.5), in Equation (3) for (a) eastern (near Timmins), (b) central (near Hearst), (c) western (near Thunder Bay), and (d) far western (near Kenora), ON, Canada. Climate variables were projected for locations close to sample sites using 3 emissions trajectories known as representative concentration pathways (RCPs).
Height profiles generated under RCP 2.6 and 4.5 were almost identical to those under RCP 8.5 for all sites for both species, so only the latter was included in the figures. Height profiles were also obtained for the model without climate variables (Equation (2)) for the same growth period. Climate effects were obvious for one region (near Kenora) for black spruce and two regions (near Hearst and Kenora) for trembling aspen. The climate effects were not obvious until BHA 35 for black spruce near Kenora and for trembling aspen near Hearst. However, climate effect on stand height growth was more evident at Kenora for trembling aspen, beginning as early as BHA 10.
Where it occurred, climate influenced both species’ height growth positively. The maximum effect for black spruce was in the west (near Kenora) where tree height at BHA 80 under the RCP 8.5 scenario was 5% taller than tree height calculated using the model without climate variables (Figure 2). For trembling aspen, heights near Hearst and Kenora at BHA 80 were taller by 4% and 11%, respectively, than those calculated using the model without climate variables (Figure 3). Climate effects on height growth at the other sites were minimal.
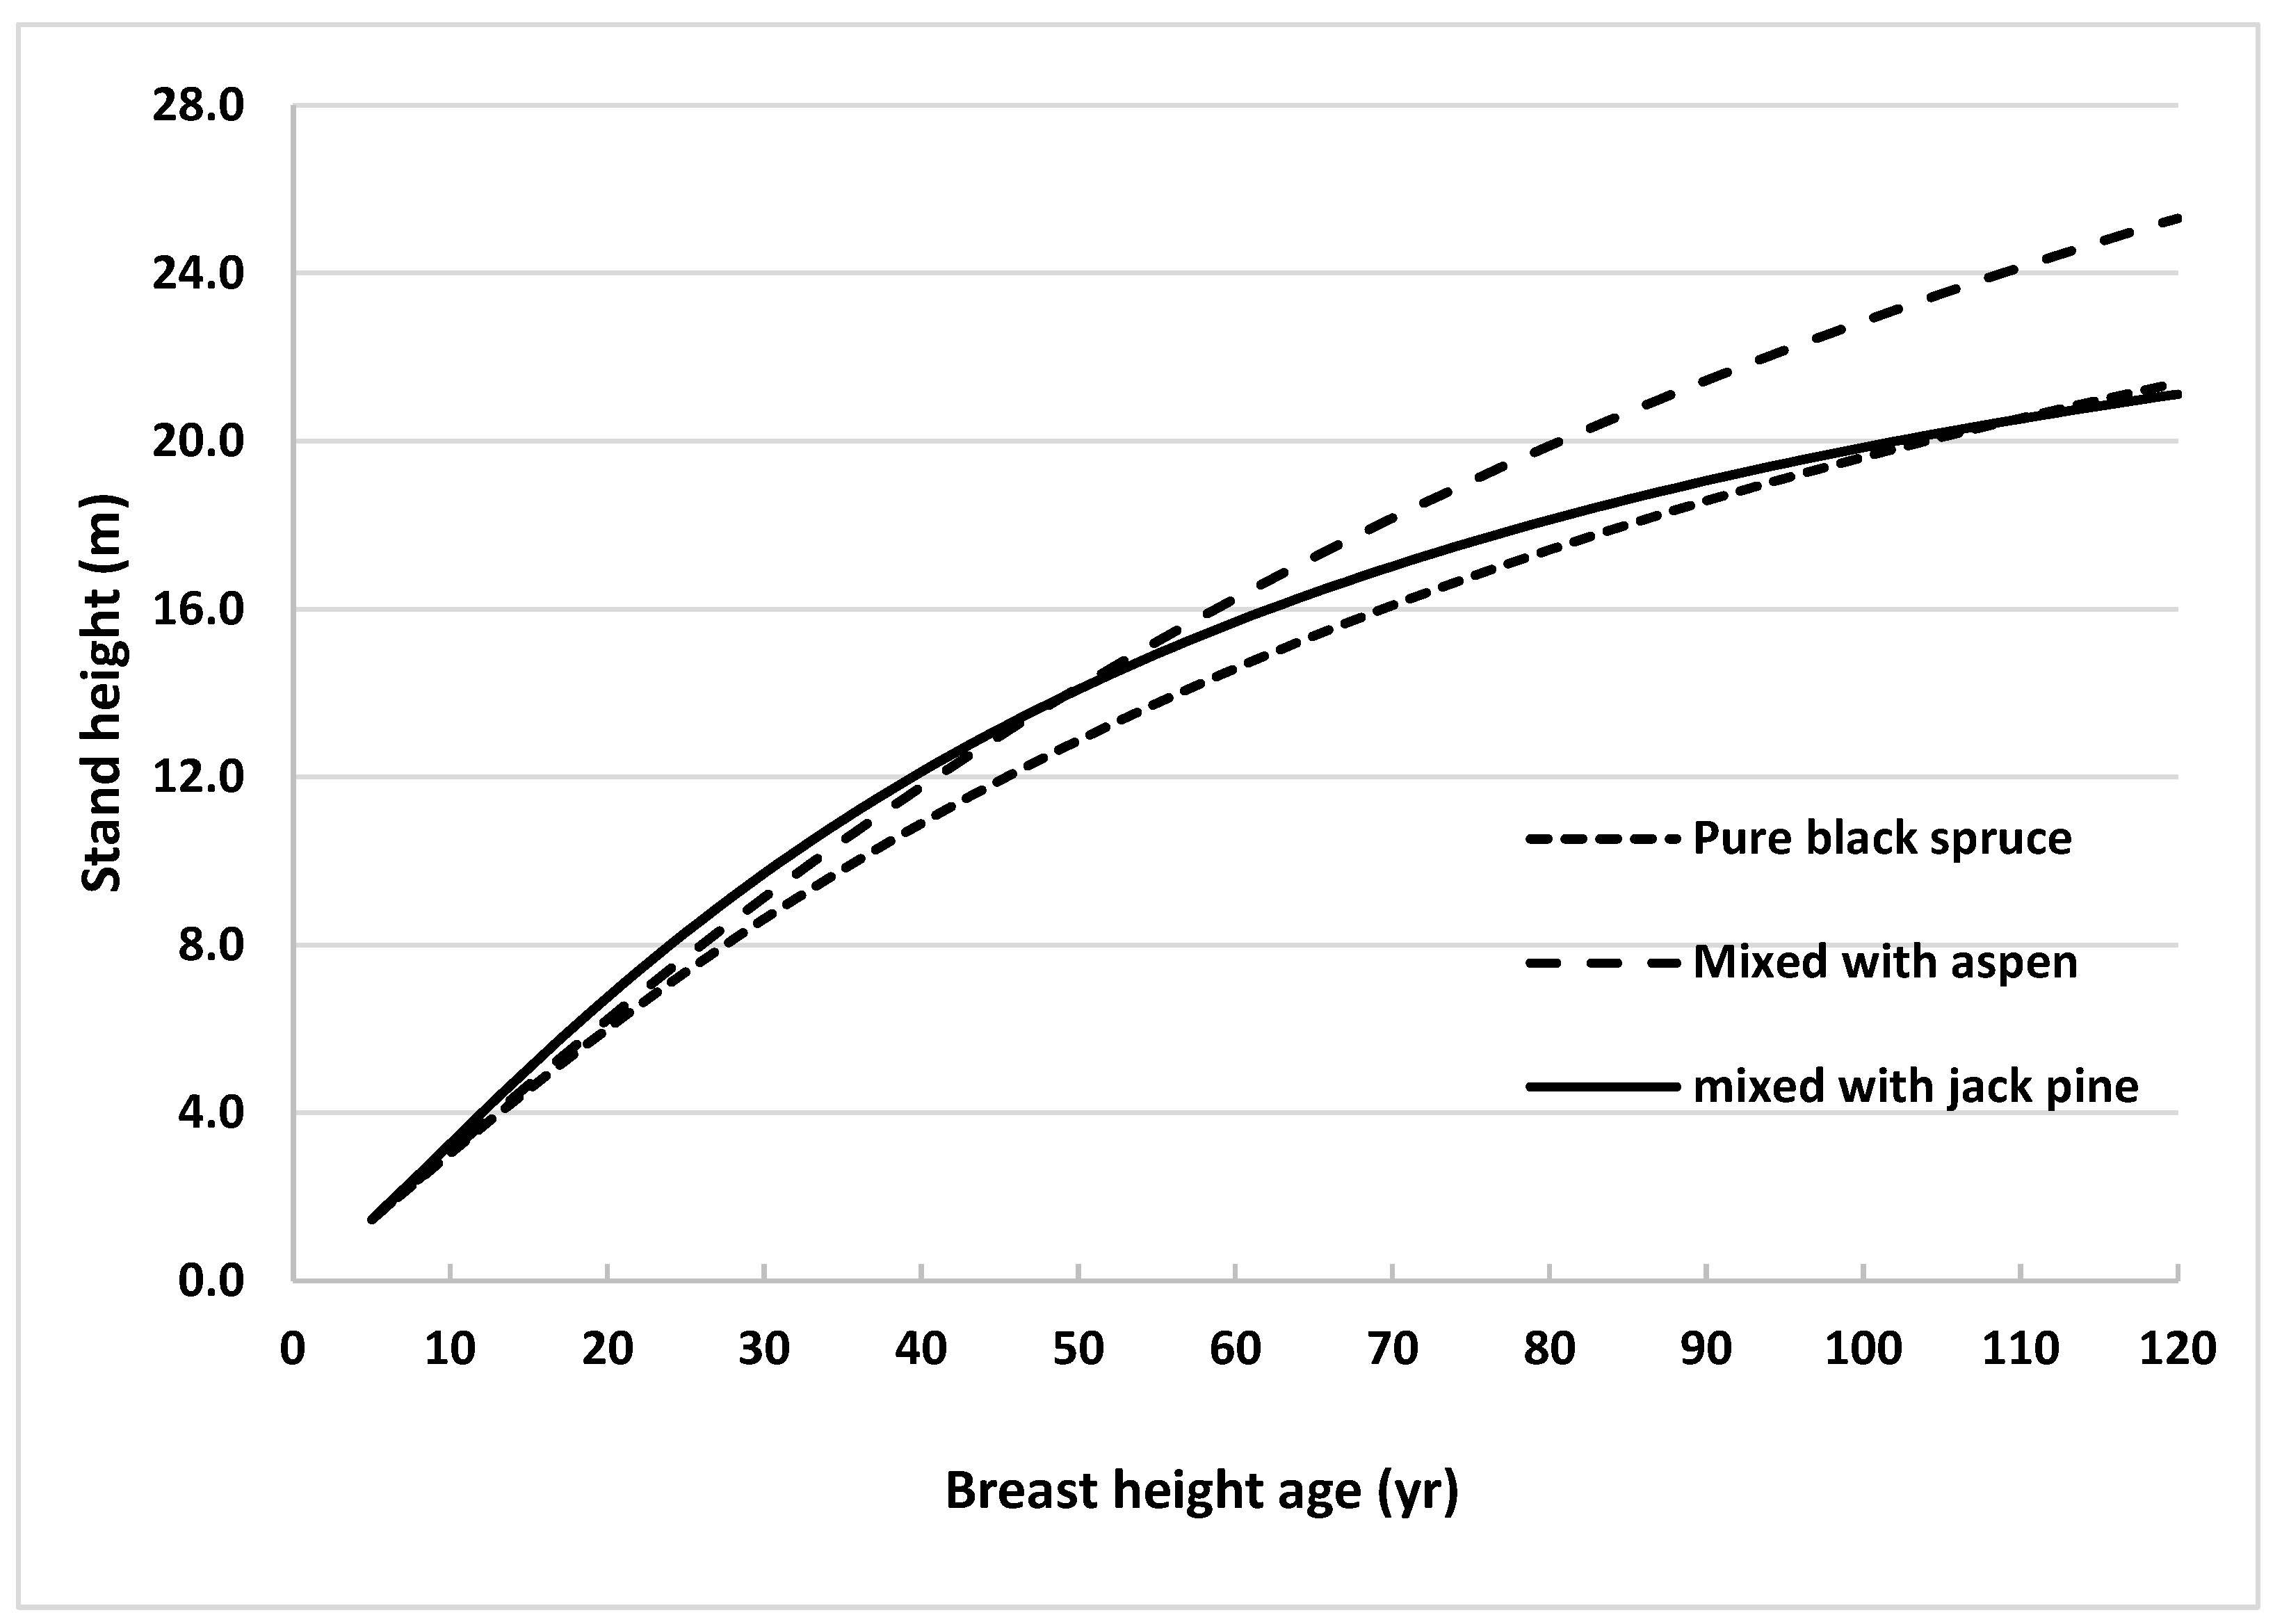
Height growth of black spruce was further analyzed by comparing stand height growth of trees grown in natural pure and mixed species stands. Stand heights were estimated across stand age using the model without climate variables (Equation (2)) and the models published by Sharma and Reid [31] for natural origin pure and by Sharma [13] for natural origin mixed (with jack pine) stands. Estimated stand heights were plotted against stand age for all 3 stand types (Figure 4).
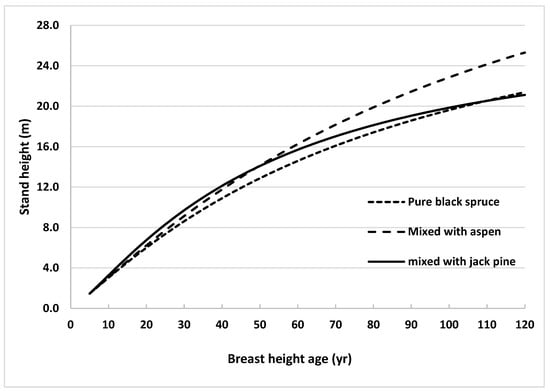
Figure 4.
Height growth curves generated using Equation (3) for black spruce grown in natural origin mixed stands of northern Ontario, Canada, using average observed heights at breast height age 5 years (1.46 m) as starting values, with trembling aspen and jack pine (using the same equation with the parameters described in Table 3 of Sharma (2021)) compared with height growth curves for natural pure stands generated using the same equation with the parameters described in Table 4 of Sharma and Reid (2018).
Height in pure stands was consistently lower than that in jack pine mixed stands until stands reached BHA 110. After that age, heights in pure stands surpassed those in jack pine mixed stands. On the other hand, the stand height of black spruce grown with trembling aspen was consistently higher than that in pure stands across BHA. The difference in heights increased with BHA. This finding indicated that inter-specific competition between black spruce and trembling aspen occurs, and is more pronounced than with jack pine, especially after BHA 55.
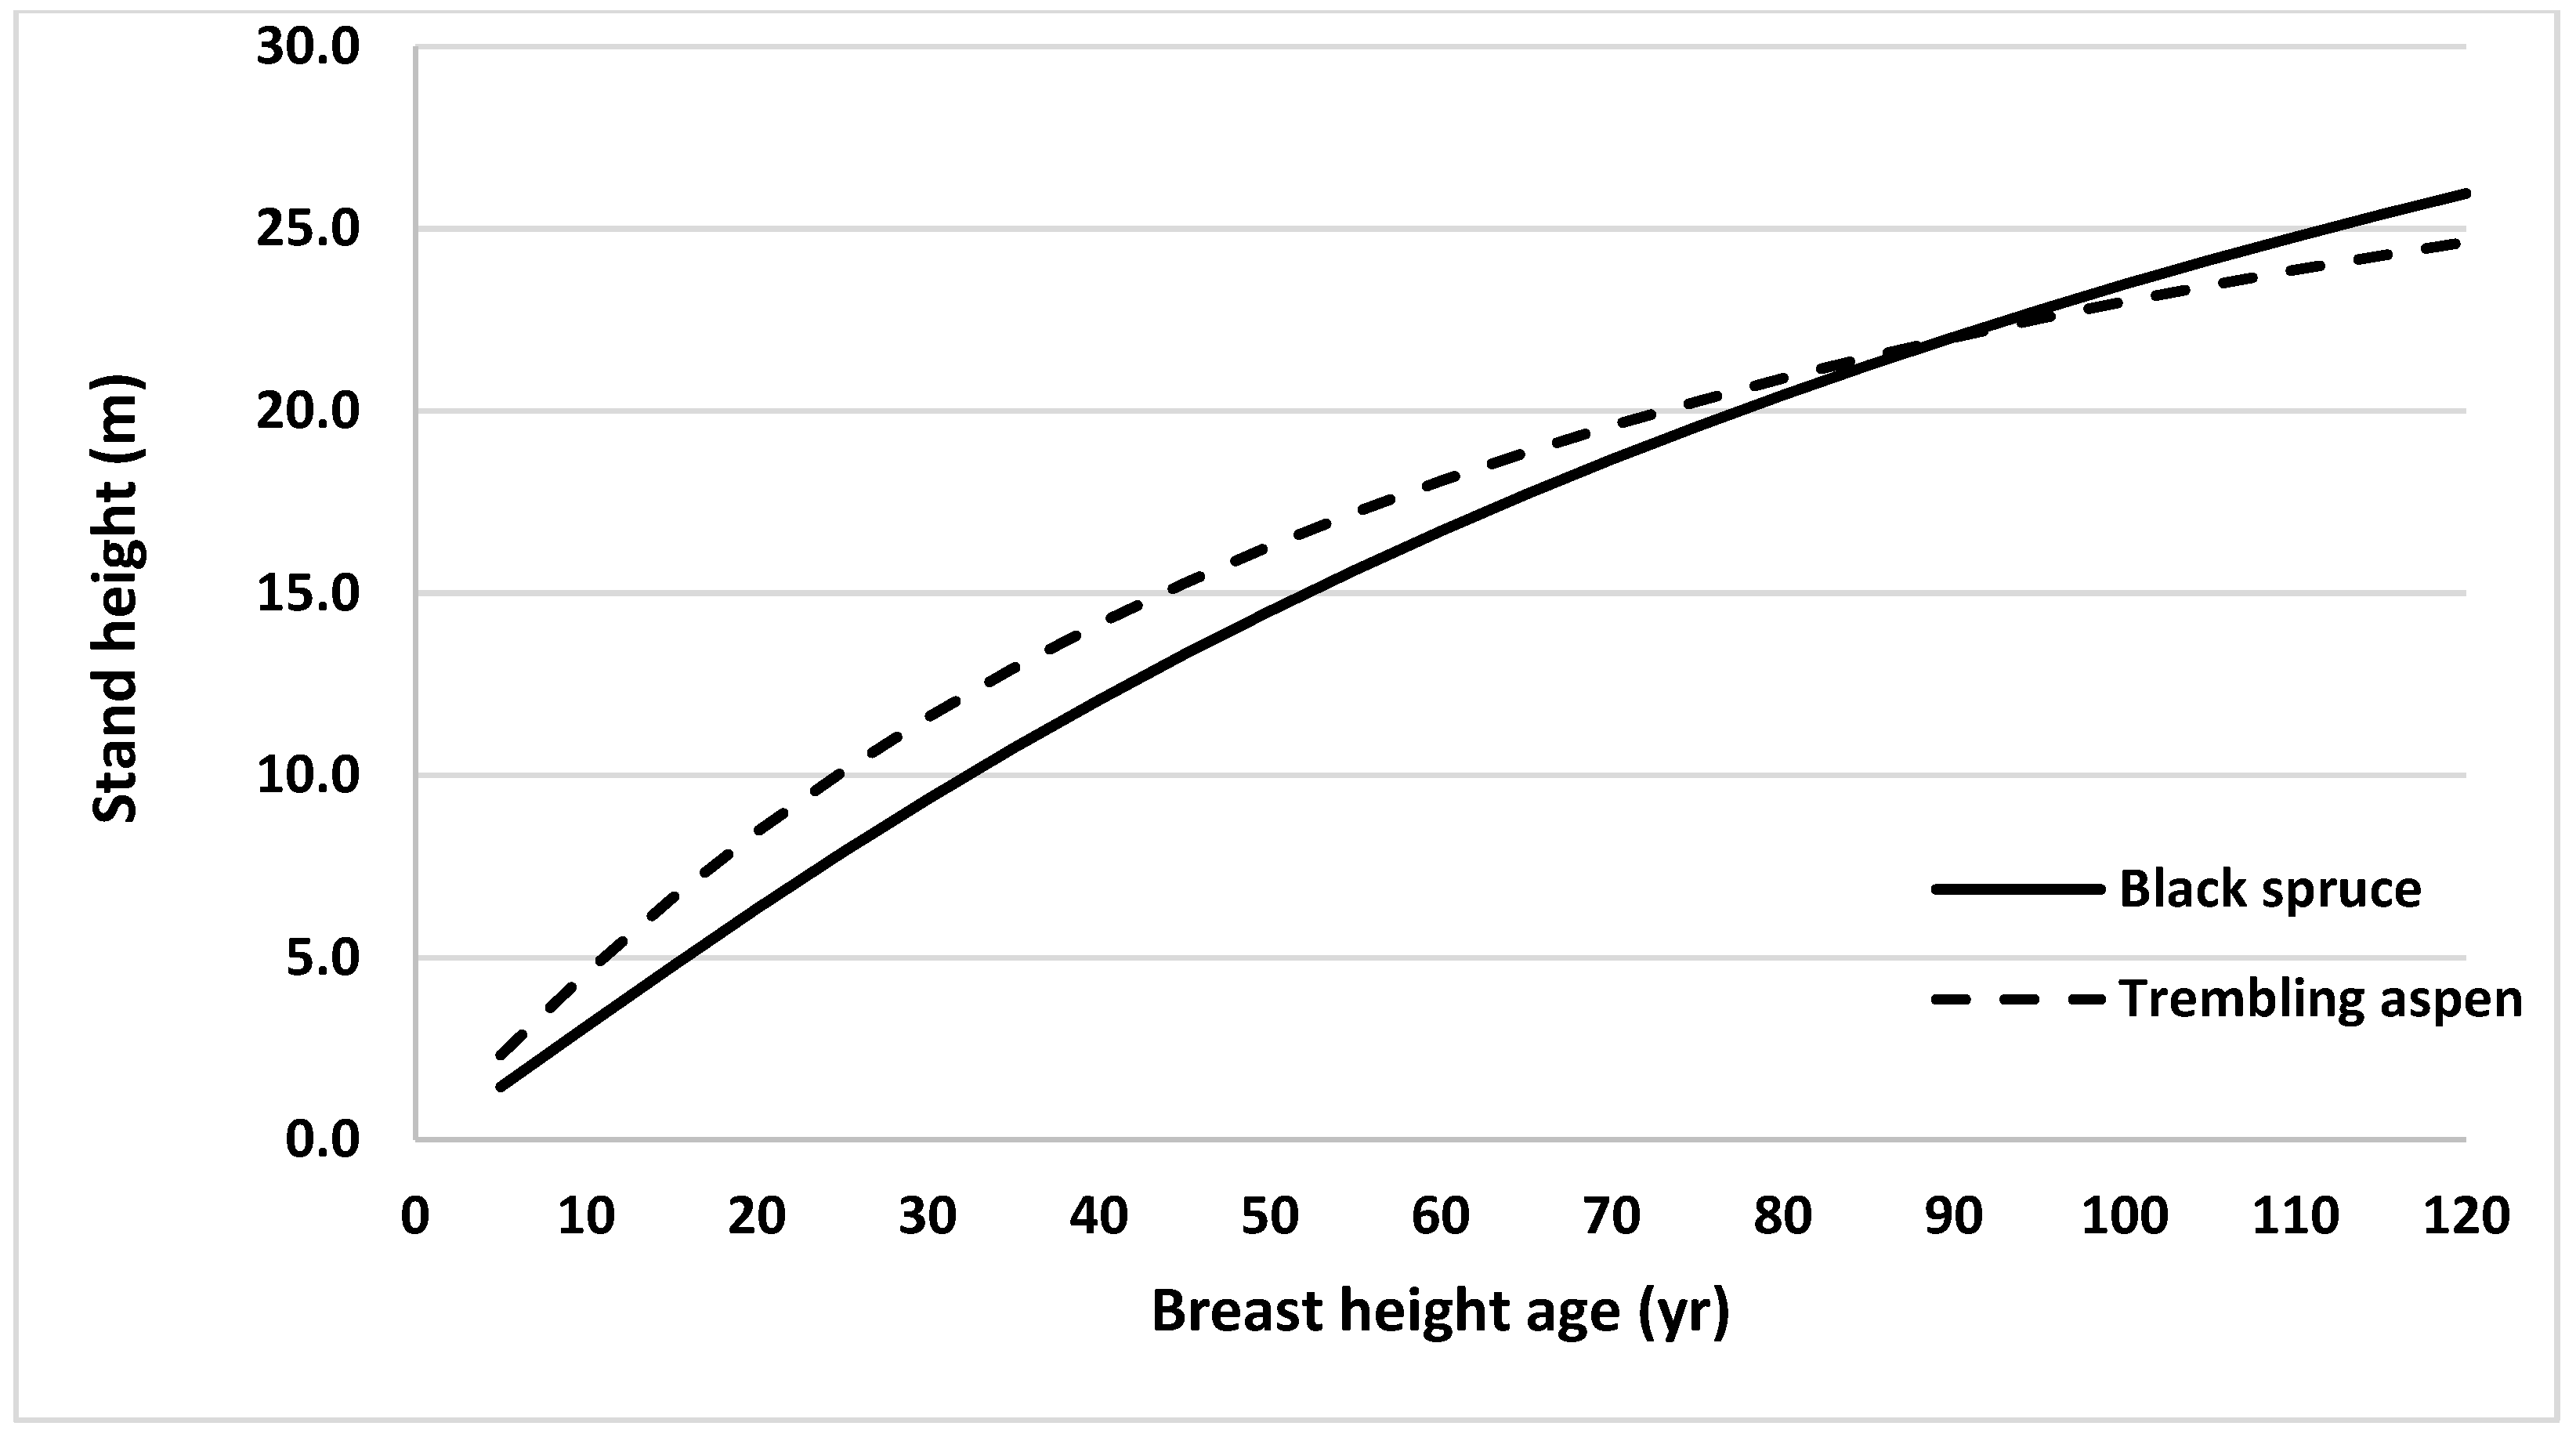
Similarly, height growth of black spruce and trembling aspen in mixed stands were compared. For this, stand heights were estimated across stand age using the model without climate variables (Equation (2)) for both species and plotted against BHA (Figure 5). Average heights of sampled trees from all 31 sites at BHA 5 were used as initial values in developing these height profiles for each species. Projected stand height of trembling aspen trees was taller than that for black spruce until BHA 85, after which black spruce stand height was taller.
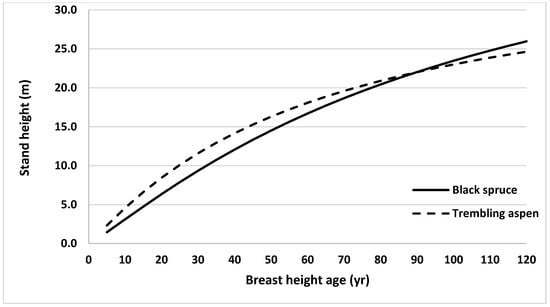
Figure 5.
Height growth curves generated using Equation (2) (by ignoring random effects and climate variables) for black spruce and trembling aspen grown in northern ON, Canada, using average observed heights at breast height age 5 years (1.46 and 2.33 m, for black spruce and trembling aspen, respectively) as starting values.
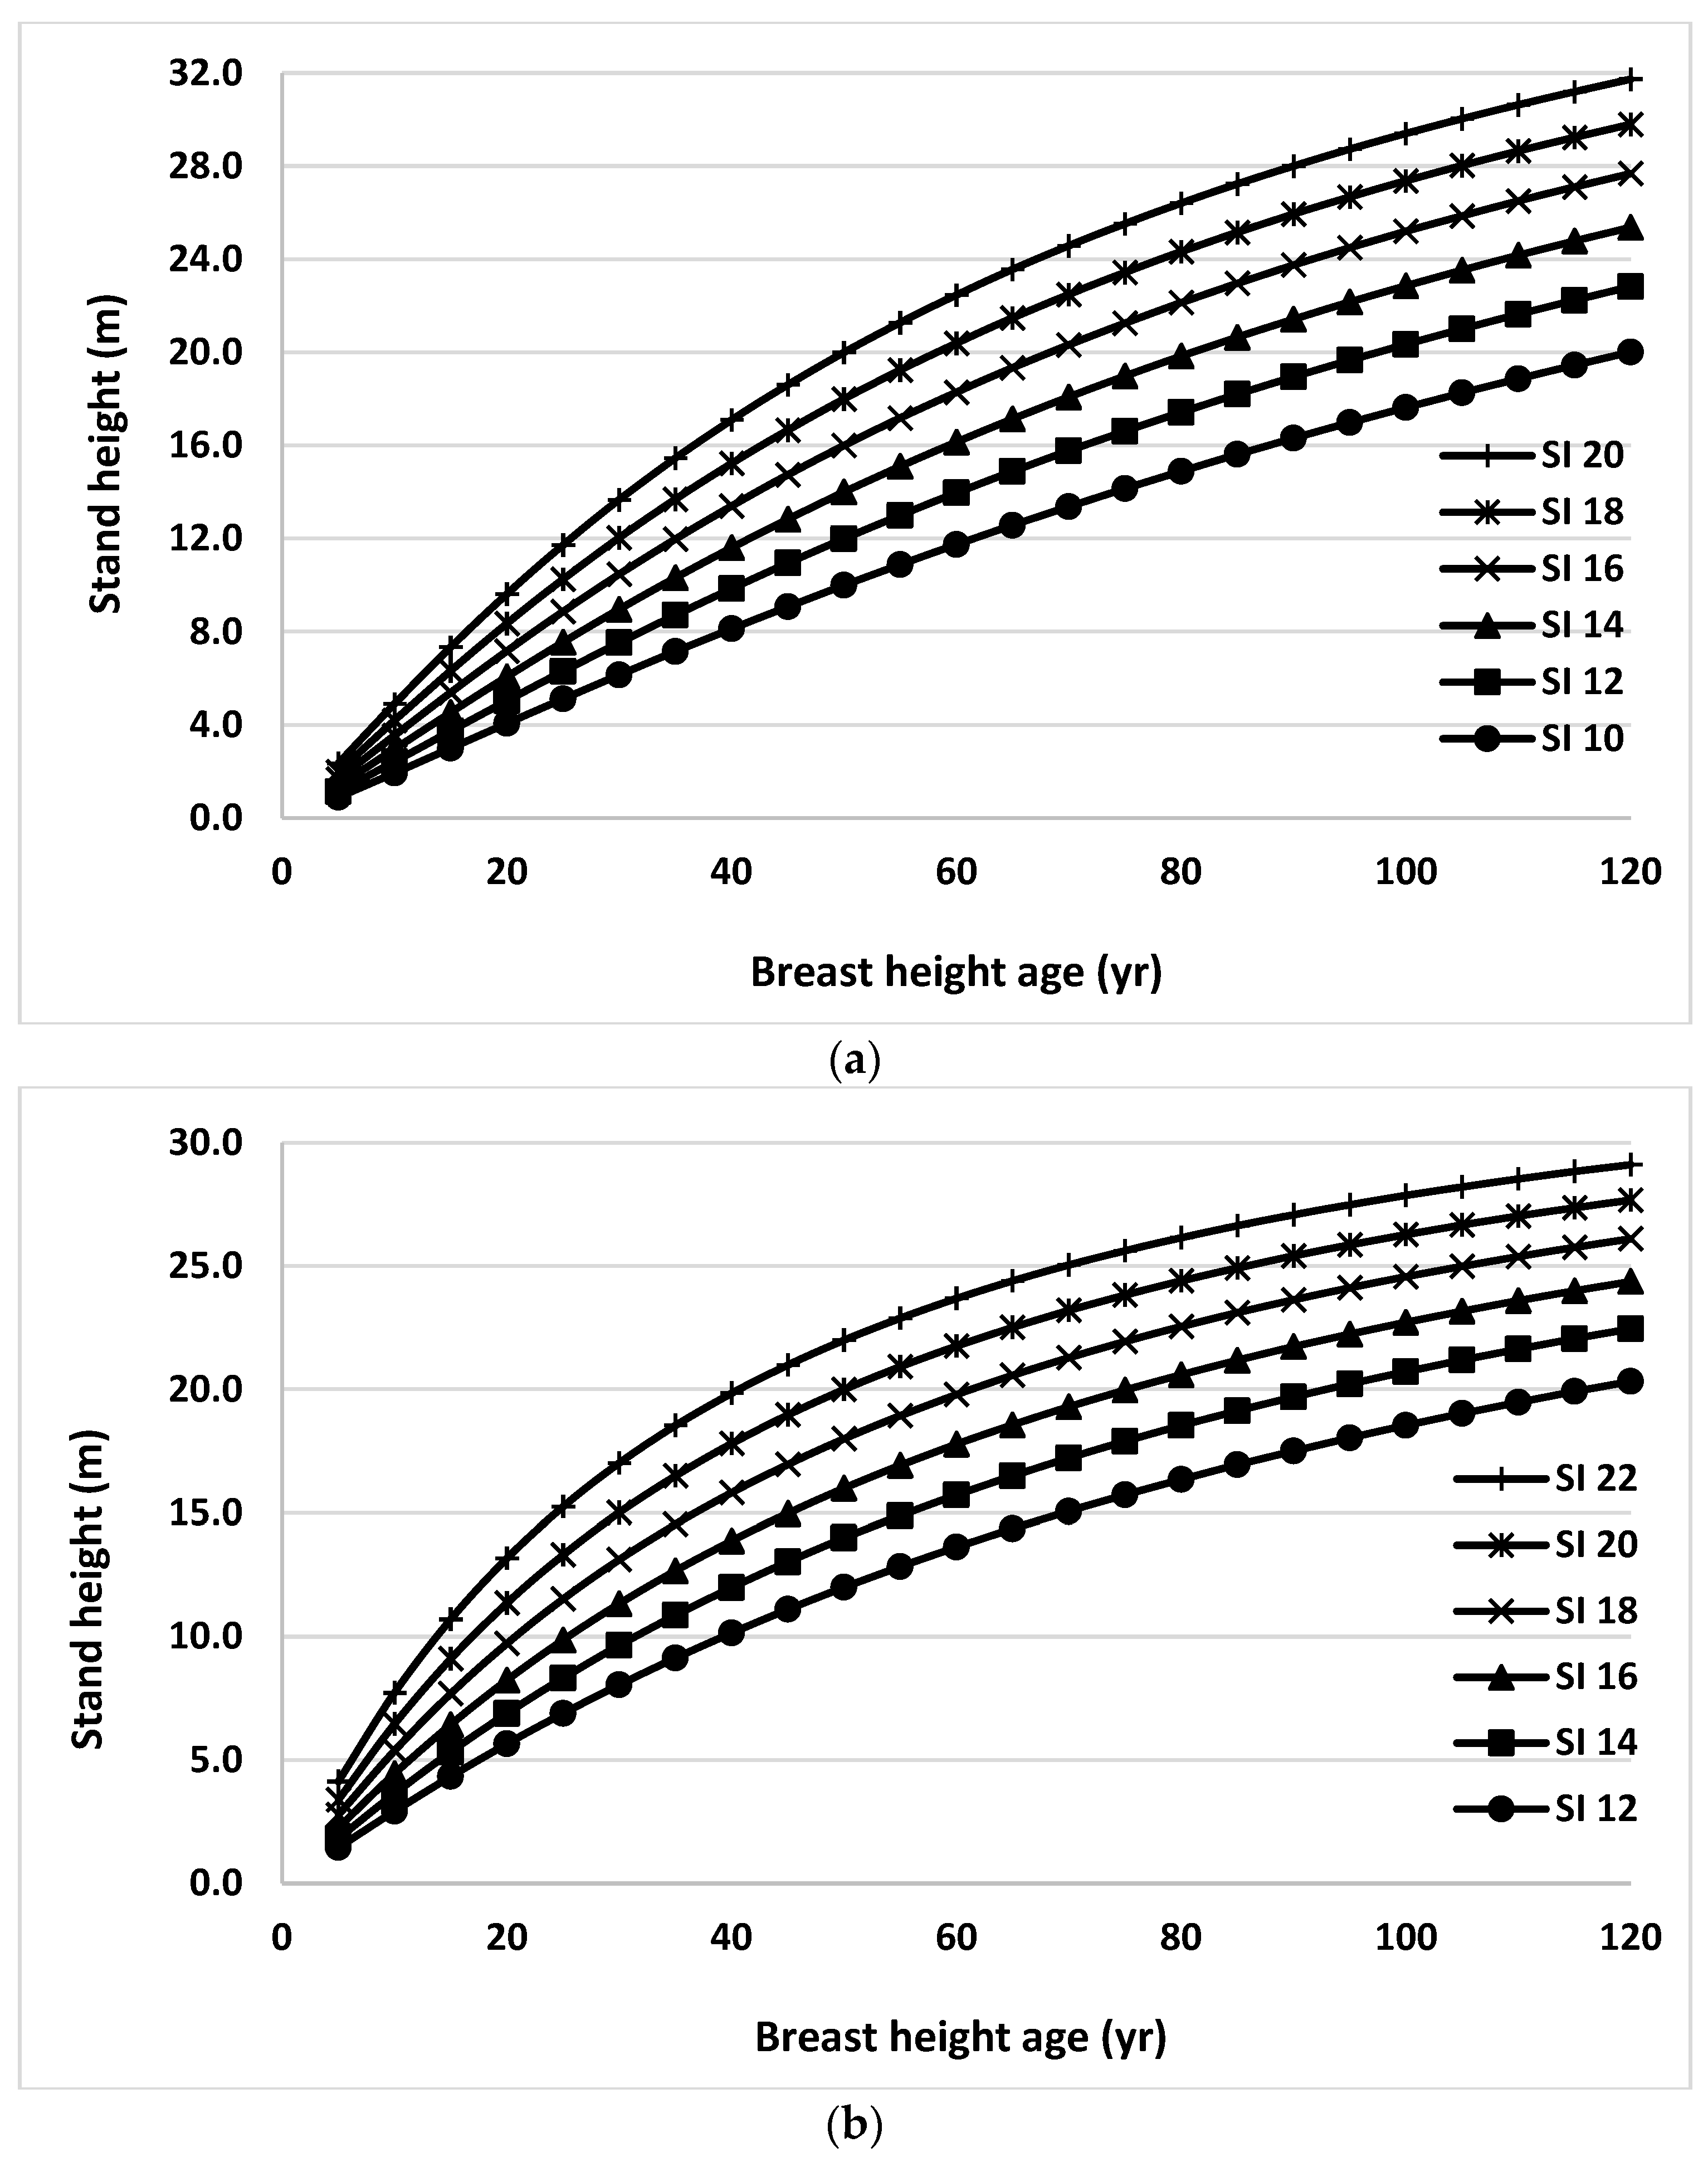
Finally, stand height/SI profiles were generated using Equation (2) for black spruce and trembling aspen trees grown in natural origin mixed stands for the range of site productivity (Figure 6). Random effects and climate variables were ignored in generating these profiles. Stand heights at the index age of BHA 50 were used as SIs. These curves were very consistent with the observed trends in the data set used in this study across all productivity classes.

Figure 6.
Stand height/site index (SI) profiles generated using Equation (2) for black spruce (a) and trembling aspen (b) trees grown in natural origin mixed stands in Northern Ontario for the range of site productivity.
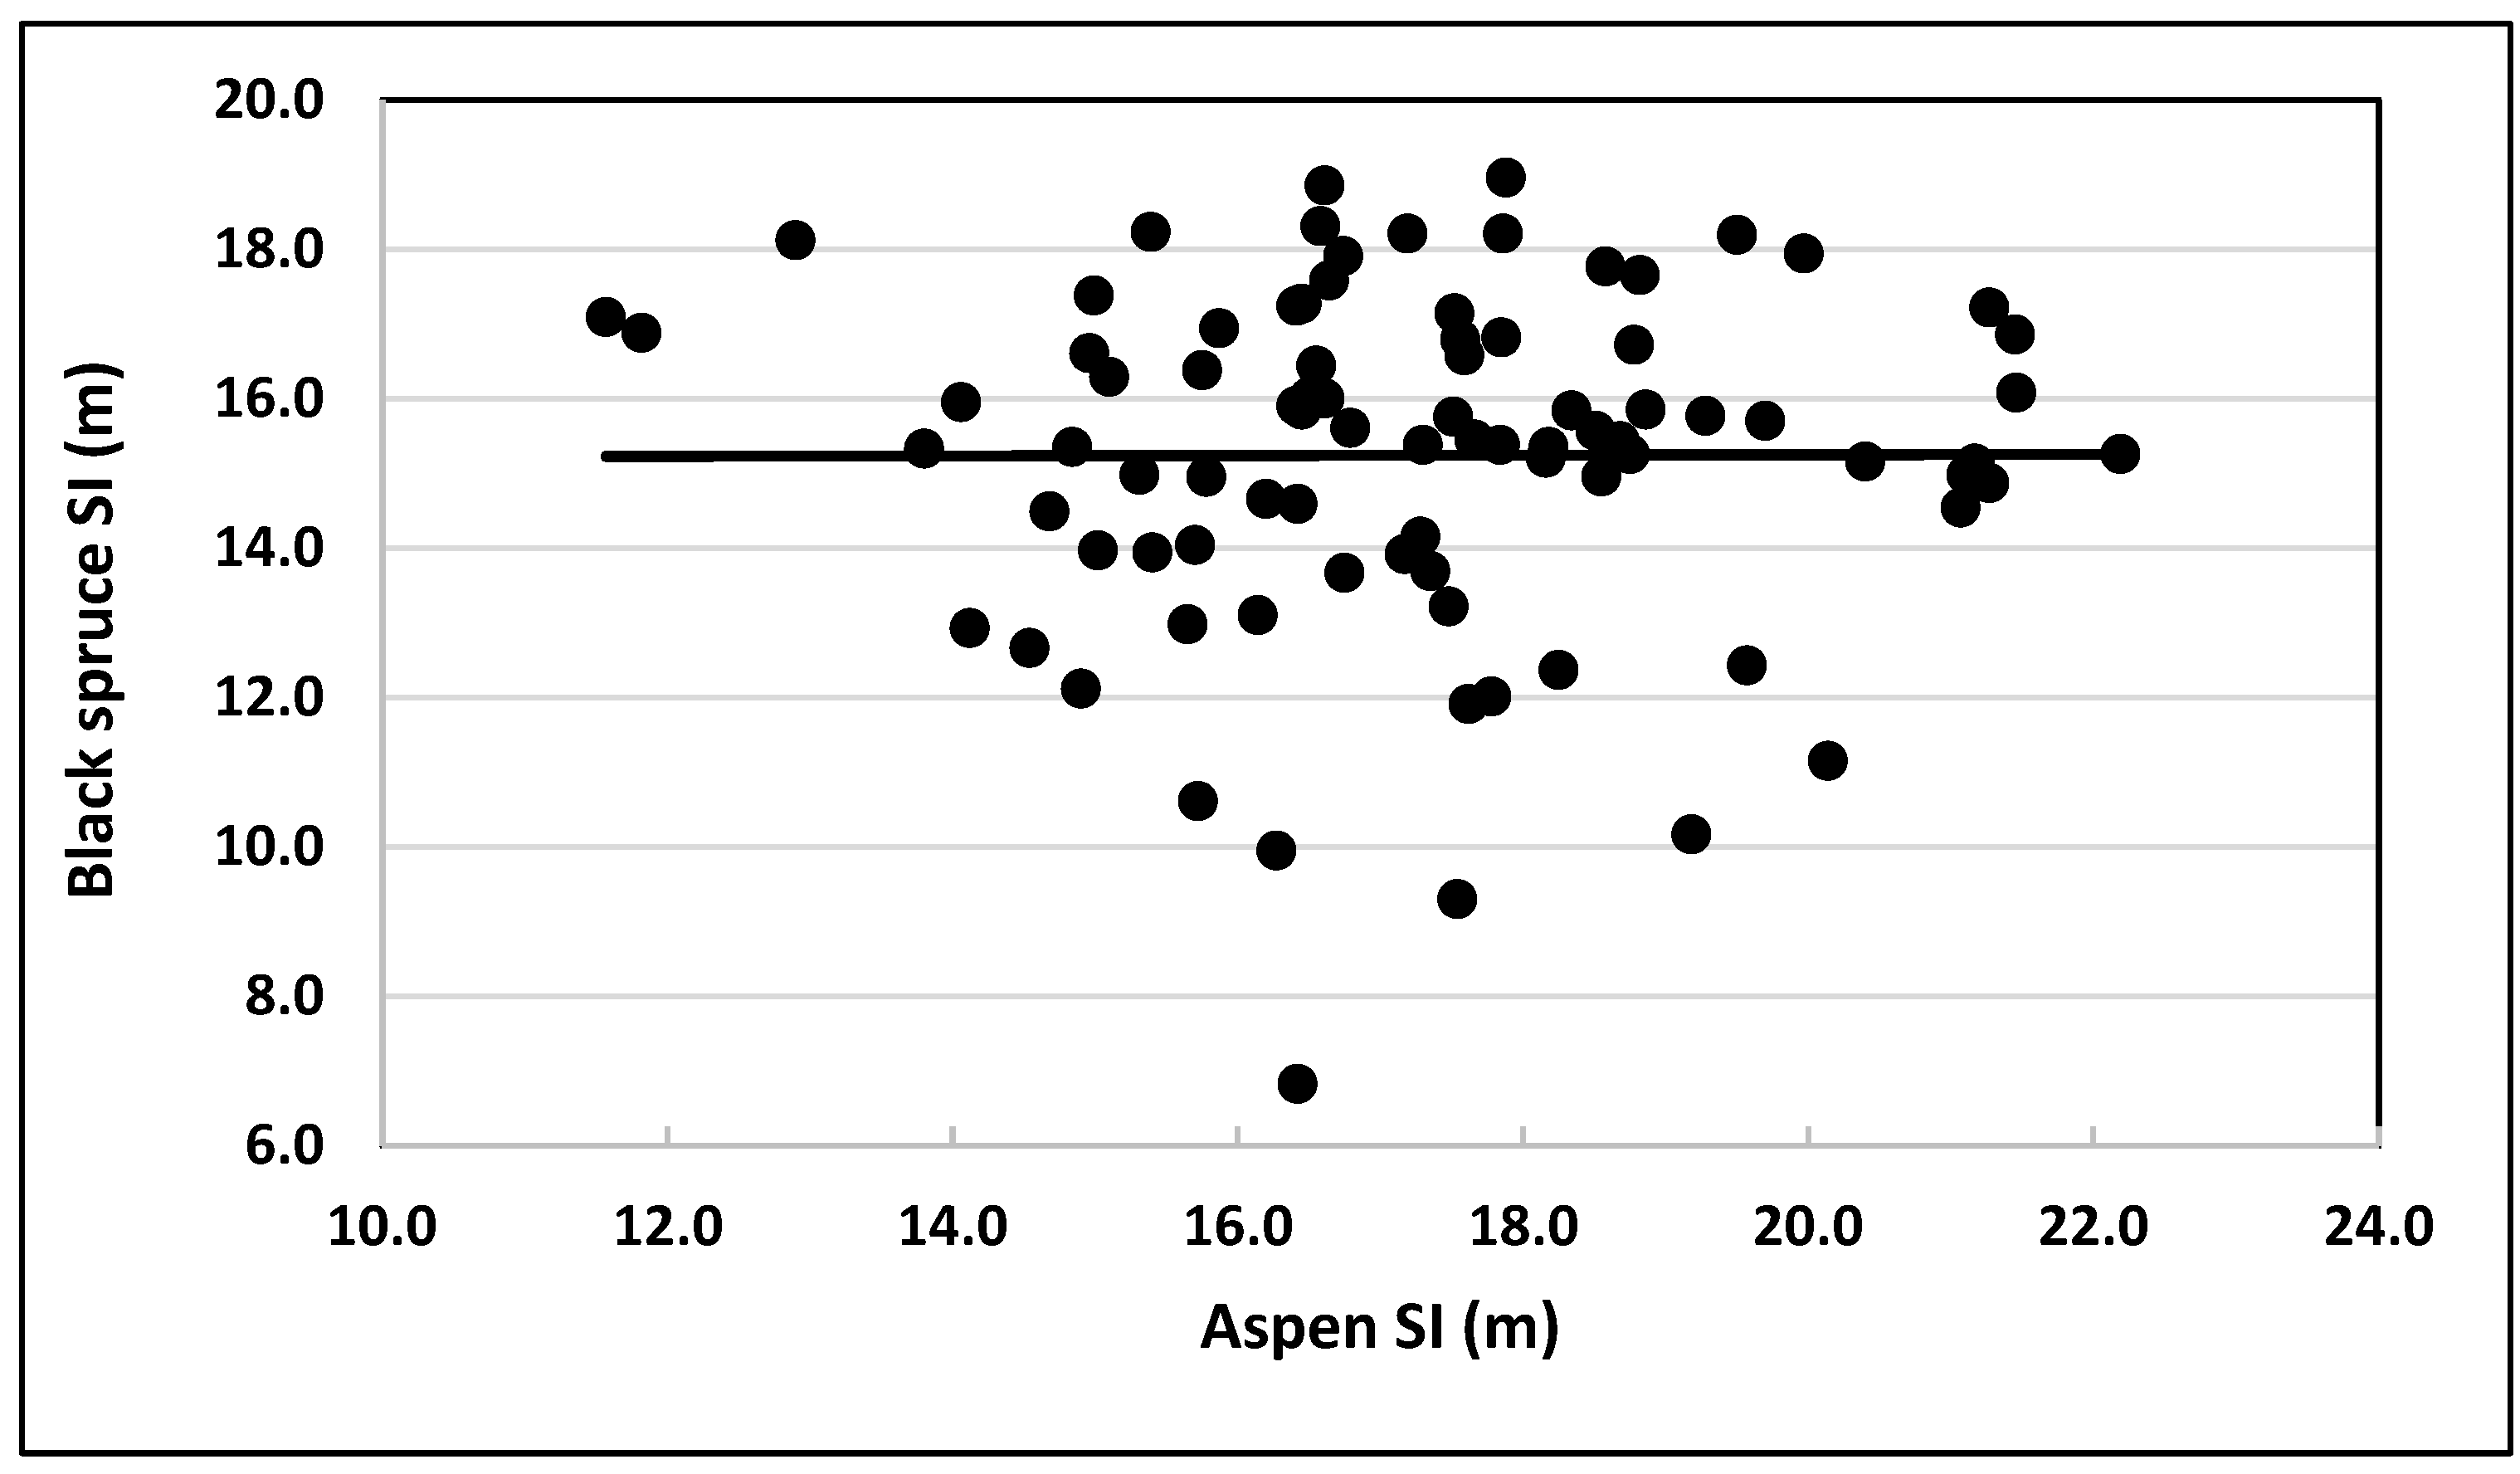
To explore the relationship between SIs of black spruce and trembling aspen, SI (observed stand height at age 50 BHA) of black spruce was plotted against SI of trembling aspen trees grown in the same plot (Figure 7). No obvious pattern (linear/nonlinear) was evident. The trend line was parallel to the x-axis, with black spruce SIs randomly distributed around it. Similarly, the Pearson correlation coefficient between black spruce and trembling aspen SIs was 0.0027. This value suggested that the quantitative linkage between SIs of black spruce and trembling aspen trees grown in natural origin mixed stands could not be described by a linear/nonlinear mathematical function.

Figure 7.
Observed values of site indices (base age 50 BHA) of black spruce plotted against their counterparts for trembling aspen grown in natural mixed stands.
Site productivity at a location is affected by climate and other environmental conditions [32]. Site productivities of jack pine, red pine, white pine, black spruce, and white spruce plantations [10,11,12] and of natural origin jack pine and black spruce mixed stands in Ontario [13] were found to be affected by climatic conditions, such as changes in temperature and precipitation regimes. The nature (positive or negative) and magnitude of the effects depended on tree species. The magnitude of climate effects varied from north to south and east to west. Similarly, the climate variables selected that affected site productivity also varied by tree species.
Precipitation and temperature related variables, i.e., growing season total precipitation (GSTP) and growing season mean temperature (GSMT), respectively, affected stand height growth for jack pine and black spruce plantations [10]. Only a temperature-related variable (GSMT) affected the height growth of red pine plantations [12]. Similarly, warmest quarter total precipitation (WQTP) and warmest quarter mean temperature (WQMT) explained variation in stand height growth of white spruce plantations [11]. For white pine plantations, the climate variable that most influenced stand height growth was MDTR [3].
For jack pine and black spruce natural origin mixed stands, a temperature related variable (GSMT) explained much of the variation in stand height growth for both jack pine and black spruce trees [13]. In this study, the temperature related variable MDTR explained much of the variation in stand height growth for both black spruce and trembling aspen trees. Even in the natural origin mixed stands, different climate variables explained black spruce height growth, regardless of which other tree species occurred in the mixture.
Black spruce height growth was explained by GSMT and MDTR in the presence of jack pine and trembling aspen, respectively. Although MDTR was the climate variable significant in the stand height growth model of black spruce and trembling aspen in this study, it explained different aspects of the variation: the asymptote for black spruce and the rate parameter for trembling aspen. These findings indicated that climate effects on site productivity also depended on stand type (plantations vs. natural origin stands) and species mixture (other tree species growing in the stands).
Increase in site productivity in mixed stands has been reported in previous studies. The productivity of Norway spruce (Picea abies), silver fir (Abies alba), Scots pine (Pinus sylvestris), European beech (Fagus sylvatica), sessile oak (Quercus petraea), European ash (Fraxinus excelsior) and sycamore maple (Acer pseudoplatanus) mixed stands was higher by 7–53% than in mono-specific stands [6]. Similarly, the productivity of Douglas-fir (Pseudotsuga menziesii (Mirb.) Franco) increased in mixed stands [7,33]. The productivity of Norway spruce (Picea abies (L.) H. Karst.) and European beech (Fagus sylvatica L.) mixed stands also increased compared to pure stands, but the increase depended on tree species [34]. The increase in productivity of Norway spruce (Picea abies), sessile oak (Quercus petraea), and common alder (Alnus glutinosa) grown with Scots pine (Pinus sylvestris) also depended on tree species [35].
In addition to complementarity effects on a tree species growing in mixed stands, the increase in productivity also depended on climate. In Picea abies and Abies alba mixed stands, the productivity of Pieca abies increased with increasing maximum temperature and the productivity of Abies alba increased with decreasing maximum temperature and increasing minimum temperature [5]. In this study, we found that the site productivity of black spruce was higher in mixed stands than in pure stands. However, the increase depended on the species that it is growing with. The stand height of black spruce grown with jack pine was higher than with trembling aspen until 50 BHA. Thereafter, the separation in stand heights between pure and mixed with trembling aspen continued to increase but decreased with jack pine.
Carmean et al. [13] analyzed results of 6 studies comparing SI relations among 24 hardwood and conifer tree species in the United States and the Upper Great Lakes area of Canada. They presented SI conversion equations for trees grown in natural mixed stands. Similarly, Nigh [4] developed SI conversion equations for 4 conifer tree species in British Columbia, Canada, using estimated values (not observed) of SIs. Sharma [13] also developed SI conversion equations using observed values of SI (stand height at BHA 50) for both jack pine and black spruce trees grown in mixed stands. He regressed SI of one species against the SI of the other species along with climate variables. In this study, however, no relationship was evident between SIs of black spruce and trembling aspen trees grown in natural origin mixed stands that could be described by a linear/nonlinear mathematical function.
Nigh [4] developed SI conversion equations using SI values estimated from models fitted to the data from pure stands. Results from this study and others mentioned above, however, indicated that stand height growth trajectories of trees grown in mixed stands are not the same as the ones grown in pure stands. Therefore, the information on SI values for mixed stands obtained using models developed for pure stands could be misleading. Even in mixed stands, the height growth trajectories of black spruce trees were influenced by the other species present. The site productivity of black spruce grown with jack pine differed from that when it was grown with trembling aspen.
As mentioned earlier, the climate variables significant in the stand height growth models differed by species. Those variables were not the same even for the same tree species (black spruce) grown in different environment (plantations vs. natural stands) and species mixture. Therefore, more research is required to identify/determine the underlying bioclimatic driving variables affecting tree growth. Since climate variables were selected based on statistical significance in the stand height growth models developed here, caution should be applied in using the models beyond the range of MDTR used in this study.
4. Conclusions
Stand height growth models were developed for black spruce and trembling aspen trees grown in natural origin mixed stands in Ontario, Canada. The models developed were based on McDill-Amateis growth function. The parameters of this function were expressed in terms of climate variables so the model is useful in a changing climate. For black spruce, the asymptote was expressed as a linear function of mean diurnal temperature range (MDTR). For trembling aspen, the rate parameter was a linear function of the mean diurnal temperature range (MDTR). Other precipitation and site variables were not significant for either species. No obvious linear/nonlinear relationship were evident between SIs of these tree species grown in natural origin mixed stands. Therefore, SI conversion equations could not be developed to estimate SI of trembling aspen given the SI of black spruce, and vice versa.
Stand heights of black spruce and trembling aspen trees grown in natural origin mixed stands can be estimated at any age using the models developed. SI can be obtained by estimating the stand height at the base (index) age. If climate values are not readily available, the site productivity can be estimated using the models fitted without climate variables.
Funding
This research received no external funding.
Institutional Review Board Statement
Not applicable.
Informed Consent Statement
Not applicable.
Data Availability Statement
Original data presented in the study are described in the main text, and further inquiries can be directed to the corresponding author.
Acknowledgments
This study was supported by the Ontario Ministry of Northern Development, Mines, Natural Resources and Forestry (NDMNRF). The author is grateful to Daniel McKenney, Canadian Forest Service, for providing estimates of climate variables for study sites; Chris Stratton, NDMNRF, for coordinating field work; and Lisa Buse, Ontario Forest Research Institute, for editing an earlier version of the manuscript.
Conflicts of Interest
The authors declare no conflict of interest.
References
- Sharma, M.; Amateis, R.L.; Burkhart, H.E. Top height definition and its effect on site index determination in thinned and unthinned loblolly pine plantations. For. Ecol. Manag. 2002, 168, 163–175. [Google Scholar] [CrossRef]
- Vanclay, J.K. Assessing site productivity in tropical moist forests: A review. For. Ecol. Manag. 1992, 54, 257–287. [Google Scholar] [CrossRef] [Green Version]
- Sharma, M.; Parton, J. Modelling effects of climate on site productivity of white pine plantations. Can. J. For. Res. 2019, 49, 1289–1297. [Google Scholar] [CrossRef]
- Nigh, G. The geometric mean regression line: A method for developing site index conversion equations for species in mixed stands. For. Sci. 1995, 41, 84–98. [Google Scholar] [CrossRef]
- Forrester, D.I.; Kohnle, U.; Albrecht, A.T.; Bauhus, J. Complementarity in mixed-species stands of Abies alba and Picea abies varies with climate, site quality, and stand density. For. Ecol. Manag. 2013, 304, 233–242. [Google Scholar] [CrossRef]
- Pretzsch, H.; Schütze, G. Tree species mixing can increase stand productivity, density and growth efficiency and attenuate the trade-off between density and growth throughout the whole rotation. Ann. Bot. 2021, 128, 767–786. [Google Scholar] [CrossRef]
- Thurm, E.A.; Pretzsch, H. Improved productivity and modified tree morphology of mixed versus pure stands of European beech (Fagus sylvatica) and Douglas-fir (Pseudotsuga menziesii) with increasing precipitation and age. Ann. For. Sci. 2016, 73, 1047–1061. [Google Scholar] [CrossRef] [Green Version]
- Carmean, W.H.; Hahn, J.T. Site comparisons for upland oaks and yellow popular in the central States. J. For. 1983, 81, 7361–7739. [Google Scholar]
- Carmean, W.H.; Hahn, J.T.; McRoberts, R.E.; Kaisershot, D. Site Index Comparisons for Forest Species in the Upper Great Lakes Area of the United States and Canada; Gen. Tech. Rep. NRS-113; US Department of Agriculture, Forest Service, Northern Research Station: Newtown Square, PA, USA, 2013; 39p.
- Sharma, M.; Subedi, N.; TerMikaelian, M.; Parton, J. Modeling climatic effects on stand height/site index of plantation-grown jack pine and black spruce trees. For. Sci. 2015, 61, 25–34. [Google Scholar] [CrossRef] [Green Version]
- Sharma, M.; Parton, J. Analyzing and modelling effects of climate on site productivity of white spruce plantations. For. Chron. 2018, 93, 173–182. [Google Scholar] [CrossRef]
- Sharma, M.; Parton, J. Climatic effects on site productivity of red pine plantations. For. Sci. 2018, 64, 544–554. [Google Scholar] [CrossRef]
- Sharma, M. Climate effects on jack pine and black spruce productivity in natural origin mixed stands and site index conversion equations. Trees For. People 2021, 5, 100089. [Google Scholar] [CrossRef]
- Subedi, N.; Sharma, M. Evaluating height-age determination methods for jack pine and black spruce plantations using stem analysis data. North. J. Appl. For. 2010, 27, 50–55. [Google Scholar] [CrossRef] [Green Version]
- Graves, H.S. Forest Mensuration; John Wiley & Sons: New York, NY, USA, 1906; 458p. [Google Scholar]
- McKenney, D.W.; Hutchinson, M.F.; Papadopol, P. Customized spatial climate models for North America. Bull. Am. Meteorol. Soc. 2011, 92, 1161–1622. [Google Scholar] [CrossRef]
- Mekis, É.; Vincent, L.A. An overview of the second generation adjusted daily precipitation dataset for trend analysis in Canada. Atmos. Ocean 2011, 49, 163–177. [Google Scholar] [CrossRef] [Green Version]
- Vincent, L.A.; Wang, X.L.; Milewska, E.J.; Wan, H.; Yang, F.; Swail, V. A second generation of homogenized Canadian monthly surface air temperature for climate trend analysis. J. Geophys. Res. Atmosph. 2012, 117, D18110. [Google Scholar] [CrossRef]
- Cieszewski, C.J. Developing a well-behaved dynamic site equation using a modified Hossfeld IV function Y3 = (axm)/(c + xm−1), A simplified mixed-model and scant subalpine fir data. For. Sci. 2003, 49, 5391–5554. [Google Scholar]
- Burkhart, H.E.; Tennent, R.B. Site index equations of Radiata pine in New Zealand. N. Z. J. For. Sci. 1977, 7, 408–416. [Google Scholar]
- Carmean, W.H.; Lenthall, D.J. Height growth and site index curve for jack pine in north central Ontario. Can. J. For. Res. 1989, 19, 2151–2224. [Google Scholar] [CrossRef]
- Goelz, J.C.G.; Burk, T.E. Development of well-behaved site index equations: Jack pine in north central Ontario. Can. J. For. Res. 1992, 22, 776–784. [Google Scholar] [CrossRef]
- Garcia, O. Comparing and combining stem analysis data and permanent sample plot data in site index models. For. Sci. 2005, 51, 277–283. [Google Scholar]
- Diéguez-Aranda, U.; Burkhart, H.E.; Rodríguez-Soalleiro, R. Modeling dominant height growth of radiata pine (Pinus radiata D. Don) plantations in North-Western Spain. For. Ecol. Manag. 2005, 215, 271–284. [Google Scholar] [CrossRef]
- Burkhart, H.E.; Tome, M. Modeling Forest Trees and Stands; Springer: New York, USA, 2012; 457p. [Google Scholar]
- Pinheiro, J.C.; Bates, D.M. Mixed-Effects Models in S and S-PLUS; Springer: New York, NY, USA, 2000; 528p. [Google Scholar]
- Akaike, H. A Bayesian analysis of the minimum AIC procedure. Ann. Inst. Stat. Math. 1978, 30, 9–14. [Google Scholar] [CrossRef]
- Diéguez-Aranda, U.; Burkhart, H.E.; Amateis, R.L. Dynamic site model for loblolly pine (Pinus taeda L.) plantations in the United States. For. Sci. 2006, 52, 262–272. [Google Scholar]
- Subedi, N.; Sharma, M. Climate-diameter growth relationships of black spruce and jack pine trees in boreal Ontario, Canada. Glob. Chang. Biol. 2013, 19, 505–516. [Google Scholar] [CrossRef]
- SAS Institute. SAS Institute Inc.: Cary, NC, USA, 2008. Available online: https://www.sas.com/en_us/home.html (accessed on 20 January 2022).
- Sharma, M.; Reid, D. Stand height/site index equations for jack pine and black spruce trees grown in natural stands. For. Sci. 2018, 64, 33–40. [Google Scholar] [CrossRef]
- Clutter, J.L.; Fortson, J.C.; Pienaar, L.V.; Brister, G.H.; Bailey, R.L. Timber Management: A Quantitative Approach; Krieger Publishing Company: Malabar, FL, USA, 1983; 333p. [Google Scholar]
- Amoroso, M.M.; Turnblom, E.C. Comparing the productivity of pure and mixed Douglas-fir and western hemlock plantations in the Pacific Northwest. Can. J. For. Res. 2006, 36, 1484–1496. [Google Scholar] [CrossRef]
- Pretzsch, H.; Block, J.; Dieler, J.; Dong, P.H.; Kohnle, U.; Nagel, J.; Mann, H.S.; Zing, A. Comparison between the productivity of pure and mixed stands of Norway spruce and European beech along an ecological gradient. Ann. For. Sci. 2010, 67, 712. [Google Scholar] [CrossRef] [Green Version]
- Mason, W.L.; Connolly, T. Mixtures with spruce species can be more productive than monocultures, as evidenced by the Gisburn experiment in Britain. Forestry 2014, 87, 209–217. [Google Scholar] [CrossRef] [Green Version]
Publisher’s Note: MDPI stays neutral with regard to jurisdictional claims in published maps and institutional affiliations. |
© 2022 by the author. Licensee MDPI, Basel, Switzerland. This article is an open access article distributed under the terms and conditions of the Creative Commons Attribution (CC BY) license (https://creativecommons.org/licenses/by/4.0/).