Abstract
We analyzed the tree-rings δ18O of Abies spectabilis (fir) growing at the subalpine treeline ecotone in the Magguchatti valley. The valley is located in the Indian summer monsoon (ISM) dominated region of western Himalaya and also receives snow precipitation derived by westerly disturbances (WDs) during the winter months. The 60 year developed (1960–2019 CE) tree-ring δ18O chronology revealed a strong positive correlation with the temperature of late winter and spring months (February to April). Strong negative correlations are also apparent for snowcover, soilmoisture, and relative humidity for the same spring season. Our findings partly contrast the significant correlation results of tree-ring δ18O with summer precipitation and drought indices recorded from other summer monsoon-dominated regions in the Himalayas. The spatial correlation analyses with sea surface temperatures (SSTs) and climate parameters showed subdued signals of tropical Pacific at the site, but with a shift to more moisture influx from the Arabian Sea during the last two decades. Moreover, a significant negative correlation with North Atlantic Oscillation further justifies the strongly captured spring temperature and snowcover signals and the weak effect of summer precipitation in fir trees. A temperature rising trend during the latter half of the 20th century and the elevation effect are taken as important factors controlling the moisture source at the treeline ecotone zones.
1. Introduction
The Himalayan region, integrated under different domains of the Asian monsoon system [1,2], is climatically highly dynamic. The region is therefore unique in providing information on the thermal, hydrological, and ecological variability of global relevance. Regional differences in precipitation [3,4], temperature [5], and atmospheric circulation [6] across the Himalayan region can be unraveled by establishing relationships between different local climate proxy records and climate variables. However, to assess the dynamics of climate variables on a centennial scale, available instrumental meteorological records are too short and have spatial coverage limitations. Among the archives for retrieving annual to decadal resolved past climatic information for the region, tree-rings are one of the most intensively used climate archives. Plant physiology and tree growth are critically modulated by changes in temperature and moisture availability, which are well reflected in tree-ring chronologies of many conifers and broadleaved species [7,8]. The global average increase in temperature of around 1.5 °C during the last century is coupled with a subsequent increase in the intensity and duration of heatwaves [9]. The increasing temperature trends are even greater at higher altitudes than in the lowlands [10]. Over the western Indian Himalayas, an average increase of 0.9 °C was observed during the 20th century, much of which occurred after 1972 C.E. [10,11]. The elevation-dependent warming could severely impact the ecology, physiology, and growth processes of plants. This includes the treeline advancement [12,13,14] and adverse effects on tree growth even in the treeline ecotone by warming-induced pre-monsoon drought conditions [14,15,16]. Available reconstructions of past climate conditions using tree-ring width chronologies [17,18,19,20,21] explain long-term trends of tree growth behavior and its relation to climate. However, the strength and seasonality of the climate-tree-ring width relationships vary in different regions depending on local hydroclimate, topography, as well as in species-specific sensitivity [22].
In the Himalayan region, the primary source of moisture is summer (June–September) precipitation delivered by the Indian summer monsoon (ISM) system [23]. Westerly disturbances (WDs) are the dominant factor bringing winter (December to February) precipitation to the northern and northwestern parts of the Himalayas. The WDs also influence the southern parts of the Indian Himalayan zones. The upper temperate and subalpine altitudes of the Central and Western Himalayas exhibit a complex climatological interplay by receiving rains during the ISM season and from winter snow through WDs [24,25]. Published tree-ring width chronologies from such altitudes have proven that temperature limits the tree growth [17,20,22,26,27], the temperatures of winter [17,22], and spring [26,27] seasons being more critical. Also, there are variabilities regarding the sensitivity of trees to moisture, where the tree-ring width chronologies were found to be sensitive to precipitation [18,19,28] and various drought indices [21,29,30] for the early spring to summer monsoon months. During the summer monsoon, the moisture source of precipitation in the region is derived from both the Bay of Bengal and the Arabian Sea branches of the ISM [31]. Additional to ISM and WD precipitation events, the Himalayan region is also influenced by local orographic rains [28]. Therefore, it remains a challenge to discover the primary climatic control on tree-ring development and understand the intricacies of the interplay between ISM and WD influencing tree growth. The oxygen isotope ratio of tree-ring cellulose (δ18OTRC) is an increasingly used parameter in paleoclimate research. δ18OTRC variations are closely related to hydroclimatic conditions and better retrieve low-frequency climatic variations compared to tree-ring width [32,33,34]. δ18O variations in tree-ring cellulose are strongly influenced by a range of factors affecting the isotopic fractionation of 18O at the leaf level, including temperature [35], precipitation [33,36], relative humidity [37,38], and cloud cover [39]. Soil water is the primary source of water uptake by plants during the growing season, remaining a critical component in determining the water isotope in plants [40]. In turn, soil water is influenced by the isotopic composition of precipitation, while the temperature may lead to isotopic fractionation in the soil by evaporation [35,41]. Within trees, the 18O fractionation is controlled by the vapor pressure deficit and stomatal conductance that control the rate of transpiration and leaf water enrichment [42,43].
Interestingly, available δ18OTRC records from sites located within the different precipitation regimes of the Himalayas have shown variations in their response to climate variables. The δ18OTRC from ISM dominated Himalayan sites viz. Bhutan [44], Nepal [33,45], and the central-western parts of the Indian Himalaya [33,46] are demonstrably suitable proxies to capture variations of summer precipitation and of drought indices like the Palmer Drought Severity Index (PDSI), the Standardized Precipitation Index (SPI), and the Standardized Precipitation Evapotranspiration Index (SPEI). The δ18OTRC from the ISM dominant regions of western and central Himalayas [33,45,46] more readily captured the signals of summer precipitation and drought. Regions in the east, such as Bhutan [44] and eastern Tibet [36,38], showed sensitivity to summer precipitation and relative humidity. However, Huang et al. [41] reported temperature signals incorporated in the δ18OTRC variability of juniper species from the WD-dominated northern-western slope of the Himalayas on the southern part of the Tibetan plateau. A recently analyzed tree-ring latewood oxygen isotope (δ18OLW) chronology from Bagrot valley in the northern Karakoram of Pakistan [47] also highlighted the winter to spring temperature signals by δ18OLW at low frequencies. These displayed regional differences in recorded climate signals between tree-ring δ18O records can partly be explained by the “amount effect” that is effective during the summer monsoon phase with high precipitation rates. In the ISM dominant regions, the summer monsoon precipitation leads to a depletion in the heavy isotopes by rain-out processes, while isotope fractionation in westerly derived precipitation is largely influenced by temperature effects [41,48]. Contrastingly, a study by Managave et al. [49] from the WD influenced region of Lahaul-Spiti in the western Himalayas showed a significant response of δ18OTRC winter precipitation (previous year October to current year March) and to the self-calibrated Palmer Drought Severity Index (scPDSI) for the growing season (previous year October to current year September). Relations to the precipitation for the same growing season were also detected for northern Pakistan [50]. These studies underline the difference in the δ18OTRC response to climatic variables and raise questions concerning the role of regional climate, topography, and species sensitivity to local environmental factors in the 18O enrichment in plants. It is therefore of the highest interest to fill the existing spatial gaps between study sites in different climatic zones. This will allow us to better understand regional discrepancies in the response of tree-ring δ18O with climate variables over the Himalayan region.
Abies spectabilis, a conifer species of the cool-moist elevation belts, forms the upper conifer limit in most of the valleys of the western and central Himalayas [10,51,52]. In addition to the dendrochronological suitability of Abies for climate reconstruction [10,53,54], this species strongly captures hydroclimate signals in its δ18O variations [45,46,55]. We observed spatial variability in the sensitivity of δ18OTRC to hydroclimate and an existing geographical void in the Himalayan region due to the minimal number of tree-ring δ18O records, shown in Figure 1. We therefore established a novel tree-ring δ18O chronology of Abies spectabilis spanning the past 60 years. Our study aims (1) to assess the potential of δ18OTRC in capturing the signals of different climate variables from the subalpine belt of an ISM and WD influenced region in the western Himalaya, (2) to understand the role of climatic variables and processes involved in regulating the δ18O in the fir trees growing at subalpine treeline ecotones, and (3) to assess the regional coherence of climatic signals by comparing our findings with the results from other δ18OTRC records across the Himalayas.
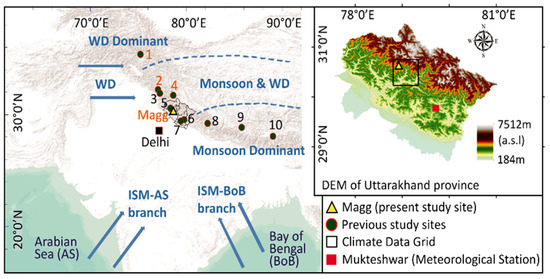
Figure 1.
Location of the present study site and the sites of previous δ18O studies from the Indian Himalayas and adjacent regions. (1) Karakoram Pakistan [47]. (2) Keylong, Lahaul-Spiti [49]. (3) Manali, HP [33]. (4) Zhada, Tibet [41]. (5) Din Gad Valley, Uttarakhand [46]. (6) Mukteshwar (meteorological station), Uttarakhand. (7) Jageshwar, Uttarakhand [33]. (8) Jumla, Nepal [45]. (9) Ganesh, Nepal [33]. (10) Bhutan [44]. Sites with orange numbers (1,2,4) and Magg captured temperature and moisture signals for winter-spring months. Sites with black numbers captured moisture signals for summer monsoon months. Monsoon boundaries (ISM = Indian Summer Monsoon; WD = Westerly Disturbance) in blue dashed lines after Huang et al. [41].
2. Materials and Methods
2.1. Study Area and Vegetation
Our study site is located in the Magguchatti area (30°37′–30°38′ N and 78°55′–78°58′ E), a part of the Kedarnath Wildlife Sanctuary in the Garhwal region of Uttarakhand, Western Himalaya (Figure 1). The site is 9 km ENE from the nearest road to the Triyuginarayan settlement area. The study region covers an elevation gradient from ~2400 to ~3700 m a.s.l. Abies is the dominant regional conifer species growing in association with broadleaf taxa, namely Alnus nepalensis, Aesculus indica, Betula alnoides, B. utilis, Juglans regia, Quercus leucotrichophora, Q. semecarpifolia, Rhododendron arboretum, R. campanulatum, and Sorbus foliolosa. Abies pindrow trees are growing up to 3000 m a.s.l, above which they are replaced by Abies spectabilis (Figure 2). Fir trees grow on slopes with thin soil cover originating from the weathering of gneissic and quartzitic rock types. The valley is anthropogenically overprinted by road constructions and permanent settlements up to an elevation of ~2400 m a.s.l. Areas above 2400 m a.s.l. are characterized by temporary summer settlements with grazing activities in the subalpine open forest zone and alpine meadow area.
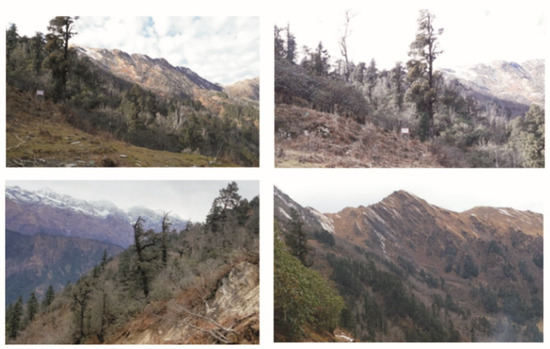
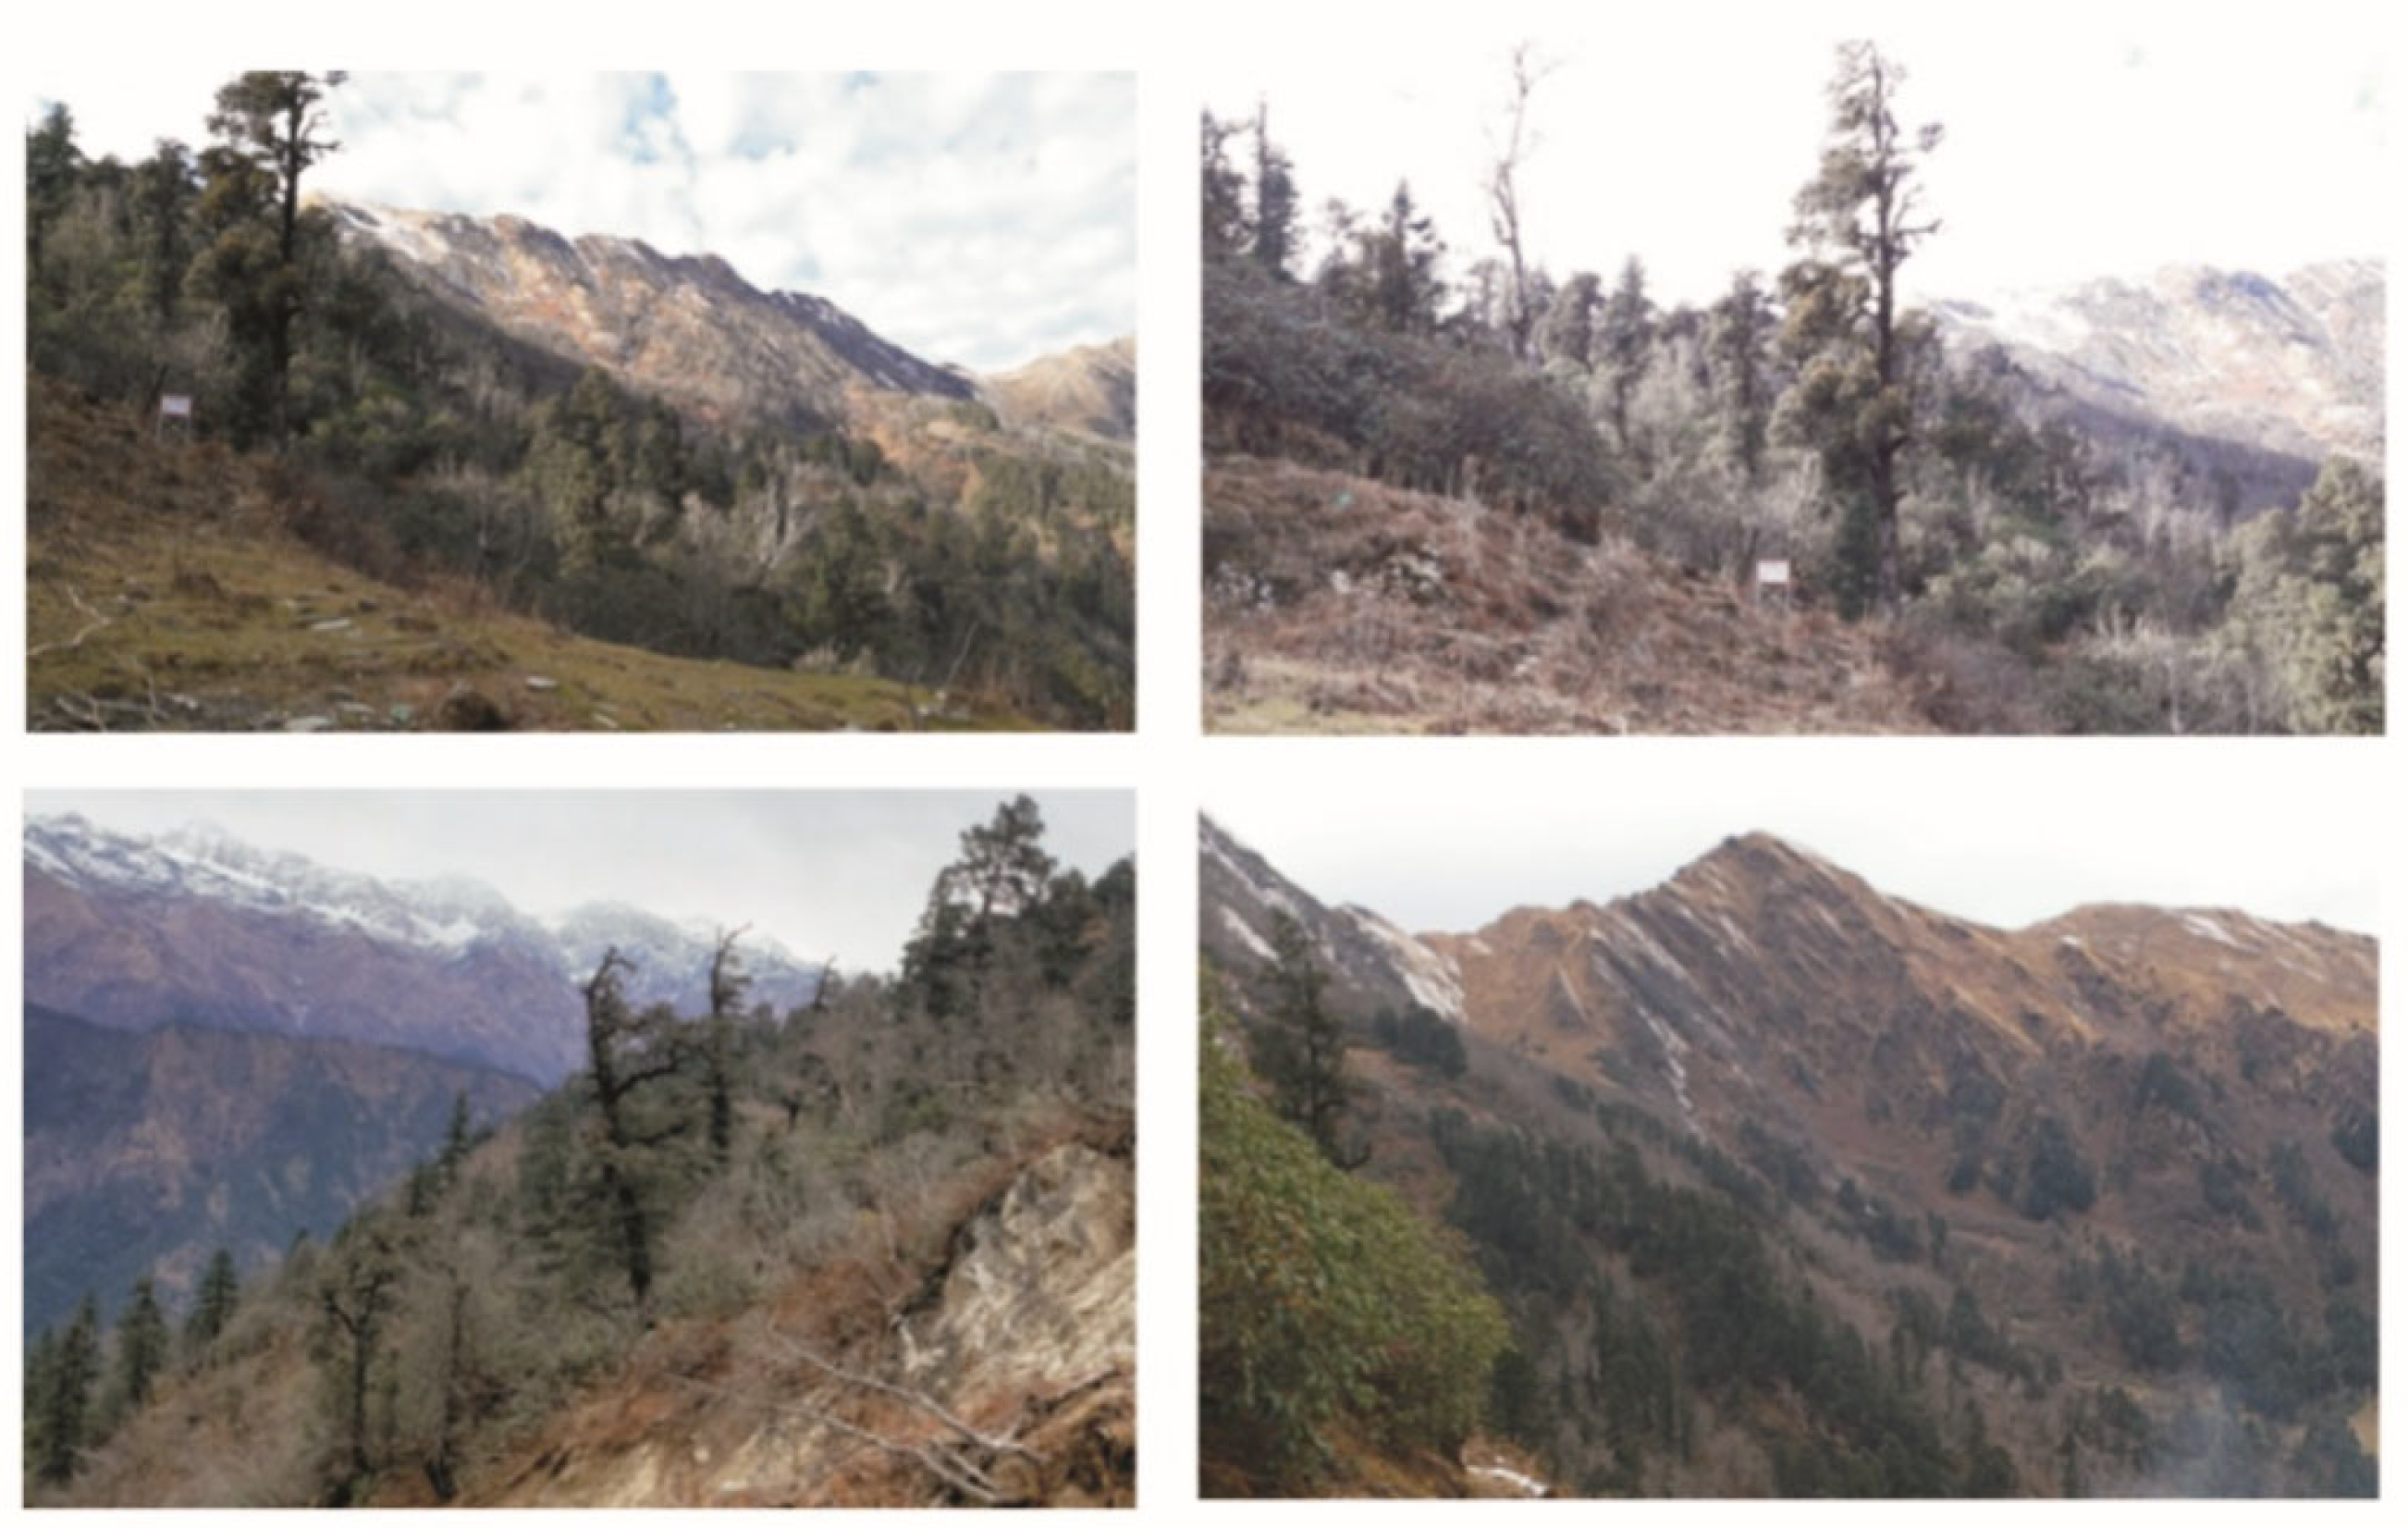
Figure 2.
Vegetation distribution at the study site Magguchatti, near Triyuginarayan, Kedarnath in the Uttarakhand region, western Himalaya.
2.2. Tree-Ring Sampling and δ18O Chronology Development
Sampling was carried out during November 2019. Two cores per tree were collected at breast height using an increment borer (Haglöf, Sweden) in the direction perpendicular to the slope. The obtained cores were processed with different grades of sandpaper for a clear demarcation of annual growth ring boundaries.The annual rings of each core were counted and measured for their ring-width with an accuracy of 0.01 mm using a LINTAB 6 (Rinntech™) measuring system. Cross-dating was performed using the TSAP software [56], and each ring was cross-dated and assigned a calendar year of formation. A ring-width chronology was developed using the package dplR in the open-source statistical language/software R v.4.1.2 [57]. Tree-ring cores of five trees aged respectively between around 151–272 years were selected for stable isotope analyses based on the criteria of (1) avoidance of missing rings and reaction wood, (2) sufficient amounts of wood material and regular visibility of annual ring boundaries, (3) showing high inter-series correlation and sign test (GLK; Gleichläufigkeit) with the master tree-ring width chronology, and (4) selection of older trees to avoid possible juvenile effects in the isotope records. From each core, the tree-rings of the common period from 1960 to 2019 CE were subsequently separated under a binocular microscope with a thin razor blade, and each separated annual ring was individually processed in a separate vial following standard laboratory procedures for α-cellulose extraction [58]. Final cellulose samples were homogenized, followed by freeze-drying [37]. Approximately 0.300 mg aliquots of α-cellulose were wrapped into silver foil capsules, which were loaded in a Delta V Advantage Isotope Ratio Mass Spectrometer (Thermo Fischer Scientific Inc., Waltham, MA, USA) coupled to a HEKAtech pyrolysis reactor to determine the 18O/16O ratio of tree-ring cellulose. Each measurement was calibrated against internal and international laboratory standards (International Atomic Energy Agency: IAEA-601/602 standards), resulting in a maximum standard deviation of 0.2‰. The notation for the δ18OTRC was specified according to the international Vienna Standard Mean Ocean Water (VSMOW) standard. The liability of the final isotope chronology composed of the isotope series of five individual trees was tested with various statistical methods such as mean inter-series correlation (Rbar), Expressed Population Signal (EPS), and Subsample Signal Strength (SSS) [59,60] shown in Table 1.

Table 1.
Statistics of the mean tree-ring δ18O chronology of Abies spectabilis from Magguchatti, Kedarnath, Uttarakhand.
2.3. Regional Climate Station Data and Correlation Development with Tree-Ring δ18O
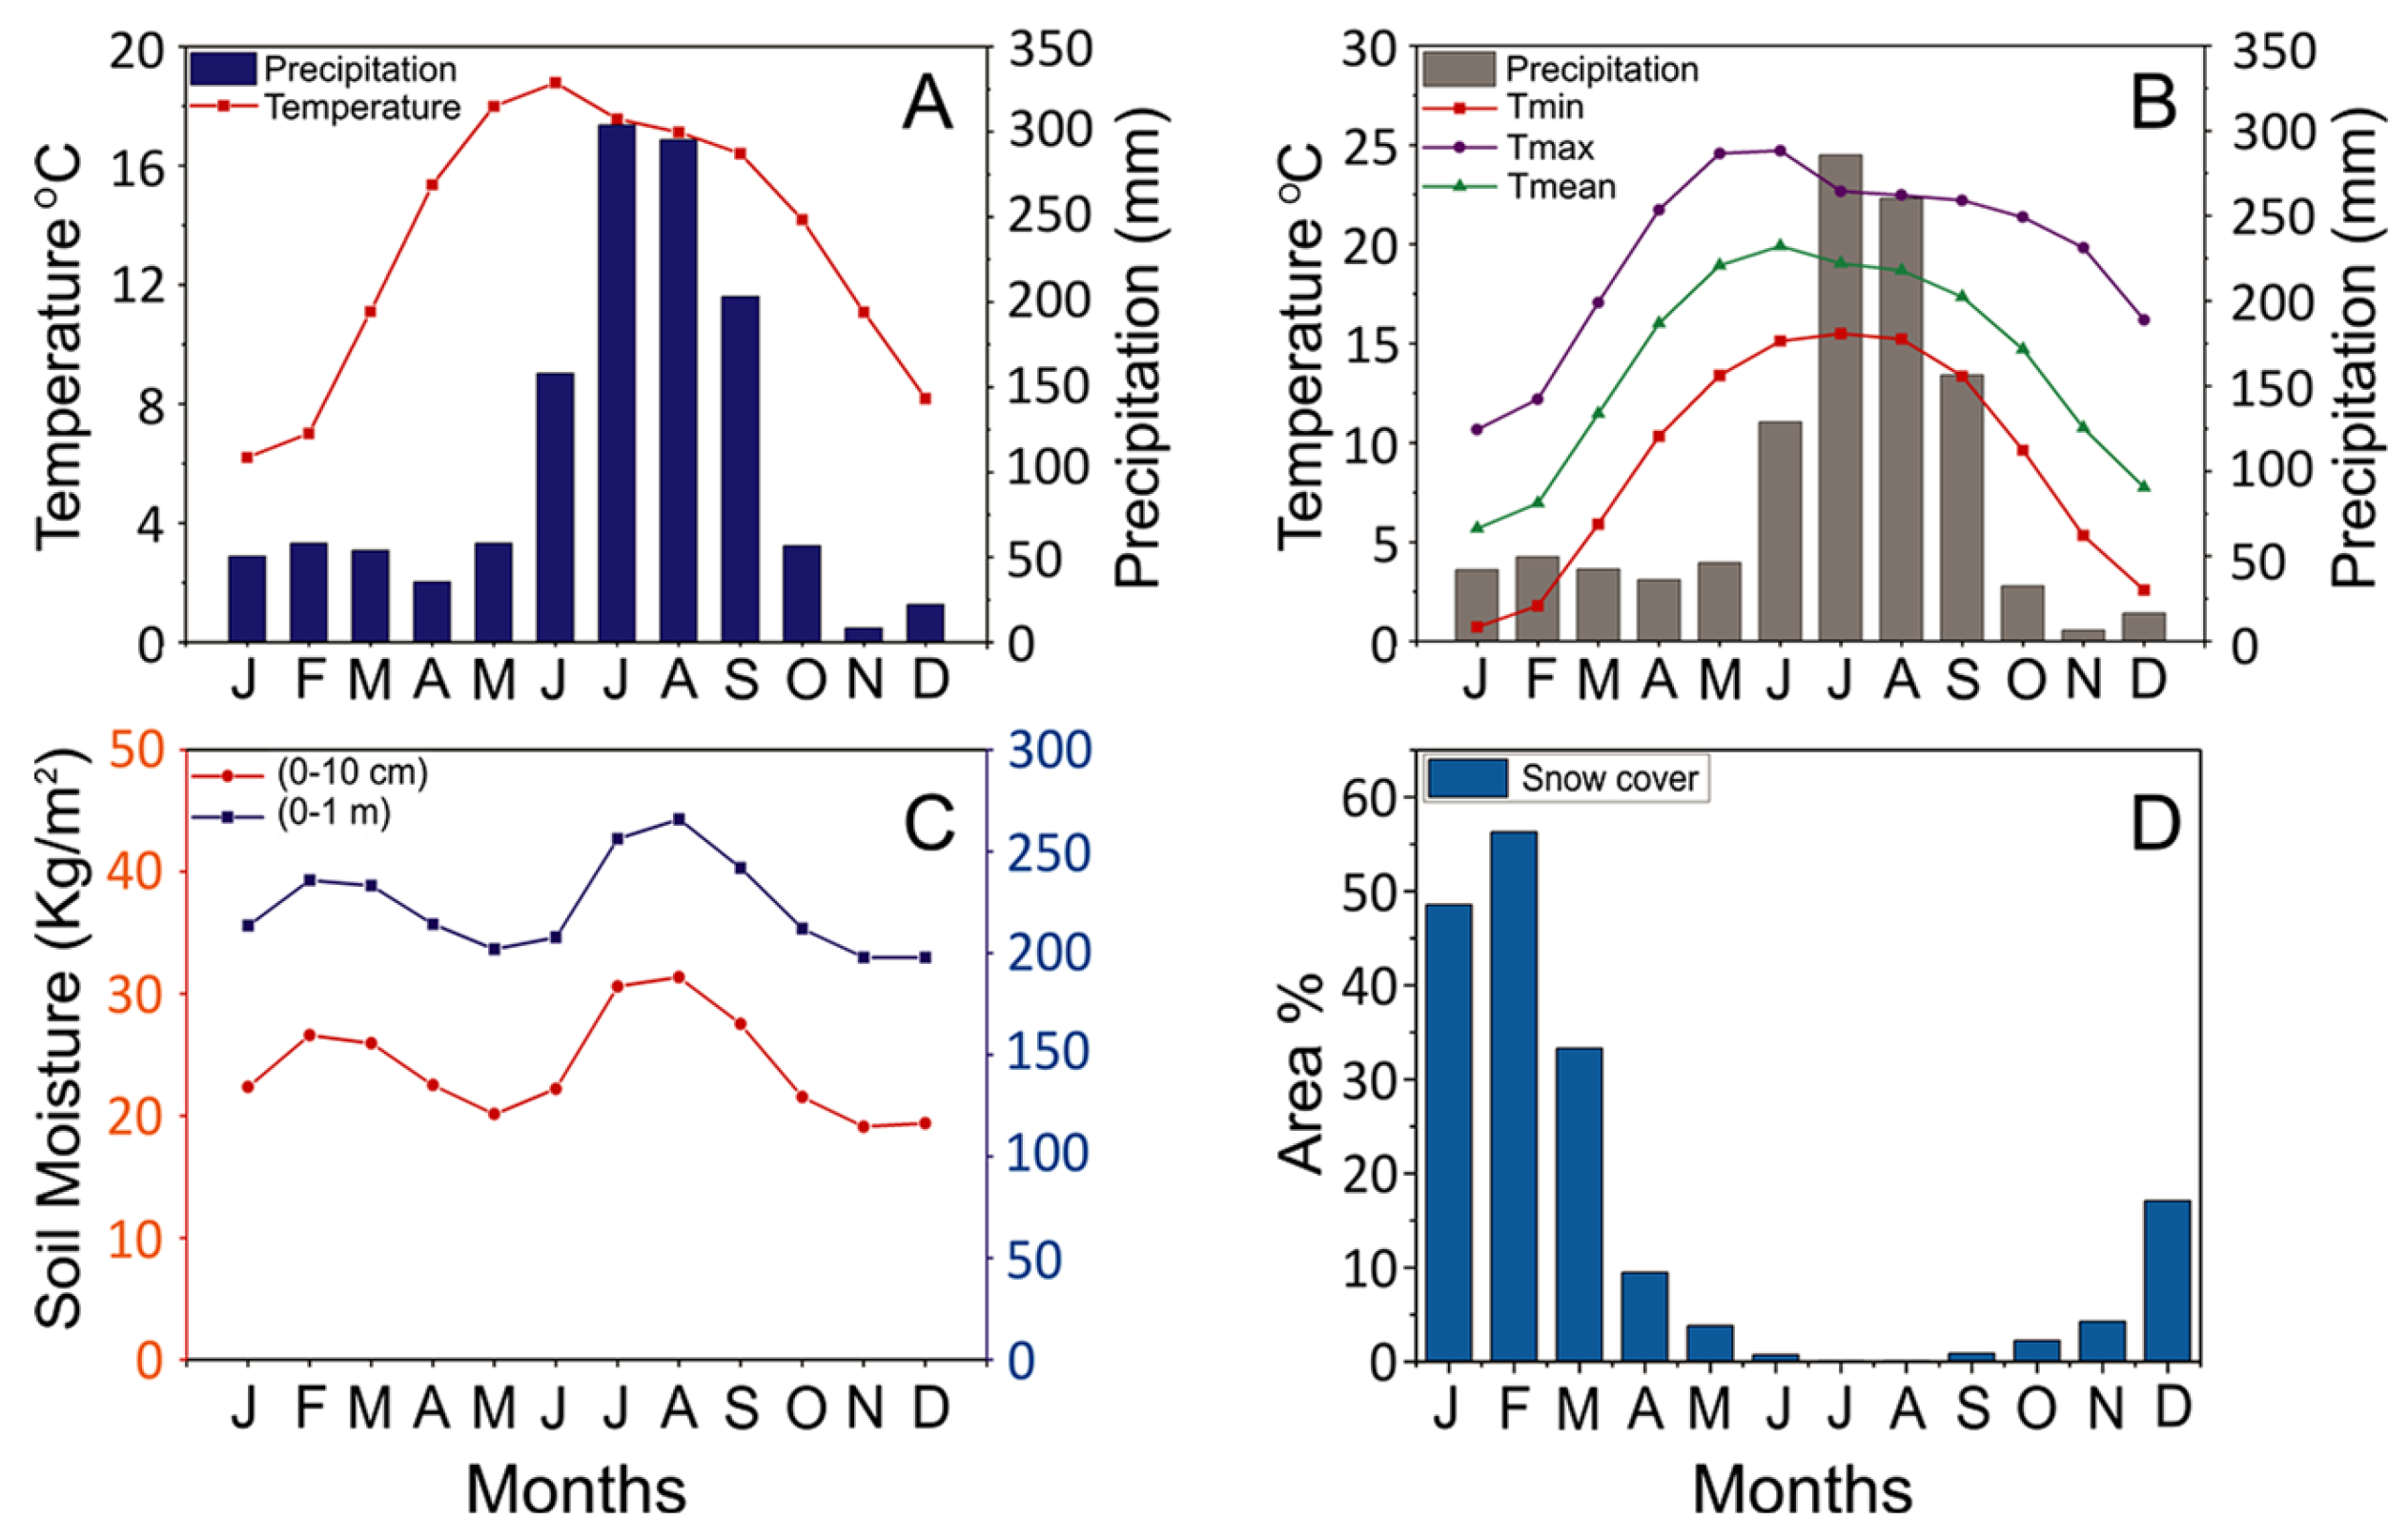
Available multidecadal meteorological records are minimal for the Himalayan region and practically absent for the subalpine and alpine altitudes. During the three years from 2008 to 2010 CE, automated weather stations (AWS) recorded a mean annual temperature (MAT) of 10.7 °C and 5.6 °C at temperate (~2500 m a.s.l) and subalpine (~3300 m a.s.l) altitudes in the adjacent Tungnath valley [61]. The warmest month in the subalpine belt was July, with a mean temperature of 12.56 ± 1.23 °C, and the coldest month was January with a mean of ~3 °C. Annual precipitation ranged between 2400 and 3000 mm, of which 89.5% was during the main ISM season from June to September. The nearest meteorological station with a centennial long (since around 1897 CE) temperature and precipitation records is Mukteshwar (~2000 m a.s.l), 140 km SE to our study site (Figure 1). However, its monthly resolution record contains 4.5% missing values in temperature and 5.2% in precipitation [27]. To evaluate reliable climate-proxy relationships between our δ18OTRC chronology and climate, we retrieved gridded climate data from different sources. Temperature and precipitation were retrieved through CRU TS v. 4.04; (0.5° × 0.5° grid, Climatic Research Unit, University of East Anglia, Norwich, UK) for the period from 1960–2019 CE [62]. Relative humidity data were retrieved from the Modern-Era Retrospective Analysis for Research and Applications (MERRA-2 reanalysis data, 0.5° × 0.5° grid [63]. For the soil-moisture data (0–10 cm and 0–1 m depths), the source ERA-Interim (0.5° × 0.5° grid) available for 1979–2016 CE were retrieved. The grid cell of the data sources are marked in Figure 1, and the monthly datasets of all climatic variables are shown in Figure 3. Furthermore, Homogenous Rainfall (HR) data for the northwest subdivision of India, available for the years 1871–2014 CE by the Indian Institute of Tropical Meteorology (IITM), Pune, India, was downloaded from KNMI climate explorer (http://climexp.knmi.nl/, accessed on 23 July 2021. The climate datasets are shown in Figure 3 and Figure S1. A regional MAT is around 10.5 °C, with the highest monthly mean temperature ranging between 18 and 20 °C in June and the lowest mean temperature of the year range between 5 and 6 °C in January. Mean annual precipitation (MAP) ranges between 1200 to 1500 mm. More than 70% of MAP is in the ISM season of June to September (JJAS), while only 25% to 30% of the annual rainfall occurs in the other months. During the winter months, the upper temperate, subalpine, and alpine zones receive precipitation in the form of snow due to westerly influence. Remotely sensed annual climatological cycles of snow water equivalent (SWE) from the National Snow and Ice Data Centre (NSIDC) suggest that snowfall starts in the region in October/November and continues till March [64]. According to Adhikari et al. [61], snowcover lasts for 85 ± 22.7 days yr−1 during the winter months at the higher reaches of our study region. We also compared the snowcover data (0.1° × 0.1° ERA5 data using Google Earth Engine (GEE) [65,66] for the period from 1981–2019 CE with our δ18OTRC series.

Figure 3.
Mean monthly climate (temperature and precipitation) conditions of (A) Mukteshwar meteorological station (1960–2019 CE), (B) CRU-TS gridded data (1960–2019 CE). Mean monthly conditions of (C) soil moisture (ERA-Interim 1979–2016 CE) and (D) snow cover (ERA5; 1981–2019 CE).
2.4. Establishing Correlations with Climate Variables and Oceanic Circulations
To examine the climate responses of our δ18OTRC series to environmental factors, we performed cross-correlation analysis between δ18OTRC and monthly datasets of climate (temperature, precipitation, relative humidity), soil-moisture, and snowcover by using DENDROCLIM 2002 software [67]. We analyzed a 12-month growth window starting from October (pOct) of the previous year to September (Sept) of the current year during the period 1960–2019 CE. We also compared the δ18OTRC series with the climate variables for the common period by scaling spring month (FMA) averaged datasets of temperature, soil moisture, relative humidity, snowcover, and monsoon month (JJA) average homogenous rainfall (HR) data, using the Z-standardization method. The NINO3.4 indices which is the average sea surface temperature anomaly across the pacific ocean with extents (5N–5S, 120W–170W) [68], and the North Atlantic oscillations NAO [69] indices, are also matched with our δ18OTRC series and climate datasets.
To meet our objective of assessing the influence of regional-scale climate variations on the trees of our study area, spatial correlations of δ18OTRC chronology were computed with global sea surface temperature (SSTs) from the HadISST1° reconstruction dataset [70] and with other climate variables SPEI-04 drought index (CSIC), temperature and vapor pressure (0.5° × 0.5° grid, CRU TS.4.04 [62]) using KNMI climate explorer (http://climexp.knmi.nl/, accessed on 23 July 2021. The influence of the El-Nino Southern Oscillation (ENSO) on the western Himalayan region was non-significant during the latter half of the 20th century [44,71]. The spatial correlation analyses performed for the period 1960 to 2019 CE were therefore divided into decadal intervals to evaluate the short-term influences of SST changes on the local climate.
3. Results
3.1. Statistics of the δ18OTRC Chronology
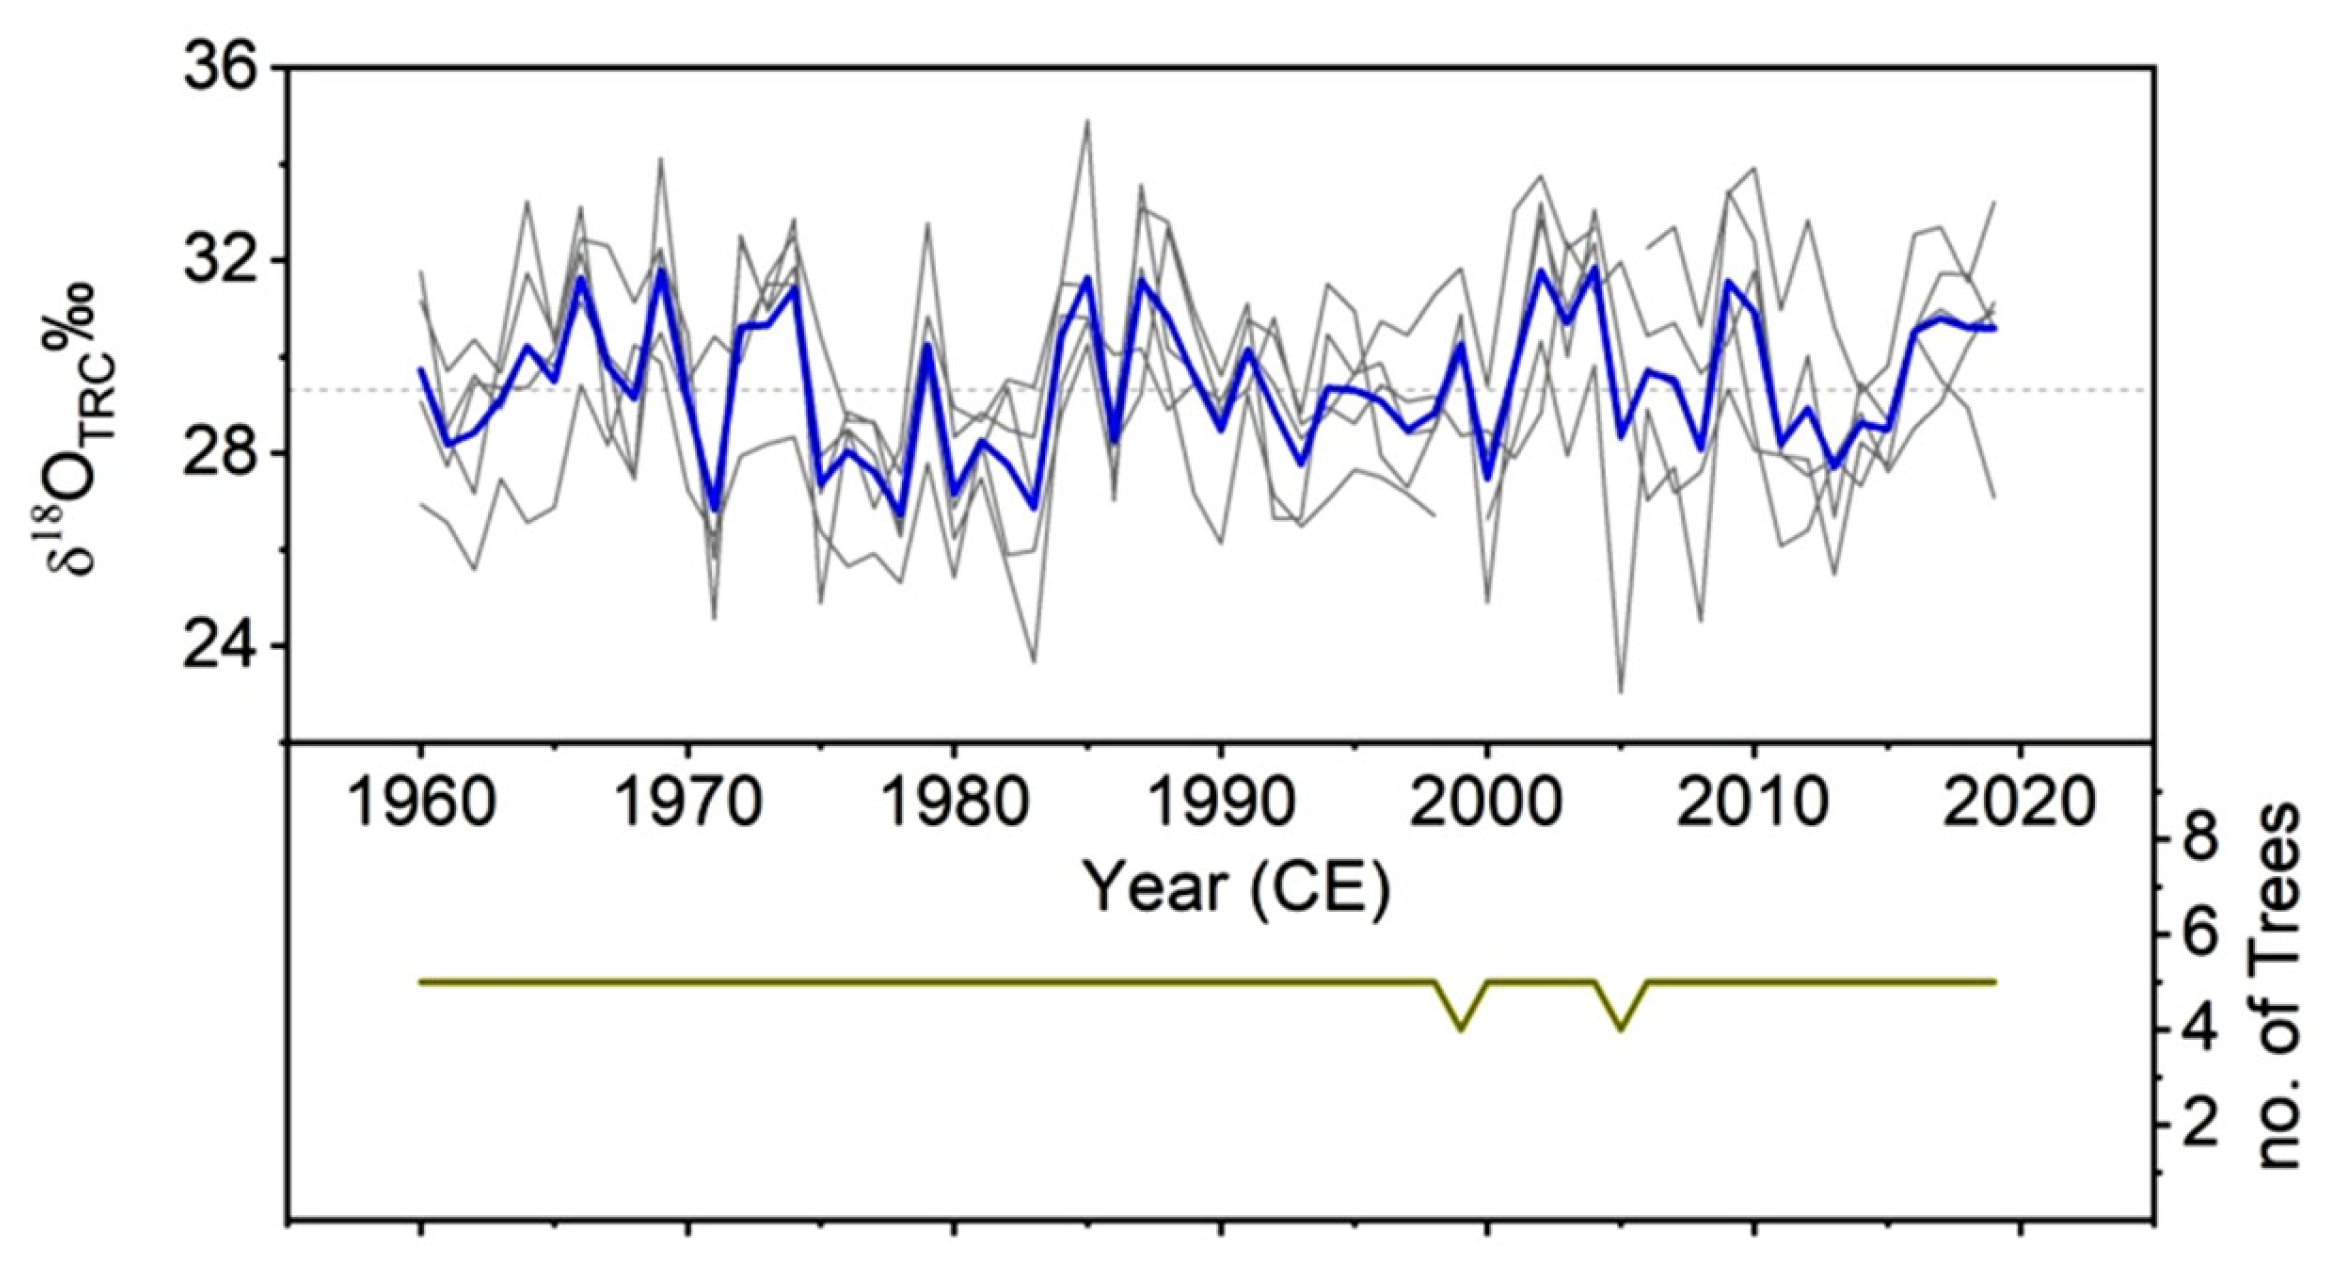
The individual δ18OTRC series of the five analyzed trees (Figure 4) revealed a significant inter-series correlation for their common period of 60 years (Rbar = 0.541; 1960–2019 CE). The EPS of 0.853 indicated strong common forcing by environmental factors. Also, the SSS of 0.998 is a statistical parameter for evaluating the dendrochronological value of a lesser number of chronologies through standardization [59,60]. The mean isotope values of five fir trees showed a variation of 5.22‰, ranging from 26.42‰ to 31.64‰, with a mean of 29.3‰ (Figure 3). See also Table 1 for the chronology statistics.
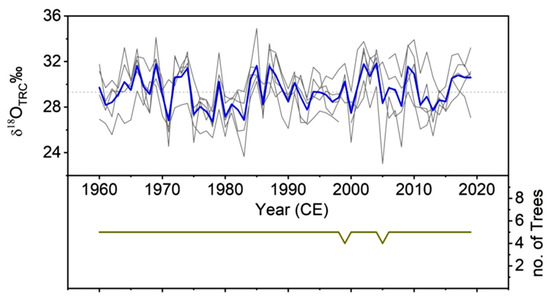
Figure 4.
The 60 years (1960–2019 CE) mean tree-ring δ18O chronology (blue line) of five trees (in the grey background) and the overall mean value of the tree-ring δ18O chronology (horizontal grey dotted line) and the number of trees included in the chronology are presented in the lower panel.
3.2. Correlations with Climate Variables and Climatic Indices
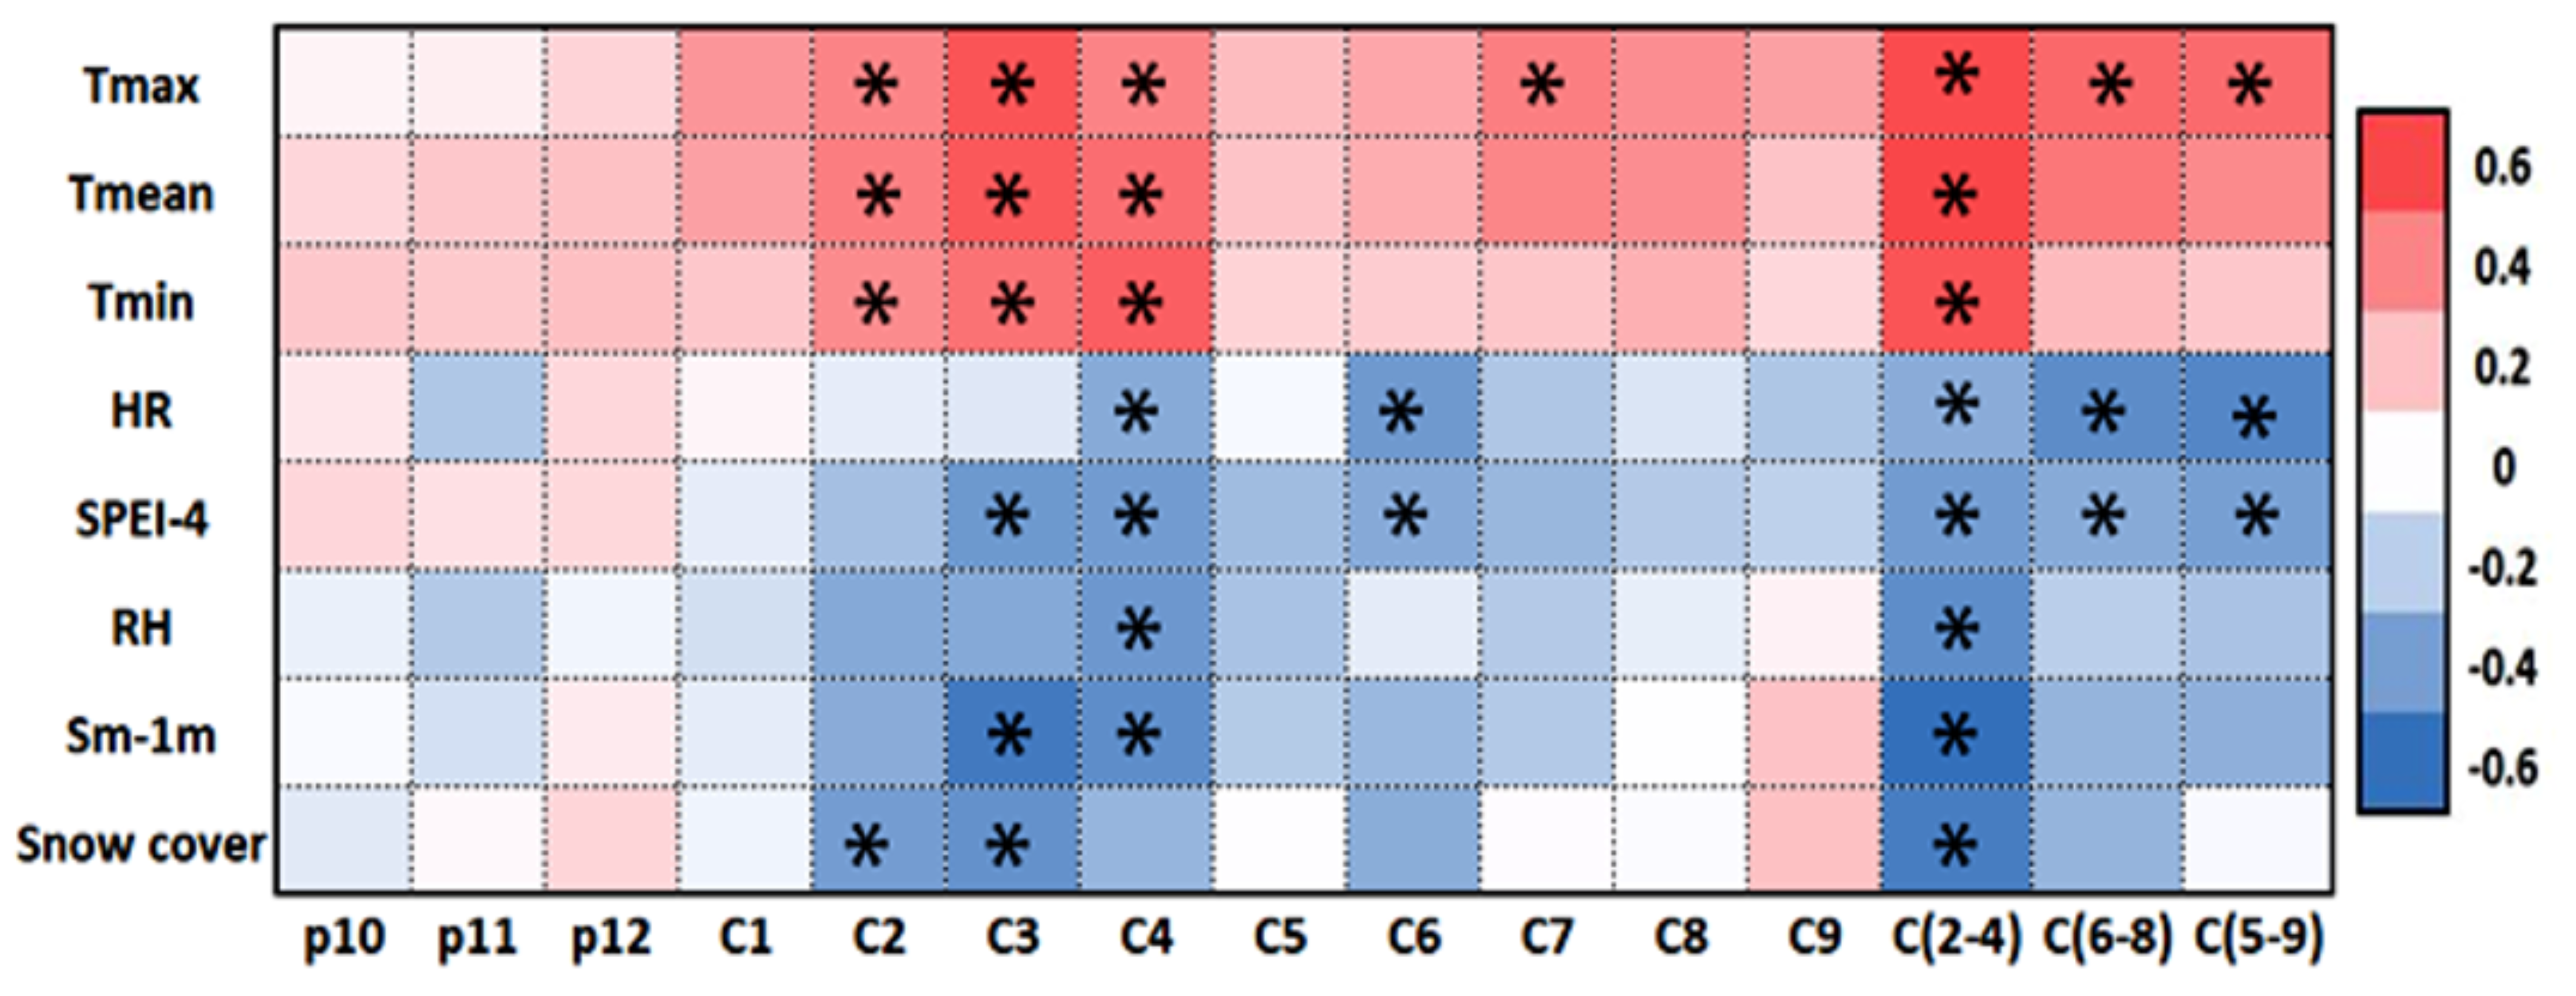
We found significant positive correlations between our δ18OTRC series and temperature (Tmean, Tmax, and Tmin) of CRU-TS 4.04 for the current year spring (February-March-April; FMA) months (Figure 5). Tmean of March showed the highest correlation coefficient (r = 0.51; p < 0.01), however, the correlation with the spring season was even higher (r = 0.57; p < 0.01). Mukteshwar station temperature data also showed significant positive relations with δ18OTRC (r = 0.52; p < 0.01) for the spring season (Figure S2). The correlation results between the temperature datasets of CRU-TS 4.04 and Mukteshwar were also high significant (r = 0.82; p < 0.01), showing common temperature signals over the region. Precipitation, SPEI-04, relative humidity (RH), soil-moisture, and snowcover showed negative correlations with the same months (FMA). Correlation with soil-moisture (r = −0.56; p < 0.01) was high and significant, followed by the results for snowcover (r = −0.51; p < 0.01), RH (r = −0.46; p < 0.01) and SPEI-04 (r= −0.42; p < 0.01) (Figure 5). Overall, climate responses are seasonally consistent. The sensitivity to climate variables such as temperature, soil moisture, snowcover, and relative humidity was commonly found for spring months, except for precipitation. Homogenous rainfall (HR) showed significant negative relationships (r = − 0.47; p < 0.01) for the summer months June–July–August (JJA) (Figure 5). Precipitation of Mukteshwar also showed significant negative relations for the JJA months, but correlation values were low, and for CRU TS v. 4.04 precipitation the correlations were not significant (Figure S2, Table S1). Also, the correlation between precipitation datasets of CRU-TS 4.04 and Mukteshwar for the common year 1960–2019 CE was although significant (r = 0.57; p < 0.01) but with values lower than temperature. Missing data in the Mukteshwar climate records, and also the effect of local orographic influence on rain distribution within the region, might be the cause. Since the summer monsoon season includes JJAS months, we also tested the correlation of δ18O chronology with the averaged JJAS homogenous rainfall (HR) and found the relationship almost similar (r = −0.480) to average JJA (r = −0.476). We carried out the correlation with other climate variables also for JJAS months and found correlation values similar to JJA months. But for the variables relative humidity, snowcover, and soil moisture, the correlations were found insignificantly weak for the JJAS months. During the summer monsoon season, the JJA months remain more influential to the seasonal response of δ18O chronology. See Table S1 for the correlation values for all investigated variables. We also performed the autocorrelation (AC1) for the snowcover data (AC1 = 0.03), which indicates that the main amount of winter precipitation is falling in the current year (e.g., from January onwards).

Figure 5.
Correlation matrix between the δ18OTRC series and various climatic variables (Tmax = maximum temperature; Tmean = Mean Temperature; Tmin = Minimum Temperature; HR = Homogenous Rainfall; SPEI 04 = Standardised Precipitation-Evapotranspiration Index; RH = Relative Humidity and S m–1 m = soil moisture (0–1 m)). Asterisks indicate p < 0.01% confidence levels. p10–C9 = previous year October to current year September (taking January = 1).
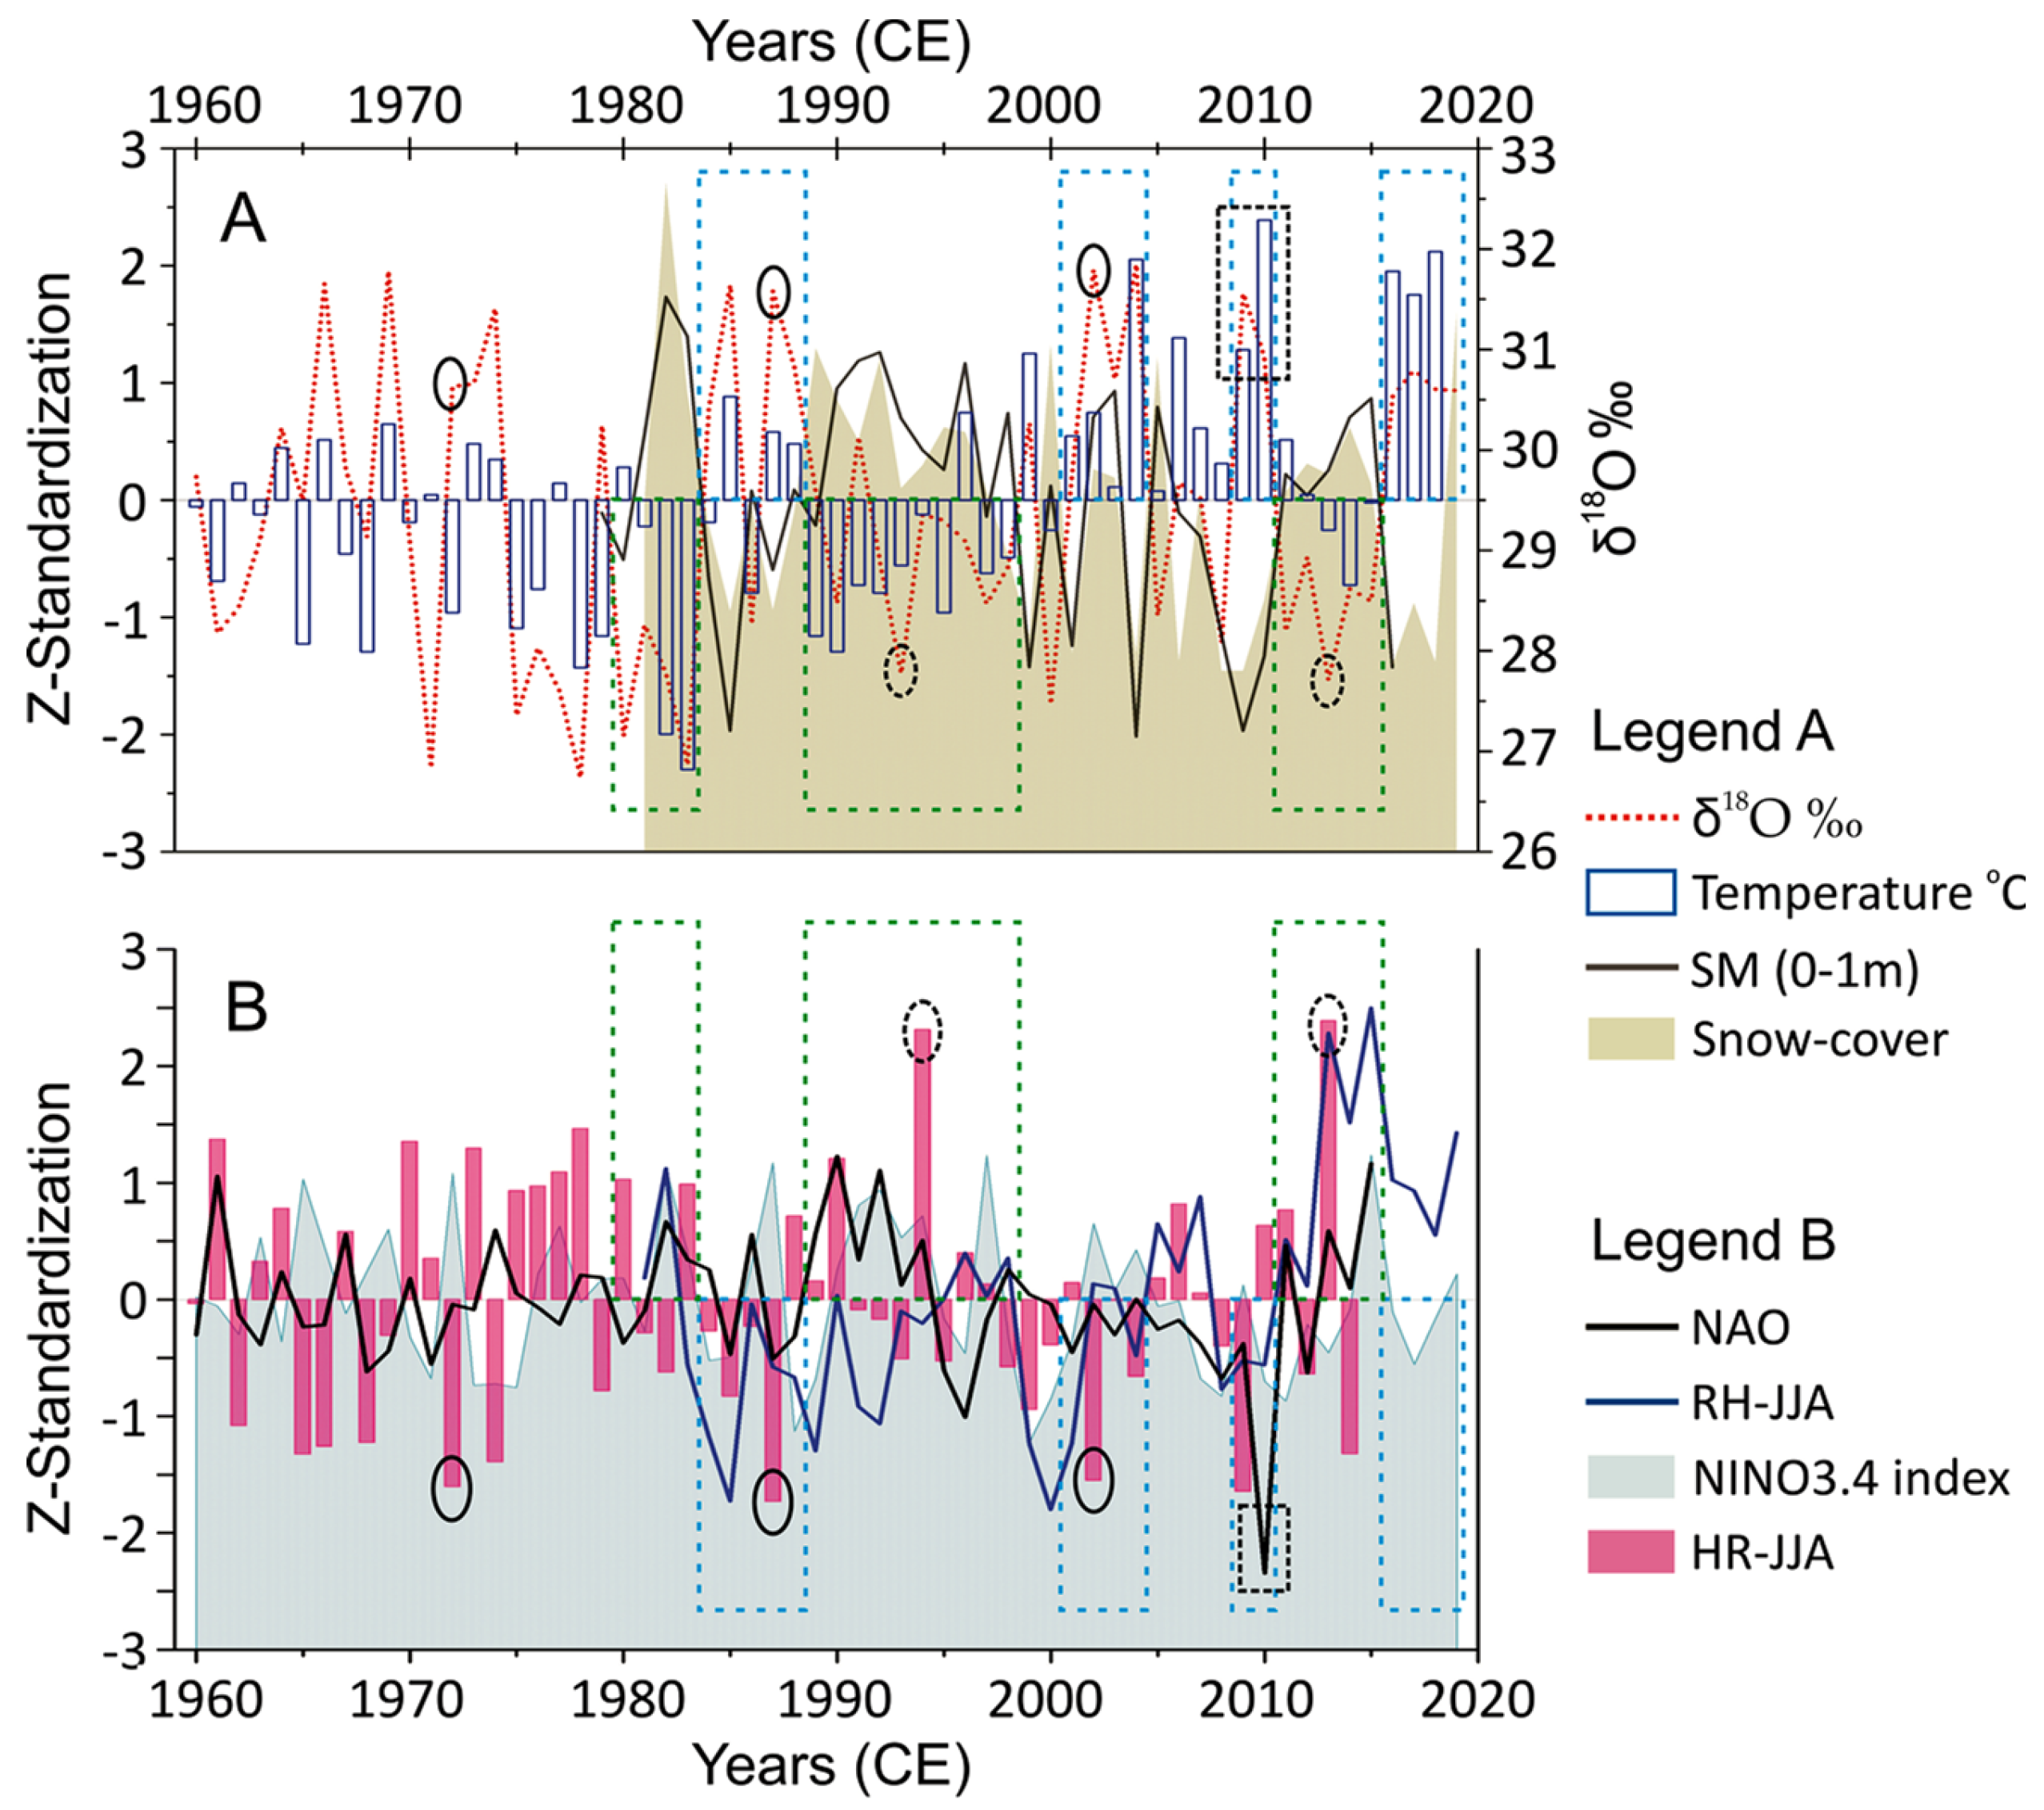
To improve our understanding of the collective role of different climate variables on the 18O fractionation in fir trees, our δ18OTRC series was compared with each climate variable for the common period (Figure 6). In Figure 6, green dashed boxes represent the years with low δ18OTRC values, corresponding with low temperatures and high soil moisture, snowcover, and relative humidity. Conversely, the blue dashed boxes mark the years with high δ18OTRC values, coinciding with high temperature and reduced soil moisture, snowcover, and relative humidity. Black dashed (solid) ovals indicate low (high) peaks of δ18OTRC values coinciding with the highest (lowest) peaks of JJA precipitation. Years with high snow cover coincide with positive NAO indices and vice versa. We tested correlations between snow cover and NAO indices were found positive (r = 0.41; p-value = 0.014).
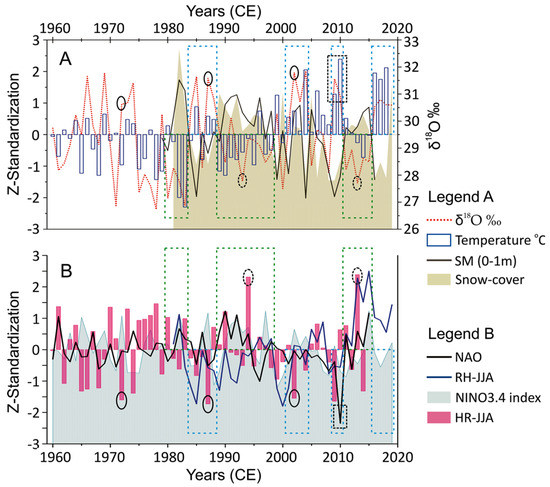
Figure 6.
Overview of the Z-Standardised (1960–2019 CE) new δ18OTRC series. Green (blue) dashed boxes represent low (high) mean δ18OTRC values indicating wet (dry) phases corresponding with low (high) temperatures, high (low) snowcover, soil moisture in (A) and relative humidity in (B) for spring months, and with high (low) rainfall for summer (JJA) months (in B). Black dashed ovals (A,B) show the highest rainfall years corresponding to low temperature and low δ18OTRC. Solid black ovals show correspondence between years having low rainfall (HR) and high δ18OTRC. Dashed black box (B) indicates the highest negative NAO year, coinciding with low snow cover, high temperature, and high δ18OTRC.
4. Discussion
4.1. Response of δ18OTRC to Climate Variables
The δ18OTRC series evidently captured the signatures of various climatic parameters fulfilling our objective to understand the behavior of δ18OTRC of subalpine fir during the latter half of the 20th century. This phase is marked by a unidirectional rise in temperature [9]. Significant positive correlation of δ18OTRC with temperature and significant negative correlations with snowcover, soil moisture, and relative humidity (Figure 5) indicated that these four variables play a critical role in affecting δ18OTRC at the treeline ecotone. Observing the comparative analysis in Figure 6, the years having spring months (FMA) with low (high) temperatures and high (low) snowcover and soil moisture distinctly represented the low (high) δ18OTRC values. This highlights a significant dependence of the δ18OTRC on snowmelt-fed soil moisture, which is substantially regulated by the spring months’ temperature. Moreover, in Figure 6, few years with peaks of high (low) JJA homogenous rainfall (HR) correspond to low (high) δ18O values. This also indicated the role of summer precipitation in δ18O fractionation in trees at subalpine altitudes.
4.2. Temperature Controlled Isotope Fractionation in Fir at Subalpine Elevations
In the Westerly affected higher altitudes of the Himalaya, combined late winter and spring season temperatures (February to April; FMA) are the main driving factors for fractionation processes of 18O in soils and trees. The winter and spring temperatures trigger the isotope fractionation in the fallen snow by sublimation, evaporation, melting, refreezing of snow, and inside the soil by the evaporation of soil moisture [41,44,72]. Here, we emphasize that the δ18OTRC series also showed a significant negative relationship with the snowcover of spring months (Figure 5). According to Figure 5 and Figure 6, the years with high spring (FMA) temperature led to an early initiation of springwood (earlywood) formation by increasing the rate of stomatal conductance, allowing more uptake of soil-moisture by the roots. There are records of winter-spring temperature warming inducing early initiation of springwood in conifer [73] and phonological changes [74] from different regions. The transpiration process modulates the isotopic composition of leaf water by preferential loss of the lighter isotope (16O) through the stomata, enriching the 18O in leaf water [35]. The inter-seasonal variability in δ18O of precipitation also influences the regions receiving precipitation from different sources [75]. The precipitation during the spring months, mainly from westerlies, is more enriched in δ18O than that received during summer monsoon months due to different moisture sources [75]. The higher spring temperatures contributing to early cambial activity lead to more δ18O-enriched soil water incorporated into tree-ring cellulose. Thus, the years with warmer spring months and less snowcover produce soil-moisture stress conditions to trees during spring due to a higher loss of water from trees and an increased demand for water from the soil. Years with relatively low spring temperatures and high snowcover might delay the carbohydrate production and earlywood formation due to prolonged soil frost conditions. In this study, the higher (lower) soil-moisture stress conditions resulting in high (low) δ18OTRC values are well signified by the negative correlation with soil-moisture during the spring season (Figure 5). Moreover, the low (high) relative humidity increases (decreases) transpiration, influencing the δ18O of the leaf water by high (low) transpiration rates. The combined effects of lower (higher) amounts of soil-moisture, lower (higher) levels of relative humidity, and higher (lower) temperatures contributing to dry (wet) conditions have already been discussed in previous studies [71], though without considering the role of snowcover.
4.3. Regional Coherence of δ18OTRC-Climate Response and Possible Mechanisms
The climate response of our new δ18OTRC chronology obtained from the subalpine belt in the ISM-dominated western Himalaya corresponds with temperature signals captured in a δ18O chronology from the winter westerly dominated Zhada area located north of our study site (Figure 1) on the northern slopes of the Himalaya [41]. The authors demonstrated the prominent role of winter temperature in regulating the contribution of snowmelt, which is dominantly transported by the westerlies during the winter months. Also, the influence of the ISM is too weak to overprint the δ18O-temperature relationships at Zhada. It has to be stated that the captured winter precipitation and growing season drought (scPDSI) signals found in the westerly dominated Lahaul-Spiti region [49] contrast with the results from Zhada and also of our study area. The δ18O chronology from the Lahaul-Spiti region, located NW to our site, preserves an integrated winter and summer hydrological signal strength with higher (lower) δ18O values indicating drier (wetter) conditions [49]. Further NW, in the Karakoram Pakistan region under the WD zone [47,50], the δ18O preserved the winter to spring temperature signals, signifying the role of winter snowmelt in wood development by the processes of soil moisture. This indicates the spatial variability in the tree-ring δ18O response to climate variables, as also discussed by Managave et al. [49]. Moreover, in the ISM dominant regions of Himalaya, the δ18OTRC of the same species (A. spectabilis) from treeline altitudes at Ganesh locality in central Nepal [33] showed significant relationships with summer precipitation. This contrasting behavior of A. spectabilis at different regions further supports the spatial variability in tree-ring δ18O response to climate variables. Other δ18OTRC records from the ISM-dominated Himalayan region have shown sensitivity to moisture variables during the vegetation period that also contrasts the result from our study area and areas NW to our site. From the sites Jageshwar [33], Dingad [46], and Manali [33] in the Indian western Himalaya, and from Jumla, Nepal [45] in the central Himalaya, δ18OTRC chronologies were found to be sensitive to June-September precipitation and PDSI. Further towards the East, in Bhutan [44] and on the eastern Tibetan plateau [36,38,76], δ18OTRC chronologies were sensitive to precipitation and relative humidity during the vegetation period. These study sites are either at temperate altitudes [33,46] or in the central and eastern regions of the Himalaya [44,55,71] and the Tibetan plateau [36,38,76], where the impact of summer precipitation is higher (Figure 1). The ISM sites, therefore, represent the influence of the amount effect on 18O in precipitation caused by intense summer monsoon rainfall, whereas the strong influence of winter precipitation remains predominant in the WD zones of Himalaya.
The δ18OTRC chronology of our site, located in the ISM zone, also reported significant negative correlations with Mukteshwar precipitation (r = −0.36; p < 0.01; Figure S2) and HR (r = −0.47; p < 0.01) for the JJA season and with SPEI-04 (r = −0.42; p < 0.01) for the early spring (Feb–Mar) period (Figure 5, Table S1). This indicates that our δ18OTRC series also captured moisture signals. High (low) summer precipitation could dilute (enhance) the δ18O signals of the spring months, which is strongly supported by the correspondence of a few high (low) JJA precipitation years with low (high) δ18OTRC values (Figure 6). These relationships clearly indicate that tree-ring δ18O records in the highly ISM-influenced Asian region consistently preserve common regional hydroclimate signals during the vegetation period as well.
However, the obtained correlation values with summer precipitation at our study site are not high enough to document a strong effect of summer moisture on variations in tree-ring δ18O. This regional incoherence in capturing the climate signals could be taken as the physiographic or elevation effect modulating δ18OTRC signals, as our δ18OTRC series was developed from trees growing in subalpine elevation. At subalpine altitudes, solid precipitation (snow) received during the winter months provides water that enriches the soil more efficiently without runoff [41]. In contrast, summer rainfall may be less efficient due to higher surface runoff. At the subalpine altitudes of the ISM-influenced western Himalaya, the soil is most likely enriched bysnowmelt water carrying the isotopic signals of westerly winter precipitation. Remote sensing-based observational models [77] have also confirmed a significant contribution of winter snowmelt to soil moisture in the Himalayan region. Similar isotope-based observations are also available from other regions, like northern China [78] and mountainous regions in the USA [79].
The identified low (high) δ18OTRC years and periods recorded in our chronology (Table 2) also coincide with extreme wet (dry) years/phases during the summer monsoon season (June to September) rainfall for Jumla (Nepal) [55], and for Dingad valley Uttarakhand, India [46]. The climatic episodes, however, are not in phase with the δ18OTRC based moisture records from Bhutan [55] owing to the different climatic conditions due to the separation of sites over a large geographical scale. Managave et al. [49] discussed the impact of the so-called Karakoram anomaly, where the instrumental weather records of the Karakoram and other western Himalayan regions indicated contrasting trends of both precipitation and temperature [5,80]. During the last century, there was an increase (decrease) in winter precipitation (summer temperature) in the Karakoram and vice-versa in the western Himalayas. The observed climate records during 1901–2012 CE [81] also showed a weakening trend in the summer monsoon across the Himalayan foot hills. The last century climate data of CRU TS v.4.04 for our study area also showed an increasing trend of MAT and a decline in MAP in the latter half of the 20th century (Figure S3). The late 20th-century drying trend is also evident in tree-ring [71] and speleothem δ18O records [31] from northern India. The increasing temperature trend also explains high δ18OTRC values and the significant relation with spring temperature at subalpine altitudes. The significant negative correlation of our δ18OTRC with SPEI-04 for the spring months further confirms that the soil moisture stress could lead to enriched δ18OTRC. Singh et al. [14] found a static treeline in the Tungnath valley adjacent to our study site and identified spring droughts due to high evapotranspiration as a factor. The intensification of spring season drought conditions has also been observed by Panthi et al. [29] in central Nepal, which might be a critical factor controlling the growth of fir trees at the treeline ecotone.
Table 2.
Years with low and high δ18OTRC values from our study site compared with the summer monsoon (June–September) rainfall record for Jumla (Nepal), eastern Uttar Pradesh, and all-India rainfall after Sano et al. 2010. R = JJAS rainfall (mm). The common years are in bold.
4.4. Impact of SSTs on the Variations of δ18OTRC at Our Study Site
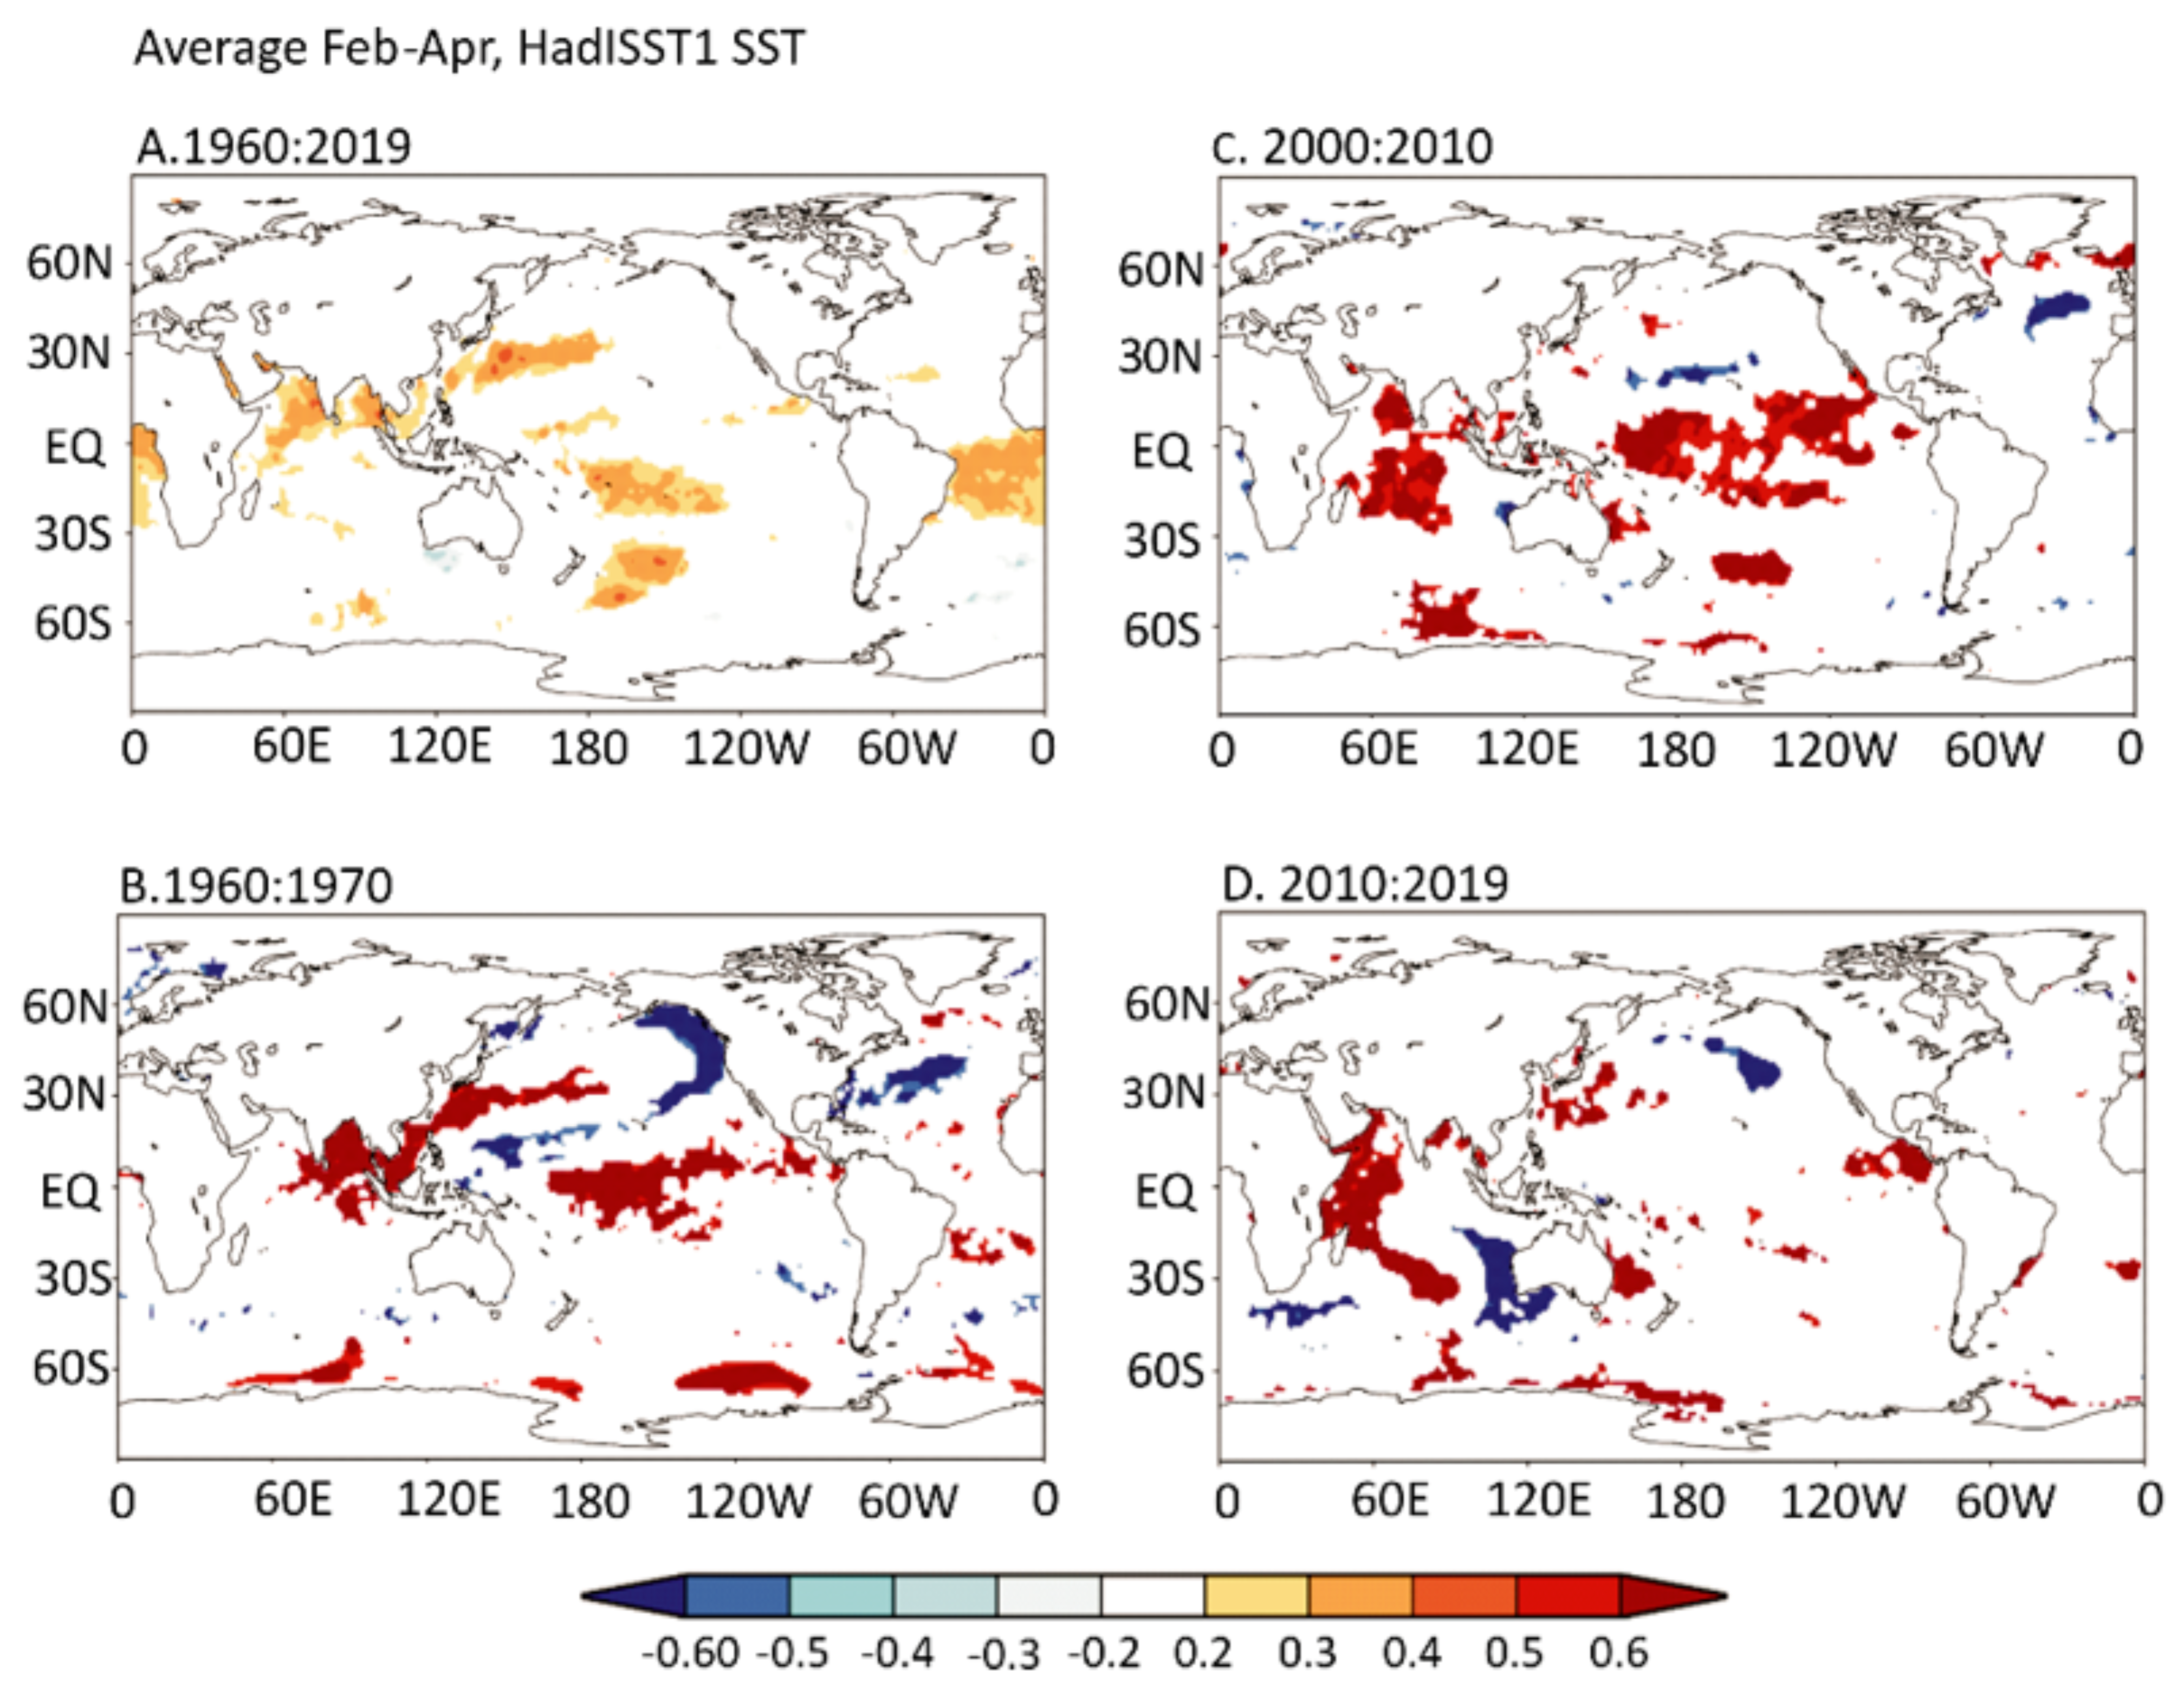
The Indian summer monsoon (ISM) is teleconnected with the sea surface temperatures (SSTs) in the eastern tropical Pacific, such that the El-Niño phase weakens the intensity of ISM [82]. The important role that ENSO plays in modulating the hydroclimate of the Asian region is evident by several tree-ring δ18O chronologies from the Indian Himalaya [46,71], Nepal, Bhutan [33,44], and other Asian regions [83]. However, the response of the monsoon dynamics to ENSO variability was found to be temporally unstable, as observed in the Himalayas [44,45,71], China [84,85], and northwestern Thailand [86]. Sano et al. [71] reported unstable links between ENSO and tree-ring isotope data from Manali, western Himalaya, and identified a phase of non-significant relationships in 1957–2008 CE. According to Chung and Ramanathan [87], significant warming of the equatorial Indian Ocean since the 1950s was observed, accompanied by minimal warming in its northern regions. This warming has led to a weakening of the meridional SST gradient in the Indian Ocean, resulting in reduced monsoon precipitation over India [87,88,89]. Our δ18OTRC record also showed non-significant correlations with HadlSST1 for the common period 1960–2019 CE. Krishnan and Sugi [82] reported the vital role of the Pacific Decadal Oscillation (PDO) in modulating interannual monsoon variability. Sano et al. [44] also reported interdecadal modulation of the PDO on the influence of ENSO on local precipitation in Bhutan. We performed the spatial correlation of our δ18OTRC chronology with HadlSST for the whole study period and the 10 and 20-year windows (Figure 7 and Figure S4). The relationships, though weak, were relatively significant on 10 years window. Our δ18OTRC chronology is positively correlated (p < 0.10) with the SSTs in the central/eastern tropical Pacific during the periods 1960–1970 CE, 2000–2010 CE, and 2010–2019 CE (Figure 7B–D), but with the background of a warming tropical Indian Ocean and the Arabian Sea, as also reported by Sano et al. [71]. However, these correlation patterns in the tropical Pacific were not significant when the whole study period (1960–2019 CE) was considered (Figure 7A). This might indicate breaks in the impact of ENSO phases on our study site, in periods when only a few years showed low peaks of JJA precipitation and related high δ18OTRC values.
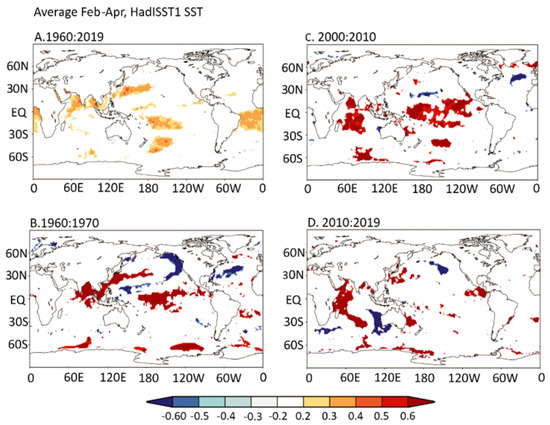
Figure 7.
Spatial correlations of our mean tree-ring δ18OTRC chronology with HadlSST1 sea surface temperatures (SST) for the spring season (Feb-Apr) for the periods 1960–2019 CE (A), 1960–1970 CE (B), 2000–2010 CE (C), and 2010–2019 CE (D); areas with p > 0.10 are masked.
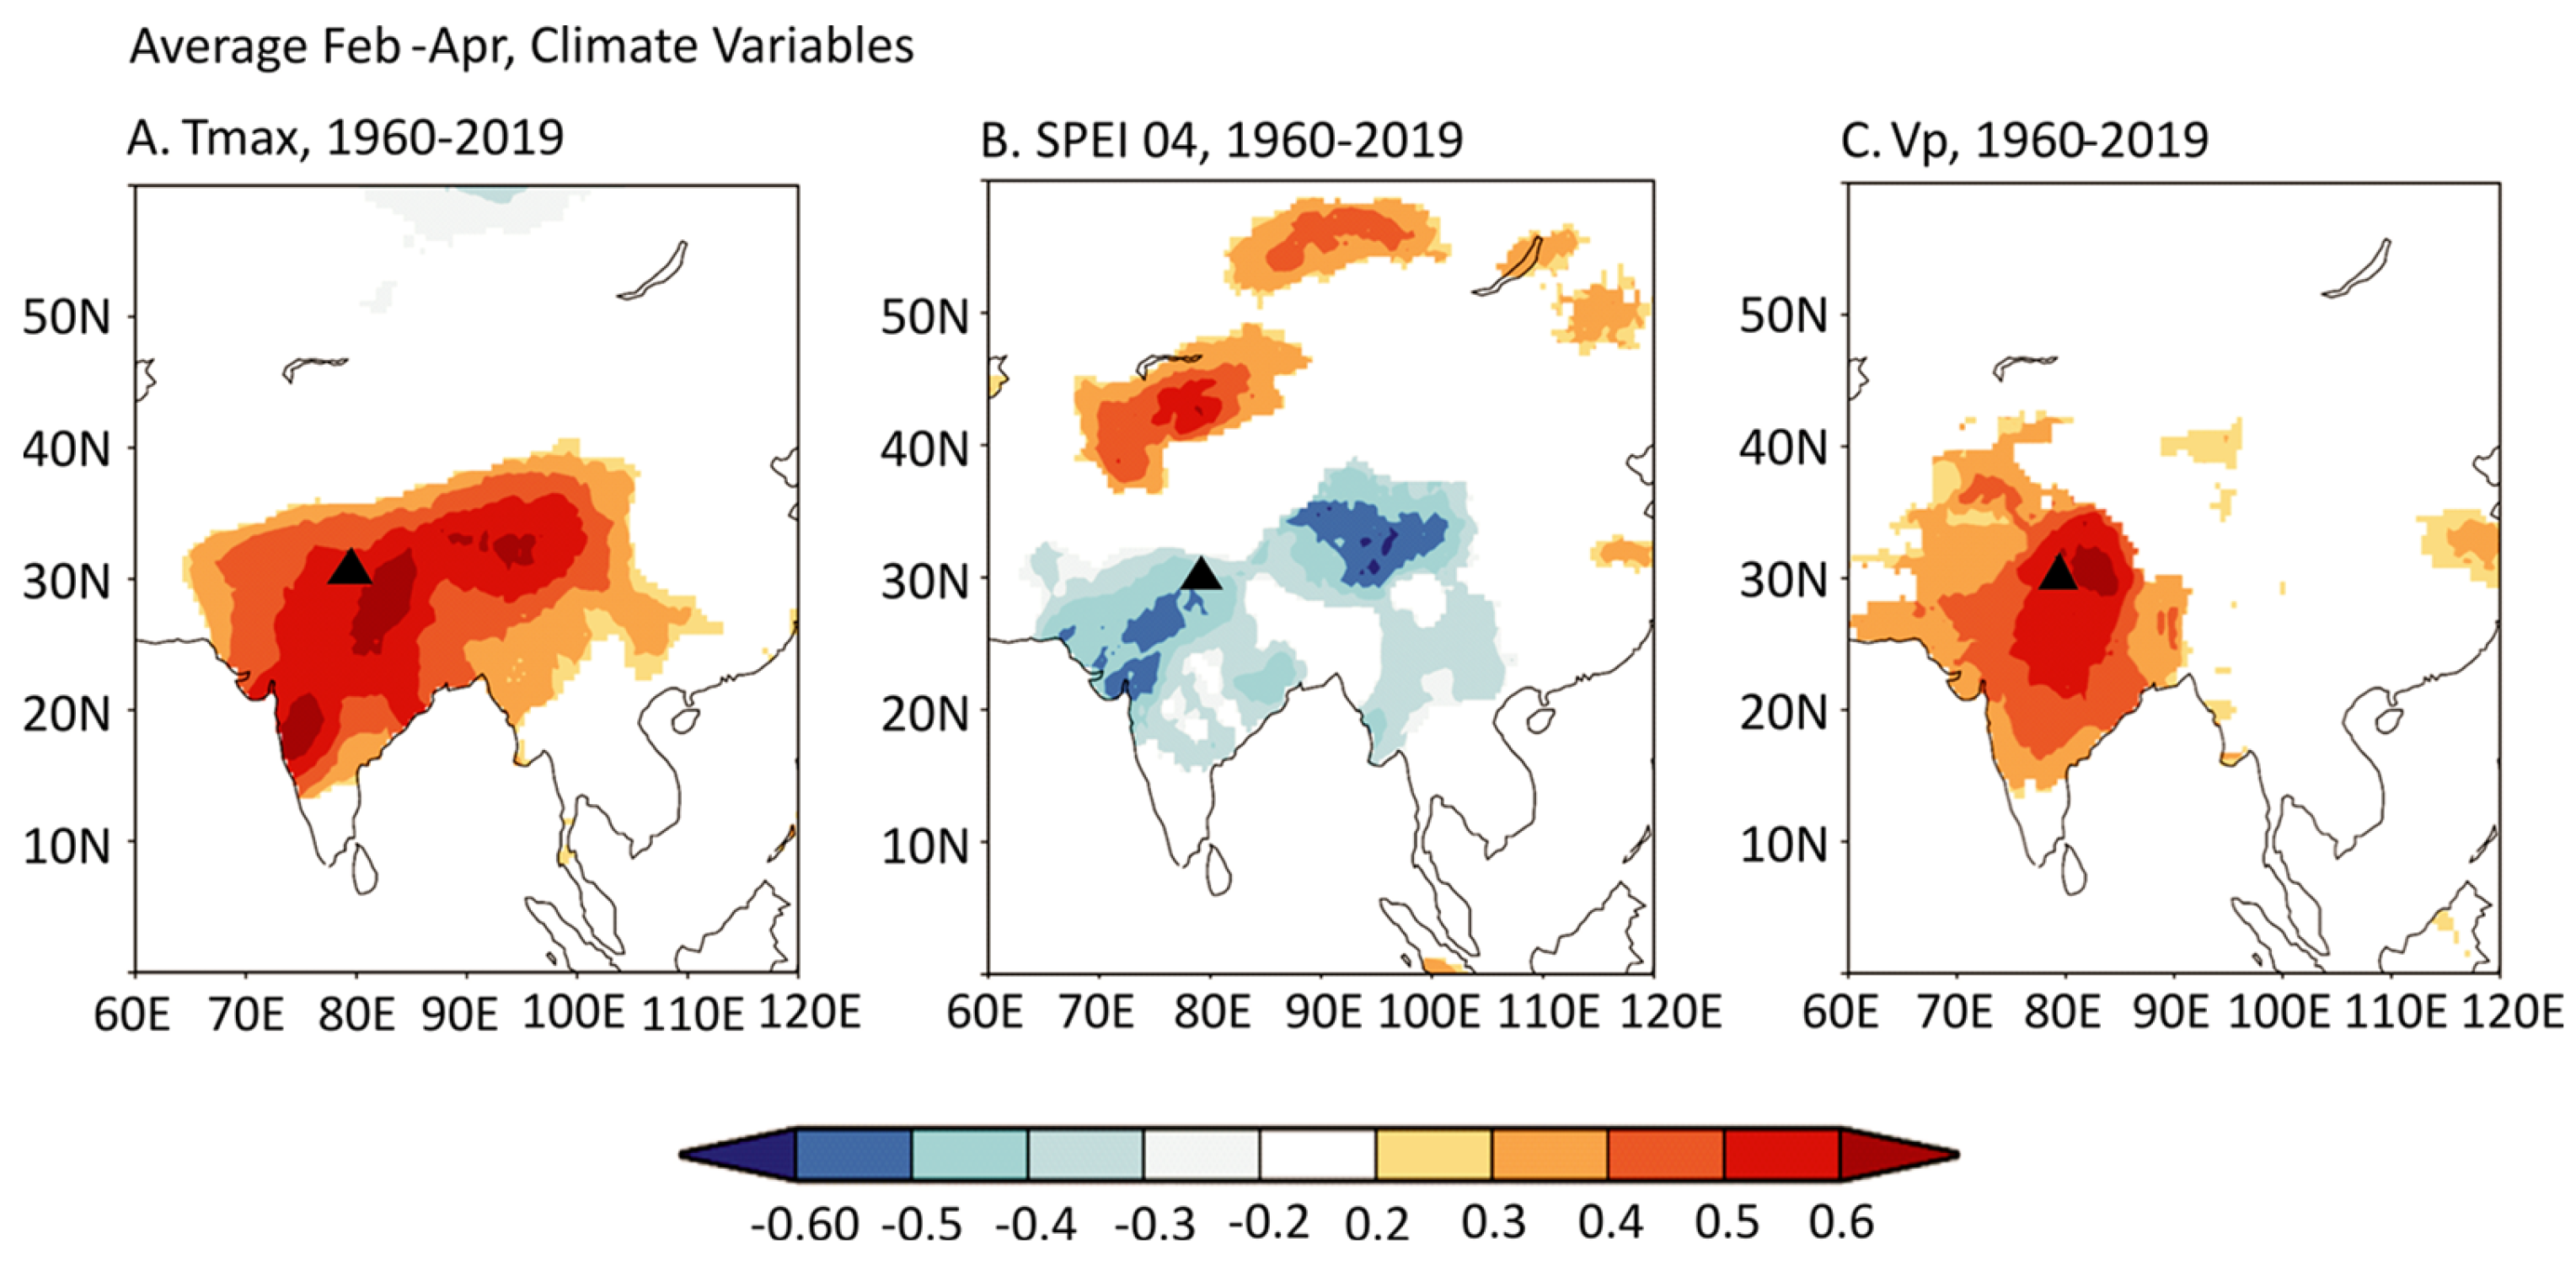
The spatial correlation of our tree-ring δ18O chronology with gridded climate datasets of Tmax, SPEI-04 drought index, and vapor pressure (Figure 8) showed significant correlations across the region, especially with regions east and south of our study site. The significant positive correlations with Tmax in southwestern India, central India, and the eastern parts of the Himalayas and the Tibetan plateau (Figure 8A) indicate the strong control of temperature gradients over the region during the spring months. Also, strong correlations with SPEI-04 and vapour pressure with the western and eastern regions (Figure 8B,C) indicate the moisture source received from both the Bay of Bengal (BoB) and Arabian Sea (AS) monsoon branches to our site. A strong (weak) monsoon circulation reduces (enhances) the flux of isotopically enriched Arabian Sea moisture and enhances (reduces) the flux of isotopically depleted moisture from the Bay of Bengal [31]. In Figure 6, a few weak and strong summer precipitation years coincide with high (low) δ18OTRC values and give the impression of covariation between the BoB and AS monsoon branches at our studysite. However, the long-term correlations with spring-season temperatures and snowcover point overprint monsoon precipitation signals at our study site.

Figure 8.
Spatial correlations of δ18OTRC with the climate variables Tmax (D), SPEI 04 (E), and vapour pressure (F); areas with p > 0.05 are masked; Black triangles in (A–C) represent the location of the study site.
4.5. Influence of the North Atlantic Oscillation (NAO)
Another striking feature in our study is the significant negative correlation of δ18OTRC with NAO (r = −0.24; p < 0.10) over 1960–2019 CE. The North Atlantic atmospheric circulation regulates the strength of the winter westerlies [90,91], being the source of snow precipitation in the northwestern and southern parts of the western Himalayas. We correlated the snowcover data with NAO for the 1981–2019 CE period and found a significant positive relation (r = 0.40; p < 0.05). Hurrell [92] observed interdecadal phase changes in NAO in the past century. Following a negative trend until the late 1960s, a strong positive trend was observed until the mid-1990s. The trend again became negative and culminated in the consecutive winters of 2009/2010 and 2010/2011 CE, showing the most negative NAO index values during the past 150 years [91]. Figure 6 also showed temperature maxima in 2009/2010 CE, coinciding with the lowest snowcover and high δ18OTRC values. Mean temperature and snowcover during spring show highly significant negative correlations (r = −0.76; p < 0.01), indicating the control of spring temperature on winter snow at the study site. The changes in the strength of westerly snowfall, modulated by inter-annual spring temperature fluctuations, played a more assertive role than summer monsoon precipitation in regulating δ18OTRC in fir trees at subalpine altitudes in the ISM dominated region of the western Himalaya. Thus, sites at higher altitudes with an influence of the westerlies during the winter months seem to have a higher potential for spring temperature reconstructions. The δ18OTRC records from such sites could provide information on past snowcover changes beyond instrumental records. This finding needs further confirmation by replicating the studies from other westerly influenced subalpine sites in the ISM-dominated zones within the western Himalayan region.
5. Conclusions
The developed δ18O tree-ring cellulose chronology of Abies spectabilis demonstrated that trees from the treeline ecotone at subalpine altitudes of the summer monsoon-dominated western Himalayas are sensitive to temperature, soil moisture, and snowcover of late winter and spring months. Results indicated a collective role of spring temperature and snowcover to 18O fractionation processes in the soil and within trees at subalpine altitudes and correspond with the captured temperature signals by δ18OTRC chronology from the WD dominated area. In addition, the summer monsoon rains were found less influential in diluting the 18O signals produced by spring temperature and snowcover. Our findings improve the insight on the regional variability of trees in capturing climate signals caused by different seasonal (ISM and WD) moisture sources coupled to factors such as increasing temperature trend and topographic (elevation) effect. The elevation effect could enhance the role of temperature in regulating δ18O in the trees by controlling the melting of winter snow in the treeline ecotone brought by WD influence. Moreover, the relation with summer monsoon precipitation and the regional correspondence of high and low precipitation phases with other treering isotope study records indicate a common hydrological control over the ISM-influenced region. The weak but significant correlation with the NAO might be a reason that our site does not capture SST signals of the tropical Pacific region, which is responsible for controlling the ISM circulation over South Asia. The spatial correlation with spring SPEI-04, vapour pressure, and temperature (Tmax) signified the precipitation sources from BoB and AS branches, but the amount effect of summer precipitation remained weak to override the spring temperature signals at the WD influenced subalpine altitudes of ISM dominated valley of the western Himalaya. This study has successfully augmented the existing records of δ18OTRC from different parts of the Himalayas and adjacent regions. Additional tree-ring oxygen isotope chronology studies from WD-influenced subalpine altitudes are required to further underpin our findings and understand the temperature and precipitation dynamics over the Himalayan and Tibetan regions.
Supplementary Materials
The following supporting information can be downloaded at: https://www.mdpi.com/article/10.3390/f13030437/s1, Figure S1: Homogenous rainfall of NW subdivision of India; Figure S2: Correlation between δ18OTRC and Mukteshwar temperature and precipitation (Mkt Temp, Mkt Ppt), CRU precipitation, and soil moisture (Sm 0–10 cm) for the common period 1960–2019 CE. Asterisks indicate p < 0.01% confidence levels. p10–C9 = previous year October to current year September (taking January = 1); Figure S3: Annual trends of CRU TS v. 4.04 mean annual temperature (MAT) and precipitation (MAP mm) since 1901 to 2019 CE. Red and blue lines represent decadal Fast Fourier Transform (FFT-Filter) of MAT and MAP; Figure S4: Spatial correlations of our mean tree-ring δ18OTRC chronology with HadlSST1 sea surface temperatures (SST) for the spring season (Feb-Apr) for the 10-year window for 1980–1990 CE (A), and 20-year window for years 1960–1980 CE (B), 1980–2000 CE (C) and 2000–2019 CE (D); areas with p > 0.10 are masked. Table S1: Correlation coefficients between the δ18OTRC chronology and monthly climate variables from October of the previous year (p10) to current September (C9) and various seasonal means. Bold values indicate a significant level at p < 0.01.
Author Contributions
Conceptualization, A.B., J.G., and P.S.R.; methodology and formal analysis, B.D.C.; resources, A.B.; writing—original draft preparation, B.D.C.; review and editing, B.D.C., J.G., P.S.R., N.T., C.P.S., A.B.; supervision, A.B. All authors have read and agreed to the published version of the manuscript.
Funding
This research funded by German Academic Exchange Service (DAAD).
Institutional Review Board Statement
Not applicable.
Informed Consent Statement
Not applicable.
Data Availability Statement
The data used in this paper will be provided on request by B.D.Chinthala (bency.chinthala@fau.de) or P.S.Ranhotra (parmindersingh_ranhotra@bsip.res.in).
Acknowledgments
We highly acknowledge Space Application Center (SAC-ISRO) Ahmedabad, India, for the financial support extended to the field excursion, 2019 under SHRESTI programme SAC/EPSA/BPSG/ALPINE/SHRESTI/09/2019. We express our deep appreciation to the German Academic Exchange Service (DAAD) for the financial support of BDC. PSR and BDC are thankful to the Director, Birbal Sahni Institute of Palaeosciences, Lucknow, India, for kind support in the tenure of research work. We are very grateful to the officials and staff (PCCF, DFO) of the Forest Department of Uttarakhand, India, for rendering permission and support in the sample collection to carry out the study. Information was generated using Copernicus Climate Change Service information (2021) in Google Earth Engine. All authors acknowledge Iris Burchardt for helpful comments during sample preparation, and Roswitha Höfner-Stich, Nadja Schlieder for technical assistance in laboratory analysis.
Conflicts of Interest
The authors declare no conflict of interest. The funders had no role in the design of the study, in the collection, analyses, or interpretation of data, in the writing of the manuscript, or in the decision to publish the results.
References
- Polanski, S.; Fallah, B.; Befort, D.J.; Prasad, S.; Cubasch, U. Regional moisture change over India during the past Millennium: A comparison of multi-proxy reconstructions and climate model simulations. Glob. Planet. Chang. 2014, 122, 176–185. [Google Scholar] [CrossRef] [Green Version]
- Dimri, A.P. Interannual variability of Indian winter monsoon over the Western Himalayas. Glob. Planet. Chang. 2013, 106, 39–50. [Google Scholar] [CrossRef]
- Archer, D.R.; Fowler, H.J. Spatial and temporal variations in precipitation in the Upper Indus Basin, global teleconnections and hydrological implications. Hydrol. Earth Sys. Sci. 2004, 8, 47–61. [Google Scholar] [CrossRef] [Green Version]
- Kapnick, S.B.S.; Delworth, T.L.T.; Ashfaq, M.; Malyshev, S.; Milly, P.C.D. Snowfall less sensitive to warming in Karakoram than in Himalayas due to a unique seasonal cycle. Nat. Geosci. 2014, 7, 834–840. [Google Scholar] [CrossRef]
- Fowler, H.J.; Archer, D.R. Conflicting signals of climatic change in the upper Indus basin. J. Clim. 2006, 19, 4276–4293. [Google Scholar] [CrossRef] [Green Version]
- Forsythe, N.; Fowler, H.J.; Li, X.F.; Blenkinsop, S.; Pritchard, D. Karakoram temperature and glacial melt driven by regional atmospheric circulation variability. Nat. Clim. Chang. 2017, 7, 664–670. [Google Scholar] [CrossRef]
- Battipaglia, G.; Jäggi, M.; Saurer, M.; Siegwolf, R.T.; Cotrufo, M.F. Climatic sensitivity of δ18O in the wood and cellulose of tree rings: Results from a mixed stand of Acer pseudoplatanus L. and Fagus sylvatica L. Palaeoclimatology 2008, 261, 193–202. [Google Scholar] [CrossRef]
- Proutsos, N.; Tigkas, D. Growth response of endemic black pine trees to meteorological variations and drought episodes in a Mediterranean region. Atmosphere 2020, 11, 554. [Google Scholar] [CrossRef]
- Intergovernmental Panel on Climate Change (IPCC). Climate Change and Land: An IPCC Special Report on Climate Change, Desertification, Land Degradation, Sustainable Land Management, Food Security, and Greenhouse Gas Fluxes in Terrestrial Ecosystems. 2019. Available online: https://www.ipcc.ch/srccl/download/ (accessed on 16 June 2021).
- Tiwari, A.; Fan, Z.X.; Jump, A.S.; Li, S.F.; Zhou, Z.K. Gradual expansion of moisture sensitive Abies spectabilis forest in the Trans-Himalayan zone of central Nepal associated with climate change. Dendrochronologia 2017, 41, 34–43. [Google Scholar] [CrossRef]
- Dash, S.K.; Jenamani, R.K.; Kalsi, S.R.; Panda, S.K. Some evidence of climate change in twentieth-century India. Clim. Chang. 2007, 85, 299–321. [Google Scholar] [CrossRef]
- Schickhoff, U.; Bobrowski, M.; Böhner, J.; Bürzle, B.; Chaudhary, R.P.; Gerlitz, L.; Wedegärtner, R. Do Himalayan treelines respond to recent climate change? An evaluation of sensitivity indicators. Earth Syst. Dynam. 2015, 6, 245–265. [Google Scholar] [CrossRef]
- Singh, C.P.; Panigrahy, S.; Thapliyal, A.; Kimothi, M.M.; Soni, P.; Parihar, J.S. Monitoring the alpine treeline shift in parts of the Indian Himalayas using remote sensing. Cur. Sci. 2012, 102, 559–562. [Google Scholar]
- Singh, U.; Phulara, M.; David, B.; Ranhotra, P.S.; Shekhar, M.; Bhattacharyya, A.; Dhyani, R.; Joshi, R.; Pal, A.K. Static tree line of Himalayan silver fir since last several decades at Tungnath, Western Himalaya. Trop. Ecol. 2018, 59, 351–363. [Google Scholar]
- Mou, Y.M.; Fang, O.Y.; Cheng, X.H.; Qiu, H.Y. Recent tree growth decline unprecedented over the last four centuries in a Tibetan juniper forest. J. For. Res. 2019, 30, 1429–1436. [Google Scholar] [CrossRef]
- Sigdel, S.R.; Wang, Y.; Camarero, J.J.; Zhu, H.; Liang, E.; Peñuelas, J. Moisture-mediated responsiveness of treeline shifts to global warming in the Himalayas. Glob. Chang. Biol. 2018, 24, 5549–5559. [Google Scholar] [CrossRef] [Green Version]
- Borgaonkar, H.P.; Sikder, A.B.; Ram, S. High altitude forest sensitivity to the recent warming: A tree-ring analysis of conifers from western Himalaya, India. Quat. Int. 2011, 236, 158–166. [Google Scholar] [CrossRef]
- Cook, E.R.; Anchukaitis, K.J.; Buckley, B.M.; D’Arrigo, R.D.; Jacoby, G.C.; Wright, W.E. Asian monsoon failure and megadrought during the last millennium. Science 2010, 328, 486–489. [Google Scholar] [CrossRef] [Green Version]
- Singh, V.; Misra, K.G.; Singh, A.D.; Yadav, R.R.; Yadava, A.K. Little Ice Age revealed in tree-ring based precipitation record from the northwest Himalaya, India. Geophys. Res. Lett. 2021, 48, e2020GL091298. [Google Scholar] [CrossRef]
- Yadav, R.R.; Braeuning, A.; Singh, J. Tree ring inferred summer temperature variations over the last millennium in western Himalaya, India. Clim. Dyn. 2011, 36, 1545–1554. [Google Scholar] [CrossRef]
- Yadav, R.R.; Misra, K.G.; Yadava, A.K.; Kotlia, B.S.; Misra, S. Tree-ring footprints of drought variability in last 300 years over Kumaun Himalaya, India and its relationship with crop productivity. Quat. Sci. Rev. 2015, 117, 113–123. [Google Scholar] [CrossRef]
- Shah, S.K.; Pandey, U.; Mehrotra, N.; Wiles, G.C.; Chandra, R. A winter temperature reconstruction for the Lidder Valley, Kashmir, Northwest Himalaya based on tree-rings of Pinus wallichiana. Clim. Dyn. 2019, 53, 4059–4075. [Google Scholar] [CrossRef]
- Pai, D.S.; Bandgar, A.; Devi, S.; Musale, M.; Badwaik, M.R.; Kundale, A.P.; Gadgil, S.; Mohapatra, M.; Rajeevan, M. New Normal Dates of Onset/Progress and Withdrawal of Southwest Monsoon over India; CRS Research Report, RR No. 3/2020; Indian Meteorological Department: Pune, India, 2020.
- Dimri, A.P.; Yasunari, T.; Wiltshire, A.; Kumar, P.; Mathison, C.; Ridley, J. Application of regional climate models to the Indian winter monsoon over the western Himalayas. Sci. Total Environ. 2013, 468, S36–S47. [Google Scholar] [CrossRef]
- Dimri, A.P.; Yasunari, T.; Kotlia, B.S.; Mohanty, U.C.; Sikka, D.R. Indian winter monsoon: Present and past. Earth-Sci. Rev. 2016, 163, 297–322. [Google Scholar] [CrossRef]
- Yadav, R.R.; Singh, J. Tree-ring-based spring temperature patterns over the past four centuries in western Himalaya. Quat. Res. 2002, 57, 299–305. [Google Scholar] [CrossRef]
- Thapa, U.K.; Shah, S.K.; Gaire, N.P.; Bhuju, D.R. Spring temperatures in the far-western Nepal Himalaya since AD 1640 reconstructed from Picea smithiana tree-ring widths. Clim. Dyn. 2015, 45, 2069–2081. [Google Scholar] [CrossRef]
- Singh, J.; Yadav, R.R. Spring precipitation variations over the western Himalaya, India, since AD 1731 as deduced from tree rings. J.Geophys. Res. Atmos. 2005, 110. [Google Scholar] [CrossRef]
- Panthi, S.; Bräuning, A.; Zhou, Z.K.; Fan, Z.X. Tree rings reveal recent intensified spring drought in the central Himalaya, Nepal. Glob. Planet.Chang. 2017, 157, 26–34. [Google Scholar] [CrossRef]
- Yadava, A.K.; Misra, K.G.; Singh, V.; Misra, S.; Sharma, Y.K.; Kotlia, B.S. 244-year long tree-ring based drought records from Uttarakhand, western Himalaya, India. Quat. Int. 2021, 599–600, 128–137. [Google Scholar] [CrossRef]
- Sinha, A.; Kathayat, G.; Cheng, H.; Breitenbach, S.F.; Berkelhammer, M.; Mudelsee, M.; Biswas, J.; Edwards, R.L. Trends and oscillations in the Indian summer monsoon rainfall over the last two millennia. Nat. Commun. 2015, 6, 6309. [Google Scholar] [CrossRef] [Green Version]
- Xu, C.; Sano, M.; Nakatsuka, T. A 400-year record of hydroclimate variability and local ENSO history in northern Southeast Asia inferred from tree-ring δ18O. Palaeogeogr. Palaeoclimatol. Palaeoecol. 2013, 386, 588–598. [Google Scholar] [CrossRef]
- Xu, C.; Sano, M.; Dimri, A.P.; Ramesh, R.; Nakatsuka, T.; Shi, F.; Guo, Z. Decreasing Indian summer monsoon on the northern Indian sub-continent during the last 180 years: Evidence from five tree ring cellulose oxygen isotope chronology. Clim. Past. 2018, 14, 653–664. [Google Scholar] [CrossRef] [Green Version]
- Li, Q.; Nakatsuka, T.; Kawamura, K.; Liu, Y.; Song, H. Regional hydroclimate and precipitation δ18O revealed in tree-ring cellulose δ18O from different tree species in semi-arid Northern China. Chem. Geol. 2011, 282, 19–28. [Google Scholar] [CrossRef]
- Gessler, A.; Ferrio, J.P.; Hommel, R.; Treydte, K.; Werner, R.A.; Russell, K.M. Stable isotopes in tree rings: Towards a mechanistic understanding of isotope fractionation and mixing processes from the leaves to the wood. Tree Physiol. 2014, 34, 796–818. [Google Scholar] [CrossRef] [PubMed] [Green Version]
- Grießinger, J.; Bräuning, A.; Helle, G.; Thomas, A.; Schleser, G. Late Holocene Asian summer monsoon variability reflected by δ18 O in tree-rings from Tibetan junipers. Geophys. Res. Lett. 2011, 38. [Google Scholar] [CrossRef]
- Grießinger, J.; Bräuning, A.; Helle, G.; Hochreuther, P.; Schleser, G. Late Holocene relative humidity history on the southeastern Tibetan plateau inferred from a tree-ring δ18O record: Recent decrease and conditions during the last 1500 years. Quat. Int. 2017, 430, 52–59. [Google Scholar] [CrossRef]
- Wernicke, J.; Hochreuther, P.; Grießinger, J.; Zhu, H.; Wang, L.; Bräuning, A. Multi-century humidity reconstructions from the southeastern Tibetan Plateau inferred from tree-ring δ18O. Glob. Planet. Chang. 2017, 149, 26–35. [Google Scholar] [CrossRef]
- Liu, X.; Xu, G.; Grießinger, J.; An, W.; Wang, W.; Zeng, X.; Wu, G.; Qin, D. A shift in cloud cover over the southeastern Tibetan Plateau since 1600: Evidence from regional tree-ring δ18O and its linkages to tropical oceans. Quat. Sci. Rev. 2014, 88, 55–68. [Google Scholar] [CrossRef]
- Farquhar, G.D.; Cernusak, L.A.; Belinda, B. Heavy Water Fractionation during Transpiration. Plant Physiol. 2007, 143, 11–18. [Google Scholar] [CrossRef] [Green Version]
- Huang, R.; Zhu, H.; Liang, E.; Grießinger, J.; Wernicke, J.; Yu, W.; Bräuning, A. Temperature signals in tree-ring oxygen isotope series from the northern slope of the Himalaya. Earth Planet. Sci. Lett. 2019, 506, 455–465. [Google Scholar] [CrossRef]
- Barbour, M.M.; Walcroft, A.S.; Farquhar, G.D. Seasonal variation in δ13C and δ18O of cellulose from growth rings of Pinus radiata. Plant Cell Environ. 2002, 25, 1483–1499. [Google Scholar] [CrossRef]
- Kahmen, A.; Sachse, D.; Arndt, S.K.; Tu, K.P.; Farrington, H.; Vitousek, P.M.; Dawson, T.E. Cellulose δ18O is an index of leaf-to-air vapor pressure difference(VPD) in tropical plants. Proc. Natl. Acad. Sci. USA 2011, 108, 1981–1986. [Google Scholar] [CrossRef] [PubMed] [Green Version]
- Sano, M.; Tshering, P.; Komori, J.; Fujita, K.; Xu, C.; Nakatsuka, T. May–September precipitation in the Bhutan δ18O, Himalaya since 1743 as reconstructed from tree ring cellulose. J. Geophys. Res. Atmos. 2013, 118, 8399–8410. [Google Scholar] [CrossRef]
- Sano, M.; Ramesh, R.; Sheshshayee, M.S.; Sukumar, R. Increasing aridity over the past 223 years in the Nepal Himalaya inferred from a tree-ring δ18O chronology. Holocene 2012, 22, 809–817. [Google Scholar] [CrossRef]
- Singh, J.; Singh, N.; Chauhan, P.; Yadav, R.R.; Bräuning, A.; Mayr, C.; Rastogi, T. Tree-ring δ18O records of abating June–July monsoon rainfall over the Himalayan region in the last 273 years. Quat. Int. 2019, 532, 48–56. [Google Scholar] [CrossRef]
- Huang, R.; Zhu, H.; Liang, E.; Bräuning, A.; Zhong, L.; Xu, C.; Feng, X.; Asad, F.; Sigdel, S.R.; Li, L.; et al. Contribution of winter precipitation to tree growth persists until the late growing season in the Karakoram of northern Pakistan. J. Hydrol. 2022, 607, 127513. [Google Scholar] [CrossRef]
- Yao, T.; Masson-Delmotte, V.; Gao, J.; Yu, W.S.; Yang, X.X.; Risi, C.; Sturm, C.; Werner, M.; Zhao, H.; He, Y.; et al. A review of climatic controls on δ18O in precipitation over the Tibetan Plateau: Observations and simulations. Rev. Geophys. 2013, 51, 525–548. [Google Scholar] [CrossRef]
- Managave, S.; Shimla, P.; Yadav, R.R.; Ramesh, R.; Balakrishnan, S. Contrasting centennial-scale climate variability in High Mountain Asia revealed by a tree-ring oxygen isotope record from Lahaul-Spiti. Geophys. Res. Lett. 2020, 47, e2019GL086170. [Google Scholar] [CrossRef]
- Treydte, K.S.; Schleser, G.H.; Helle, G.; Frank, D.C.; Winiger, M.; Haug, G.H.; Esper, J. The twentieth century was the wettest period in northern Pakistan over the past millennium. Nature 2006, 440, 1179–1182. [Google Scholar] [CrossRef]
- Chhetri, P.K.; Cairns, D.M. Dendroclimatic response of Abies spectabilis from the treeline ecotone of Barun valley, eastern Nepal Himalaya. J. For. Res. 2016, 27, 1163–1170. [Google Scholar] [CrossRef]
- Roy, I.; Ranhotra, P.S.; Shekhar, M.; Bhattacharyya, A.; Ghosh, R.; Sharma, Y.K. Modern Pollen-vegetation Relationships along the Vegetation Gradient in the Bhagirathi Valley, Western Himalaya, India. J. Geol. Soc. India 2021, 97, 571–578. [Google Scholar] [CrossRef]
- Malik, R.; Sukumar, R. June–July Temperature Reconstruction of Kashmir Valley from Tree Rings of Himalayan Pindrow Fir. Atmosphere 2021, 12, 410. [Google Scholar] [CrossRef]
- Shekhar, M.; Bhardwaj, A.; Singh, S.; Ranhotra, P.S.; Bhattacharyya, A.; Pal, A.K.; Zorzano, M.P. Himalayan glaciers experienced significant mass loss during later phases of little ice age. Sci. Rep. 2017, 7, 10305. [Google Scholar] [CrossRef] [PubMed]
- Sano, M.; Sheshshayee, M.S.; Managave, S.R.; Sukumar, R.; Sweda, T. Climatic potential of δ18O of Abies spectabilis from the Nepal Himalaya. Dendrochronologia 2010, 28, 93–98. [Google Scholar] [CrossRef]
- Rinn, F. TSAP-Win: Time Series Analysis and Presentation for Dendrochronology and Related Applications; Frank Rinn: Heidelberg, Germany, 2003. [Google Scholar]
- Bunn, A.G. A dendrochronology program library in R (dplR). Dendrochronologia 2008, 26, 115–124. [Google Scholar] [CrossRef]
- Wieloch, T.; Helle, G.; Heinrich, I.; Voigt, M.; Schyma, P.A. novel device for batch-wise isolation of α-cellulose from small-amount wholewood samples. Dendrochronologia 2011, 29, 115–117. [Google Scholar] [CrossRef] [Green Version]
- Wigley, T.M.L.; Briffa, K.R.; Jones, P.D. On the average value of correlated time series, with applications in dendroclimatology and hydrometeorology. J. Clim. Appl. Meteorol. 1984, 23, 201–213. [Google Scholar] [CrossRef]
- Briffa, K.R.; Jones, P.D. Basic chronology statistics and assessment. In Methods of Dendrochronology: Applications in the Environmental Sciences; Cook, E.R., Kairiukstis, L.A., Eds.; International Institute for Applied Systems Analysis (IIASA): Laxenburg Austria; Kluwer Academic Publishers: Dordrecht, The Netherlands, 1990; pp. 137–152. [Google Scholar]
- Adhikari, B.S.; Rawat, G.S.; Rai, I.D.; Bharti, R.R.; Bhattacharyya, S. Ecological Assessment of Timberline Ecotone in Western Himalaya with Special Reference to Climate Change and Anthropogenic Pressures; IV Annual Report; Wildlife Institute of India: Dehradun, India, 2011.
- Harris, I.; Osborn, T.J.; Jones, P.; Lister, D. Version 4 of the CRU TS monthly high-resolution gridded multivariate climate dataset. Sci. Data 2020, 7, 109. [Google Scholar] [CrossRef] [Green Version]
- Gelaro, R.; Mccarty, W.; Suárez, M.J.; Todling, R.; Molod, A.; Takacs, L.; Zhao, B. The modern-era retrospective analysis for research and applications, version 2 (MERRA-2). J. Clim. 2017, 30, 5419–5454. [Google Scholar] [CrossRef]
- Tiwari, S.; Kar, S.C.; Bhatla, R. Snowfall and Snowmelt Variability over Himalayan Region in Inter-annual Timescale. Aquat. Procedia. 2015, 4, 942–949. [Google Scholar] [CrossRef]
- Gorelick, N.; Hancher, M.; Dixon, M.; Ilyushchenko, S.; Thau, D.; Moore, R. Google Earth Engine: Planetary-scale geospatial analysis for everyone. Remote Sens. Environ. 2017, 202, 18–27. [Google Scholar] [CrossRef]
- Muñoz, S.J. ERA5-Land Monthly Averaged Data from 1981 to Present. Copernic. Clim. Chang. Serv. (C3S) Clim. Data Store (CDS) 2019, 146, 1999–2049. [Google Scholar] [CrossRef]
- Biondi, F.; Waikul, K. DENDROCLIM2002: A C++ program for statistical calibration of climate signals in tree-ring chronologies. Comput. Geosci. 2004, 30, 303–311. [Google Scholar] [CrossRef]
- Huang, B.; Thorne, P.W.; Banzon, V.F.; Boyer, T.; Chepurin, G.; Lawrimore, J.H.; Zhang, H.M. Extended reconstructed sea surface temperature, version 5 (ERSSTv5): Upgrades, validations, and intercomparisons. J. Clim. 2017, 30, 8179–8205. [Google Scholar] [CrossRef]
- Jones, P.D.; Jonsson, T.; Wheeler, D. Extension to the North Atlantic Oscillation using early instrumental pressure observations from Gibraltar and South-West Iceland. Int. J. Climatol. 1997, 17, 1433–1450. [Google Scholar] [CrossRef]
- Rayner, N.A.A.; Parker, D.E.; Horton, E.B.; Folland, C.K.; Alexander, L.V.; Rowell, D.P.; Kaplan, A. Global analyses of sea surface temperature, sea ice, and night marine air temperature since the late nineteenth century. J. Geophys. Res. 2003, 108, 4407. [Google Scholar] [CrossRef]
- Sano, M.; Dimri, A.P.; Ramesh, R.; Xu, C.; Li, Z.; Nakatsuka, T. Moisture source signals preserved in a 242-year tree-ring δ18O chronology in the western Himalaya. Glob. Planet. Chang. 2017, 157, 73–82. [Google Scholar] [CrossRef]
- Tang, K.; Feng, X. The effect of soil hydrology on the oxygen and hydrogen isotopic compositions of plants’ source water. Earth Planet. Sci. Lett. 2001, 185, 355–367. [Google Scholar] [CrossRef]
- Rahman, M.H.; Kudo, K.; Yamagishi, Y.; Nakamura, Y.; Nakaba, S.; Begum, S.; Nugroho, W.D.; Arakawa, I.; Kitin, P.; Funada, R. Winter-spring temperature pattern is closely related to the onset of cambial reactivation in stems of the evergreen conifer Chamaecyparis pisifera. Sci. Rep. 2020, 10, 14341. [Google Scholar] [CrossRef]
- Hart, R.; Salick, J.; Ranjitkar, S.; Xu, J. Herbarium specimens show contrasting phonological responses to Himalayan climate. Proc. Natl. Acad. Sci. USA 2014, 111, 10615–10619. [Google Scholar] [CrossRef] [Green Version]
- Kumar, A.; Tiwari, S.K.; Verma, A.; Gupta, A.K. Tracing isotopic signatures (δD and δ18O) in precipitation and glacier melt over Chorabari Glacier–Hydroclimatic inferences for the Upper Ganga Basin (UGB), Garhwal Himalaya. J. Hydrol. 2018, 15, 68–89. [Google Scholar] [CrossRef]
- Wernicke, J.; Grießinger, J.; Hochreuther, P.; Bräuning, A. Variability of summer humidity during the past 800 yearson the eastern Tibetan Plateau inferred from δ18O of tree-ring cellulose. Clim. Past 2015, 11, 327–337. [Google Scholar] [CrossRef] [Green Version]
- Wang, X.; Wang, T.; Guo, H.; Liu, D.; Zhao, Y.; Zhang, T.; Liu, Q.; Piao, S. Disentangling the mechanisms behind winter snow impact on vegetation activity in northern ecosystems. Glob. Chang. Biol. 2017, 24, 1651–1662. [Google Scholar] [CrossRef] [PubMed]
- Zhang, Y.P.; Jiang, Y.; Wang, B.; Jiao, L.; Wang, M.C. Seasonal water use by Larix principis-rupprechtii in an alpine habitat. For. Ecol. Manag. 2018, 409, 47–55. [Google Scholar] [CrossRef]
- West, A.G.; Hultine, K.R.; Burtch, K.G.; Ehleringer, J.R. Seasonal variations in moisture use in a piñon–juniper woodland. Oecologia 2007, 153, 787–798. [Google Scholar] [CrossRef] [PubMed]
- Shekhar, M.S.; Chand, H.; Kumar, S.; Srinivasav, K.; Ganju, A. Climate-change studies in the western Himalaya. Ann.Glaciol. 2010, 51, 105–112. [Google Scholar] [CrossRef] [Green Version]
- Roxy, M.K.; Ritika, K.; Terray, P.; Murtugudde, R.; Ashok, K.; Goswami, B.N. Drying of Indian subcontinent by rapid Indian Ocean warming and a weakening land-sea thermal gradient. Nat. Commun. 2015, 6, 7423. [Google Scholar] [CrossRef] [Green Version]
- Krishnan, R.; Sugi, M. Pacific decadal oscillation and variability of the Indian summer monsoon rainfall. Clim. Dyn. 2003, 21, 233–242. [Google Scholar] [CrossRef]
- Sano, M.; Xu, C.; Nakatsuka, T. A 300-year Vietnam hydroclimate and ENSO variability record reconstructed from tree ring δ18O. J. Geophys. Res. 2012, 117, D12115. [Google Scholar] [CrossRef]
- Liu, X.; An, W.; Treydte, K.; Shao, X.; Leavitt, S.; Hou, S.; Chen, T.; Sun, W.; Qin, D. Tree-ring δ18O in southwestern China linked to variations in regional cloud cover and tropical sea surface temperature. Chem. Geol. 2012, 291, 104–115. [Google Scholar] [CrossRef]
- Xu, C.; Ge, J.; Nakatsuka, T.; Yi, L.; Zheng, H.; Sano, M. Potential utility oftree ringδ18O series for reconstructingprecipitation records from the lower reaches of the Yangtze River, southeast China. J. Geophys. Res. Atmos. 2016, 121, 3954–3968. [Google Scholar] [CrossRef]
- Xu, C.; Pumijumnong, N.; Nakatsuka, T.; Sano, M.; Li, Z. A tree-ring cellulose δ18Obased July–October precipitation reconstruction since AD 1828, northwest Thailand. J. Hydrol. 2015, 529, 433–441. [Google Scholar] [CrossRef]
- Chung, C.E.; Ramanathan, V. Weakening of North Indian SST gradients and the monsoon rainfall in India and the Sahel. J. Clim. 2006, 19, 2036–2045. [Google Scholar] [CrossRef] [Green Version]
- Naidu, C.V.; Durgalakshmi, K.; Muni Krishna, K.; Ramalingeswara, R.S.; Satyanarayana, G.C.; Lakshminarayana, P.; Malleswara, R.L. Is summer monsoon rainfall decreasing over India in the global warming era? J. Geophys. Res. 2009, 114, D24108. [Google Scholar] [CrossRef] [Green Version]
- Zhou, T.; Yu, R.; Li, H.; Wang, B. Ocean forcing to changes in global monsoon precipitation over the recent half-century. J. Clim. 2008, 21, 852. [Google Scholar] [CrossRef]
- Visbeck, M.H.; Hurrell, J.W.; Polvani, L.; Cullen, H.M. The North Atlantic Oscillation: Past, present, and future. Proc. Natl. Acad. Sci. USA 2001, 98, 12876–12877. [Google Scholar] [CrossRef] [Green Version]
- Pinto, J.G.; Raible, C.C. Past and recent changes in the North Atlantic Oscillation. WIREs Clim. Chang. 2012, 3, 79–90. [Google Scholar] [CrossRef] [Green Version]
- Hurrell, J.W. Decadal trends in the North Atlantic Oscillation and relationships to regional temperature and precipitation. Science 1995, 269, 676–679. [Google Scholar] [CrossRef] [Green Version]

Publisher’s Note: MDPI stays neutral with regard to jurisdictional claims in published maps and institutional affiliations. |
© 2022 by the authors. Licensee MDPI, Basel, Switzerland. This article is an open access article distributed under the terms and conditions of the Creative Commons Attribution (CC BY) license (https://creativecommons.org/licenses/by/4.0/).