Article

Reforestation Opportunities in Indonesia: Mitigating Climate Change and Achieving Sustainable Development Goals

1
Yayasan Wineco Indonesia Lestari-Winrock International, Menara Mandiri Tower 2, 17th Floor, Jl. Jend. Sudirman, Kav. 54-55, Jakarta Selatan 12190, Indonesia
2
Forest Research and Development Center, Research, Development and Innovation Agency of the Ministry of Environment and Forestry, Jalan Gunung Batu No. 5, Bogor 16610, Indonesia
3
Deputy of Research and Development, Peatland Restoration Agency, Jalan Teuku Umar No. 10, Jakarta Pusat 10350, Indonesia
4
The Nature Conservancy, Arlington, VA 22203, USA
5
Yayasan Konservasi Alam Nusantara, Graha Iskandarsyah, Jl, Iskandarsyah Raya No.66 C, Jakarta Selatan 12160, Indonesia
*
Author to whom correspondence should be addressed.
Forests 2022, 13(3), 447; https://doi.org/10.3390/f13030447
Submission received: 17 February 2022 / Revised: 8 March 2022 / Accepted: 9 March 2022 / Published: 11 March 2022
(This article belongs to the Special Issue Forest Policy and Global Environmental Governance)

Abstract

:
Reforestation in the tropics is highlighted as an important intervention to mitigate climate change globally because of its potential for high CO2 removal rates, ranging from 4.5 to 40.7 t CO2e ha−1 yr−1 during the first 20 years of tree growth. Reforestation is critical to meeting emissions’ targets of the Paris Climate Agreement, as well as achieving Indonesia’s Nationally Determined Contribution (NDC) targets. Increasing carbon stocks through forest and land rehabilitation activities (RHL) is one of the Ministry of Environment and Forestry (MoEF) five main strategies for reducing greenhouse gas (GHG) emissions from the land sector. This study focuses on reforestation opportunities to support Indonesia’s NDC in reducing GHG emissions by 2030. We identified unproductive areas of land (shrub, open land) with highly degraded conditions as potential areas for reforestation. Based on Indonesian data of land cover change, we found that reforestation activities during 2019–2030 (11 years) under a realistic, ambitious and very ambitious scenario may remove carbon up to −0.25 GtCO2e (equal to −23 MtCO2e yr−1), −1.3 GtCO2e (equal to −124 MtCO2e yr−1) and −2.7 GtCO2e (equal to −247 MtCO2e yr−1), respectively. Based on international data of land cover change (Hansen et al. 2013), reforestation activities during 2019–2030, under a realistic, ambitious, and very ambitious scenario, have the opportunities to remove −17 MtCO2e yr−1, −118 MtCO2e yr−1, and −241 MtCO2e yr−1, respectively. This study demonstrates that ambitious and very ambitious scenarios of reforestation activities can significantly contribute to Indonesia’s forestry-related NDC in 2030 by reducing the Indonesia Business As Usual (BAU) emissions up to 17% and 35%.

Graphical Abstract

1. Introduction

Indonesia is the country with the third-highest annual global greenhouse gas (GHG) emissions (after China and the US), due to emissions from forest loss. Deforestation and forest degradation in tropical forests are major contributors to GHG emissions [1,2]. Avoiding deforestation and increasing afforestation/reforestation have long been recognized as the main actions that need to be taken to stabilize the climate. Austin et al. [3] have projected that avoiding deforestation could mitigate 0.3–1.8 GtCO2 yr−1, while afforestation/reforestation absorbs 0.1–2.6 GtCO2 yr−1, globally, by 2055.
Indonesia is a large nation with approximately 192 million hectares (Mha) of land. Of this area, 120.6 Mha (or 63 percent of the entire land area) is designated as state forest (Kawasan Hutan). Most of Indonesia’s remaining land area is made up of non-forest public lands known as Areas for Other Purposes (Areal Penggunaan Lain, or APL) [4]. FAO research [5] shows that forest cover in Indonesia has decreased from 74% to 54% over a period of 30–40 years, where different regimes have had different main deforestation drivers [6]. Deforestation rates have fluctuated in recent years from a low of 0.40 Mha in 2013–2014 and a high of 1.09 Mha in 2014–2015 (0.45 Mha in 2009–2011, 0.61 Mha in 2011–2012, 0.73 Mha in 2012–2013, 0.63 Mha in 2015–2016, 0.48 Mha in 2016–2017, and 0.44 Mha in 2017–2018) [7]. Indonesia still retains 94.1 Mha of tropical forest [7], the third largest after Brazil and the Democratic Republic of Congo, but deforestation and forest degradation have increased the area in need of forest cover and rehabilitation.
The Indonesian government has made efforts to reduce the rate of deforestation, including through forest and land rehabilitation activities, which have reduced the area of highly degraded land in Indonesia. The latest estimate suggests that there remains 14.01 Mha of degraded land in 2018. Efforts to reduce emissions from deforestation and forest degradation (REDD+) in Indonesia have also been recognized and appreciated globally with the receipt of funds by the Government of Indonesia from the Green Climate Fund (GCF) for 103.8 million USD as performance payments through the Result Based Payment (RBP) scheme. Under the Forest Carbon Partnership Facility (FCPF), a jurisdictional REDD+ program in East Kalimantan is expected to generate 86.3 MtCO2e over the 2020–2024 period [8]. All of these programs do not account for additional sequestration from reforestation activity, which underestimates the potential net emission reductions.
Unlike more nascent technological solutions to climate change (e.g., direct air capture), nature-based climate solutions, or Natural Climate Solutions (NCS), are often more cost-effective and scalable. Reforestation (including restoring forest cover to places that have not had forests in recent history, or “afforestation”) has the highest global potential of all NCS to mitigate climate change [9,10]. Reforestation also has the potential to reverse habitat loss for threatened species across 43% or more of the global restorable area—in particular in Indonesia where there are the greatest opportunities for threatened vertebrate conservation [11].
Reforestation in the tropics is highlighted as a particularly important intervention given the potential for high CO2 absorption rates [12,13]. Tree planting can absorb 4.5 to 40.7 tCO2e ha−1yr−1 during the first 20 years of growth [14]. With the vast area of critically degraded land in Indonesia, reforestation represents an important part of the efforts to improve forest cover and meet Indonesia’s Nationally Determined Contribution (NDC) target in 2030. A previous study [15] estimated 130.97 MtCO2e yr−1 of mitigation potential from reforestation in Indonesia. This study, therefore, aimed to refine the potential carbon removal using three scenarios of reforestation adoption until 2030, and determine how much this pathway could contribute to Indonesia’s emission reduction target as stated in the updated NDC [16].

2. Materials and Methods

We only assessed the opportunity areas in non-peat and non-mangrove areas (hereafter termed “upland”). The available spatial data from MoEF indicates that the area of land and waters in Indonesia is 191 Mha. This includes 15 Mha of peat and 3 Mha of mangroves. Thus, the remaining area examined for this analysis is ±173 Mha.
To estimate mitigation potential from reforestation, we quantified historical rates of forest recovery (“activity data”), potential area of reforestation under three scenarios—realistic, ambitious, and very ambitious—and potential CO2 absorption (“removal factors”) into the above- and belowground biomass and dead organic matter (DOM).

2.1. Activity Data—Reforestation Baseline

Activity data refers to the total area and location of historical reforestation activities using 2000–2012 as a baseline period. We combined spatial global and national data through an overlay process and time series analysis to quantify historical reforestation. Global reforestation data were derived from the forest gain layer in [17], which was clipped to Indonesia’s boundaries. We overlaid provincial boundaries [18], concessions [19], state-forest area [19], land cover types [19], and use permit [20] on the forest gain layer and subtracted global mangrove [21] and peat [22] extents. The forest gain area was verified according to the Indonesian MoEF land cover map and satellite imagery. According to the MoEF of Indonesia, the true historical reforestation class included areas located on top of the existing forested areas, while the false class included areas located on top of non-forested areas in land cover maps and satellite imagery of 2012.

2.2. Activity Data—Reforestation Opportunity in Indonesia
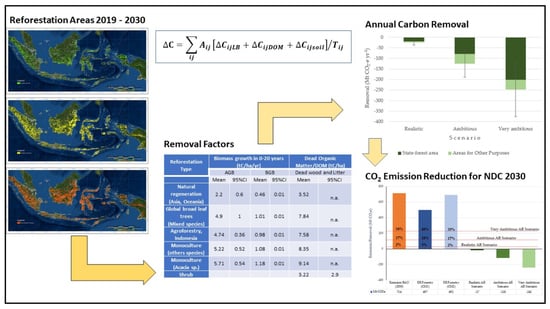
We identified potential areas for reforestation activities in non-forested locations (shrubs, wet shrub, and open-land), both inside and outside the state-forest zone based on a 2019 land cover map [19]. We excluded areas in conservation and protection forests and locations where the land cover is not appropriate for reforestation (agricultural, crop estate). We considered natural reforestation areas as those that could be recovered with natural regeneration, in contrast to areas where intervention is likely, both inside and outside state-forest areas, where mixed, agroforestry and/or monoculture species could be planted. Under Indonesian forestry law (UU No. 1 2004), there should not be any activities in the main zone/block forest conservation area, including planting new trees, other than protection for natural regeneration. Thus, planting mixed tree species, agroforestry, and/or monoculture species should be allocated outside the main zone/block of the forest conservation area.
We designed three scenarios to estimate the possible potential area to be reforested under different criteria. The realistic scenario is defined as reforestation on abandoned land with a wet shrub, shrub, or barren land cover class, listed as having critical and very critical degradation, assuming that these would be rehabilitated according to the Indonesian National Forestry Planning’s plan and targets. The ambitious scenario would have additional areas from those in the moderate class of land degradation, compared to the potential area within the realistic scenario. Meanwhile, the third scenario, which is a very ambitious scenario, was defined as reforestation on abandoned land in the form of wet shrub, shrub, or open-land, including those agriculture and estate cover types within the state-forest area that need to be restored, with a moderate, critical and very critical condition of the land.

2.3. Removal Factor

We followed IPCC Guidelines [23] to estimate growth rates before and after 20 years (tC ha−1yr−1) of each reforestation type (i.e., natural regeneration, planting mixed trees, agroforestry, and monoculture). Using this approach, namely dividing the cumulative stand biomass growth by age (mean increment up to a certain age) is a simplification by assuming a constant growth rate over the selected period, in this case up to the age of 20 years and after 20 years [23].
Growth of belowground biomass before and after 20 years in each reforestation scenario follows the approach of IPCC [23], where the belowground biomass is estimated as a function of a root to shoot ratio (0.207) [24]. The total growth of aboveground and belowground biomass is then presented as total growth in tC ha−1yr−1 absorbed and stored by reforestation activities over time, then converted to annual removal factors as carbon dioxide (tCO2ha−1yr−1) by multiplying tons C by a factor of 3.67 (44 gCO2 to 12 gC). In addition, dead organic matter (necromass) was estimated as a ratio of aboveground biomass (0.08) [25].

2.4. Calculation of Potential Carbon Sequestration for Reforestation Activities

IPCC Guidelines 2006 for GHG Inventory Reporting relating to reforestation activities is included in the AFOLU (Agriculture Forestry and Other Land Use) Sector in the category “Forest Land (3.B.1)”. For reforestation activities, there will be a “Land Converted to Forest Land (3.B.1.a)” process and then, in the following years, there will be a “Forest Land Remaining Forest Land (3.B.1.b)” process. Net emissions from land use and land use change can be estimated based on the equation contained in [23]:
Δ C = Activity   Data   ×   Removal   Factor
where ΔC is the change in carbon stock, the activity data are the area that experiences a certain type of land use change that acts as a carbon sink, and the removal factor is the total absorption of carbon per unit area of land during a particular type of land use change. Carbon removals can be expressed in terms of C or can be converted to CO2. If the activity data take into account all possible land use changes in the classification system, the equation can be written as follows:
Δ C = ij A ij Δ C ijLB + Δ C ijDOM + Δ C ijsoil / T ij
where, ΔC = change in carbon stock in the period of calculation; Aij = activity data or land use area with land cover type i that changes to type j during the observation period; ΔCijLB = change in carbon stock in living biomass (above ground/AGB + below ground/roots/BGB); ΔCijDOM = change in carbon stock in dead organic matter such as litter, dead wood; ΔCijsoil = change in carbon stock in soil organic carbon; Tij = length of observation period and calculation time scale.
Annual changes in soil carbon stocks on mineral soils were assumed to be zero, following the IPCC 2006 Guidelines because of the incomplete scientific basis and the resulting uncertainty. In the Tier 1 method, it is assumed that C stock on mineral soils does not change with management, whereas in Tier 2 or 3, it is not necessary to calculate the change in C stock for mineral soils (i.e., the change in SOC stock is 0).

2.5. Calculation of the Contribution of Reducing Emissions from Reforestation

Calculating the contribution of reduced emissions from reforestation (with planting intervention) for Indonesia’s NDC target in 2030 is a comparative analysis activity between the results of calculating carbon uptake from reforestation activities and the estimated baseline carbon removal (BAU) from 2000 to 2012. BAU carbon removal was the average from historical data, while the increase in absorption from 2019 to 2030 came from adding the potential carbon uptake from areas with reforestation opportunities.

2.6. Uncertainty Analyses

Uncertainties are an important element of a complete GHG inventory. Estimated uncertainty for all estimates can be determined after the uncertainty in activity data and removal factors for each category have been determined, which are then combined to provide information on total uncertainty [23]. This uncertainty is defined as a lack of knowledge about the true value of a variable which can be described as a probability function (PDF) that describes the range and possible values [23].
This study used the simple error propagation equation technique to estimate uncertainty. Trend NDVI was used as a reference in verifying if the forest gain was reforestation activity, in addition to the use of satellite imagery. Reforestation is represented by the positive value of trend NDVI, with an initial threshold of NDVI value for non-forested areas (<0.4). Positive values represent shrub and grassland (approximately 0.2 to 0.4), while higher values indicate tropical rainforests [26].

3. Results and Discussions

3.1. Potential Areas of Reforestation

The area of potential reforestation in Indonesia under the realistic scenario is 1.7 Mha (Figure 1), of which 20% is in locations used for Areas for Other Purposes and the rest is in state-forest areas. State-forest areas that have the potential for reforestation are in conservation and protection forests, industrial plantation forests, community plantation forests, and other forests. Sumatra and Kalimantan Islands have the greatest potential for rreforestation compared to other areas, which is closely related to the history of deforestation and degradation that occurred in these areas. The area of potential rreforestation under the ambitious scenario is 9.5 Mha, where about 62% is in the state-forest area. The area of potential reforestation under the very ambitious scenario is nearly 19 Mha (18.9 Mha), where 81% is in the state-forest area.
Considering the potential area for reforestation activities that do not interfere with national food security and only focus on non-wetlands areas, this study refined the potential areas as reported in [9]. More than 19 Mha of Indonesian territory were previously declared as suitable for reforestation (including afforestation) activities in the global study of [9], but much turned out to be not eligible. Potential areas for reforestation activities throughout Indonesia in 2019 estimated from land cover (shrub, open land, and swamp shrub), based on [9], amounted to only about 3.2 million hectares. The rest are not eligible because they contain existing forests, paddy fields, water bodies, buildings, and other land covers (purple color; Figure 2). On the other hand, the potential reforestation area based on data from [27] amounted to 4.9 Mha. Compared to the potential area for reforestation worldwide, Indonesia contributed only about 0.02%.
Constraining areas with potential for reforestation to non-forest and non-agricultural areas, such as shrubs and open land, suggests that there are at least 3.2 Mha based on refining the global estimate by [9]. We find that the area of potential reforestation can reach around 19 Mha and at least 1.7 Mha under the very ambitious and realistic scenarios, respectively. Thus, reforestation will be a major contribution and achievement in the effort to achieve Indonesia’s emission reduction NDC target by 2030.

3.2. Removal Factor in Reforestation Types

In this study, we grouped reforestation types into four categories: natural growth (natural regeneration); monoculture planting; mixed planting; and agroforestry (Table 1).
Global reforestation activity in the tropics has a carbon uptake rate of 3–7 tC ha−1yr−1 from the Aboveground and Belowground Biomass carbon pools [28,29]. This large range is in part due to the diversity of reforestation types possible. The availability of carbon absorption rate data by reforestation types will greatly support in increasing the accuracy of carbon absorption calculations.

3.3. Potential Carbon Removal

The Indonesian government has implemented a land rehabilitation program to restore land and forest condition. Between 1990 to 2013, about 6.2 million ha of degraded land were rehabilitated with planting activities on 270,000 ha per year [31]. In 2002, there were plans to significantly increase planting activities. According to the Indonesia National Forestry Planning [32] there was 11.6 million ha of degraded land targeted to be rehabilitated by 2030. Despite the large efforts, poor maintenance of the planted trees has limited the success of the rehabilitation program. A study [33] reported that the percentage of planting success was only about 20%.
In the context of calculating the 2019–2030 carbon absorption, based on MoEF land cover data, the very ambitious scenario shows that the potential for carbon removal is 100 times greater than the realistic scenario, this is due to the 11 times larger area included in the very ambitious scenario (19 million ha).
The potential carbon sequestration from reforestation activities during 2019–2030 based on a realistic scenario is −250.5 MtCO2e or an average of −23 MtCO2e per year (Figure 3). The potential area of reforestation is allocated more for agroforestry activities and intensive mixed crops, only few are available for monoculture type, i.e., on industrial and community plantation forests. We determined suitability for agroforestry activities based on the presence of social forestry in state areas (forest and non-forest). Agroforestry activities are a potential type of reforestation and represent a low-hanging fruit of climate change mitigation action [34].
The potential for carbon removal from reforestation activities during 2019–2030 based on an ambitious scenario is −1353 MtCO2e or an average per year of −124 Mt CO2e, while based on the very ambitious scenario, the potential to sequester carbon is −2716 MtCO2e or an annual average of −247 MtCO2e (Figure 3).
Based on data from [9], the potential area for reforestation was 3.2 million ha. This potential area activity is carried out by reforestation until 2030, and it can be estimated that the potential carbon uptake from reforestation activities during 2019–2030 is about −465.5 MtCO2e or an annual average of −42.3 tCO2e. The contribution from the forest area is estimated at −255.4 MtCO2e and other land uses at −210.01 MtCO2e.
The potential for carbon uptake based on data from Griscom’s map [9] is spread over several large islands of Indonesia, where the largest absorption is on the island of Kalimantan (more than 50%). The forest types with the greatest opportunity for carbon sequestration compared to other forest types are community forest types. This is because the conditions of stands in community forest areas are quite diverse, and generally have a lower tree density than conservation forest areas, e.g., protected forest and national parks.
On the other hand, based on data from Bastin’s map [27], the potential for carbon sequestration from agroforestry and mixed forest development on 4.9 million hectares of available land in the period 2019–2030 is around −560 to −580 MtCO2e. If a monoculture type of Acacia mangium is being developed, the potential for carbon absorption will be much greater, namely −680 million tCO2e. This indicates that the potential annual carbon sequestration value is around −50 to −60 million tCO2e. These values are greater than the potential based on data from Griscom’s study [9], which is probably due to the inclusion of peat and mangrove areas in Bastin’s map [27]. It should be noted that in this paper, the authors discussed the use of Acacia mangium in terms of biomass (and C) production or CO2 removal. The potentially negative impact of monoculture development on water management, function, or ecological stability was not been investigated.
We find that the potential total amount of carbon sequestration in Indonesia for 2019 to 2030 is 0.25 to 2.7 GtCO2e, with an average annual absorption of −23 to −247 MtCO2e. Meanwhile, other studies estimate Indonesia’s tropical carbon uptake from reforestation activities for the period 2030–2050 (50 Mt CO2e/year; [10]). Carbon sequestration from reforestation activities in Indonesia has the potential to provide the largest contribution of removal (up to 17%) compared to the contribution of other tropical countries, especially when compared with the potential for carbon uptake from countries in Southeast Asia. This was mainly influenced by the larger area of potential reforestation identified in this study (very ambitious scenario; 18.9 million hectares) compared to the potential area estimated in other study ([9]; 3.2 Mha after adjustments to remove ineligible areas).
The potential for annual carbon sequestration from reforestation activities under an ambitious (−124 Mt CO2eyr−1) and very ambitious scenario (−247 MtCO2eyr−1) in Indonesia in this study are also much greater than the results of the previous study [27] (−50 to −60 tCO2eyr−1). This is also influenced by the larger potential reforestation areas found in this study compared to the potential reforestation areas estimated in Bastin’s map [27] (4.9 million hectares).

3.4. Contribution of Reforestation to Reduce Carbon Emissions

According to Hansen’s tree cover map [17], tree cover gain in Indonesia between 2000 to 2012 was 5.8 million hectares. This is calculated based on changes in tree cover detected through Landsat satellite imagery and field verification. Further analysis was carried out by overlaying the MoEF’s land cover data in 2012 to see that the area identified as gain was a forest in 2012. This analysis on the “Gain 2000–2012” data [17] found that several areas identified as “Gain” were non-forest areas, in the form of agriculture, plantations, savanna, and others (purple and pale brown color; Figure 4).
The areas verified as reforestation activities in 2000–2012 was 716.28 thousand ha (59.69 thousand ha−1yr−1). The change area was identified as natural forest covering 281.45 thousand ha and plantation forest covering 434.82 thousand ha. The carbon absorption value in reforestation activity during 2000–2012 was −70.88 million tCO2e. The average carbon sequestration per year was −5.9 million tons CO2e yr−1.
Taking into account the difference between the potential for carbon sequestration and the historical absorption value (−5.9 million tons of CO2e; [17]), reforestation activities during 2019–2030, based on the realistic, ambitious, and very ambitious scenarios have the potential to reduce carbon emissions by −17 MtCO2e yr−1, −118 MtCO2e yr−1 and −241 MtCO2e yr−1, respectively (Figure 5).
Based on the scenario mentioned above, the potential area of reforestation in Indonesia ranges from 1.7 million ha to 19 million ha. On the other hand, to achieve Indonesia’s NDC target in reducing emissions, one of the programs that will be carried out is the rehabilitation of 12 million ha of degraded land by 2030 or 800 thousand ha yr−1 with survival rates 90% [35]. This study demonstrated that the potential area for reforestation under ambitious and very ambitious scenarios may significantly contribute to Indonesia’s NDC of forestry sector in 2030 by reducing the BAU emission under conditional scenario CM2 (with international support; 692 MtCO2e) up to 18% and 35%, respectively. This contribution could reach up to 25% and 50%, under conditional scenario CM1 (without international support). Considering the historical rate of reforestation, which was about 0.2 million ha, the effort to reach a very ambitious reforestation scenario would need a four-fold increase in effort. In addition, this potential had been designed not to hamper efforts to enhance food security and reduce poverty.
This study also shows that the potential for reforestation specifically in Indonesia has a carbon sequestration potential of about 1 to 5% of the global reforestation sequestration potential estimated in other studies. It was reported that the potential carbon sequestration rates were up to 1.45, 9.5 and 13.8 GtCO2e yr−1 from the forestry sector [36], 4–6 GtCO2e yr−1 according to [37], for global afforestation and reforestation activities, and 3.7 GtCO2e yr−1 from afforestation activities in tropical regions [38].
Indonesian national data and other studies show that the potential value of carbon sequestration from reforestation activities in Indonesia is more than 20 MtCO2e yr−1 up to a maximum of 247 MtCO2e yr−1. The implementation will depend on the ability to carry out reforestation activities by various parties in Indonesia. Based on the monitoring of 2019 GHG emission reduction from the forestry sector [39], the actual carbon removal of reforestation (−0.7 MtCO2e) was still less than the rate of the BAU’s (−2.1 MtCO2e). Reforestation should not only focus on the criticality of land degradation but also consider the social modality of communities. The activities may be better to prioritize the area with high social modality, where stakeholders are eager to collaborate and implement land rehabilitation.
In addition, it is wise to consider reforestation costs and possibilities for future economic use of stands. Cook-Patton et al. in [40] discussed that reforestation (or forest restoration) is the more costly NCS option to mitigate climate change as compared to the protection of native forests and improvement of forest management. Thus, implementing reforestation should not be a substitute for forest protection and management improvement. However, beyond mitigating climate change, reforestation could also support food security in the future. Tree species used in the reforestation will be better to accommodate the local inhabitants’ preferences on those species that provide useful non-timber forest products including food (NTFPs).

3.5. Uncertainty Analysis

Historical reforestation, especially those new-planted trees, may not be detected through remote sensing technologies. Planting activities may also represent the assumption that all trees are able to survive in the reforestation process. These may add to the uncertainty of this study, which time series analysis had suppressed. However, these analyses verified that the historical reforestation data were actually forested during the analysis period.
Uncertainty for activity data was compiled based on the uncertainty value of the global potential reforestation area of 66% (230–1.125 million hectares; 95% CI; [9]). Meanwhile, uncertainty on the tree cover gain from Hansen et al. [17] was very small. User accuracy was 82%, producer accuracy value was 40.8%, and overall accuracy value was 99.7%. Uncertainty of activity data in areas of potential carbon absorption in 2030 is determined based on the accuracy of the 2019 MoEF land cover map of 88% (uncertainty = 12%).
Uncertainty estimates on areas of historical reforestation was carried out by verification at several random sampling points with 95 points (48 gain, 47 non-gain). The verification process was carried out by comparing the gain area at several points with the 2000 to 2012 trend NDVI value, where there is a positive trend indicating the area is a tree cover gain area. The user’s accuracy value for a gain was 0.63, the producer accuracy was 0.6, and the overall accuracy was 0.6.
The uncertainty value of removal factor (tC ha−1yr−1) was determined at a 95% confidence level for each reforestation type. Reforestation with the planting of mixed forest types, the uncertainty value is 1.0 tC ha−1yr−1 (14.5%), less than the uncertainty value for natural regeneration, which is 0.6 tC ha−1yr−1 (18.8%; [28]).
The combined uncertainty value of carbon sequestration from reforestation activities in Indonesia (MtCO2e yr−1) can be estimated at 31% for planting monoculture and agroforestry forest types. Meanwhile, reforestation activities through natural regeneration and mixed forest have a combined uncertainty value of 32%.

4. Conclusions

To be more cost-effective and scalable, reforestation should provide a high potential to mitigate climate change. This study showed that Ambitious and Very Ambitious scenarios of reforestation activities in Indonesia can significantly contribute to its Nationally Determined Contribution in 2030 of forestry by reducing the Indonesia BAU emission by up to 17% and 35%. The potential for carbon uptake from reforestation activities during 2019–2030 may reach as much as −2.7 GtCO2e. In general, based on Indonesian national data and other studies, the potential value of carbon sequestration from reforestation activities in Indonesia is more than 20 MtCO2e yr−1 up to a maximum of 247 MtCO2e yr−1.

Author Contributions

Conceptualization, I.B., W.C.A., N.A.U., A.S. and D.H.T.; methodology, I.B., W.C.A., N.A.U., A.S. and D.H.T.; software, I.B., W.C.A., N.A.U., A.S. and D.H.T.; validation, I.B., W.C.A. and A.S.; formal analysis, I.B. and W.C.A.; investigation, I.B., W.C.A., N.A.U., A.S., D.H.T. and N.N.; resources, I.B., W.C.A., N.N. and S.C.C.-P.; data curation, I.B., W.C.A., A.S. and N.N.; writing—original draft preparation, I.B., W.C.A., N.A.U., A.S. and D.H.T.; writing—review and editing, I.B., W.C.A., N.A.U., D.H.T., N.N., H.K. and S.C.C.-P.; visualization, I.B., W.C.A. and A.S.; supervision, N.N., H.K. and S.C.C.-P.; project administration, N.N. and S.C.C.-P.; funding acquisition, N.N. and S.C.C.-P. All authors have read and agreed to the published version of the manuscript.

Funding

This research was funded by [NORAD] grant number [GLO-4251 QZA-16/0172] And The APC was funded by [Bezos Earth Fund].

Institutional Review Board Statement

Not applicable.

Informed Consent Statement

Not applicable.

Data Availability Statement

Data that supported the result of this paper can be found by direct request to the authors.

Acknowledgments

We thank the Research and Development Center on Social Economic Policy and Climate Change, Directorate General of Forestry Planning and Environmental Management (PKTL)—The Ministry of Environment and Forestry who kindly supported this research and all our colleagues who kindly provided information. We wish to thank Lilik Budi Prasetyo and Anna Tosiani for their constructive suggestions during project data analyses.

Conflicts of Interest

The authors declare that they have no known competing financial interests or personal relationships that could have appeared to influence the work reported in this paper.

References

  1. Fearnside, P. Global Warming and Tropical Land-Use Change: Greenhouse Gas Emissions from Biomass Burning, Decomposition and Soils in Forest Conversion, Shifting Cultivation and Secondary Vegetation. Clim. Change 2000, 46, 115–158. [Google Scholar] [CrossRef]
  2. Houghton, R.A. Carbon Emissions and the Drivers of Deforestation and Forest Degradation in the Tropics. Curr. Opin. Environ. Sustain. 2012, 4, 597–603. [Google Scholar] [CrossRef]
  3. Austin, K.G.; Baker, J.S.; Sohngen, B.L.; Wade, C.M.; Daigneault, A.; Ohrel, S.B.; Ragnauth, S.; Bean, A. The Economic Costs of Planting, Preserving, and Managing the World’s Forests to Mitigate Climate Change. Nat. Commun. 2020, 11, 5946. [Google Scholar] [CrossRef] [PubMed]
  4. Ministry of Environment and Forestry [MoEF]. The State of the Indonesia’s Forests; Ministry of Environment and Forestry: Jakarta, Indonesia, 2018; ISBN 978-602-8358-82-8. [Google Scholar]
  5. Food and Agricultural Organization [FAO]. Situation and Outlook of the Forestry Sector in Indonesia; Food and Agricultural Organization: Rome, Italy, 1990; Volume 1. [Google Scholar]
  6. Tsujino, R.; Yumoto, T.; Kitamura, S.; Djamaluddin, I.; Darnaedi, D. History of Forest Loss and Degradation in Indonesia. Land Use Policy 2016, 57, 335–347. [Google Scholar] [CrossRef]
  7. Ministry of Environment and Forestry [MoEF]. Deforestasi Indonesia Tahun, 2018–2019; Ministry of Environment and Forestry: Jakarta, Indonesia, 2020. [Google Scholar]
  8. Forest Carbon Partnership Facility [FCPF]. Emission Reductions Program Document (ER-PD): East Kalimantan Jurisdictional Emission Reductions Program, Indonesia. Available online: https://www.forestcarbonpartnership.org/system/files/documents/ERPD_Indonesia%20FINAL%20VERSION_MAY_2019.pdf (accessed on 16 February 2022).
  9. Griscom, B.W.; Adams, J.; Ellis, P.W.; Houghton, R.A.; Lomax, G.; Miteva, D.A.; Schlesinger, W.H.; Shoch, D.; Siikamäki, J.V.; Smith, P.; et al. Natural Climate Solutions. Proc. Natl. Acad. Sci. USA 2017, 114, 11645–11650. [Google Scholar] [CrossRef] [PubMed] [Green Version]
  10. Griscom, B.W.; Griscom, B.W.; Busch, J.; Cook-patton, S.C.; Ellis, P.W.; Funk, J.; Leavitt, S.M.; Lomax, G.; Turner, W.R.; Chapman, M.; et al. National Mitigation Potential from Natural Climate Solutions in the Tropics. Philos. Trans. R. Soc. B Biol. Sci. 2020, 375, 20190126. [Google Scholar] [CrossRef] [PubMed] [Green Version]
  11. Kemppinen, K.M.S.; Collins, P.M.; Hole, D.G.; Wolf, C.; Ripple, W.J.; Gerber, L.R. Global Reforestation and Biodiversity Conservation. Conserv. Biol. 2020, 34, 1221–1228. [Google Scholar] [CrossRef] [PubMed]
  12. Locatelli, B.; Catterall, C.P.; Imbach, P.; Kumar, C.; Lasco, R.; Marín-Spiotta, E.; Mercer, B.; Powers, J.S.; Schwartz, N.; Uriarte, M. Tropical Reforestation and Climate Change: Beyond Carbon. Restor. Ecol. 2015, 23, 337–343. [Google Scholar] [CrossRef]
  13. Busch, J.; Engelmann, J.; Cook-Patton, S.C.; Griscom, B.W.; Kroeger, T.; Possingham, H.; Shyamsundar, P. Potential for Low-Cost Carbon Dioxide Removal through Tropical Reforestation. Nat. Clim. Chang. 2019, 9, 463–466. [Google Scholar] [CrossRef]
  14. Bernal, B.; Murray, L.T.; Pearson, T.R.H. Global Carbon Dioxide Removal Rates from Forest Landscape Restoration Activities. Carbon Balance Manag. 2018, 13, 22. [Google Scholar] [CrossRef] [PubMed]
  15. Griscom, B.W.; Adams, J.; Ellis, P.W.; Houghton, R.A.; Lomax, G.; Miteva, D.A.; Schlesinger, W.H.; Shoch, D.; Siikamäki, J.V.; Smith, P.; et al. Welcome to the Natural Climate Solutions World Atlas. Available online: https://nature4climate.org/n4c-mapper/ (accessed on 10 June 2021).
  16. Government of Indonesia [GOI]. Updated Nationally Determined Contribution Republic of Indonesia; Ministry of Environment and Forestry, Directorate General of Climate Change: Jakarta, Indonesia, 2021; Available online: https://www4.unfccc.int/sites/ndcstaging/PublishedDocuments/Indonesia%20First/Updated%20NDC%20Indonesia%202021%20-%20corrected%20version.pdf (accessed on 16 February 2022).
  17. Hansen, M.C.; Potapov, P.V.; Moore, R.; Hancher, M.; Turubanova, S.A.; Tyukavina, A.; Thau, D.; Stehman, S.V.; Goetz, S.J.; Loveland, T.R.; et al. High-Resolution Global Maps of 21st-Century Forest Cover Change. Science 2013, 342, 850–853. [Google Scholar] [CrossRef] [PubMed] [Green Version]
  18. Open Street Map [OSM]. Planet Dump Retrieved. Available online: https://planet.osm.org (accessed on 18 February 2021).
  19. Ministry of Environment and Forestry [MoEF]. Digital Forest Land Use, Land Cover and Administrative Boundary Maps. Available online: http://Webgis.Menlhk.Go.Id:8080/Kemenhut/Index.Php/Id/ (accessed on 18 February 2021).
  20. Badan Pertanahan Nasional [BPN]. Peta Hak Guna Usaha 2019; Badan Pertanahan Nasional: Jakarta, Indonesia, 2019. [Google Scholar]
  21. Giri, C.; Ochieng, E.; Tieszen, L.L.; Zhu, Z.; Singh, A.; Loveland, T.; Masek, J.; Duke, N. Status and Distribution of Mangrove Forests of the World Using Earth Observation Satellite Data. Glob. Ecol. Biogeogr. 2011, 20, 154–159. [Google Scholar] [CrossRef]
  22. Ritung, S.; Wahyunto, N.K.; Sukarman, H.; Suparto, T.C. Peta Lahan Gambut Indonesia; Kementerian Pertanian: Jakarta, Indonesia, 2011. [Google Scholar]
  23. Intergovernmental Panel on Climate Change [IPCC]. 2006 IPCC Guidelines for National Greenhouse Gas Inventories Programme; Eggleston, H.S., Buendia, L., Miwa, K., Ngara T. and Tanabe, K., Eds.; Institute for Global Environmental Strategies: Kanagawa, Japan, 2006. [Google Scholar]
  24. Intergovernmental Panel on Climate Change [IPCC]. Fundamental and Applied Climatology. In 2019 Refinement to the 2006 IPCC Guidelines for National Greenhouse Gas Inventories; Buendia, E.C., Tanabe, K., Eds.; IPCC Task Force on National Greenhouse Gas Inventories: Geneva, Switzerland, 2019; Volume 2, pp. 5–13. [Google Scholar]
  25. United Nations Framework Convention on Climate Change [UNFCCC]. Estimation of Carbon Stocks and Change in Carbon Stocks in Dead Wood and Litter in A/R CDM Project Activities Version 2.0.0. EB 67 Report Annex 23. 2012. Available online: https://cdm.unfccc.int/methodologies/ARmethodologies/tools/ar-am-tool-12-v2.0.0.pdf (accessed on 16 February 2022).
  26. Weier, J.; Herring, D. Measuring Vegetation (NDVI & EVI); NASA Earth Observatory: Washington, DC, USA, 2019. [Google Scholar]
  27. Bastin, J.F.; Finegold, Y.; Garcia, C.; Mollicone, D.; Rezende, M.; Routh, D.; Zohner, C.M.; Crowther, T.W. The Global Tree Restoration Potential. Science 2019, 364, 76–79. [Google Scholar] [CrossRef] [PubMed]
  28. Bernal, B.; Sidman, G.; Murray, L.; Pearson, T.R. Global Forest GHG Emissions and FLR CO 2 Removals Databases; Winrock International: Arlington, TX, USA, 2017. [Google Scholar]
  29. Imanuddin, R.; Adinugroho, W.C.; Krisnawati, H. Carbon Stock in Selected Tree Plantations, as Compared with Natural Forest in Indonesia. In Proceedings of the IUFRO INAFOR Joint International Conference, Yogyakarta, Indonesia, 24–27 July 2017. [Google Scholar]
  30. Basuki, I.; Adinugroho, W.C.; Utomo, N.A.; Syaugi, A. Mitigasi Perubahan Iklim dan Pencapaian SDG: Perhitungan Potensi Penurunan Emisi dari Reforestasi/Aforestasi untuk Pencapaian Target NDC dan Ketahanan Pangan Indonesia; Center for International Forestry Research (CIFOR): Bogor, Indonesia, 2021. [Google Scholar]
  31. Nawir, A.A. Rehabilitasi Hutan di Indonesia: Akan Kemanakah Arahnya Setelah Lebih Dari Tiga Dasawarsa? Center for International Forestry Research (CIFOR): Bogor, Indonesia, 2008. [Google Scholar]
  32. Ministry of Environment and Forestry [MoEF]. Rencana Kehutanan Tingkat Nasional (REVISI), 2011-2030; Kementerian Kehutanan: Jakarta, Indonesia, 2019. [Google Scholar]
  33. Boer, R. Potential of Reducing GHG Emission from REDD+ Activities in Indonesia. Enabling Asia Stabilise Clim. 2016, 177–208. [Google Scholar] [CrossRef] [Green Version]
  34. Nair, P.K.R. Climate Change Mitigation: A Low-Hanging Fruit of Agroforestry. In Agroforestry—The Future of Global Land Use; Springer: Berlin/Heidelberg, Germany, 2012; pp. 31–67. ISBN 9789400746763. [Google Scholar]
  35. Ministry of Environment and Forestry [MoEF]. Buku Strategi Implementasi NDC (Nationally Determined Contribution); Masripatin, N., Ed.; Ministry of Environment and Forestry: Jakarta, Indonesia, 2017. [Google Scholar]
  36. Intergovernmental Panel on Climate Change [IPCC]. Climate Change 2014: Mitigation of Climate Change. Contribution of Working Group III to the Fifth Assessment Report of the Intergovernmental Panel on Climate Change; Cambrige University Press: Cambridge, UK, 2014; ISBN 9781107654815. [Google Scholar]
  37. Brown, S.; Sathaye, J.; Cannell, M.; Kauppi, P. Management of Forests for Mitigation of Greenhouse Gas Emissions. In Climate Change 1995: Impacts, Adaptions and Mitigation of Climate Change: Scientific-Technical Analyses; Cambridge University Press: Cambridge, UK, 1996; pp. 773–798. [Google Scholar]
  38. Smith, L.J.; Torn, M.S. Ecological Limits to Terrestrial Biological Carbon Dioxide Removal. Clim. Change 2013, 118, 89–103. [Google Scholar] [CrossRef] [Green Version]
  39. Ministry of Environment and Forestry [MoEF]. Laporan Inventarisasi Gas Rumah Kaca, Monitoring, Pelaporan, Dan Verifikasi Nasional; Ministry of Environment and Forestry: Jakarta, Indonesia, 2020. [Google Scholar]
  40. Cook-Patton, S.C.; Drever, C.R.; Griscom, B.W.; Hamrick, K.; Hardman, H.; Kroeger, T.; Pacheco, P.; Raghav, S.; Stevenson, M.; Webb, C.; et al. Protect, manage and then restore lands for climate mitigation. Nat. Clim. Chang. 2021, 11, 1027–1034. [Google Scholar] [CrossRef]
Figure 1. Map of reforestation opportunities in Indonesia based on (a). Realistic (bright green, above); (b). Ambitious (bright yellow, middle); and (c). Very Ambitious (bright orange, below) scenarios.
Forests 13 00447 g001
Figure 2. Example of validation process on the ineligible reforestation potential area (purple color) from [9] using Landsat imageries with 30m spatial resolution.
Forests 13 00447 g002
Figure 3. Mean annual carbon sequestration potential of reforestation in 2019–2030 with realistic, ambitious, and very ambitious scenarios. Error bars show ± standard error (SE) of the removal.
Forests 13 00447 g003
Figure 4. Example of validation process on the ineligible reforestation pixels (purple and pale brown color) from Hansen’s forest gain [17] using Landsat imagery with 30m spatial resolution.
Forests 13 00447 g004
Figure 5. Carbon emission reduction opportunities from reforestation in 2030 with realistic, ambitious, and very ambitious scenarios, and the Indonesia NDC emission reduction target from the forestry sector (BAU, CM1 and CM2 scenarios).
Forests 13 00447 g005
Table 1. Annual biomass growth and dead organic matter accumulation value by reforestation types used in this study.
Reforestation TypeBiomass Growth in 0–20 Years (tC/ha/yr)Dead Organic Matter/DOM (tC/ha)Sources
AGBBGBDead Wood and Litter
Mean95%CIMean95%CIMean95%CI
Natural
regeneration
(Asia, Oceania)
2.20.60.460.013.52n.a.[28]
Global broad leaf trees (Mixed species)4.911.010.017.84n.a.[28]
Agroforestry,
Indonesia
4.740.360.980.017.58n.a.[30]
Monoculture
(others species)
5.220.521.080.018.35n.a.[29]
Monoculture
(Acacia sp.)
5.710.541.180.019.14n.a.[29]
Shrub 3.222.9[30]
Publisher’s Note: MDPI stays neutral with regard to jurisdictional claims in published maps and institutional affiliations.

