
Precipitation and Streamflow Reconstructions from Tree Rings for the Lower Kızılırmak River Basin, Turkey


Abstract
:1. Introduction
2. Materials and Methods
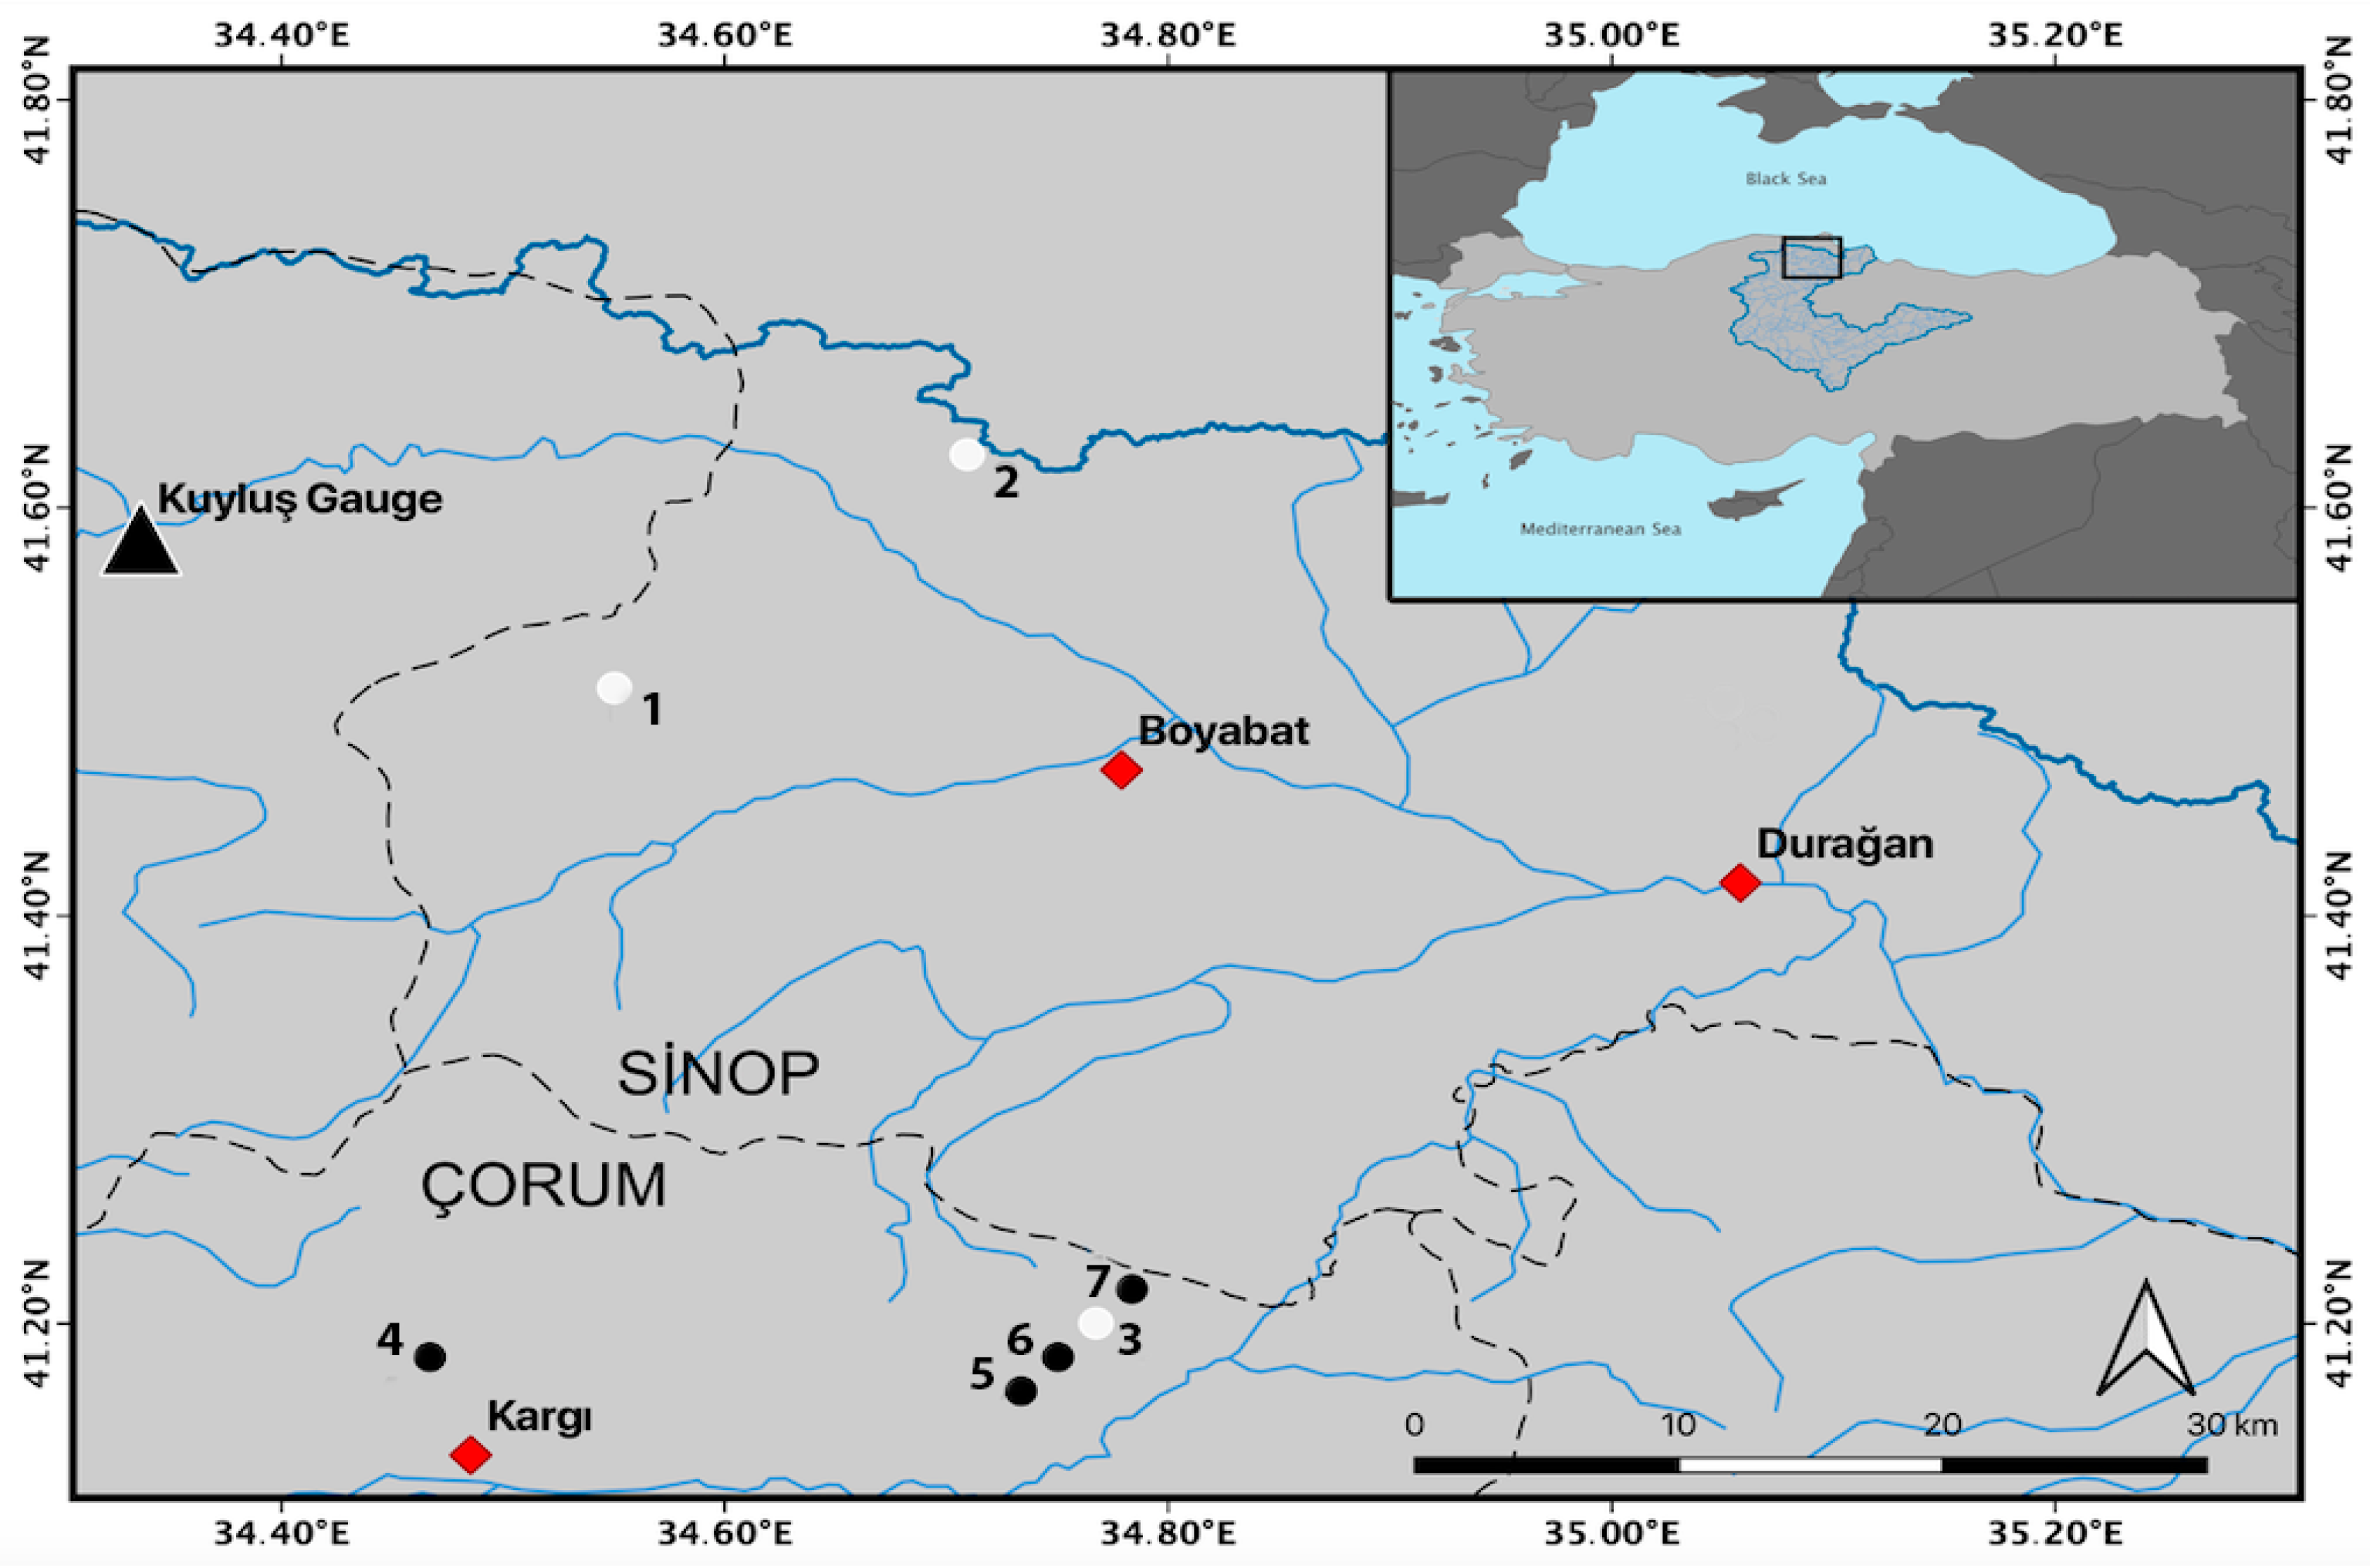
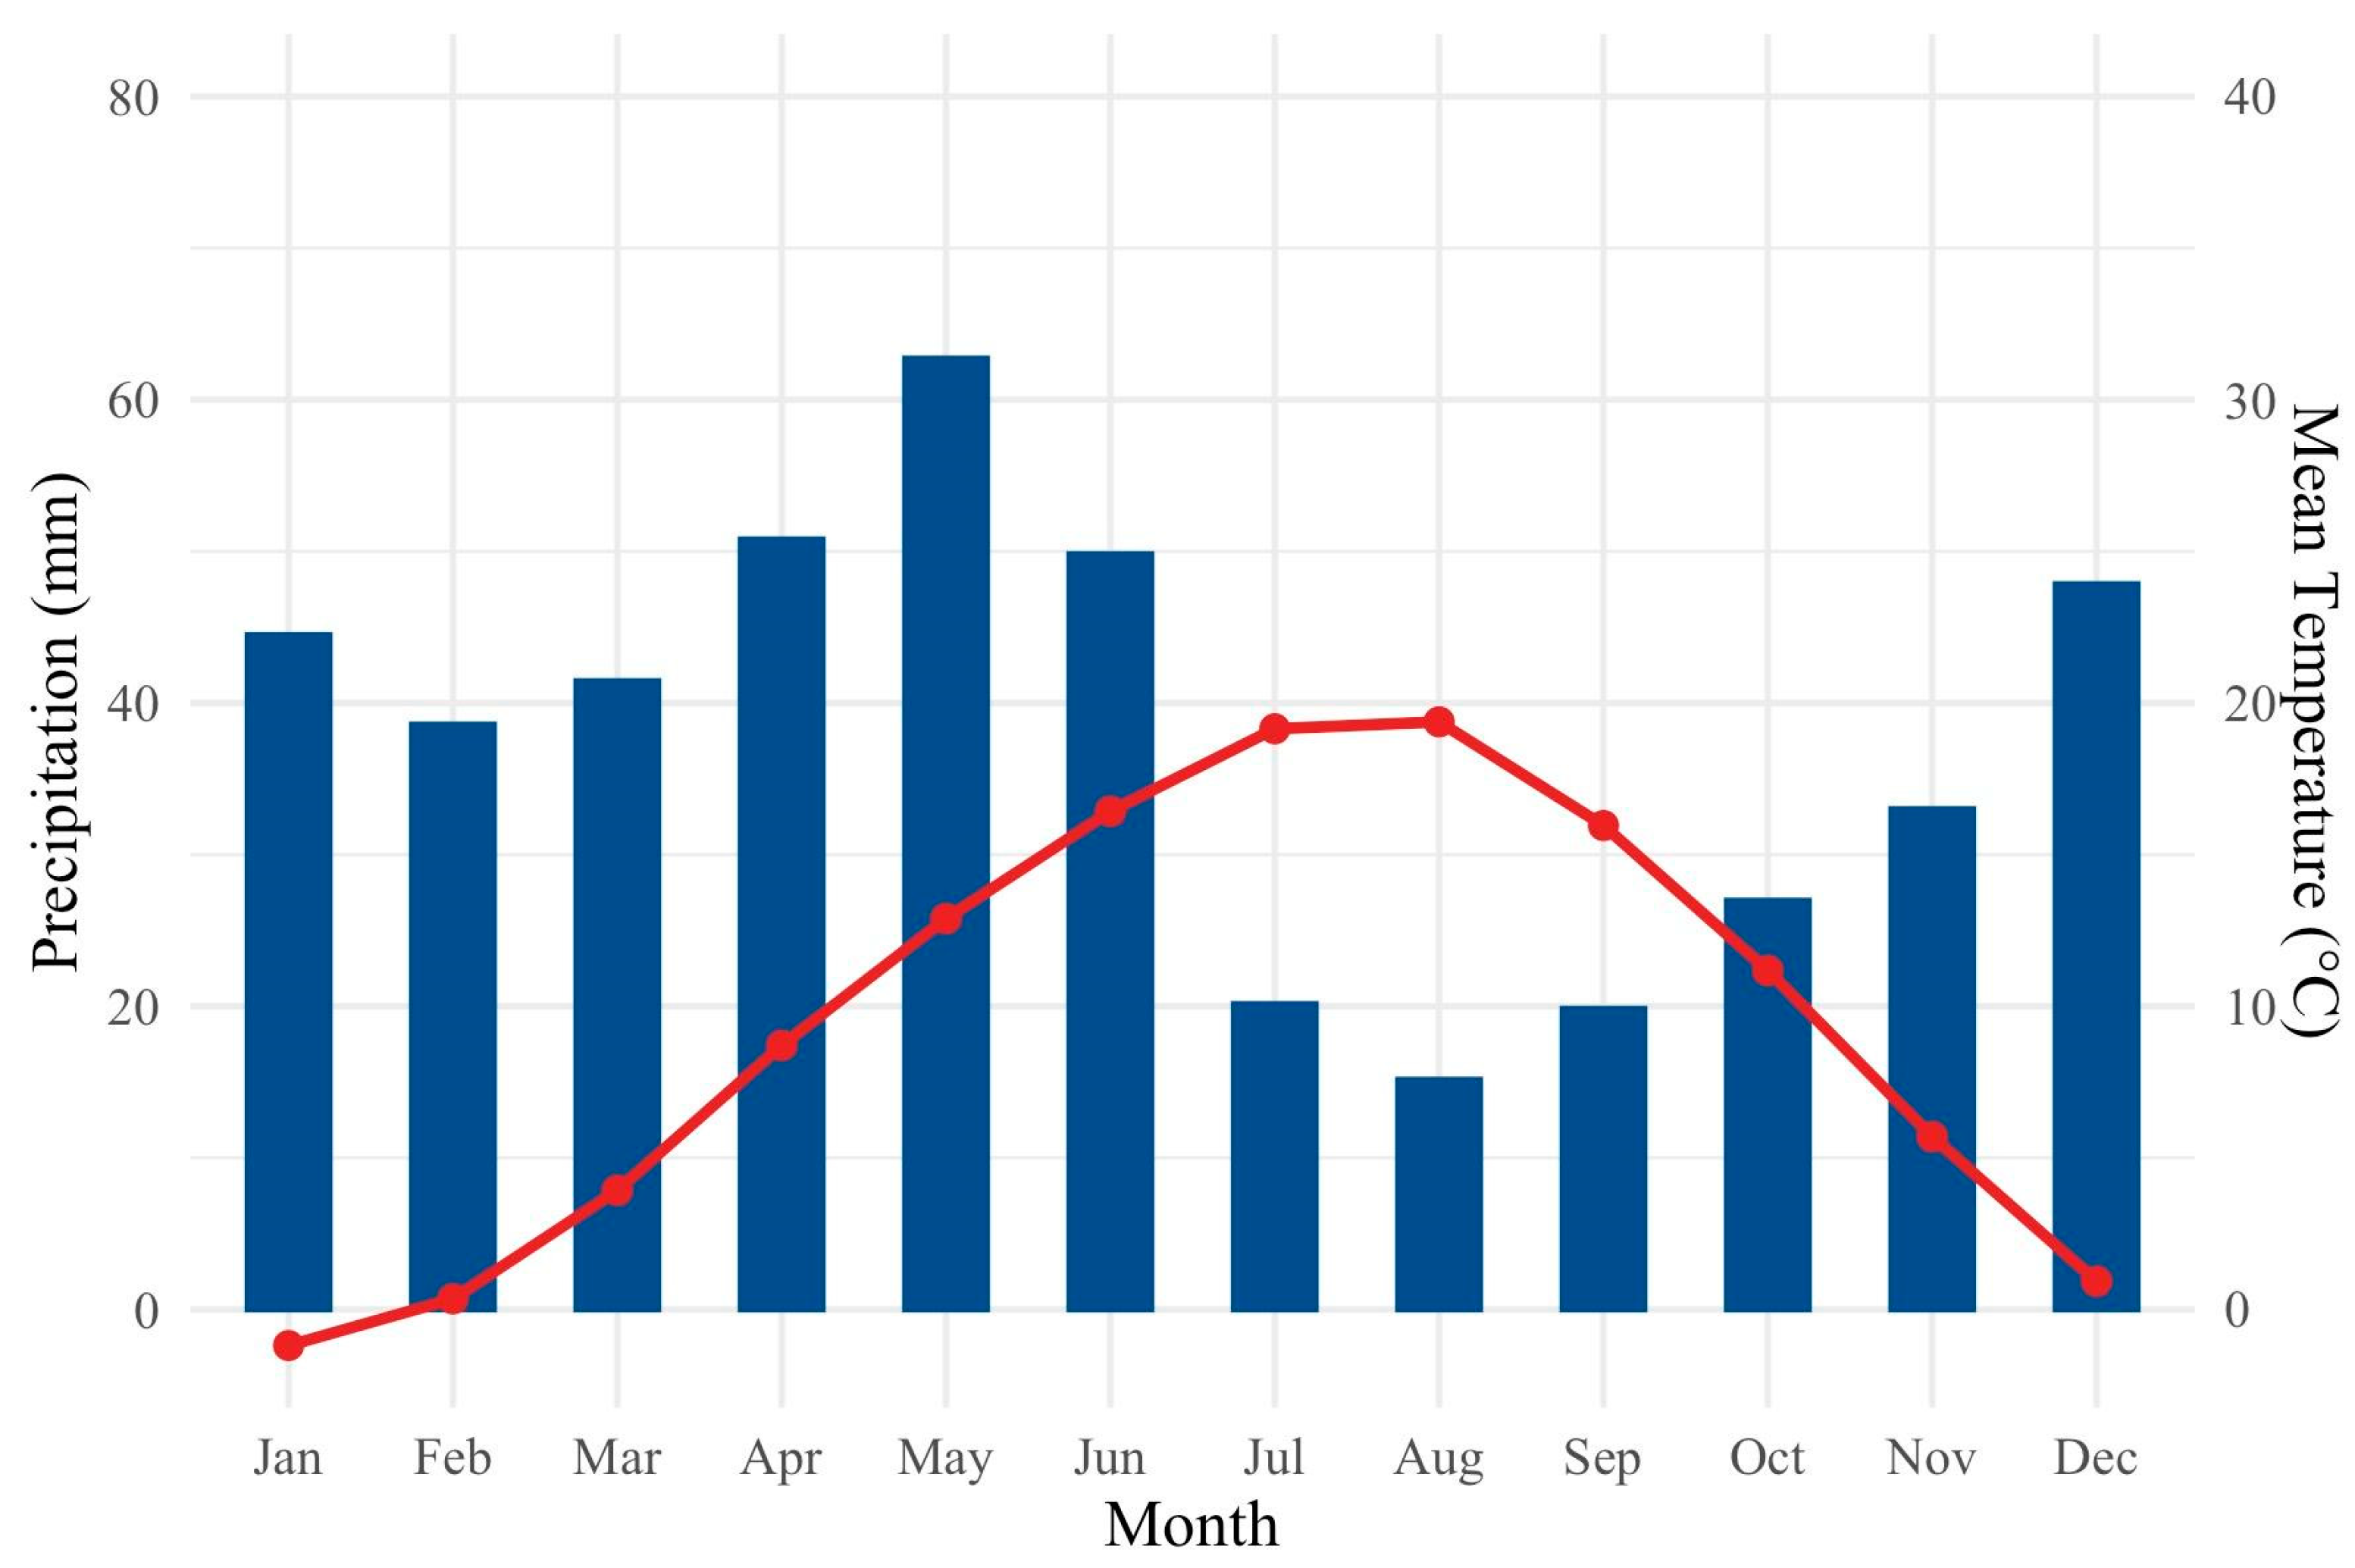
2.1. Study Area
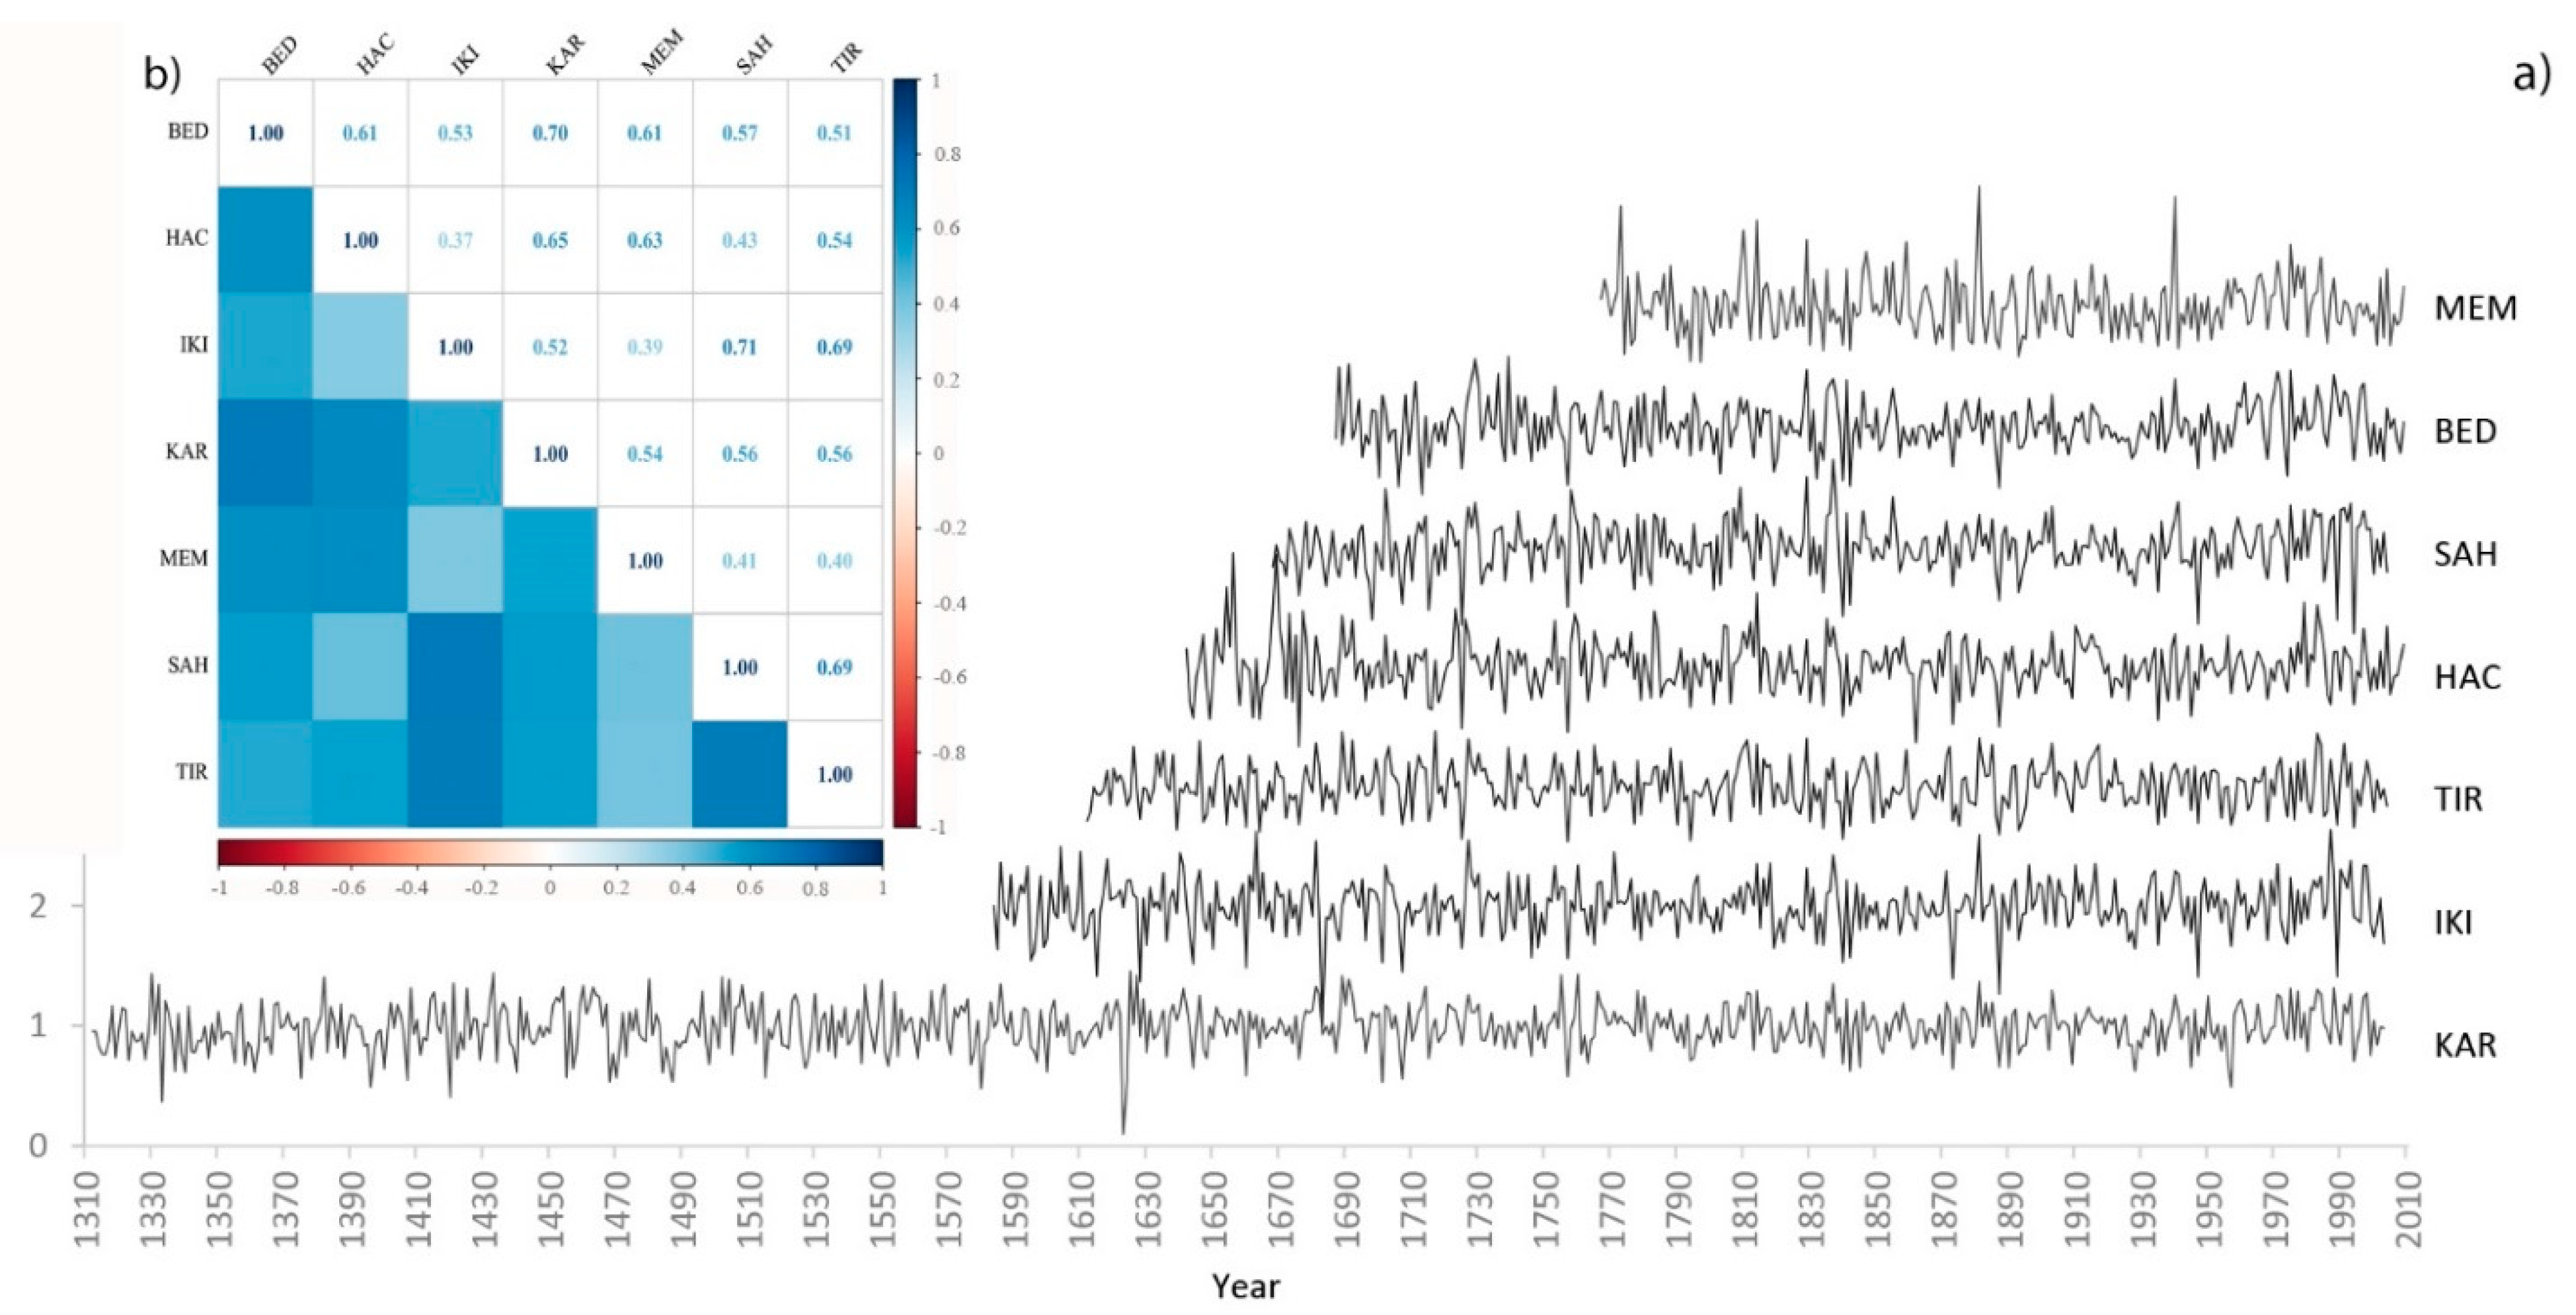
2.2. Tree-Ring Data
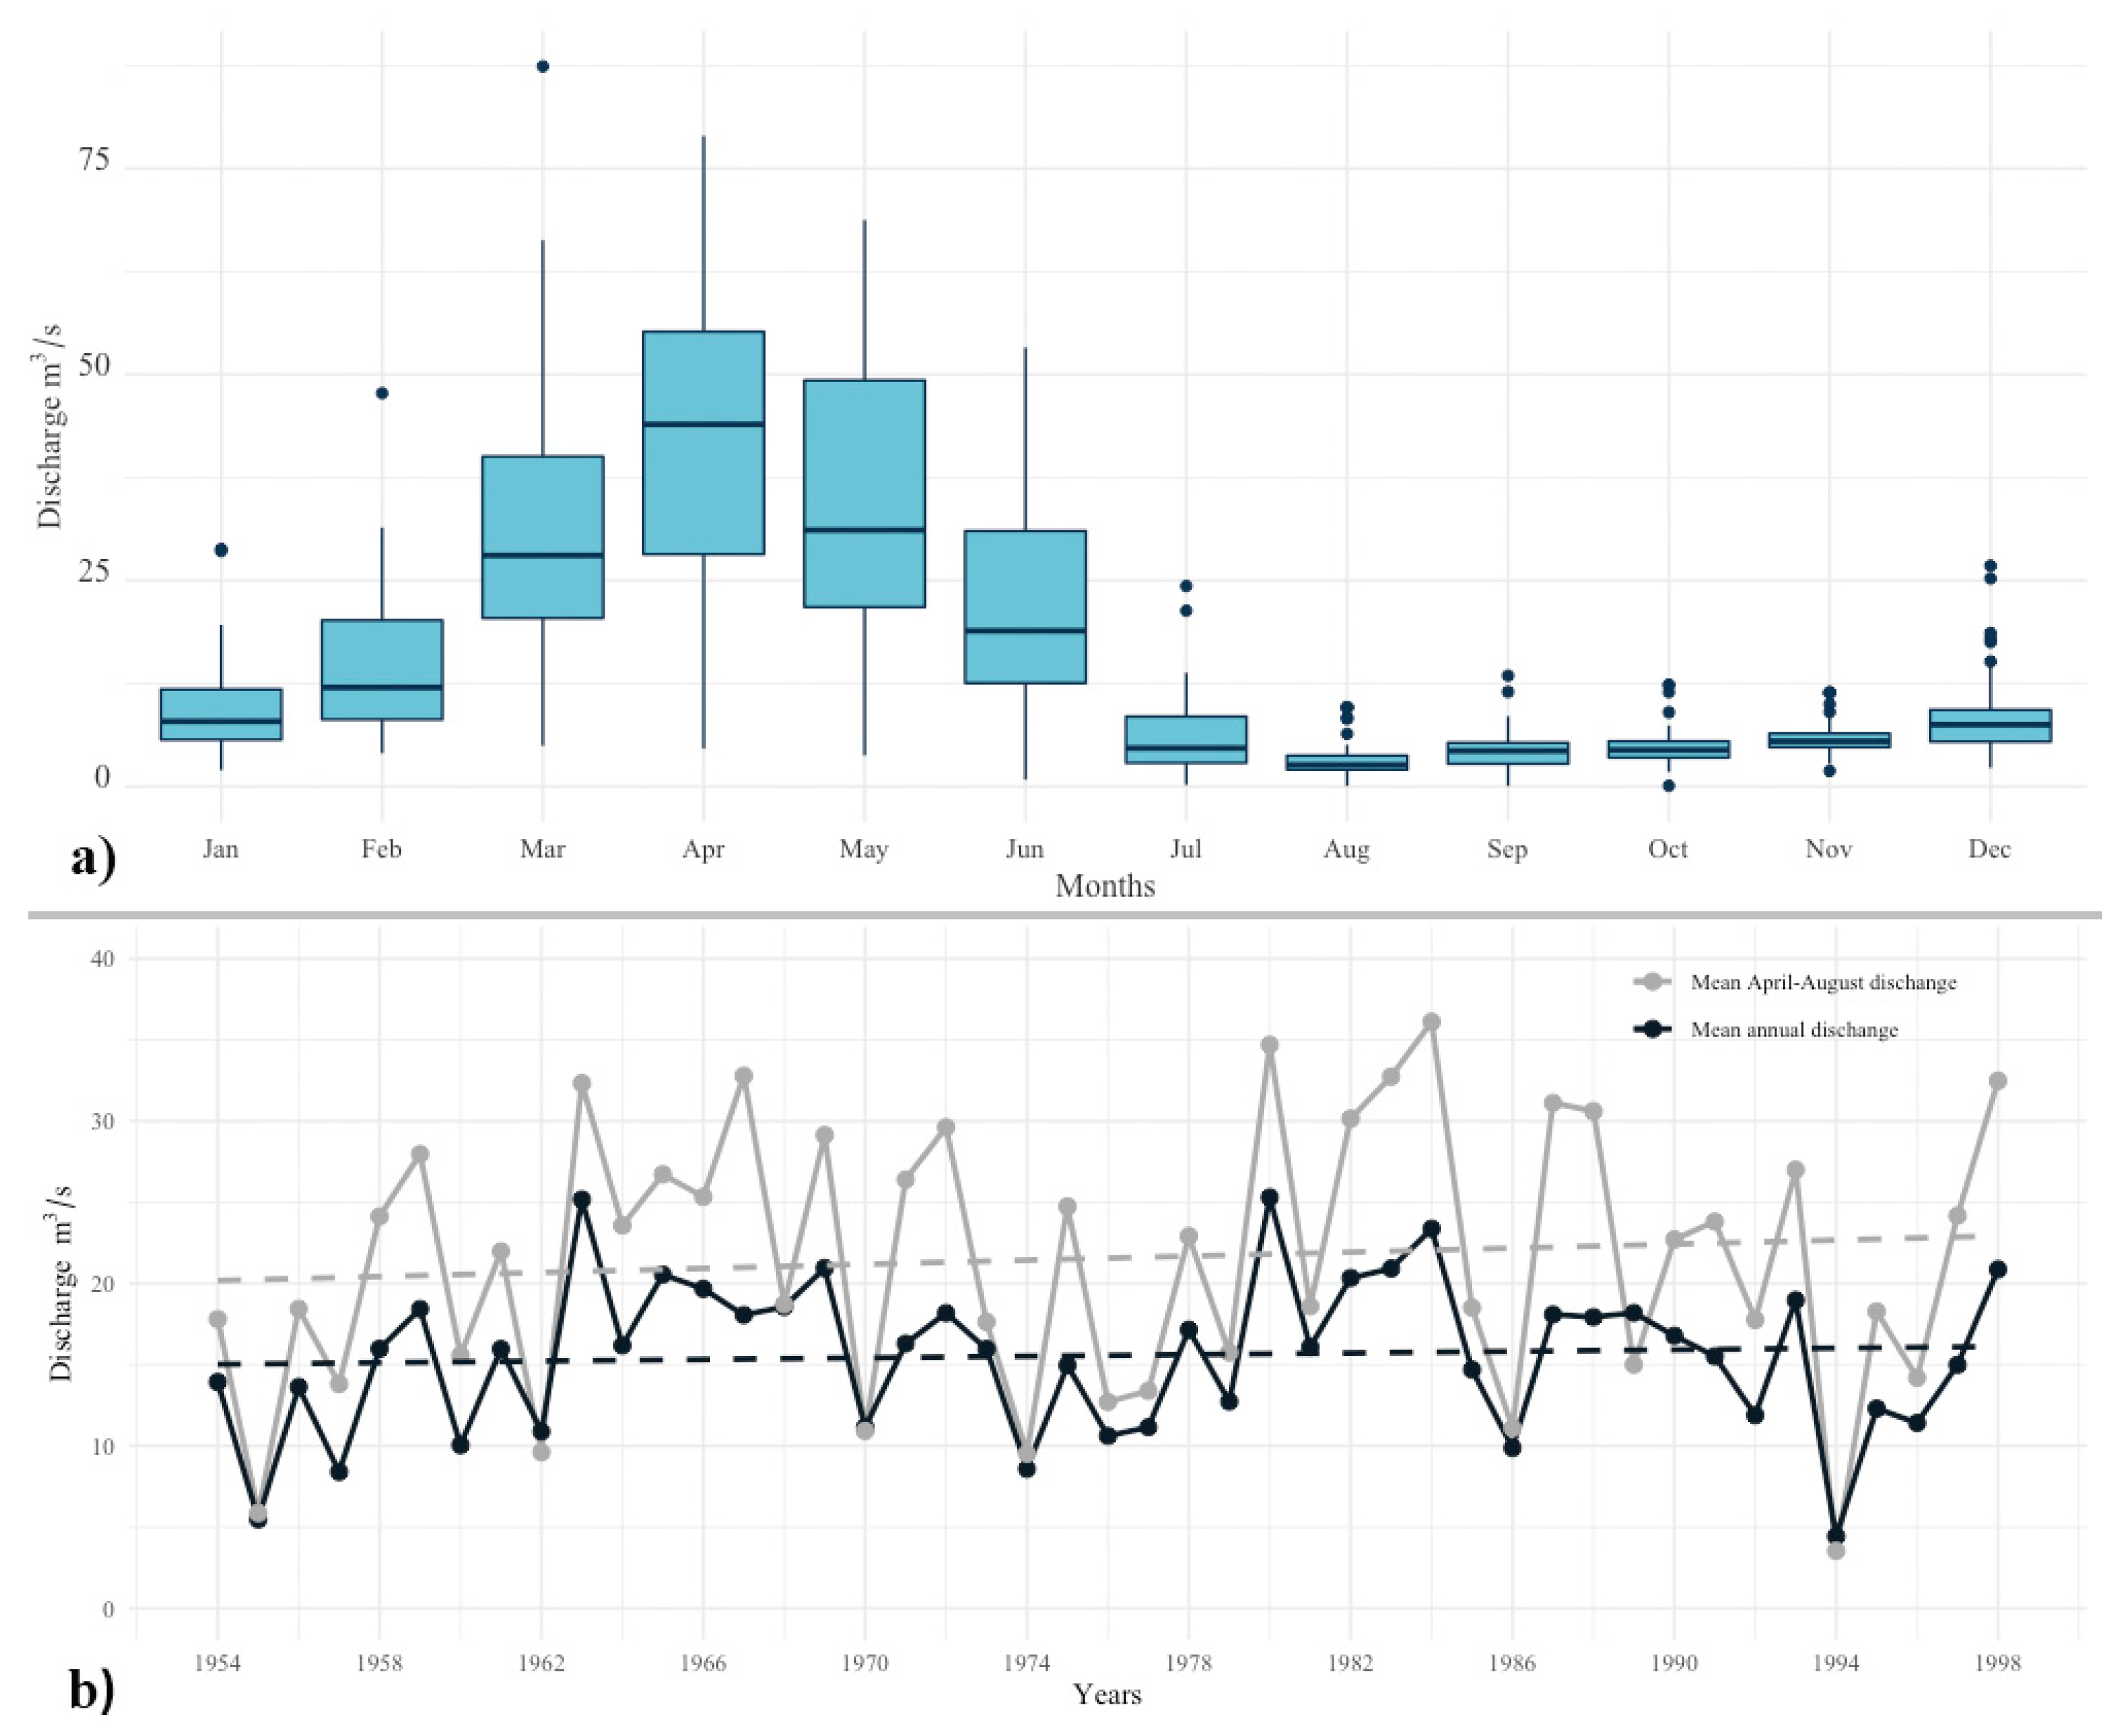
2.3. Streamflow and Climate Data
2.4. Hydroclimate Reconstructions
3. Results
3.1. Tree-Ring Data
3.2. Hydroclimate Reconstructions
4. Discussion
5. Conclusions
Author Contributions
Funding
Data Availability Statement
Acknowledgments
Conflicts of Interest
References
- Bègin, Y. Reconstruction of Subarctic Lake Levels Over Past Centuries using Tree Rings. J. Cold Reg. Eng. 2000, 14, 192–212. [Google Scholar] [CrossRef]
- Chen, F.; Shang, H.; Panyushkina, I.; Meko, D.; Li, J.; Yuan, Y.; Yu, S.; Chen, F.; He, D.; Luo, X. 500-year tree-ring reconstruction of Salween River streamflow related to the history of water supply in Southeast Asia. Clim. Dyn. 2019, 53, 6595–6607. [Google Scholar] [CrossRef]
- Jones, P.D.; Briffa, K.; Pilcher, J.R. Riverflow reconstruction from Tree Rings in Southern Britain. J. Clim. 1984, 4, 461–472. [Google Scholar] [CrossRef]
- Akkemik, Ü.; D’Arrigo, R.; Cherubini, P.; Köse, N.; Jacoby, G.C. Tree-ring reconstructions of precipitation and streamflow for north-western Turkey. Int. J. Clim. 2008, 28, 173–193. [Google Scholar] [CrossRef]
- Anderson, S.R.; Ogle, R.; Tootle, G.; Oubeidillah, A. Tree-Ring Reconstructions of Streamflow for the Tennessee Valley. Hydrology 2019, 6, 34. [Google Scholar] [CrossRef] [Green Version]
- Case, R.A.; MacDonald, G.M. Tree ring reconstruction of Streamflow for Three Canadian Prairie Rivers. J. Am. Water Resour. Assoc. 2003, 39, 703–716. [Google Scholar] [CrossRef]
- Wise, E.K. Tree ring record of streamflow and drought in the upper Snake River. Water Resour. Res. 2010, 46, W11529. [Google Scholar] [CrossRef] [Green Version]
- Cook, E.R.; Seager, R.; Kushnir, Y.; Briffa, K.R.; Büntgen, U.; Frank, D.; Krusic, P.J.; Tegel, W.; van der Schrier, G.; Andreu-Hayles, L.; et al. Old World megadroughts and pluvials during the Common Era. Sci. Adv. 2015, 1, e1500561. [Google Scholar] [CrossRef] [Green Version]
- Ewane, B.E.; Lee, H.H. Tree-ring reconstruction of streamflow for Palgong Mountain forested watershed in southeastern South Korea. J. Mt. Sci. 2017, 14, 60–76. [Google Scholar] [CrossRef]
- Stagge, J.H.; Rosenberg, D.E.; DeRose, R.J.; Rittenour, T.M. Monthly paleostreamflow reconstruction from annual tree-ring chronologies. J. Hydrol. 2018, 557, 791–804. [Google Scholar] [CrossRef] [Green Version]
- Meko, D.M.; Therrell, M.D.; Baisan, C.H.; Hughes, M.K. Sacramento River Flow Reconstructed to A.D. 869 From Tree Rings. J. Am. Water Resour. Assoc. 2001, 37, 1029–1039. [Google Scholar] [CrossRef]
- Woodhouse, C.A.; Lukas, F.J. Multi-Century Tree-ring Reconstructions of Colorado Streamflow Water Resource Planning. Clim. Chang. 2006, 78, 293–315. [Google Scholar] [CrossRef]
- Touchan, R.; Woodhouse, C.A.; Meko, D.M.; Allen, C. Millennial precipitation reconstruction for the Jemez Mountains, New Mexico, reveals changing drought signal. Int. J. Clim. 2011, 31, 896–906. [Google Scholar] [CrossRef]
- Fernández, A.; Muñoz, A.; González-Reyes, Á.; Aguilera-Betti, I.; Toledo, I.; Puchi, P.; Sauchyn, D.; Crespo, S.; Frene, C.; Mundo, I.; et al. Dendrohydrology and Water Resources Management in South-Central Chile: Lessons from the Río Imperial Streamflow Reconstruction. Hydrol. Earth Syst. Sci. 2018, 22, 2921–2935. [Google Scholar] [CrossRef] [Green Version]
- Ballesteros-Canovas, J.A.; Bombino, G.; D’Agostinoa, D.; Denisia, P.; Labatea, A.; Stoffel, M.; Zemaa, D.A.; Zimbonea, S.M. Tree-ring based, regional-scale reconstruction of flash floods in Mediterranean mountain torrents. Catena 2019, 189, 104481. [Google Scholar] [CrossRef]
- Jansma, E. Hydrological disasters in the NW-European Lowlands during the first millennium AD: A dendrochronological reconstruction. Neth. J. Geosci. 2020, 99, E11. [Google Scholar] [CrossRef]
- Akkemik, Ü.; Dagdeviren, N.; Aras, A. A preliminary reconstruction (AD 1635-2000) of spring precipitation using oak tree rings in the western Black Sea region of Turkey. Int. J. Biometeorol. 2005, 49, 297–302. [Google Scholar] [CrossRef]
- Touchan, R.; Xoplaki, E.; Funchouser, G.; Luterbacher, J.; Hughes, M.K.; Erkan, N.; Akkemik, Ü.; Stephan, J. Reconstruction of spring/summer precipitation for the Eastern Mediterranean from tree-ring widths and its connection to large–scale atmospheric circulation. Clim. Dyn. 2005, 25, 75–98. [Google Scholar] [CrossRef]
- Touchan, R.; Akkemik, Ü.; Huges, M.K.; Erkan, N. May–June precipitation reconstruction of southwestern Anatolia, Turkey during the last 900 years from tree-rings. Quat. Res. 2007, 68, 196–202. [Google Scholar] [CrossRef]
- Köse, N.; Akkemik, Ü.; Dalfes, H.N.; Özeren, M.S. Tree-ring reconstructions of May–June precipitation of western Anatolia. Quat. Res. 2011, 75, 438–450. [Google Scholar] [CrossRef]
- Köse, N.; Akkemik, Ü.; Güner, H.T.; Dalfes, H.N.; Grissino-Mayer, H.D.; Özeren, M.S.; Kındap, T. An improved reconstruction of May–June precipitation using tree-ring data from western Turkey and its links to volcanic eruptions. Int. J. Biometeorol. 2013, 57, 691–701. [Google Scholar] [CrossRef] [PubMed]
- Köse, N.; Güner, H.T.; Harley, G.L.; Guiot, J. Spring temperature variability over Turkey since 1800 CE reconstructed from a broad network of tree-ring data. Clim. Past. 2017, 13, 1–15. [Google Scholar] [CrossRef] [Green Version]
- Güner, H.T.; Köse, N.; Harley, G.L. A 200-year reconstruction of Kocasu River (Sakarya River Basin, Turkey) streamflow derived from a tree-ring network. Int. J. Biometeorol. 2017, 61, 427–437. [Google Scholar] [CrossRef] [PubMed]
- Çakmak, B. Kızılırmak Havzası Sulama Birliklerinde Sulama Sistem Performansının Değerlendirilmesi. KSÜ Fen Ve Mühendislik Derg. 2002, 5, 130–141. [Google Scholar]
- Marmara Research Center (MAM), Tübitak. Havza Koruma Eylem Planlarının Hazırlanması-Kızılırmak Havzası. Turkish Ministry of Agriculture and Forestry, General Directorate of Water Management 2010. Available online: https://www.tarimorman.gov.tr/SYGM/Belgeler/havza%20koruma%20eylem%20planlar%C4%B1/K%C4%B1z%C4%B1l%C4%B1rmak_Havzas%C4%B1.pdf (accessed on 2 February 2022).
- Efe, R. Kızılırmağın Akım ve Rejim Özellikleri. Marmara Üniversitesi Sos. Bilimler Enstitüsü Derg. 1996, 3, 39–60. [Google Scholar]
- Yüce, M.İ.; Ercan, B. Kızılırmak Havzası Yağış Akış ilişkisinin Belirlenmesi. In Proceedings of the 4. Su Yapıları Sempozyumu, Antalya, Turkey, 19–21 November 2015; pp. 410–418. [Google Scholar]
- Hızal, A.; Serengil, Y.; Özcan, M. Ekosistem Tabanlı Havza Planlama Metodolojisi ve Havza Çalışmalarında Yapılan Yanlış Uygulamalar. In Proceedings of the TMMOB 2. Su Politikaları Kongresi, Ankara, Türkiye, 20–22 March 2008; pp. 1–12. [Google Scholar]
- Mayer, H.; Aksoy, H. Türkiye Ormanları; Batı Karadeniz Ormancılık Araştırma Enstitüsü Müdürlüğü, Abant İzzet Baysal Üniversitesi Basımevi: Bolu, Turkey, 1998; p. 291. [Google Scholar]
- Stokes, M.A.; Smiley, T.L. An Introduction to Tree-ring Dating, 2nd ed.; The University of Arizona Press: Tucson, AZ, USA, 1996; pp. 1–73. ISBN 978-0816516803. [Google Scholar]
- Speer, J.H. Fundamentals of Tree-Ring Research; University of Arizona Press: Tucson, AZ, USA, 2010; ISBN 978-0816526857. [Google Scholar]
- Holmes, R.L. Computer-assisted quality control in tree-ring data and measurements. Tree-Ring Bull. 1983, 43, 69–78. [Google Scholar]
- Grissino-Mayer, H.D. Research Report Evaluating Crossdating Accuracy: A Manual and Tutorial for the Computer Program Cofecha. Tree-Ring Res. 2001, 57, 205–221. [Google Scholar]
- Cook, E.R. A Time Series Analysis Approach to Tree-Ring Standardization. Ph.D. Thesis, University of Arizona, Tucson, AZ, USA, 1985. [Google Scholar]
- Cook, E.R.; Shiyatov, S.; Mazepa, M. Estimation of the mean chronology. In Methods of Dendrochronology: Applications in the Environmental Sciences; Cook, E., Kairiukstis, L., Eds.; Kluwer Academic Publishers: Dordrecht, The Netherlands, 1990; pp. 123–132. ISBN 978-90-481-4060-2. Available online: http://pure.iiasa.ac.at/id/eprint/3354/1/Methods_of_Dendrochronology_Applications.pdf (accessed on 7 February 2022).
- Biondi, E.; Swetnam, T.W. Box-Jenkins models of forest interior tree-ring chronologies. Tree-Ring Bull. 1987, 47, 71–95. [Google Scholar]
- Wigley, T.M.L.; Briffa, K.R.; Jones, P.D. On the average value of correlated time series, with applications in dendroclimatology and hydrometeorology. J. Appl. Meteorol. Climatol. 1984, 23, 201–213. [Google Scholar] [CrossRef]
- Briffa, K.; Jones, P.D. Basic chronology statistics and assessment. In Methods of Dendrochronology: Applications in The Environmental Sciences; Cook, E., Kairiukstis, L., Eds.; Kluwer Academic Publishers: Dordrecht, The Netherlands, 1990; pp. 137–152. ISBN 978-90-481-4060-2. [Google Scholar]
- Harris, I.; Osborn, T.; Jones, P.; Lister, D. Version 4 of the CRU TS monthly high-resolution gridded multivariate climate dataset. Sci. Data 2020, 7, 109. [Google Scholar] [CrossRef] [Green Version]
- Witten, I.H.; Frank, E.; Hall, M.A. The WEKA Data Mining Workbench. In Data Mining: Practical Machine Learning Tools and Techniques, 4th ed.; Witten, I.H., Frank, E., Hall, M.A., Pal, C.J., Eds.; Morgan Kaufmann: Burlington, MA, USA, 2017; pp. 553–571. ISBN 978-0128042915. [Google Scholar]
- R Development Core Team. R: A Language and Environment for Statistical Computing; R Foundation for Statistical Computing: Vienna, Austria, 2009. [Google Scholar]
- Zang, C.; Biondi, F. Treeclim: An R package for the numerical calibration of proxy-climate relationships. Ecography 2015, 38, 431–436. [Google Scholar] [CrossRef]
- Fritts, H.C. Tree Rings and Climate; Academic Press: London, UK, 1976; pp. 1–567. ISBN 978-0-12-268450-0. [Google Scholar]
- Meko, D.M.; Graybill, D.A. Tree-ring reconstruction of upper Gila River discharge. Water Res. Bull. 1995, 31, 605–616. [Google Scholar] [CrossRef]
- Cook, E.R.; Briffa, K.R.; Jones, P.D. Spatial regression methods in dendroclimatology: A review and comparison of two techniques. Int. J. Clim. 1994, 14, 379–402. [Google Scholar] [CrossRef]
- Doğan, M.; Köse, N. Four new tree-ring chronologies from old black pine forests of Sandıras Mountain (Mugla, Turkey). J. Fac. For. Istanb. Univ. 2015, 65, 1–16. [Google Scholar] [CrossRef]
- Köse, N.; Akkemik, Ü.; Dalfes, H.N. Anadolu’nun iklim tarihinin son 500 yılı: Dendroklimatolojik ilk sonuçlar. In Proceedings of the Türkiye Kuvaterner Sempozyumu-TURQUA–V, Istanbul, Türkiye, 2–3 June 2005; pp. 136–142. [Google Scholar]
- Akkemik, Ü.; Cherubini, P. Batı Karadeniz Bölgesi’nde Doğal Yetişen Gymnosperm Taksonları Üzerinde Dendrokronolojik Araştırmalar; Project TÜBİTAK TOGTAG-2703; TÜBİTAK: Ankara, Türkiye, 2003. (In Turkish)
- Akkemik, Ü.; Aras, A. Reconstruction (1689–1994) of April-August precipitation in southwestern part of central Turkey. Int. J. Clim. 2005, 25, 537–548. [Google Scholar] [CrossRef]
- Martín-Benito, D.; Ummenhofer, C.; Köse, N.; Güner, H.T.; Pederson, N. Tree-ring reconstructed May–June precipitation in the Caucasus since 1752 CE. Clim. Dyn. 2016, 47, 3011–3027. [Google Scholar] [CrossRef]
- Touchan, R.; Garfin, G.M.; Meko, D.M.; Funchouser, G.; Erkan, N.; Hughes, M.K.; Wallin, B.S. Preliminary reconstruction of spring precipitation in southwestern Turkey from tree ring width. Int. J. Clim. 2003, 23, 157–171. [Google Scholar] [CrossRef]
- Touchan, R.; Funkhouser, G.; Hughes, M.K.; Erkan, N. Standardized precipitation index reconstructed from Turkish ring widths. Clim. Chang. 2005, 72, 339–353. [Google Scholar] [CrossRef]
- Quataert, D. Famine in Turkey—1873–1875. Master’s Thesis, Binghamton University, New York, NY, USA, 1968. [Google Scholar]
- Newton, M.W.; Kuniholm, P.I. Wiggles Worth Watching Making Radiocarbon Work. In The Case of Çatal Höyük Studies in Aegean archaeology presented to Malcolm H. Wiener as he enters his 65th year, Meleemata; Betancourt, P.P., Karageorghis, V., Laffineur, R., Niemeir, W.D., Eds.; Université de Liège, Histoire de l’art et Archéologie de la Grèce Antique: Austin, TX, USA, 1999; pp. 1–968. ISBN 978-1935488149. [Google Scholar]
- Aybar, M. Osmanlı Devletinde Kıtlık ve İç Göç: 1870-1900 Arası İç Anadolu Örneği. Mavi. Atlas. 2017, 5, 474–488. [Google Scholar] [CrossRef] [Green Version]
- Bayar, Y. 1873–1875 Orta Anadolu Kıtlığı; Yüksek Lisans Tezi, Marmara Üniversitesi Türkiyat Araştırmaları Enstitüsü: Istanbul, Turkey, 2013. [Google Scholar]
- Altındaş, E.T. 19. yüzyılda Osmanlı Devleti’nde Yaşanan Kuraklığın Ankara’ya Yansıması. Çanakkale Araştırmaları Türk Yıllığı 2018, 16, 1–13. [Google Scholar] [CrossRef]
- Ottoman Archives (1850–1923) Documents (correspondence between Ottoman Palace and provinces) in the Directory of State Archives of Prime Ministry of Republic of Turkey. Unpublished work.
- D’Arrigo, R.; Cullen, H.M. A 350-year (AD 1628-1980) reconstruction of Turkish precipitation. Dendrochronologia 2001, 19, 169–177. [Google Scholar]
- Hughes, M.K.; Kuniholm, P.I.; Garfin, G.M.; Latini, C.; Eischeid, J.K. Aegean tree-ring signature years explained. Tree-Ring Res. 2001, 57, 67–73. [Google Scholar]
- Purgstal, B.J.V.H. Osmanlı Devleti Tarihi, Cilt.1-7; Bürün, V., Translator; Üçdal Publishing: Istanbul, Turkey, 1983. [Google Scholar]
- Afkhami, A. Disease and water supply: The case of cholera in 19th century Iran. In Transformations of Middle Eastern Natural Environments: Legacies and Lessons; Coppock, J., Miller, J., Eds.; Yale University: New Haven, CT, USA, 1998; Volume 103, pp. 206–220. [Google Scholar]
- Özger, Y. XIX. yüzyıl sonlarında meydana gelen bir kuraklık ve kıtlık hadisesi ile bunun sosyo–ekonomik sonuçları. Karadeniz Araşt 2008, 19, 87–96. [Google Scholar]
- Kadıoğlu, M. Bildiğiniz Havaların Sonu-Küresel İklim Değişimi ve Türkiye; Güncel Yayınları: İstanbul, Turkey, 2001; ISBN 9786058017887. [Google Scholar]
- Inalcik, H. A Note on the Population of Cyprus. 1997. Available online: http://sam.gov.tr/pdf/perceptions/Volume-II/june-august-1997/HalilInalcik2.pdf (accessed on 3 February 2022).
- Gül, A. Drought and famine in Ottoman Empire (Case of Erzurum Province: 1892–1893 and 1906–1908). J. Int. Soc. Res. 2009, 2, 144–158. [Google Scholar]
- Davison, H.R. Reform in the Ottoman Empire; Princeton University Press: Princeton, NJ, USA, 1963; pp. 1–494. ISBN 9780691651644. [Google Scholar]
- Faroqhi, S. The Ottoman Empire: A Short History; Frisch, S., Translator; Markus Wiener Publishers: Princeton, NJ, USA, 2009; ISBN 978-1558764491. [Google Scholar]
- Brazdil, R.; Raška, P.; Trnka, M.; Zahradníček, P.; Valasek, H.; Dobrovolny, P.; Řezníčková, L.; Treml, P.; Stachoň, Z. The Central European drought of 1947: Causes and consequences, with particular reference to the Czech Lands. Clim. Res. 2016, 70, 161–178. [Google Scholar] [CrossRef] [Green Version]
- Çiçek, İ. Türkiye’de Kurak Dönemin Yayılışı ve Süresi (Homethwaite Metoduna Göre). Türkiye Coğrafyası Araştırma Uygul. Merk. Derg. 1993, 4, 77–101. [Google Scholar]


| Region | Site | Trees/Cores | Tree Species | Aspect | Elevation (m) | Lat (N) | Lon (E) | References |
|---|---|---|---|---|---|---|---|---|
| Sinop, Boyabat | HAC | 15/30 | PINI | SE | 1179 | 41°30′ | 34°33′ | This study |
| Sinop, Boyabat | MEM | 5/10 | PINI | SE | 1334 | 41°37′ | 34°42′ | This study |
| Çorum, Kargı | BED | 12/24 | PINI | SE | 1233 | 41°12′ | 34°46′ | This study |
| Çorum, Kargı | KAR | 22/38 | PINI | SW | 1522 | 41°11′ | 34°28′ | [22] |
| Çorum, Kargı | IKI | 12/24 | PINI | E | 1156 | 41°10′ | 34°44′ | Akkemik et al. unpublished data |
| Çorum, Kargı | TIR | 32/64 | PINI | NE | 1428 | 41°11′ | 34°45′ | [4] |
| Çorum, Kargı | SAH | 17/34 | PINI | S | 1300 | 41°13′ | 34°47′ | [22] |
| Sites | Chronology Time Span | Chronology Length | EPS > 0.85 | MS | Mean Interseries Correlation | SNR |
|---|---|---|---|---|---|---|
| HAC | 1642–2009 | 367 | 1689 | 0.25 | 0.68 | 10.3 |
| MEM | 1767–2009 | 242 | 1794 | 0.27 | 0.69 | 2.5 |
| BED | 1684–2009 | 325 | 1794 | 0.24 | 0.62 | 4.5 |
| Simple Linear Regression | Bagging Regression | Random Forest | |||||||||||||
|---|---|---|---|---|---|---|---|---|---|---|---|---|---|---|---|
| MONTHS | Correlation Cofficient | Mean Absolute Error | Root Mean Square | Relative Absolute Error | Root Relative Squared Error | Correlation Cofficient | Mean Absolute Error | Root Mean Square | Relative Absolute Error | Root Relative Squared Error | Correlation Cofficient | Mean Absolute Error | Root Mean Square | Relative Absolute Error | Root Relative Squared Error |
| JAN | 0.41 | 3.97 | 5.34 | 89.38% | 91.28% | 0.71 | 3.87 | 5.15 | 87.24% | 88.01% | 0.96 | 1.63 | 2.28 | 36.76% | 38.99% |
| FEB | 0.26 | 3.40 | 4.71 | 94.27% | 96.45% | 0.72 | 4.39 | 6.36 | 64.75% | 73.58% | 0.97 | 1.82 | 2.56 | 26.89% | 29.67% |
| MAR | 0.08 | 12.13 | 16.23 | 99.52% | 99.68% | 0.56 | 11.38 | 14.89 | 93.33% | 91.46% | 0.96 | 5.18 | 6.97 | 42.48% | 42.80% |
| APR | 0.59 | 13.17 | 15.56 | 82.34% | 81.03% | 0.80 | 10.37 | 12.00 | 64.89% | 62.46% | 0.97 | 4.22 | 5.39 | 26.39% | 28.06% |
| MAY | 0.25 | 13.45 | 15.98 | 97.81% | 96.88% | 0.67 | 9.95 | 12.55 | 72.35% | 76.07% | 0.96 | 4.47 | 5.63 | 32.50% | 34.16% |
| JUN | 0.40 | 8.94 | 11.73 | 86.45% | 91.54% | 0.67 | 8.22 | 10.40 | 79.49% | 81.15% | 0.95 | 3.70 | 4.94 | 35.75% | 38.52% |
| JUL | 0.26 | 3.40 | 4.71 | 94.27% | 96.45% | 0.51 | 3.15 | 4.49 | 87.33% | 91.91% | 0.94 | 1.53 | 1.98 | 42.42% | 40.58% |
| AUG | 0.41 | 1.70 | 2.35 | 88.95% | 91.02% | 0.64 | 1.60 | 2.20 | 83.79% | 85.20% | 0.97 | 0.65 | 0.87 | 34.02% | 33.60% |
| SEP | 0.07 | 1.81 | 2.55 | 98.67% | 99.78% | 0.65 | 1.58 | 2.25 | 86.24% | 88.19% | 0.97 | 0.69 | 0.95 | 37.49% | 37.38% |
| OCT | 0.25 | 1.68 | 2.42 | 98.74% | 96.87% | 0.59 | 1.49 | 2.12 | 87.61% | 85.10% | 0.93 | 0.82 | 1.10 | 48.35% | 44.17% |
| NOV | 0.06 | 1.78 | 2.37 | 99.43% | 99.81% | 0.42 | 1.69 | 2.26 | 94.07% | 94.81% | 0.96 | 0.80 | 0.97 | 44.62% | 40.96% |
| DEC | 0.17 | 4.12 | 5.58 | 95.74% | 98.52% | 0.42 | 3.65 | 5.15 | 84.76% | 90.93% | 0.94 | 1.85 | 2.51 | 43.05% | 44.30% |
| Calibration Period | Verification Period | R2 | Adj. R2 | F | RE | CE | |
|---|---|---|---|---|---|---|---|
| Precipitation | 1930–1967 | 1968–2003 | 0.38 | 0.34 | 10.56 p < 0.001 | 0.35 | 0.35 |
| 1968–2003 | 1930–1967 | 0.33 | 0.29 | 8.47 p < 0.001 | 0.33 | 0.33 | |
| 1930–2003 | - | 0.36 | 0.33 | 19.6 p < 0.001 | - | - | |
| Streamflow | 1954–1998 | - | 0.35 | 0.32 | 11.3 p < 0.001 | - | - |
| 18th Century | 19th Century | 20th Century | ||
|---|---|---|---|---|
| 1750–1799 | 1800–1849 | 1850–1899 | 1900–1949 | |
| Dry events | 1794 [20,23,47] 1797 [17,18,20,48,49] | 1801 [20] 1803 1813 [47,50] 1819 [21] 1820 [20,49,51] 1830 [20,47] 1832 [20,21,23,47] 1834 [4,20,47,50,51] 1840 [4,20,21,23,47,48,49,50,51,52] 1842 [4,18] | 1857 1862 1873 [10,21,23,47,53,54,55,56,57,58] 1887 [4,10,21,23,47,48,49,51,52,55,57,58,59,60,61] 1890 [20,47,49,50,51,59,60,62] 1893 [4,20,21,47,48,49,51,59,63] 1894 [20,21] | 1909 [20,21,47,48,49] 1926 [18,20,47,52,58,64] 1927 [4,18,20,23,47,48,49,51,52,58,59,64] 1928 [4,18,20,21,23,47,48,49,51,52,58,59,60,61,64,65] 1935 [18,21,49,50,51,60] 1937 1945 [18,23,60] 1947 [20,58] |
| Wet events | - | 1805 1809 [20,21,49,51] 1811 [4,17,20,21,47,59] 1814 [4,23] 1816 [4,17,20,21,47,50,51,59] 1818 [20,23,49] 1829 [4,20,23,48,50] 1835 [20,21,47] 1836 [20,21] 1837 [4,20] 1841 [20,47,48] 1846 [20,21,23,47,48,50] | 1855 [20,21,60] 1871 [4,48,59] 1881 [4,17,20,47,48,50,59,60] 1885 [4,20,47,48,49,51] 1896 [51,59,60] | 1903 [4,50] 1910 [17,18,20,54,59] 1915 [20,21] 1916 1933 [60] 1940 1941 [50] |
Publisher’s Note: MDPI stays neutral with regard to jurisdictional claims in published maps and institutional affiliations. |
© 2022 by the authors. Licensee MDPI, Basel, Switzerland. This article is an open access article distributed under the terms and conditions of the Creative Commons Attribution (CC BY) license (https://creativecommons.org/licenses/by/4.0/).
Share and Cite
Genç, S.; Güner, H.T. Precipitation and Streamflow Reconstructions from Tree Rings for the Lower Kızılırmak River Basin, Turkey. Forests 2022, 13, 501. https://doi.org/10.3390/f13040501
Genç S, Güner HT. Precipitation and Streamflow Reconstructions from Tree Rings for the Lower Kızılırmak River Basin, Turkey. Forests. 2022; 13(4):501. https://doi.org/10.3390/f13040501
Chicago/Turabian StyleGenç, Sena, and Hüseyin Tuncay Güner. 2022. "Precipitation and Streamflow Reconstructions from Tree Rings for the Lower Kızılırmak River Basin, Turkey" Forests 13, no. 4: 501. https://doi.org/10.3390/f13040501
APA StyleGenç, S., & Güner, H. T. (2022). Precipitation and Streamflow Reconstructions from Tree Rings for the Lower Kızılırmak River Basin, Turkey. Forests, 13(4), 501. https://doi.org/10.3390/f13040501