Next Article in Journal
The Relationship between Carving Work and Timber Features: A Database for the Italian Wooden Statuary
Next Article in Special Issue
Effect of Simulated Combined N and P on Soil Acidity within Soil Aggregates in Natural and Planted Korean Pine Forest in Northeast China
Previous Article in Journal
Forest Dynamics Models for Conservation, Restoration, and Management of Small Forests
Previous Article in Special Issue
The Effect of Hydromorphism on Soils and Soil Organic Matter during the Primary Succession Processes of Forest Vegetation on Ancient Alluvial Sands of the European North-East of Russia
 
 
Correction published on 25 July 2022, see Forests 2022, 13(8), 1173.
Article

Changes in the Soil Labile Organic Carbon Fractions following Bedrock Exposure Rate in a Karst Context

1
Faculty of Life Science and Technology, Central South University of Forestry & Technology, Changsha 410004, China
2
National Engineering Laboratory for Applied Technology of Forestry & Ecology in South China, Changsha 410004, China
3
Faculty of Resources and Environmental Engineering, Anshun University, Anshun 561000, China
*
Author to whom correspondence should be addressed.
Forests 2022, 13(4), 516; https://doi.org/10.3390/f13040516
Submission received: 22 February 2022 / Revised: 22 March 2022 / Accepted: 25 March 2022 / Published: 27 March 2022 / Corrected: 25 July 2022
(This article belongs to the Special Issue Soil Organic Matter and Nutrient Cycling in Forests)

Abstract

:
Soil labile organic carbon fractions (SLOCFs) mainly include microbial biomass carbon (MBC), dissolved organic carbon (DOC), easily oxidized organic carbon (EOC) and light fraction organic carbon (LFOC). The link between bedrock exposure rates with SLOCFs and the carbon pool management index under karst rocky desertification has not been well understood. We selected the bedrock exposure rate and vegetation coverage of 30–50% (light bedrock exposure, LBE), 50–70% (moderate bedrock exposure, MBE) and >70% (intense bedrock exposure, IBE) as the experimental sample plots according to the classification standard of karst rocky desertification, and then selected a sample plot of 0–30% (secondary forest, SF) as the control. This study compared the concentrations and stocks of soil organic carbon (SOC) and SLOCFs and analyzed the relevant carbon pool management index on karst landforms at Anshun, S.W. China. The aims were to determine the relationship between bedrock exposure rates and SLOCFs and to identify the most limiting factors for SLOCFs in karst rocky desertification areas. We found that (1) the concentrations and stocks of SLOCFs declined with increasing soil depth. SOC, DOC and MBC showed IBE > LBE > MBE > SF; LFOC decreased with increasing bedrock exposure rate, and EOC did not show obvious regularity. (2) The carbon pool management index and sensitivity index had significant differences under different bedrock exposure rates. Redundancy analysis and linear regression showed that the increase in bedrock exposure rate had a great impact on MBC, DOC, EOC and SOC. In conclusion, the increase of bedrock exposure rate has no side impact on the DOC, EOC and MBC of the soil, but side effects are exhibited by LFOC. Secondary forest improves the integrity of karst landscapes, and does not change the soil properties as well as the concentrations and stocks of SLOCFs in karst rocky desertification areas.

1. Introduction

Karst ecosystems, as a natural landscape in arid and semi-arid areas, are widely distributed all over the world and pose a serious threat to the ecological environment and socioeconomic advancement [1], with an area of 22 million km2 and accounting for approximately 12% of the global land area [2,3]. Therefore, it is one of the main ecologically fragile zones in our terrestrial ecosystem [3]. Karst rocky desertification (KRD) is a process and result of the interaction between ecosystem vulnerability and the unreasonable economic activities of humanity under karst landform conditions, and it is also the main ecological environmental problem in typical karst areas [4]. The main characteristics of KRD areas are a thin soil layer, low vegetation coverage, and large areas of exposed bedrock caused by serious soil and water loss [5]. Additionally, a series of social and economic problems, such as population poverty, economy, science and technology and culture, have further aggravated the ecological and environmental problems of KRD region [6], which has been the main reason for the aggravation problem of KRD in Southwest China for many years [5,7].
The soil organic carbon (SOC) pool is the largest carbon pool in terrestrial ecosystems and is affected by many external factors, such as climate type, plant diversity, microbial community structure, and topography, and it is also closely related to soil type, vegetation coverage, and land use type [8,9], and therefore it plays an important role in atmospheric CO2 level balance [10]. In addition, SOC stocks are affected by land use, soil fertility, soil temperature, and water [11,12]. Meanwhile, small changes of SOC in terrestrial ecosystems may lead to variations in the carbon budget and the stability of the climate system [13]. Moreover, SOC is the key factor controlling soil fertility and agricultural production [14], which are usually affected by the land-use conversion, climatic factors, vegetation, management practices, clay content, etc. [15], and the loss of SOC can lead to a decline in soil fertility and quality, and affect the stability of terrestrial ecosystems [16,17]. Karst ecosystems, especially in KRD areas, comprise a significant part of the Earth’s surface system, and its SOC changes will have an impact on the matter cycle of other regions and the whole Earth system [18,19]. Meanwhile, SOC sequestration significantly increases with restoration age, and the large scale of land-use change under the ‘Grain-for-Green’ Program will significantly increase SOC stocks [20,21]. These inconsistent results from scholars show that SOC dynamics are a complex process that is affected by multiple factors among different bedrock exposure rate areas [10,22].
Soil labile organic carbon fractions (SLOCFs) mainly include microbial biomass carbon (MBC), dissolved organic carbon (DOC), easily oxidized organic carbon (EOC), and light fraction organic carbon (LFOC). MBC and DOC are mainly controlled by soil microorganisms, while microorganisms are affected by soil environment and biological factors, mainly including temperature, humidity, and soil permeability [23]. However, they account for only a small part of SOC, and are closely related to the migration, fixation and carbon dioxide release of SOC in soil ecosystem [24,25]. EOC accounts for 13–28% of soil total organic carbon, and it moves relatively fast, and is unstable and easy to oxidize, decompose and mineralize in the soil [26,27]. EOC can be used as an indicator of changes in soil quality and fertility, easily moving with the solvent, and participating in a wide range of the carbon cycle [13,28]. LFOC is highly labile and consists of soil organic matter for microbes and plants as a major source of soil nutrients [24,29]. Soil carbon sequestration in the fragile ecological environment is significantly affected by the relative distribution of SLOCFs [24]. Additionally, the pool of SLOCFs is the most active fraction of SOC and has a rapid turnover rate, which governs the production and flux of CO2 from the soil to the atmosphere [26]. Moreover, these small fractions of SOC are more sensitive to land-use change or management practices than SOC [27]. The relationship between soil properties and plant diversity [30,31], microbial community structure and enzyme activity [17,32], soil organic carbon components and their sensitivity to KRD control measures, and the dynamic process of SOC [10,19] in karst areas has been widely studied, but studies on SLOCFs under different bedrock exposure rates in karst areas are rare. Thus, it is essential to explore the distribution characteristics of SLOCFs at different bedrock exposure rates of KRD areas, and we hypothesized that increasing bedrock exposure rate would have a serious restrictive effect on SLOCFs in the karst ecosystems of Southwest China, and expected this to provide a scientific basis for regional remediation, the SOC cycle, and soil quality management in KRD areas.
Here, SLOCFs for three different bedrock exposure rates in KRD areas, namely, the light bedrock exposure rate (LBE), the moderate bedrock exposure rate (MBE), and the intense bedrock exposure rate (IBE), were studied. These samples were compared with the reference secondary forest (SF). The aims were (i) to explore the distribution characteristics of SLOCFs in different bedrock exposure rates of karst rocky desertification; (ii) to quantify the stocks of SLOCFs under different bedrock exposure rates; and (iii) to understand the response of SLOCFs to bedrock exposure rates in karst rocky desertification areas of Southwest China.

2. Materials and Methods
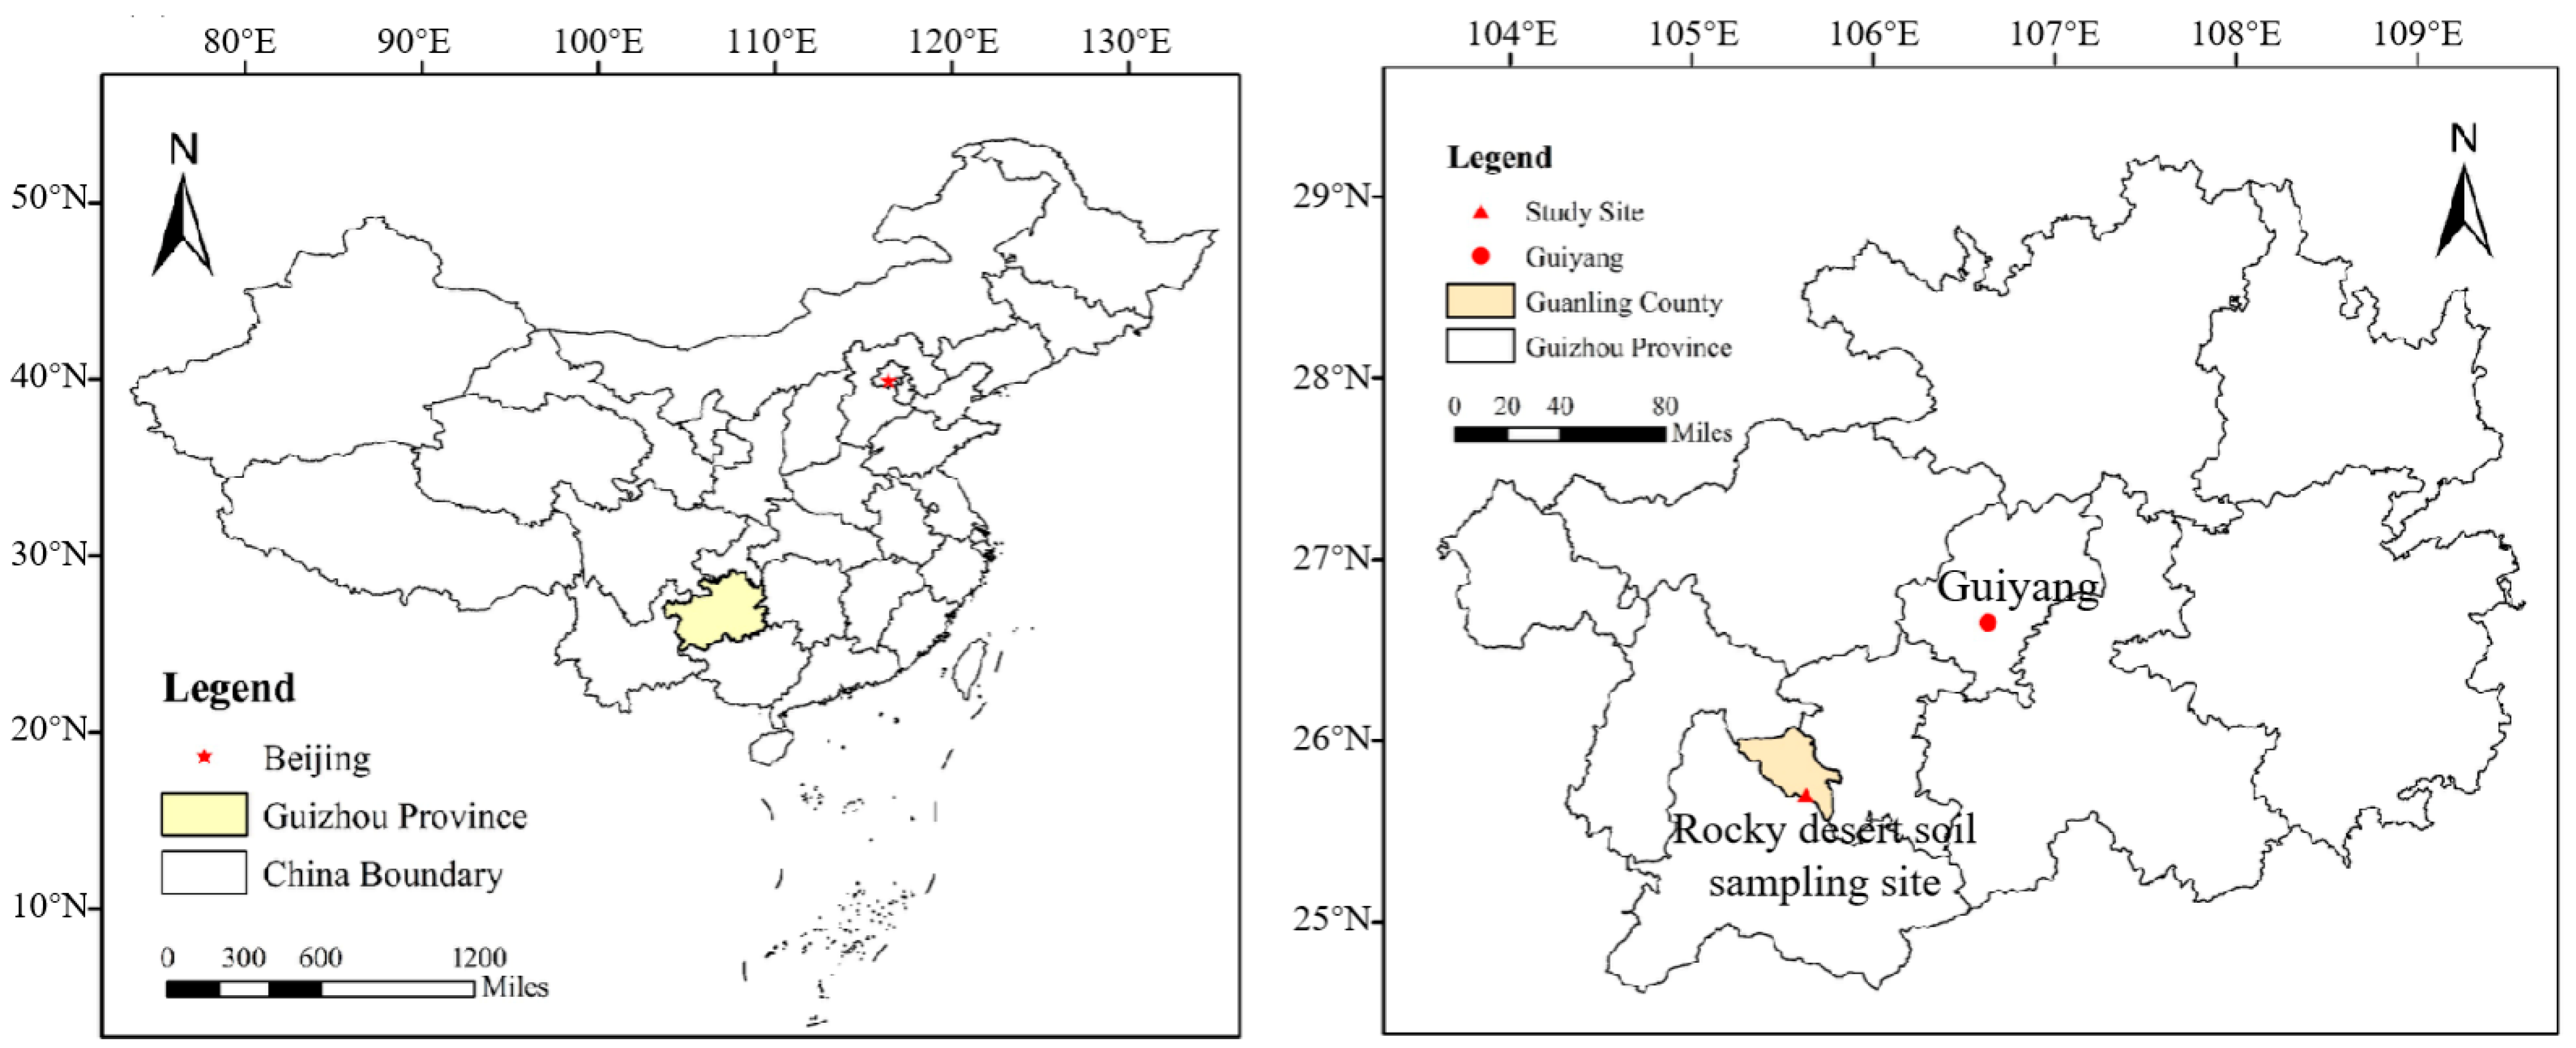
2.1. Study Site

We conducted the experiment at the sides of the Beipan River, Guanling–Zhenfeng junction, Guizhou Province, in Southwest China (Figure 1) (25°39′12″~25°41′09″ N, 105°39′59″~105°40′27″ E, with an average altitude of 756 m), covering a total area of 51.62 km2, of which the KRD area accounts for 53.82%. The study area experiences a subtropical mountainous monsoon climate with a mean annual precipitation of 1100 mm (83% occurs during May to October) and an average annual temperature of 18.4 °C [32]. The soil is mainly sandy loamy calcareous soil that lacks an aggregate structure and has a poor water holding capacity. This study site is seriously disturbed by human beings; most of the plants are secondary forests, and the main crops are Zanthoxylum bungeanum and Pitaya.

2.2. Soil Sample Collection

We selected the bedrock exposure rate and vegetation coverage of 30–50%, 50–70% and >70% as the experimental sample plots according to the classification standard of KRD, and then selected a sample plot of 0–30% as the control, named LBE, MBE, IBE and SF, respectively [5]. All KRD sample plots were divided into three large 20 m2 plots and then divided into five 2 m2 small plots in 20 m2 plots for soil sample collection, and the soil layers were divided into 0–10 cm, 10–20 cm and 20–30 cm. Finally, the soil samples were collected and taken back to the laboratory to screen out roots, stones and other debris with a 2 mm particle size and were naturally dried to measure the SLOCFs of the soil.

2.3. Soil Sample Determination

Soil organic carbon (SOC), total nitrogen (TN), soil bulk density (BD) and SLOCFs (MBC, DOC, EOC and LFOC) were determined in our study. SOC was determined using the dichromate oxidation method [33]. TN was analyzed by the Kjeldahl method [34]. The LFOC, EOC, MBC and DOC were determined using the density fractionation method [35], chemical oxidation method using KMnO4 [36], chloroform fumigation–K2SO4 extraction method, and K2SO4 extraction [24], respectively. MBC was fumigated with chloroform (CHCl3), then extracted with 0.5 mol L−1 K2SO4(aq), and finally put the sample into TOC analyzer for detection and analysis. DOC was extracted with 0.5 mol L−1 K2SO4(aq) and then determined by TOC analyzer. EOC was oxidized with 333 mmol L−1 KMnO4 and determined by spectrophotometer. LFOC used NaI solution to separate heavy organic carbon in soil, and finally used the same determination method as SOC.

2.4. Data Analysis

The data and chart analyses of the SLOCFs were conducted by GraphPad Prism 8.0. The relationships between the bedrock exposure rate and MBC, EOC, DOC, and LFOC were analyzed using Canoco 5.0 software and all data were processed by Excel 2010 software.
The soil organic carbon stocks (SOCs) (kg m−2) in different soil layers were calculated as follows [37]:
SOCs = OC × D × BD 100
where OC represents the SOC, MBC, DOC, EOC, and LFOC concentrations (g kg−1 in whole soil) of total soil when calculating SOC, MBC, DOC, EOC, and LFOC stocks in total soil, respectively; D is the thickness (cm) of the 0–10 cm soil depth; and BD is the soil bulk density (g cm−3).
The sensitivity index (SI) was calculated as follows [38]:
SI = ( C pool ) experiment ( C pool ) control ( C pool ) experiment
where (C pool) measures refer to the different C pools under LBE, MBE and IBE and (C pool) reference means the different C pools under SF.
The carbon pool management index (CPMI) values were determined using EOC concentrations, which were calculated using the following equation according to [36]. Additionally, the carbon pool index (CPI), liability index (LI), and soil liability of carbon (L) were calculated as follows [19]:
CPMI = CPI × L I × 100
CPI = SOC experiment SOC control
LI = L experiment L control
L = EOC SOC EOC
where SOC experiment is the total SOC concentration (g kg−1) in LBE, MBE and IBE and SOC control is the total SOC concentration (g kg−1) in SF.

3. Results

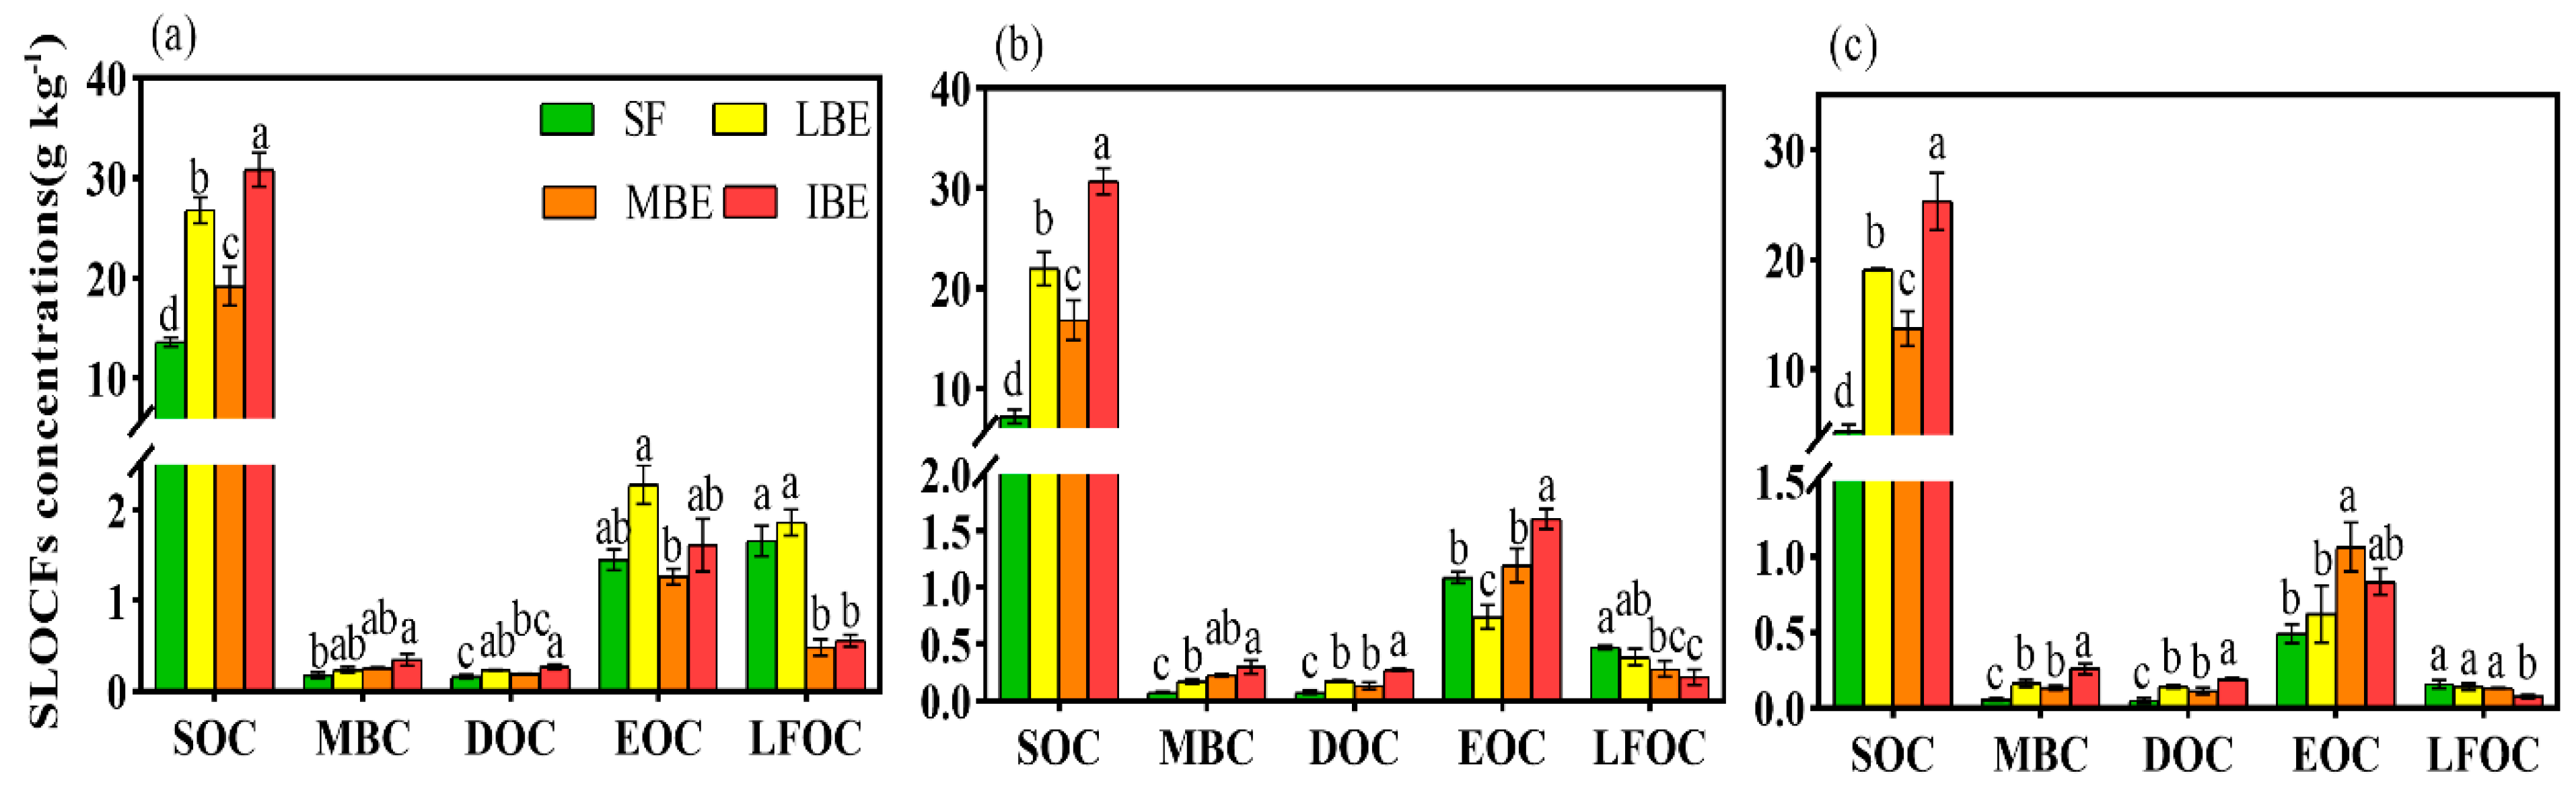
3.1. Soil Labile Organic Carbon Fraction Stocks

In different bedrock exposure areas, the concentrations and stocks of SOC and LFOC decreased with increasing soil layer depth (Figure 2). We found that the concentrations of SOC from SF to IBE were 13.65 ± 0.45, 26.80 ± 1.30, 19.20 ± 1.95 and 30.82 ± 1.67 (g kg−1) at a depth of 0–10 cm, respectively. Overall, the changing trend of MBC concentration under different bedrock exposure rates was SF (0.10 ± 0.06) < LBE (0.19 ± 0.04) < MBE (0.20 ± 0.06) < IBE (0.30 ± 0.06 g kg−1), and showed a positive correlation with increasing bedrock exposure rate. However, DOC concentration was SF (0.10 ± 0.05) < MBE (0.14 ± 0.04) < LBE (0.18 ± 0.04) < IBE (0.24 ± 0.04 g kg−1). EOC concentration changes without regularity at different bedrock exposure rates and in different soil layers. LFOC decreased with increasing bedrock exposure rate, imposing serious side effects on LFOC. Additionally, there was a significant difference in SLOCF concentrations among the different bedrock exposure rates (p < 0.0.5).
As shown in Figure 3, the SLOCF stocks were also greatly affected by the bedrock exposure rate. In the topsoil layer (0–10 cm), there was no difference in SOC, MBC, DOC and EOC stocks between different bedrock exposure rates, and the overall stocks were the highest in IBE, followed by LBE. However, the stocks of LFOC decreased with increasing bedrock exposure rate. With increasing soil layer depth, the stocks of SOC showed little change in topsoil, but the stocks of SLOCFs in the 10–20 cm soil layer were quite different. In addition, the stocks of MBC were IBE > MBE > LBE > SF under different bedrock exposure rates; DOC and EOC were IBE > LBE > MBE > SF and IBE > SF > MBE > LBE, respectively. However, the LFOC stocks gradually decreased with increasing bedrock exposure rate. As the soil layer reached 20–30 cm, the stocks of SOC, MBC and DOC showed IBE > LBE > MBE > SF, EOC was MBE > IBE > LBE > SF, and LFOC was consistent with that of other soil layers.

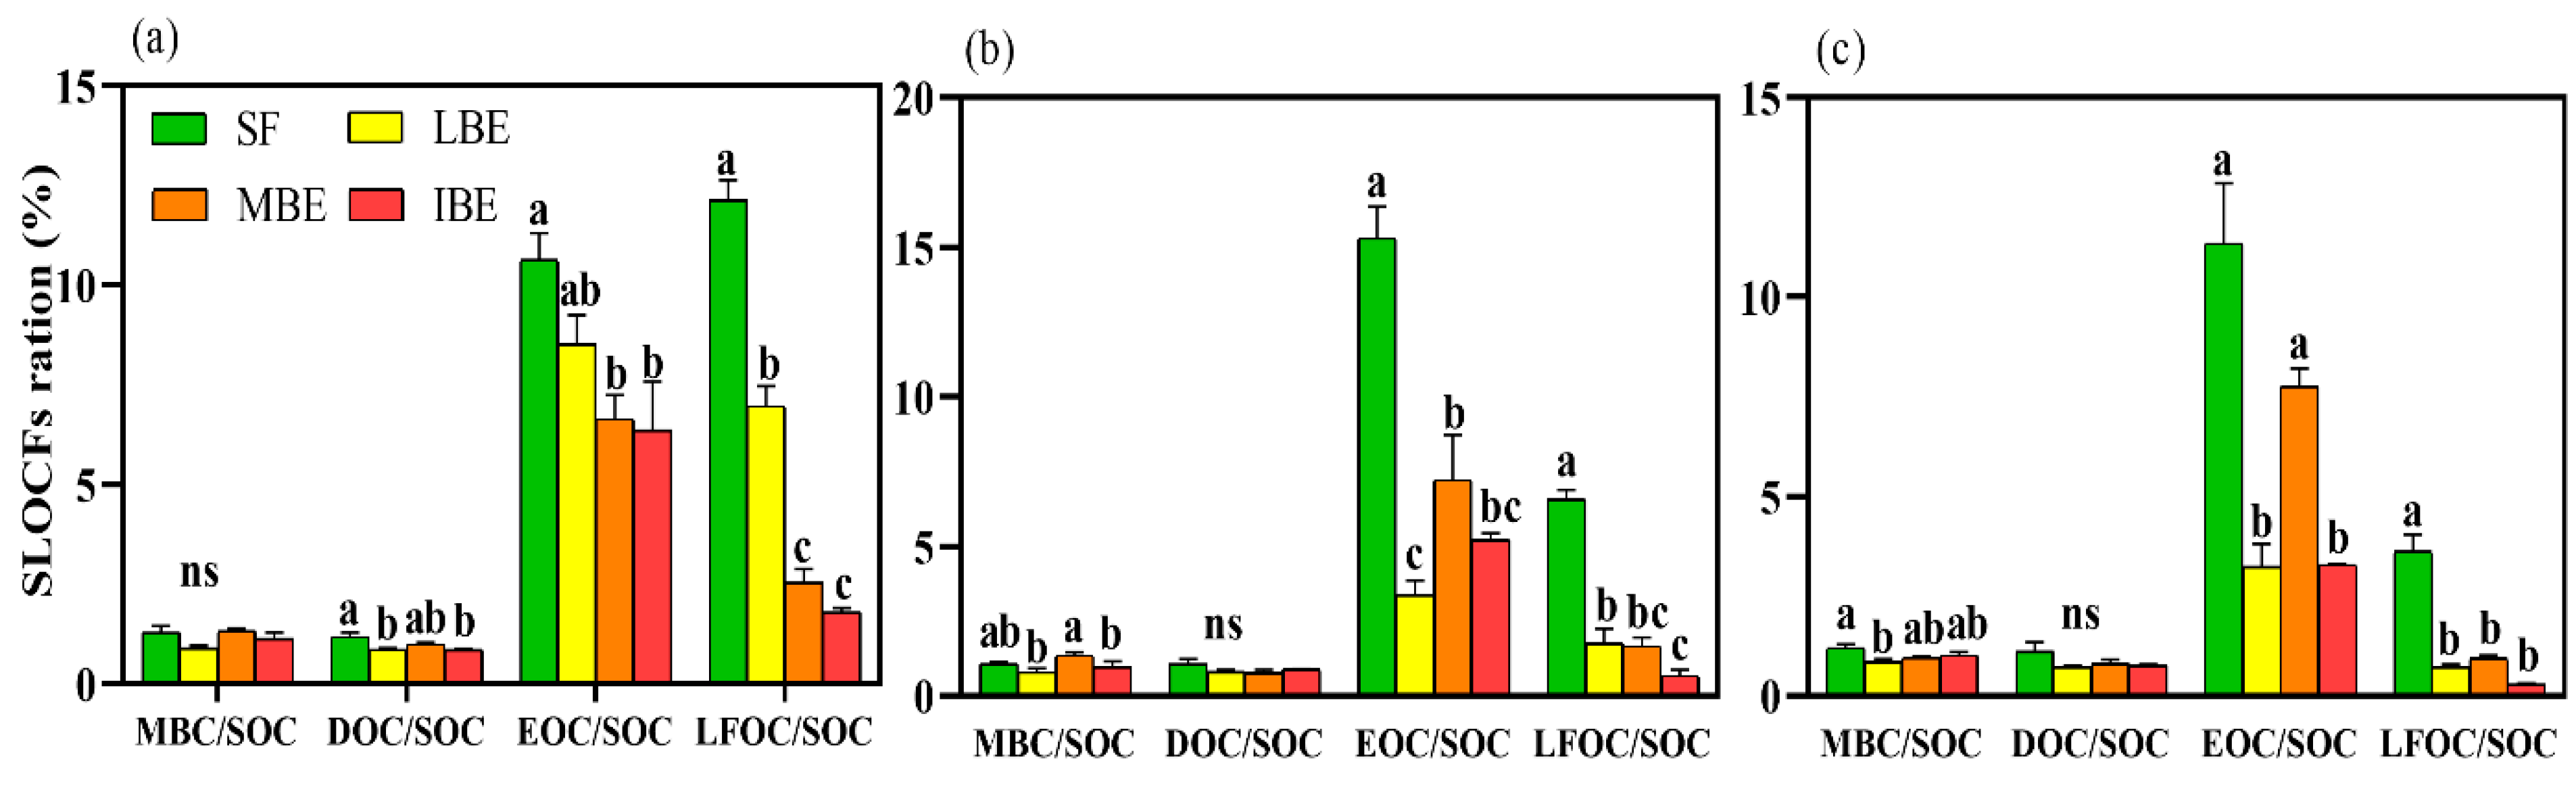
3.2. Proportions of Soil Labile Organic Carbon Fractions

Different bedrock exposure rates and soil layers had a great impact on the proportion of SLOCFs at our study site. As shown in Figure 4, there were no significant differences among different bedrock exposure rates in MBC/SOC in the 0–10 cm soil layer (p > 0.0.5), and the highest proportions appeared in SF and MBE. The overall trend of DOC/SOC was consistent with MBC/SOC, but this proportion was greatly affected by the bedrock exposure rate. However, the difference between EOC/SOC and LFOC/SOC was obvious under different bedrock exposure rates, which gradually decreased with increasing bedrock exposure rate in rocky desertification areas.
Interestingly, we found that there was no significant difference between the 10–20 cm and 20–30 cm DOC/SOC in different bedrock exposure areas, which indicated that DOC/SOC was less affected by rocky desertification with increasing soil layer depth. In contrast, MBC/SOC changed significantly at depths of 10–20 cm and 20–30 cm compared with that a depth of 0–10 cm. The proportion of LFOC/SOC in the second soil layer was consistent with that in the first soil layer, and it was SF > MBE > LBE > IBE at 20–30 cm.

3.3. Sensitivity of Soil Labile Organic Carbon Fractions

The CPI values changed significantly for different bedrock exposure rates in karst rocky desertification areas (Figure 5 and Table 1). In the 0–10 cm soil layer, with increasing bedrock exposure rate, CPI values first decreased and then increased, and the value was the highest in IBE (1.65 ± 0.60). With increasing soil layer depth, the trend of change was consistent with that at 0–10 cm. In the LBE sample plot, the CPI value increased gradually with increasing soil layer depth, and there was a significant difference between the different soil layers. However, the MBE and IBE gradually decreased with increasing soil layer depth. The LI value gradually decreased with increasing bedrock exposure rate in 0–10 cm. In the 10–20 cm and 20–30 cm soil layers, the LI value first increased and then decreased with increasing bedrock exposure rate, showing a “U”-shaped change. In general, it first increased and then decreased with increasing soil layer depth, with the highest LBE in the 0–10 cm soil layer (0.79 ± 0.14) and the lowest LBE in the 10–20 cm layer (0.20 ± 0.05).
We found that CMPI values in LBE and IBE decreased gradually with increasing soil layer depth, and there were significant differences among different soil layers (p < 0.05). In the 10–20 cm soil layer, CMPI first decreased and then increased with increasing bedrock exposure rates. However, in the 20–30 cm soil layer, it first increased and then decreased. There was no significant difference in the L values with increasing bedrock exposure rate between LBE, MBE and IBE (p > 0.05), while SF showed a significant difference compared to the other samples (0.12 ± 0.01). LBE and IBE gradually decreased with increasing soil layer depth, while SF first increased and then decreased; however, there was little change in MBE.
Other than for MBC, the SI values of the SLOCFs were in the order IBE > LBE > MBE at 0–10 cm. However, the SI value of MBC increased with increasing bedrock exposure rate. In the 10–20 cm soil layer, the response of SI values of EOC and LFOC to bedrock exposure rate was MBE > IBE > LBE; SOC, MBC and DOC were LBE > IBE > MBE, LBE > MBE > IBE and IBE > LBE > MBE, respectively. In the 20–30 cm soil layer, the SI values of SOC, MBC and DOC were LBE > IBE > MBE, and those of EOC and LFOC were MBE > LBE > IBE.

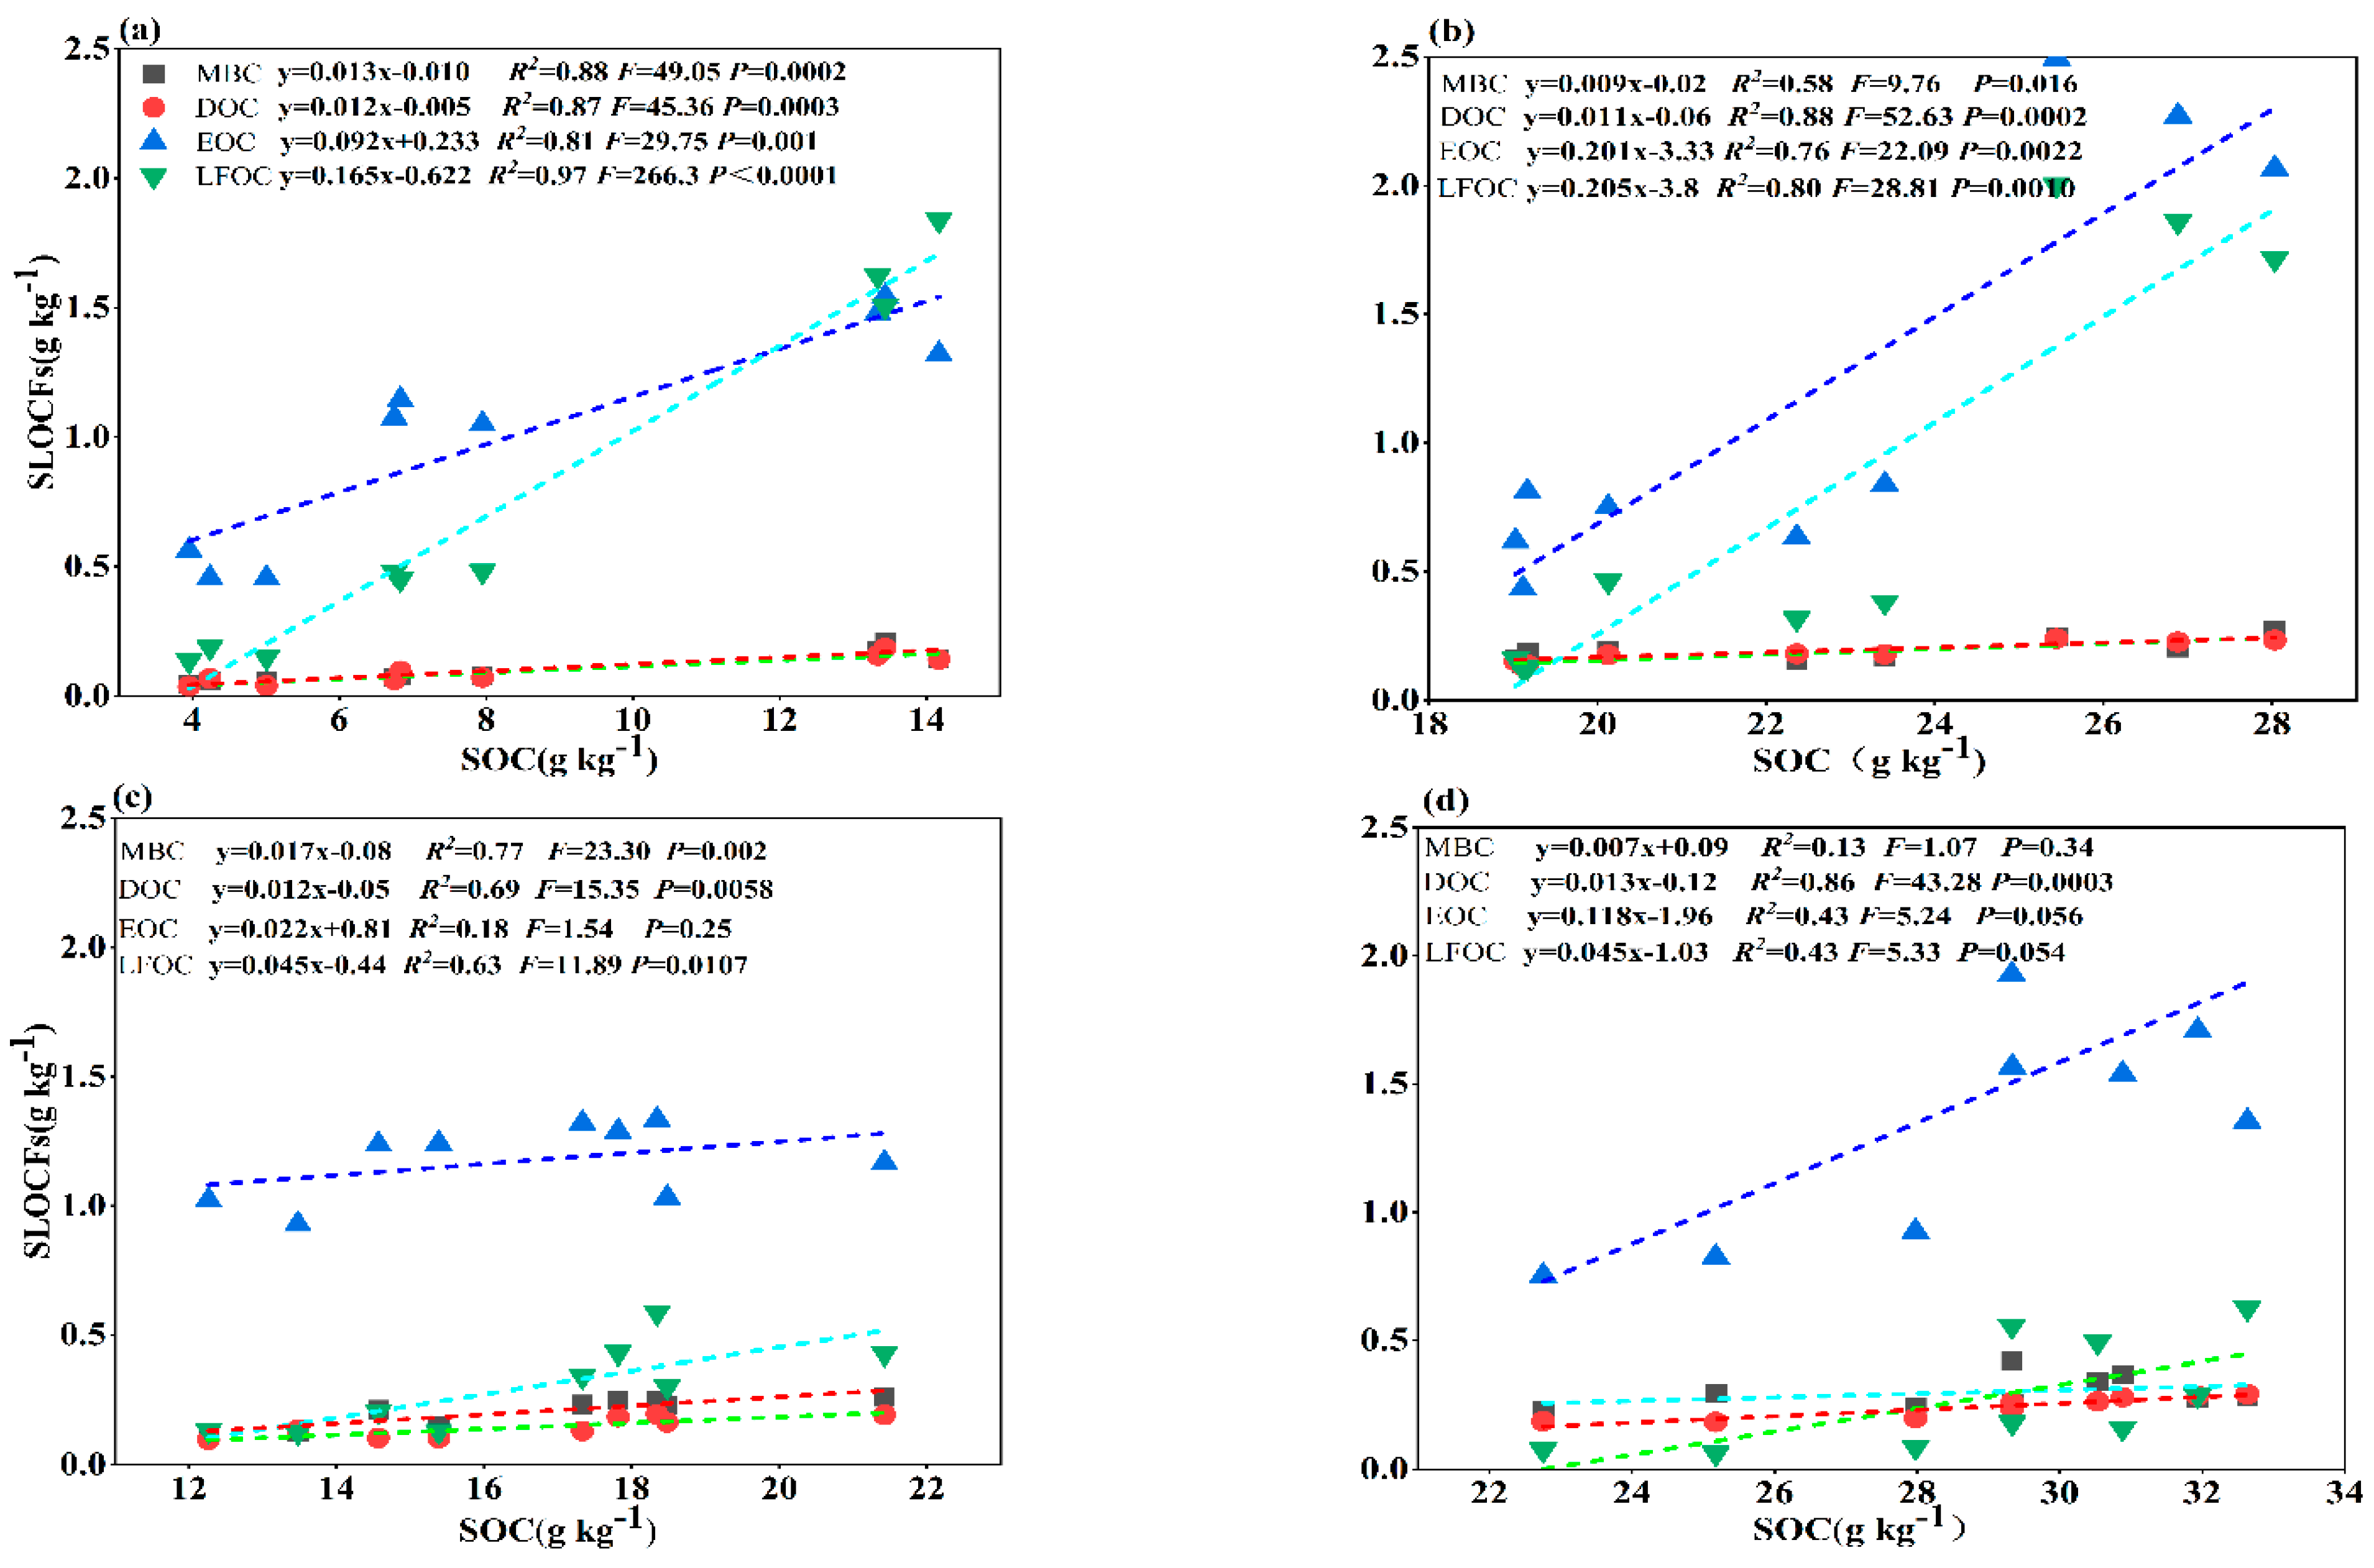
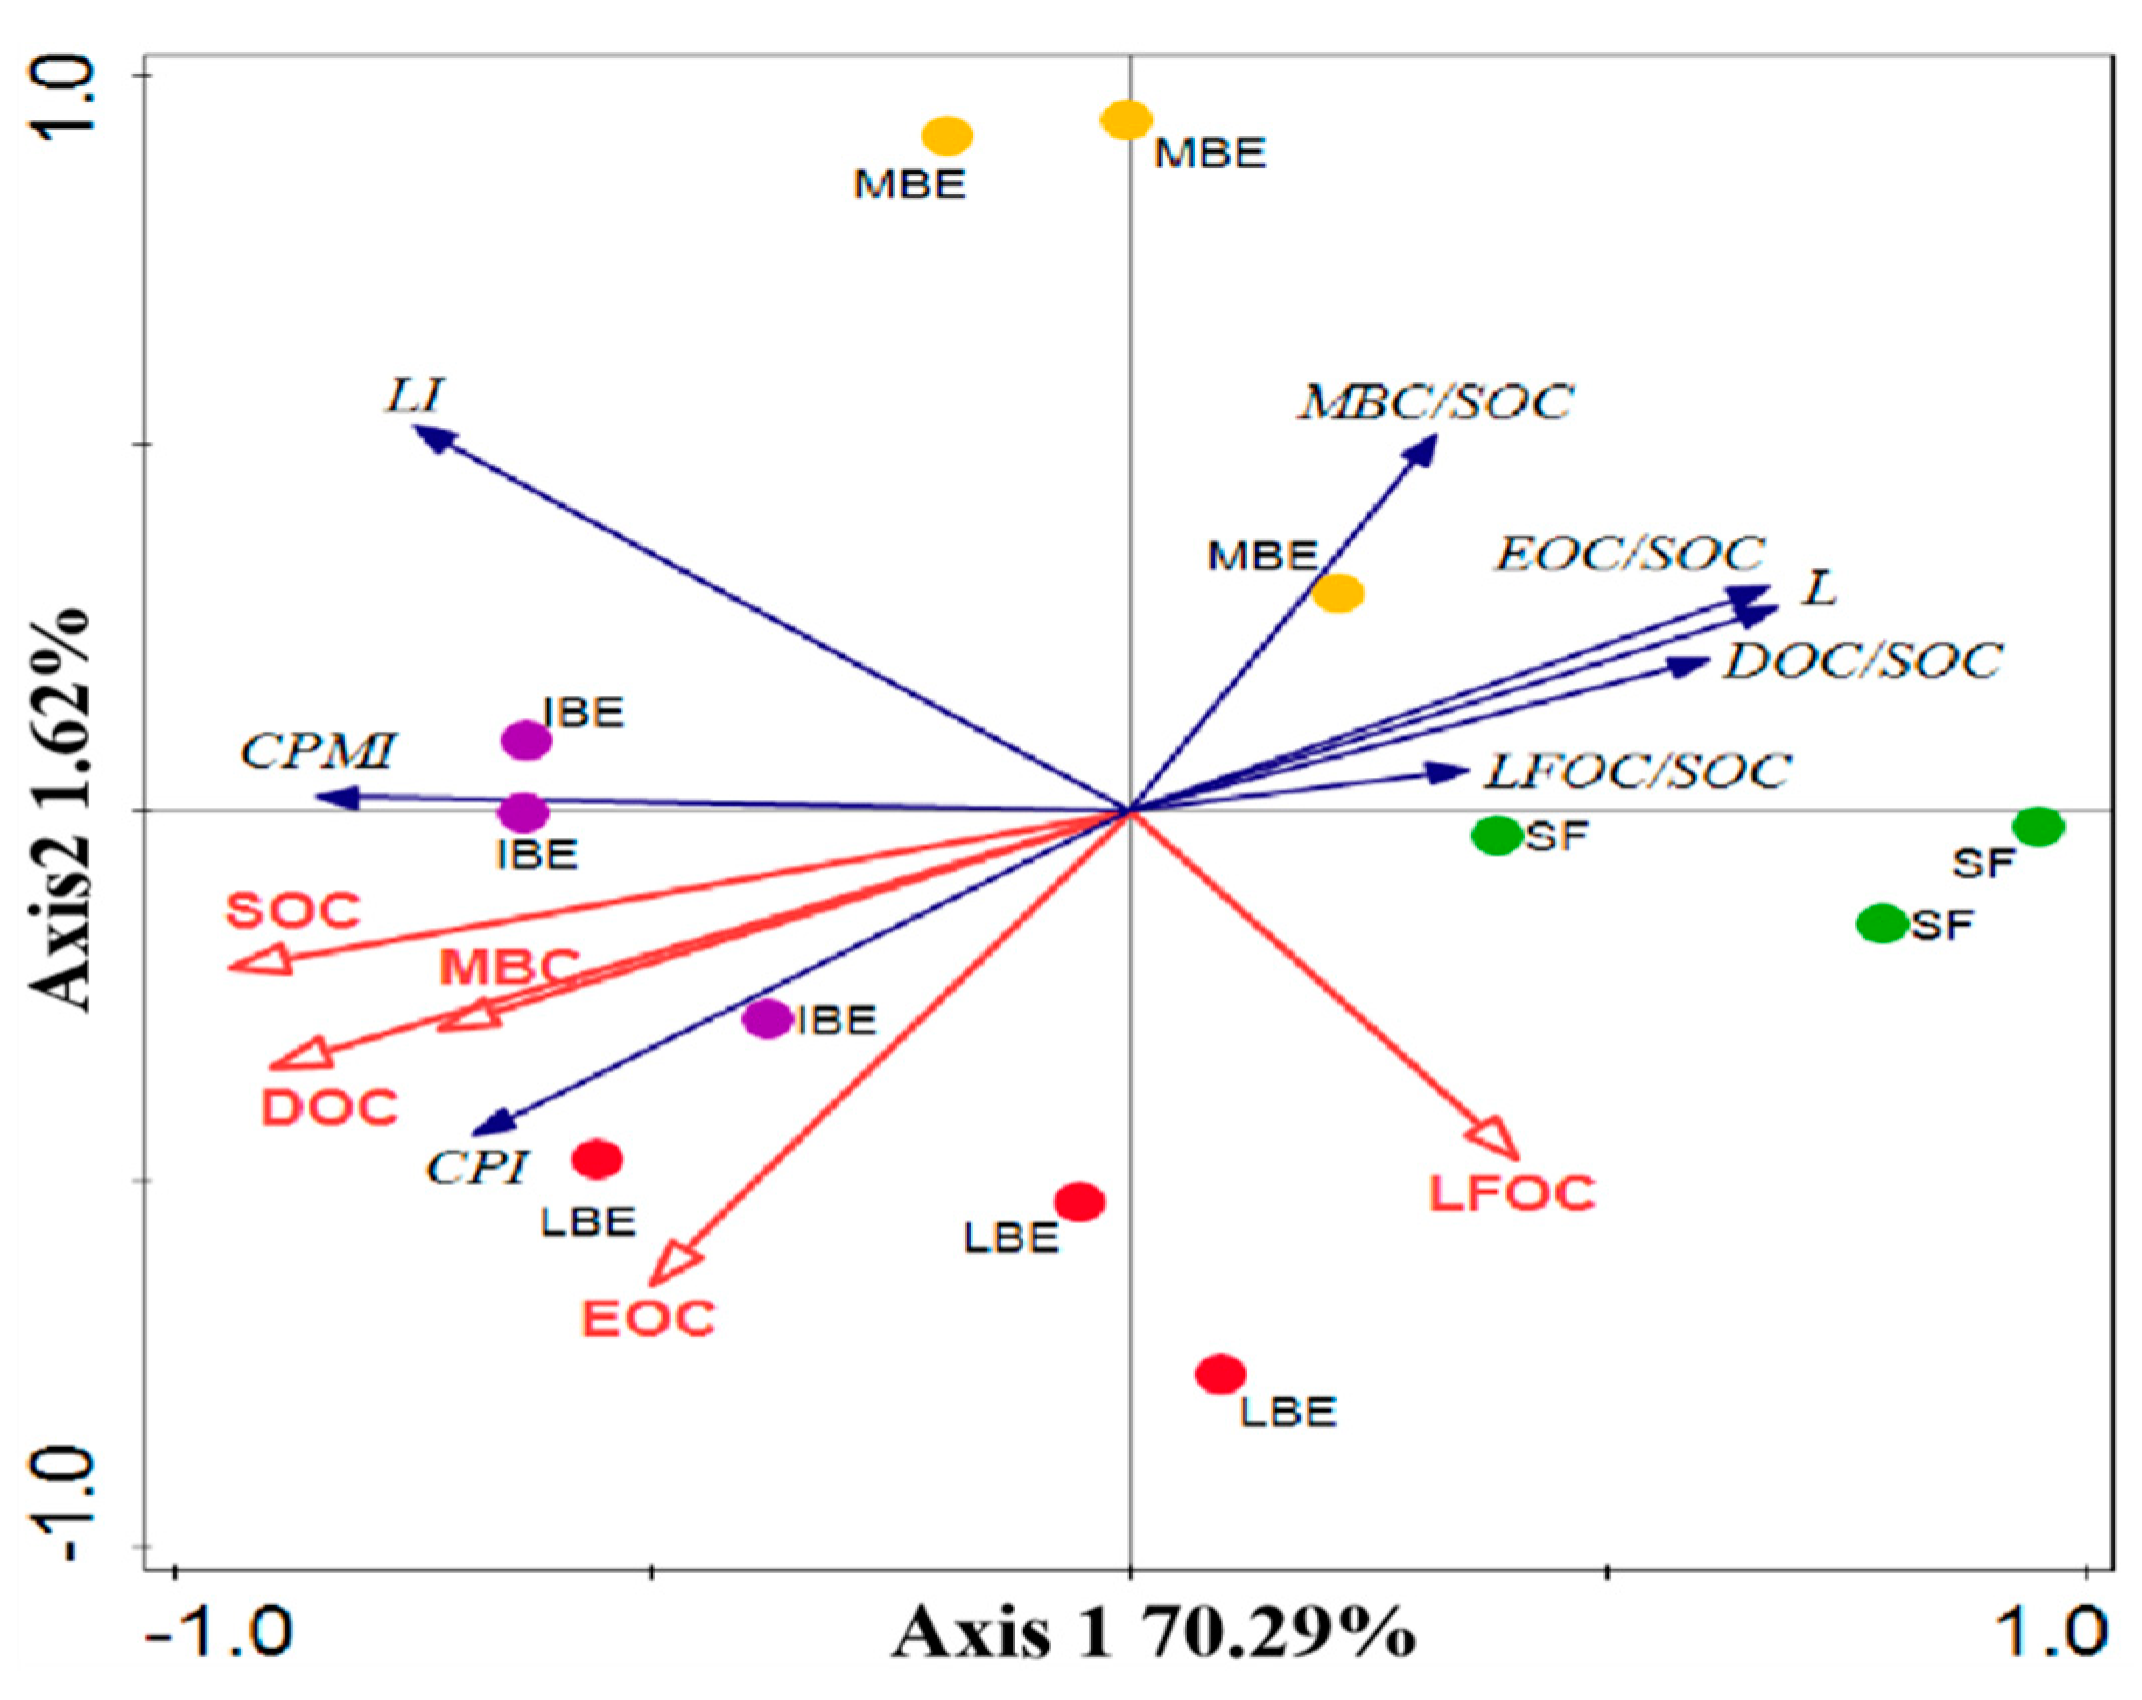
3.4. Relationship between Soil Labile Organic Carbon Fractions and Bedrock Exposure Rate

Through linear regression fitting of SLOCFs and SOC in karst rocky desertification areas with different bedrock exposure rates (Figure 6), we found that linear fitting of LFOC in the SF sample was p < 0.001, F = 266.3; with increasing bedrock exposure rate, the p-value and F value of the linear regression equation gradually decreased, which indicated that LFOC experienced serious side effects with increasing bedrock exposure rate in rocky desertification areas. The F and p-values of MBC and SOC in the IBE plot were 1.07 and 0.34, respectively, and in SF they were 49.05 and 0.0002, respectively, but there was no significant difference between LBE and IBE. Interestingly, we found that the different bedrock exposure rates in rocky desertification areas had no significant impact on DOC, only in MBE, but almost no impact in SF, LBE or IBE. The response of EOC to the bedrock exposure rate was generally consistent with that of LFOC. They were all in areas with higher bedrock exposure rates, which were greatly affected.
As shown in the redundancy analysis in Figure 7 and Table 2, in rocky desertification areas with different bedrock exposure rates, the response of SLOCFs and carbon pool related indexes was different. Changes in bedrock exposure rate had a significant effect on the DOC, SOC and MBC. The explained variances were 36.9%, 62.3% and 56.8%, respectively; p-values were ≤ 0.05, and Pseudo-F were 5.9, 16.5 and 13.1, respectively. The explained variance values of Axis 1, Axis 2, Axis 3 and Axis 4 were 70.29%, 1.62%, 0.4% and 0.0%, respectively. Overall, in rocky desertification areas under different bedrock exposure rates, CPMI, CPI and LI were several indicators with strong correlations with SLOCFs and bedrock exposure rate. These carbon-related indexes could be considered further in future explorations of soil quality and remediation in karst rocky desertification areas.

4. Discussion

SLOCFs (MBC, DOC, EOC and LFOC) are the most active factions in the SOC cycle, especially in karst rocky desertification areas, which reflects the important response characteristics of soil quality to different bedrock exposure rates [37,39]. As shown in Figure 2 and Figure 7, we found that the changes of MBC, DOC and EOC were highly correlated with the content of SOC. MBC and DOC increased with increasing SOC concentration, which is consistent with the findings of Qin [40]. Additionally, MBC represents the size of active microbial biomass, which largely depends on the supply of SOC [41,42] Therefore, the MBC content in our study was consistent with SOC and showed a trend of IBE > LBE > MBE > SF. DOC is produced by the decomposition of organic matter driven by soil microorganisms, which is mainly dependent on the degree of degradation of organic matter by microorganisms and the amount of organic matter in the ecological environment [43,44,45]. In this study, the distribution trend of DOC concentrations was consistent with MBC at different bedrock exposure rates. The main factors affecting MBC and DOC in rocky desertification areas could be the fact that that SF is richer in plant species composition, more shrubs and more organic matter [46], but rainwater scouring is more serious, microorganisms do not decompose organic matter sufficiently, and organic matter is lost by rainwater [47]. In contrast, IBE showed that there was less organic matter and less lost, and most of it was concentrated in soil [43]. In addition, those with a high bedrock exposure rate may have higher activity with respect to the types of microorganisms degrading organic matter.
The concentrations of EOC and LFOC are different from MBC and DOC, and not all of them increase with increasing SOC. EOC is produced by plant residue leaching, root secretion, and the soil microorganisms driving the decomposition of organic matter [48,49]. There was no regularity in EOC distribution. LBE, IBE and MBE had the highest EOC concentrations at depths of 0–10 cm, 10–20 cm and 20–30 cm, respectively. The reason for this may be that the LBE had a high vegetation coverage and a large amount of organic matter in the topsoil. Although IBE had a limited soil area, the rain erosion was serious, resulting in the easy decomposition and loss of EOC at 10–20 cm. In MBE, due to the combined action of rain erosion and plant roots, EOC was largely stored in deeper soil layers [19,30,48]. In addition, the concentrations of LFOC are quite different from those of SOC. LFOC is a highly unstable component of active organic carbon, which is mainly decomposed by plant organic matter in soil [17,36]. We found that in the study area, the content of LFOC always maintained the trend of SF > LBE > MBE > IBE and 0–10 cm > 10–20 cm > 20–30 cm. The main factor of this phenomenon may be the gradual decrease in the composition of the plant community, while the content of organic matter decreases from SF to IBE [19,50]. Therefore, the trend of LFOC indicates that it may be more affected by plant organic matter than by other factors in rocky desertification areas.
The stocks of SLOCFs are determined by carbon input and output [35,51], and are closely related to soil properties (soil bulk density, soil layer thickness, etc.) [14]. In karst rocky desertification areas, vegetation restoration reduces the bedrock exposure rate, improves soil quality, and enhances vegetation coverage, but does not change the gravel content and soil depth [52]. Moreover, the interception of rainfall by vegetation further leads to the reduction of soil capacity, and the input of vegetation litter has a significant impact on the increase of exogenous carbon in the soil, especially for LFOC [53,54]. With increasing bedrock exposure rate in rocky desertification areas, the vegetation coverage rate gradually decreases and the soil area decreases, but the shallow fissure soil increases and the gravel content in the soil decreases greatly [30,55]. Additionally, the concave ground formed by special bedrock characteristics causes rainwater scouring to converge into the soil, resulting in higher soil bulk density in areas with higher bedrock exposure rates [56]. Therefore, different bedrock exposure rates lead to great differences in soil carbon reserves. In karst rocky desertification areas, the labile organic carbon stocks of different exposure rates of bedrock are affected by many factors.
The carbon pool management index (CPMI) is an index including the soil organic carbon pool (carbon pool index, CPI) and soil organic carbon stability (stability index, LI), which is widely regarded to be a sensitive index for evaluating and reflecting soil quality and soil organic carbon activity [14,57]. Therefore, the change of CPMI in habitats with different bedrock exposure rates plays an essential role in the embodiment of carbon input and soil quality [58], especially for the variety of soil surface vegetation coverage caused by different bedrock exposure rates in rocky desertification areas, which affects the difference of soil labile organic carbon components [48]. In the current study, with different grades of rocky desertification, some soil CPMI decreased with increasing degree of rocky desertification, and some increased first and then decreased [19]. Different scholars have reached different conclusions on the research of CPMI in karst rocky desertification areas, which is mainly driven by external factors such as the complex division of rocky desertification, the serious impact of human disturbance, soil layer, slope, and altitude [58]. Therefore, research into the management index of karst regional carbon pools should be further systematically and scientifically incorporated into references of similar research sample plots in the future.

5. Conclusions

The stocks and concentrations of SOC decreased with increasing soil depth and showed IBE > LBE > MBE > SF in karst rocky desertification areas with different bedrock exposure rates. MBC and DOC increased with increasing bedrock exposure rate; EOC and LFOC had higher concentrations in SF and LBE. However, the ratio of SLOCFs to SOC was the highest in SF, and the SI decreased with increasing bedrock exposure rate. Redundancy analysis showed that the increase of bedrock exposure rate had a more obvious response to EOC, DOC and MBC, while the response of LFOC to vegetation restoration was more obvious. These findings further deepen our understanding of rocky desertification areas with different bedrock exposure rates and can be used to formulate strategies and practices for desertification restoration and the return of farmland to forest in similar karst areas.

Author Contributions

W.Z.: Conceptualization, Methodology, Software, Formal analysis, Data curation, Writing—original draft, Writing—review &editing, Visualization. W.Y.: Methodology, Resources, Writing—review & editing, Supervision, Funding acquisition. Q.W. & E.W.: Writing—review & editing. C.R., X.J., Y.X., L.H., Y.C. & X.L.: Software, Formal analysis. All authors have read and agreed to the published version of the manuscript.

Funding

This research was funded by National Key R & D Program of China (grant number: 2020YFA0608100), the Joint Funds of the National Natural Science Foundation of China (grant number: U21A20187), key research and development program of Hunan province (grant number: 2020NK2022), Special funding for innovative construction in Hunan province (grant number: 2021ZK4226), the Scientific Research Foundation of Hunan Provincial Education Department (grant number: 18B171), and the young scientific and technological talents growth project of Guizhou Provincial Department of Education (grant number: 2018KY320).

Data Availability Statement

Not applicable.

Acknowledgments

Special thanks to Xiaoyong Chen for his help with the revision of this manuscript. We gratefully acknowledge the in-kind support of National Engineering Laboratory for Applied Technology of Forestry and Ecology in South China, Central South University of Forestry and Technology, Changsha. We appreciated lab assistance and insights from Anshun university.

Conflicts of Interest

The authors declare no conflict of interest.

References

  1. Prvlie, R. Drylands extent and environmental issues: A global approach. Earth-Sci. Rev. 2016, 161, 259–278. [Google Scholar] [CrossRef]
  2. Tang, J.; Tang, X.X.; Qin, Y.M.; He, Q.S.; Yi, Y.; Ji, Z.L. Karst rocky desertification progress: Soil calcium as a possible driving force. Sci. Total Environ. 2018, 649, 1250–1259. [Google Scholar] [CrossRef]
  3. Yan, Y.; Dai, Q.; Yuan, Y.; Peng, X.; Zhao, L. Effects of rainfall intensity on runoff and sediment yields on bare slopes in a karst area, SW China. Geoderma 2018, 330, 30–40. [Google Scholar] [CrossRef]
  4. Zhang, Y.B.; Huang, Z.S.; Chen, X.; Guo, X.L.; Fang, Y. Suitability of human settlement environment in Buyei traditional villages in rocky desertification area of Guizhou, China. J. Appl. Ecol. 2019, 30, 3203–3214. [Google Scholar]
  5. Zhang, X.B.; Wang, S.J.; Cao, J.H.; Wang, K.L.; Meng, T.Y.; Bai, X.Y. Characteristics of water loss and soil erosion and some scientific problems on karst rocky desertification in Southwest China karst area. Carsologica Sin. 2010, 29, 274–279. [Google Scholar]
  6. Zhang, M.; Wang, K.; Liu, H.; Zhang, C.; Yue, Y.; Qi, X. Effect of ecological engineering projects on ecosystem services in a karst region: A case study of northwest Guangxi, China. J. Clean. Prod. 2018, 183, 831–842. [Google Scholar] [CrossRef]
  7. Qian, M.J.; Fang-Fang, W.U.; Tong, L.Q.; Yuan, C. Causes and Comprehensive Management for Rocky Desertification in Karst Areas of Southwestern China. Resour. Dev. Mark. 2008, 24, 902–904. [Google Scholar]
  8. Jarecki, M.K.; Lal, R.; James, R. Crop management effects on soil carbon sequestration on selected farmers’ fields in northeastern Ohio. Soil Tillage Res. 2005, 81, 265–276. [Google Scholar] [CrossRef]
  9. Dong, L.I.; Gao, M. Research Progress of Soil Organic Carbon Recycle. Acta Agric. Jiangxi 2008, 20, 60–63. [Google Scholar]
  10. Lal, R. Soil Carbon Sequestration Impacts on Global Climate Change and Food Security. Science 2004, 304, 1623–1627. [Google Scholar] [CrossRef] [Green Version]
  11. Deng, L. Soil organic carbon dynamics following natural vegetation restoration: Evidence from stable carbon isotopes (δ13C). Agric. Ecosyst. Environ. 2016, 221, 235–244. [Google Scholar] [CrossRef]
  12. Tie, G.; Wang, K.L.; Song, D.J.; Chen, T.Q.; Peng, H.; Wan, X. Impacts of vegetation restoration strategies on soil organic carbon and nitrogen dynamics in a karst area, southwest China. Ecol. Eng. 2017, 101, 247–254. [Google Scholar]
  13. Silveira, M.L.; Comerford, N.B.; Reddy, K.R.; Cooper, W.T.; El-Rifai, H. Characterization of soil organic carbon pools by acid hydrolysis. Geoderma 2008, 144, 405–414. [Google Scholar] [CrossRef]
  14. Six, J.; Paustian, K. Aggregate-Associated soil organic matter as an ecosystem property and a measurement tool. Soil Biol. Biochem. 2014, 68, 4–9. [Google Scholar] [CrossRef]
  15. Rolando, J.L.; Dubeux, J.C.; Perez, W.; Ramirez, D.A.; Turin, C.; Ruiz-Moreno, M.; Comerford, N.B.; Mares, V.; Garcia, S.; Quiroz, R. Soil organic carbon stocks and fractionation under different land uses in the Peruvian high-Andean Puna. Geoderma 2017, 307, 65–72. [Google Scholar] [CrossRef]
  16. Dai, Q.; Peng, X.; Yang, Z.; Zhao, L. Runoff and erosion processes on bare slopes in the Karst Rocky Desertification Area. Catena 2017, 152, 218–226. [Google Scholar] [CrossRef]
  17. Cheng, C.; Gao, M.; Zhang, Y.; Long, M.; Li, X. Effects of disturbance to moss biocrusts on soil nutrients, enzyme activities, and microbial communities in degraded karst landscapes in southwest China. Soil Biol. Biochem. 2021, 152, 108065–108073. [Google Scholar] [CrossRef]
  18. Peng, X.; Dai, Q.; Ding, G.; Shi, D.; Li, C. Impact of vegetation restoration on soil properties in near-surface fissures located in karst rocky desertification regions. Soil Tillage Res. 2020, 200, 104620–104630. [Google Scholar] [CrossRef]
  19. Lan, J. Responses of soil organic carbon components and their sensitivity to karst rocky desertification control measures in Southwest China. J. Soils Sediments 2021, 21, 978–989. [Google Scholar] [CrossRef]
  20. Li, D.; Niu, S.; Luo, Y. Global patterns of the dynamics of soil carbon and nitrogen stocks following afforestation: A meta-analysis. New Phytol. 2012, 195, 172–181. [Google Scholar] [CrossRef]
  21. Deng, L.; Liu, G.B.; Shangguan, Z.P. Land-use conversion and changing soil carbon stocks in China’s ‘Grain-for-Green’ Program: A synthesis. Glob. Change Biol. 2014, 20, 3544–3556. [Google Scholar] [CrossRef] [PubMed]
  22. Laganière, J.; Angers, D.A.; Paré, D. Carbon accumulation in agricultural soils after afforestation: A meta-analysis. Glob. Change Biol. 2010, 16, 439–453. [Google Scholar] [CrossRef]
  23. Wardle, D.A. A comparative assessment of factors which influence microbial biomass carbon and nitrogen levels in soil. Biol. Rev. 1992, 67, 321–358. [Google Scholar] [CrossRef]
  24. Jones, D.L.; Willett, V.B. Experimental evaluation of methods to quantify dissolved organic nitrogen (DON) and dissolved organic carbon (DOC) in soil. Soil Biol. Biochem. 2006, 38, 991–999. [Google Scholar] [CrossRef]
  25. Chibuike, G.; Burkitt, L.; Bretherton, M.; Singh, R.; Bishop, P. Dissolved Organic Carbon Concentration and Denitrification Capacity of a New Zealand Hill Country Soil After Forage Crop Establishment. Earth Syst. Environ. 2021, 5, 419–432. [Google Scholar] [CrossRef]
  26. Zhang, G.; Cao, Z.P.; Hu, C.J. Soil organic carbon fraction methods and their applications in farmland ecosystem: A review. Chin. J. Appl. Ecol. 2011, 22, 1921–1930. [Google Scholar]
  27. Shen, H.; Cao, Z.H.; Hu, Z.Y. Characteristics and ecological effects of the active organic carbon in soil. Chin. J. Ecol. 1999, 18, 33–39. [Google Scholar]
  28. Ping, Q.; Shao, J.; Ke, J.; Huang, S.W.; Zhao, S.C.; Zhou, W. Changes in soil microbial community, enzyme activities and organic matter fractions under long-term straw return in north-central China. Agric. Ecosyst. Environ. 2016, 216, 82–88. [Google Scholar]
  29. Dodla, S.K.; Wang, J.J.; Delaune, R.D. Characterization of labile organic carbon in coastal wetland soils of the Mississippi River deltaic Plain: Relationships to carbon functionalities. Sci. Total Environ. 2012, 435–436, 151–158. [Google Scholar] [CrossRef]
  30. Ma, T.; Deng, X.; Chen, L.; Xiang, W. The soil properties and their effects on plant diversity in different degrees of rocky desertification. Sci. Total Environ. 2020, 736, 139667–139675. [Google Scholar] [CrossRef]
  31. Hu, P.; Zhang, W.; Xiao, L.; Yang, R.; Wang, K. Moss-Dominated biological soil crusts modulate soil nitrogen following vegetation restoration in a subtropical karst region. Geoderma 2019, 352, 70–79. [Google Scholar] [CrossRef]
  32. Cheng, C.; Li, Y.; Long, M.; Gao, M.; Li, X. Moss biocrusts buffer the negative effects of karst rocky desertification on soil properties and soil microbial richness. Plant Soil 2020, 20, 4602–4618. [Google Scholar] [CrossRef]
  33. Neslon, D.W.; Sommers, L.E. Total Carbon, Organic Carbon, and Organic Matter. In Methods of Soil Analysis, 1st ed.; Soil Science Society of America: Madison, WI, USA, 1996; pp. 961–1010. [Google Scholar]
  34. Bremner, J.M. Determination of nitrogen in soil by the Kjeldahl method. J. Agric. Sci. 1960, 55, 11–33. [Google Scholar] [CrossRef]
  35. Beare, M.H.; Gregorich, E.G. Physically Uncomplexed Organic Matter. In Soil Sampling and Methods of Analysis, 2nd ed.; CRC Press: Boca Raton, FL, USA, 2007; pp. 1262–1268. [Google Scholar]
  36. Blair, G.J.; Lefroy, R.; Lisle, L. Soil carbon fractions based on their degree of oxidation, and the development of a carbon management index for agricultural systems. Aust. J. Agric. Res. 1995, 46, 1459–1466. [Google Scholar] [CrossRef]
  37. Qiu, L.; Wei, X.; Gao, J.; Zhang, X. Dynamics of soil aggregate-associated organic carbon along an afforestation chronosequence. Plant Soil 2015, 391, 237–251. [Google Scholar] [CrossRef]
  38. Banger, K.; Toor, G.S.; Biswas, A.; Sidhu, S.S.; Sudhir, K. Soil organic carbon fractions after 16-years of applications of fertilizers and organic manure in a Typic Rhodalfs in semi-arid tropics. Nutr. Cycl. Agroecosyst. 2010, 86, 391–399. [Google Scholar] [CrossRef]
  39. Zhu, L.; Hu, N.; Yang, M.; Zhan, X.; Zhang, Z. Effects of Different Tillage and Straw Return on Soil Organic Carbon in a Rice-Wheat Rotation System. PLoS ONE 2014, 9, e88900. [Google Scholar] [CrossRef] [Green Version]
  40. Qin, Y.; Xin, Z.; Wang, D.; Xiao, Y. Soil organic carbon storage and its influencing factors in the riparian woodlands of a Chinese karst area. Catena 2017, 153, 21–29. [Google Scholar] [CrossRef]
  41. Burns, R.G.; Deforest, J.L.; Marxsen, J.; Sinsabaugh, R.L.; Stromberger, M.E.; Wallenstein, M.; Weintraub, M.N.; Zoppini, A. Soil enzymes in a changing environment: Current knowledge and future directions. Soil Biol. Biochem. 2013, 58, 216–234. [Google Scholar] [CrossRef]
  42. Xiao, Y.; Huang, Z.; Lu, X. Changes of soil labile organic carbon fractions and their relation to soil microbial characteristics in four typical wetlands of Sanjiang Plain, Northeast China. Ecol. Eng. 2015, 82, 381–389. [Google Scholar] [CrossRef]
  43. Yan, Y.; Dai, Q.; Wang, X.; Jin, L.; Mei, L. Response of shallow karst fissure soil quality to secondary succession in a degraded karst area of southwestern China. Geoderma 2019, 348, 76–85. [Google Scholar] [CrossRef]
  44. Lucas, S.T.; Weil, R.R. Can A Labile Carbon Test Be Used to Predict Crop Responses To Improve Soil Organic Matter Management? Agron. J. 2012, 104, 1160–1170. [Google Scholar] [CrossRef] [Green Version]
  45. Plaza-Bonilla, D.; Álvaro-Fuentes, J.; Cantero-Martínez, C. Identifying soil organic carbon fractions sensitive to agricultural management practices. Soil Tillage Res. 2014, 139, 19–22. [Google Scholar] [CrossRef] [Green Version]
  46. Tan, Z.; Lal, R.; Owens, L.; Izaurralde, R.C. Distribution of light and heavy fractions of soil organic carbon as related to land use and tillage practice. Soil Tillage Res. 2007, 92, 53–59. [Google Scholar] [CrossRef]
  47. Liu, Q.; Deng, D.; Yao, B.; Liao, Q. Analysis of the karst springs’ supply sources in rocky desertification area of Guanling–Huajiang, Guizhou, China. Carbonates Evaporites 2020, 35, 1–11. [Google Scholar] [CrossRef]
  48. Yang, L.; Luo, P.; Wen, L.; Li, D. Soil organic carbon accumulation during post-agricultural succession in a karst area, southwest China. Sci. Rep. 2016, 6, 37118–37126. [Google Scholar] [CrossRef]
  49. Li, J.; Wen, Y.; Li, X.; Li, Y.; Yang, X.; Lin, Z.; Song, Z.; Cooper, J.M.; Zhao, B. Soil labile organic carbon fractions and soil organic carbon stocks as affected by long-term organic and mineral fertilization regimes in the North China Plain. Soil Tillage Res. 2018, 175, 281–290. [Google Scholar] [CrossRef] [Green Version]
  50. Zhang, X.; Yue, Y.; Tong, X.; Wang, K.; Brandt, M. Eco-Engineering controls vegetation trends in southwest China karst. Sci. Total Environ. 2021, 770, 145–160. [Google Scholar] [CrossRef]
  51. Benbi, D.K.; Brar, K.; Toor, A.S.; Singh, P. Total and labile pools of soil organic carbon in cultivated and undisturbed soils in northern India. Geoderma 2015, 237–238, 149–158. [Google Scholar] [CrossRef]
  52. Yue, Y.; Liao, C.; Tong, X.; Wu, Z.; Brandt, M. Large scale reforestation of farmlands on sloping hills in South China karst. Landsc. Ecol. 2020, 35, 1445–1458. [Google Scholar] [CrossRef]
  53. Hu, Z.L.; Pan, G.X.; Li, L.Q.; Du, Y.X.; Wang, X.Z. Changes in pools and heterogeneity of soil organic carbon, nitrogen and phosphorus under different vegetation types in Karst mountainous area of central Guizhou Province, China. Acta Ecol. Sin. 2009, 8, 4187–4195. [Google Scholar]
  54. Liu, S.; Wei, Z.; Wang, K.; Pan, F.; Shan, Y.; Shu, S. Factors controlling accumulation of soil organic carbon along vegetation succession in a typical karst region in Southwest China. Sci. Total Environ. 2015, 521–522, 52–58. [Google Scholar] [CrossRef] [PubMed]
  55. Wang, G.; Liu, Y.; Cui, M.; Zhou, Z.; Zhou, J. Effects of secondary succession on soil fungal and bacterial compositions and diversities in a karst area. Plant Soil 2021, 21, 5016–5028. [Google Scholar] [CrossRef]
  56. Cao, Z.; Zhang, K.; He, J.; Yang, Z.; Zhou, Z. Linking rocky desertification to soil erosion by investigating changes in soil magnetic susceptibility profiles on karst slopes. Geoderma 2021, 389, 114949–114960. [Google Scholar] [CrossRef]
  57. Duval, M.E.; Martinez, J.M.; Galantini, J.A. Assessing soil quality indices based on soil organic carbon fractions in different long-term wheat systems under semiarid conditions. Soil Use Manag. 2019, 36, 71–82. [Google Scholar] [CrossRef]
  58. Pang, D.; Cui, M.; Liu, Y.; Wang, G.; Zhou, J. Responses of soil labile organic carbon fractions and stocks to different vegetation restoration strategies in degraded karst ecosystems of southwest China. Ecol. Eng. 2019, 138, 391–402. [Google Scholar] [CrossRef]
Figure 1. Location of soil sample plot at different bedrock exposure rates in karst rocky desertification area.
Forests 13 00516 g001
Figure 2. SLOCF concentrations at different bedrock exposure rates. SF (secondary forest); LBE (light bedrock exposure); MBE (moderate bedrock exposure); IBE (intense bedrock exposure). Different lowercase letters indicate significant differences (p < 0.05). In the article, (ac) Soil depths of 0–10 cm, 10–20 cm and 20–30 cm, respectively.
Forests 13 00516 g002
Figure 3. SLOCF stocks at different bedrock exposure rates. SOCs, MBCs, DOCs, EOCs and LFOCs represent the stocks of SOC, MBC, DOC, EOC and LFOC, respectively. SF (secondary forest); LBE (light bedrock exposure); MBE (moderate bedrock exposure); IBE (intense bedrock exposure). Different lowercase letters indicate significant differences (p < 0.05). (ac) Soil depths of 0–10 cm, 10–20 cm and 20–30 cm, respectively.
Forests 13 00516 g003
Figure 4. Proportion of SLOCFs in different bedrock exposure rates. MBC/SOC, DOC/SOC, EOC/SOC, and LFOC/SOC represent the proportions of MBC, DOC, EOC and LFOC to SOC, respectively. SF (secondary forest); LBE (light bedrock exposure); MBE (moderate bedrock exposure); IBE (intense bedrock exposure). Different lowercase letters indicate significant differences (p < 0.05), ns is no significant. (ac) Soil depths of 0–10 cm, 10–20 cm and 20–30 cm, respectively.
Forests 13 00516 g004
Figure 5. Sensitivity index (SI) of SLOCFs at different bedrock exposure rates. LBE (light bedrock exposure); MBE (moderate bedrock exposure); IBE (intense bedrock exposure). (ac) Soil depths of 0–10 cm, 10–20 cm, and 20–30 cm, respectively.
Forests 13 00516 g005
Figure 6. Linear regression of SLOCFs and SOC at different bedrock exposure rates. (a) secondary forest; (b) light bedrock exposure; (c) moderate bedrock exposure; and (d) intense bedrock exposure.
Forests 13 00516 g006
Figure 7. Redundancy analysis of correlation indexes between SLOCFs and SOC under different bedrock exposure rates in karst rock desertification area. SF (secondary forest); LBE (light bedrock exposure); MBE (moderate bedrock exposure); IBE (intense bedrock exposure). LI (liability index); CPMI (carbon pool management index); CPI (carbon pool index); and L (soil liability of carbon). SOC (soil organic carbon); MBC (microbial biomass carbon); DOC (dissolved organic carbon); EOC (easily oxidized organic carbon) and LFOC (light fraction organic carbon).
Forests 13 00516 g007
Table 1. Soil liability of carbon (L), liability index (LI), carbon pool management index (CPMI), and carbon pool index (CPI) in karst rocky desertification areas with different bedrock exposure rates.
MeasuresSoil Layers (cm)CPILLICPMI
SF0–100.12 ± 0.01 Aa
10–200.18 ± 0.03 Aa
20–300.13 ± 0.03 Aa
LBE0–101.48 ± 0.41 Ab0.09 ± 0.01 ABa0.79 ± 0.14 Aa115.5 ±32.1 Aa
10–202.39 ± 0.44 Ab0.03 ± 0.01 Cb0.20 ± 0.05 Bb47.46 ± 13.33 Ab
20–303.74 ± 0.72 Aa0.03 ± 0.01 Bb0.26 ± 0.02Bb97.3 ± 22.8 Aab
MBE0–100.77 ± 0.21 Aa0.07 ± 0.01 Ba0.61 ± 0.15Aa45.09 ± 8.93 Aa
10–200.76 ±0.06 Ca0.08 ± 0.02 Ba0.43 ± 0.05Aa32.72 ± 4.70 Aa
20–300.72 ± 0.19 Ba0.08 ± 0.01 Aa0.70 ± 0.23Aa49.30 ± 18.80 Aa
IBE0–101.65 ± 0.60 Aa0.07 ± 0.02 Ba0.60 ± 0.28Aa96.70 ± 61.80 Aa
10–201.64 ± 0.19 Ba0.06 ± 0.01 BCa0.31 ± 0.03 Ba50.59 ± 4.17 Aa
20–301.61 ± 0.52 Ba0.03 ± 0.01 Ba0.28 ± 0.07 Ba45.90 ± 24.6 Aa
Note: SF (secondary forest); LBE (light bedrock exposure); MBE (moderate bedrock exposure); IBE (intense bedrock exposure). Different lowercase letters represent significant differences between different soil layers, and different uppercase letters represent significant differences between different treatments (p < 0.05).
Table 2. Statistical table of redundancy analysis of soil labile organic carbon fractions and organic carbon related indexes.
AxisIIIIIIIVExplains (%)Pseudo-FP
Eigenvalues0.70290.01620.00040.00
Explained variation70.2971.9171.9571.95
Pseudo-canonical correlation0.84700.91210.89630.3604
Explained fitted variation97.6999.94100.00100.00
SOC62.316.50.002
MBC56.813.10.002
DOC36.95.90.05
Publisher’s Note: MDPI stays neutral with regard to jurisdictional claims in published maps and institutional affiliations.

