Article

Productivity and Seasonality Drive Total Soil Respiration in Semi-Arid Juniper Woodlands (Juniperus thurifera L., Southern Spain)

by
Francisco Antonio García Morote
1,2,*,
Manuela Andrés Abellán
1,2,
Eva Rubio
2,3,
Eduardo Martínez García
4,
Francisco García Saucedo
2,
Marta Isabel Picazo Córdoba
2 and
Francisco Ramón López Serrano
1,2
1
Higher Technical School of Agricultural and Forest Engineering, University of Castilla-La Mancha, Campus Universitario s/n, 02071 Albacete, Spain
2
Renewable Energy Research Institute (Environment and Forest Resources), University of Castilla-La Mancha, Campus Universitario s/n, 02071 Albacete, Spain
3
Applied Physics Department, University of Castilla-La Mancha, Campus Universitario s/n, 02071 Albacete, Spain
4
Department of Forest Ecology and Management, Swedish University of Agricultural Sciences, Skogsmarksgränd 17, SE-901 83 Umeå, Sweden
*
Author to whom correspondence should be addressed.
Forests 2022, 13(4), 538; https://doi.org/10.3390/f13040538
Submission received: 15 February 2022 / Revised: 25 March 2022 / Accepted: 27 March 2022 / Published: 30 March 2022
(This article belongs to the Section Forest Ecology and Management)

Abstract

:
We analyzed the relationship between forest productivity (joint effect of forest maturity and soil quality) and total soil respiration (µmol CO2 m−2 s−1) in semi-arid juniper woodlands (young woodlands growing in abandoned farmlands with deeper soils, and mature woodlands in lithic soils), and investigated the seasonal variation in soil CO2 efflux as a function of soil temperature and the soil water content. We measured the soil CO2 efflux from twelve cylinders in the soil over a three-year period using LI-6400 equipment. The results show that, in the more productive site (young woodland), soil CO2 efflux was higher due to greater respiration, mainly in the driest periods. Soil respiration followed a seasonal trend, being higher in spring and decreasing in cold periods. In both juniper woodlands and especially in the older forest, the CO2 efflux rates were low (<2.5 for Q10), typical of slow-growing species. Soil respiration was controlled by soil temperature without drought and in the temperate-warm season, whereas respiration showed sensitivity to soil water content in periods when edaphic humidity was low (but only in the more productive, young forest, which seemed to show better adaptation to drought), and under high soil moisture (soil water > 25%) for both woodlands, coinciding with warm temperatures in the spring. This period also corresponded to the highest CO2 efflux recorded in both woodlands. The accumulation of organic C seems to also be important to maintain elevated soil respiration in summer, especially in young woodlands. Thus, apart from microclimatic conditions, factors related to productivity regulate respiratory activity.

1. Introduction

The soil-to-atmosphere CO2 efflux constitutes a large part of the terrestrial C cycle and is the second-largest cause of terrestrial carbon flux [1,2]. The soil CO2 efflux is defined as total soil respiration because it is mainly produced by underground respiration [3]. Total soil respiration is the sum of autotrophic respiration by plant roots and heterotrophic respiration by soil microbes and organisms [4,5], with the contribution of root respiration to total soil respiration being 0.54, 0.41, 0.56, 0.22, and 0.50 for the boreal evergreen needleleaf, temperate deciduous broadleaf, temperate evergreen needleleaf, temperate evergreen broadleaf, and tropical evergreen broadleaf forests, respectively [6].
Soil respiration is an important component of the ecosystem-scale C cycle [3,6,7]. In forests, Net Primary Production (NPP) is estimated to be the difference between Gross Primary Production (GPP) and autotrophic respiration [3,8]. Therefore, soil respiration is regarded as a key variable that allows the analysis of forests from the point of view of their growth as well as their responses to climate change [6,8]. Respiratory activity of soils is also a decisive process in the C cycle because soils can store carbon for longer periods compared with foliage and fine roots [9].
Soil temperature and soil moisture seem be the main drivers of temporal variation in total soil respiration and its components [8,10,11,12]. Therefore, seasonal microclimatic changes in the soil must play an important role in soil functioning [13]. Higher temperatures are often associated with higher rates of soil respiration, both by accelerating rates of C cycling via autotrophic respiration and providing positive feedback through heterotrophic respiration [14]. However, the complex interactions between soil temperature and soil moisture are still poorly understood [12]. Soil CO2 efflux is positively correlated with the near-surface soil temperature and is most commonly modeled using the Arrhenius function [15,16]. This exponential function is commonly applied to calculate the temperature sensitivity (Q10) as an indicator of the soil respiration rate [10,17,18]. Chamber-based measurements are often used to measure the total soil respiration by scaling-up point measurements to stand or whole-tree scales [19]. In fact, belowground measurements related to the C cycle as functions of autotrophic and heterotrophic components are difficult and expensive to carry out, while measuring the total soil respiration to estimate soil activity is straightforward and commonly performed [4].
On a larger scale, total soil respiration varies between ecosystems, and different plant communities frequently show different rates of soil respiration [6]. The type of vegetation affects the soil respiration not only because of its influence on the microclimate and the structure of the soil but also through the amount of litter deposited in the soil and the root activity [20]. As a consequence, previous studies have found a positive correlation between forest productivity and soil respiration [6,21,22]. Studies focusing on soil CO2 efflux are necessary because climate warming could alter the current forest species composition and require adaptation due to changes in soil conditions such as moisture, temperature regime, and thus soil respiration. To evaluate climate change effects on CO2 flux at the ecosystem level, it is critical to understand the responses of each site [23]. In this sense, recent studies have investigated the role of temperate forest soils in C cycling [5,7,16], but there is still a need to better understand soil functioning in arid and semi-arid woodlands (“drylands”), which are understudied ecosystems.
Arid and semi-arid areas cover approximately 47% of the earth’s surface, accounting for 4357 Mha of the global forest cover [24]. Forests in these areas, characterized by low precipitation and high evaporation rates, are exposed to a high level of climatic variability, and usually exhibit low soil fertility, affecting biomass production. These regions are of particular interest for the global C budget because their ecosystems are responsible for up to 20% of terrestrial Net Primary Productivity [25]. Semi-arid woodlands are widespread in regions with a Mediterranean climate where, in summer, long, dry periods are interrupted by heavy rainfall events. However, information about C dynamics in the soil in these environments remains scarce, and the effect of the interplay between soil temperature and soil moisture on soil respiration is not completely studied. More specifically, studies carried out in woodlands dominated by the Juniperus genus in areas with a semi-arid climate are practically nonexistent.
The Juniperus genus is a major component of arid and semi-arid woodlands throughout the Northern Hemisphere [26], and comprises approximately 50 coniferous tree and shrub species [27]. Juniperus originated in Eurasia and was part of the south Eurasian Tethyan vegetation from the Eocene to the Oligocene [28]. Therefore, it is a relic of Tertiary forests, containing slow-growing species that are well-adapted to climates with hot, dry summers typical of semi-arid climates [29]. The Spanish juniper (Juniperus thurifera L., Cupressaceae) is an endemic dioecious species of the Western Mediterranean. J. thurifera var. hispanica Mill. is only found in Spain and the French Pyrenees [30], and due to its rarity and slow growth, it has been included in catalogs of endangered species in Spain. The phytoclimatic area of this evergreen conifer is correlated with severe climates [31], such as those predicted in climate change scenarios [32]. For this reason, this species is utilized for forest restoration in sites with low productivity, such as semi-arid areas [26]. Thermophilic juniper woodlands occupy the driest areas of the distribution of Juniperus thurifera in Spain [30]. The species here constitute relict forests [33] that can be classified into two levels of maturity and productivity [34]: (i) old or mature woodlands that generally contain trees that are over 150 years old that grow in stony soils with a low tree density (<100 trees ha−1), and (ii) young woodlands, with trees that are less than 100 years old growing in abandoned farmlands (i.e., better soils with a higher water storage capacity). These forests have higher growth rates, productivity, and tree density [34,35].
After analyzing our study area, we hypothesized that total soil respiration would differ among the woodlands, and in addition to forest productivity, these differences would also be controlled by microclimatic factors. Consequently, the specific aims were the following: (i) to analyze the effects of the juniper woodland type (young and mature woodlands, effects of forest “productivity”) on soil CO2 efflux, (ii) to study the seasonal variation in soil CO2 efflux in the two juniper woodlands under a semi-arid Mediterranean climate (“seasonality”), and (iii) to evaluate the effects of microclimatic conditions (soil temperature and soil water content) on soil CO2 efflux for both juniper woodlands throughout the seasons.

2. Materials and Methods

2.1. Study Area

This research was carried out in the Spanish juniper woodlands of the El Campo de Montiel Mountains (Southern Spain; Figure 1).
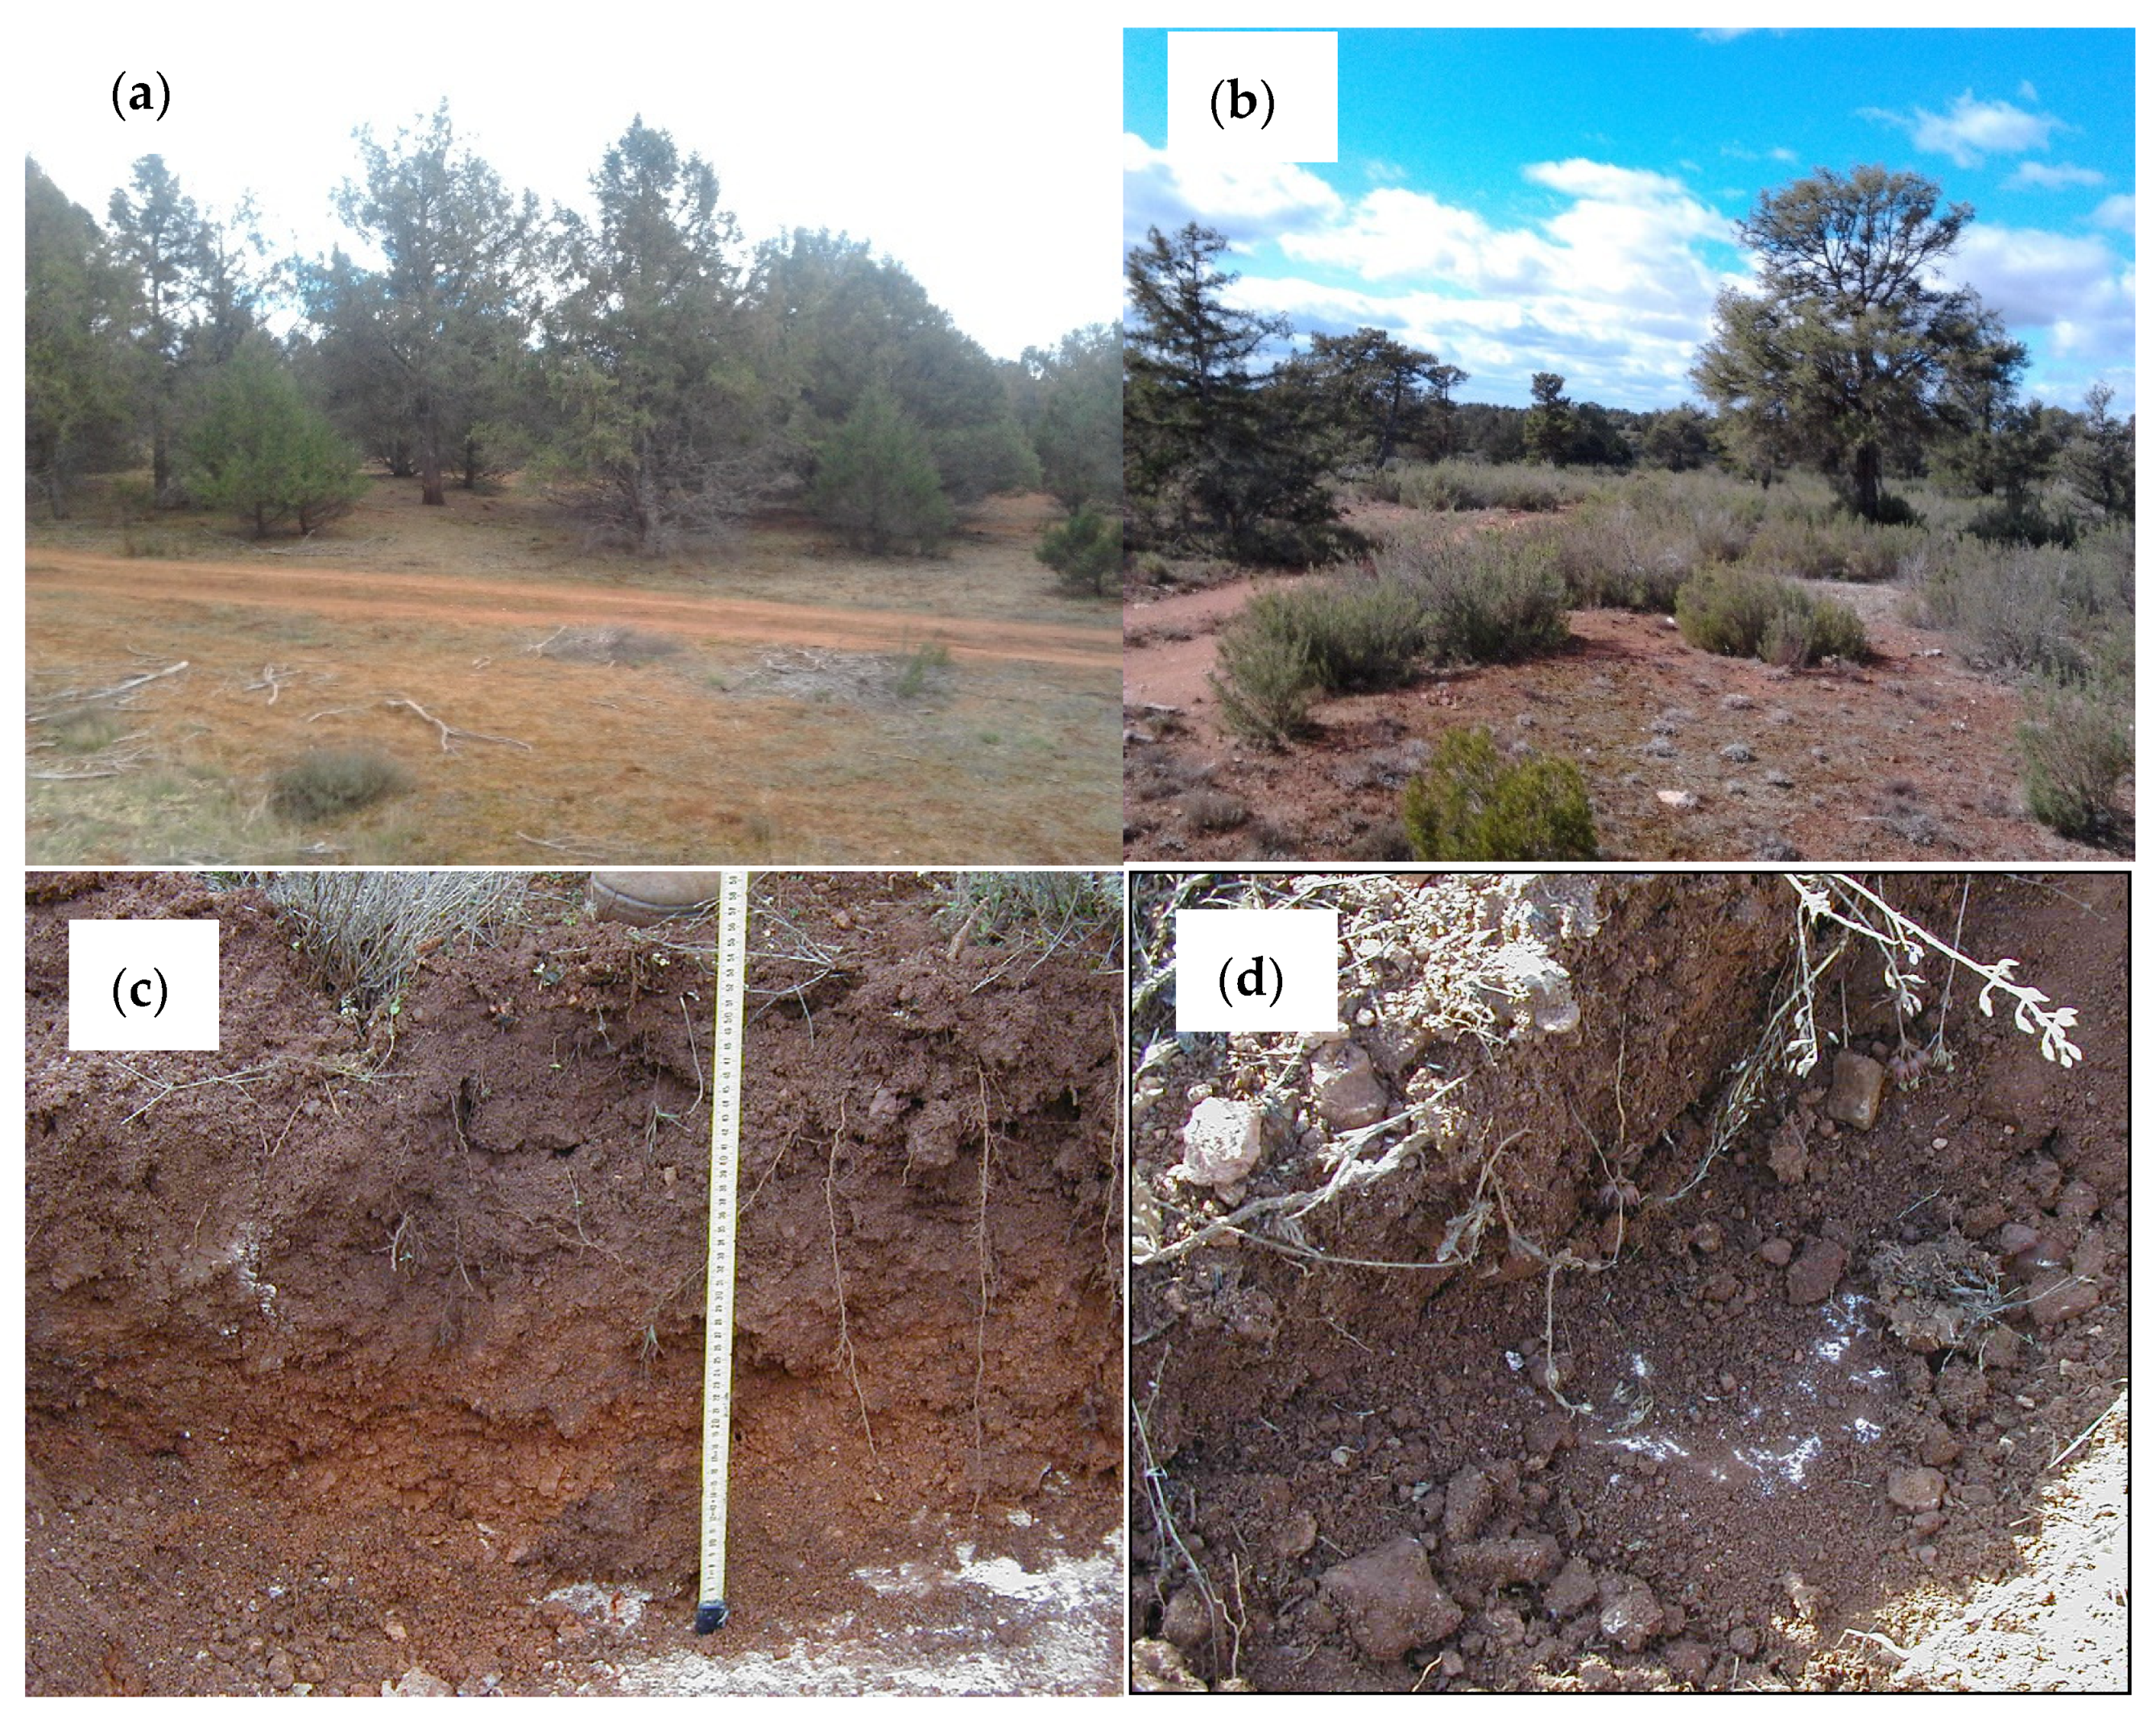
These juniper woodlands are thermophilic according to [30]. The climate is semi-arid cold (BSk type, KÖPPEN [36]) with extreme temperatures of between 43 and −21 °C (data from “El Bonillo” station: 38°57′ N, 01°09′ W, 1068 m.a.s.l., period of 30 years, located within 7 km of the research area, and owned by the State Meteorological Agency of Spain). The average annual temperature is 12.8 °C, and annual rainfall corresponds to a dry ombroclimate (450 mm). Soils in which the total soil CO2 efflux was measured were selected from the two types of thermophilic juniper woodland (Table 1, and Figure 2): (i) mature woodland with an average age of 170 years, growing in Leptosols (soil depth < 15 cm), and (ii) young woodland with a mean age of 66 years, growing in abandoned farmlands with deeper soils (Cambisols, with a mean depth of 42 cm).
In each type of juniper woodland, a representative and homogenous experimental area (“plots”, approximately 1 hectare) was selected. The areas were less than 1 km apart, ensuring that both woodlands are growing under the same climatology, as well as similar altitude (1050 m.a.s.l.), slope (gentle slopes, 5°), and exposure (paramo formation, flat surfaces). Referring to vegetation characteristics (Table 1, vegetation variables have been collected from the study of Garcia [33]), biomass stocks and productivity were scarce in both woodlands. However, the young site has higher productivity. Juniper trees in the young woodland area have slow growth, and trees in the mature woodland area represent very-slow-growing species. Litterfall and the LAI are also higher in young woodlands due to the superior productivity (joint effect of age and quality of soil). The two juniper woodlands contained lime-rich substrates (Jurassic dolomites) with a basic pH (Table 1, soil characteristics). The soils in the young woodland area had a greater clay content and water storage capacity (137.1 vs. 20.5 mm). The bulk density was slightly greater in the mature woodland.

2.2. Measurement of Soil CO2 Efflux

Total soil CO2 efflux (µmol CO2 m−2 s−1) was measured in situ on 17 sampling days, spread over the 4 seasons (2 sampling days in winter, 3 in summer and autumn, and 9 in spring, the most important growing season). Within each woodland area, six metallic collars (cylinder: 10.5 cm in diameter and 5 cm in height) were installed on the soil between the trunk and the projection limit of the crown in six juniper trees (Figure 3). Thus, a total of 12 metal cylinders were installed on the soil for the respiration measurement (6 juniper trees in each of the mature and young forests).
The total soil CO2 efflux was measured using LI-6400 CO2 measurement equipment (LI-COR, Inc., Lincoln, NE, USA), to which an LI-6400-09 chamber was attached (closed system). For each CO2 efflux measurement, three repeated measurements were performed, and the mean was the value used for data analysis. Thus, the total dataset included 204 measures. The measurements were conducted from 9:00 to 15:00 to minimize the effects of daytime soil temperature fluctuations and rainless days [10]. Measurements were performed by reducing the CO2 concentration inside the chamber and then letting it increase to an upper concentration limit. Before starting each measurement, the ambient CO2 concentration was used as the target. The air CO2 concentration ranged between 370 and 421 p.p.m. during the research. The air flow (µmol air s−1) pumping down was fixed depending on the efflux level (200–700 for low and high efflux levels, respectively). The rate of change of CO2 inside the chamber was calculated in three consecutive measurement cycles.

2.3. Microclimatic Conditions and Organic Matter in Soils: Measurement of the Soil Temperature (Ts, °C), Soil Water Content (Sw, %), and Soil Organic C (%)

The soil temperature (°C) was measured at a depth of 7 cm below the ground surface next to each collar using a temperature probe. Temperature measurements were recorded with HOBO sensors and data loggers (Onset Computers, Bourne, MA, USA). The soil water content (volumetric moisture, %) was measured with WatchDog sensors and data loggers (Spectrum Technologies, Aurora, IL, USA) close to the collars (at the depth of 7 cm). Finally, to determine the soil organic C, four samples of topsoil (0–10 cm) were collected in each woodland type in each season for the two years (in the middle of the season) using a soil core (5 cm inside diameter). To minimize the soil variability, each soil sample was made up of five random subsamples collected between the trunk and canopy edge. Soil samples were taken from the upper 10 cm layer after the litter had been removed (this layer presents the greatest microbial activity because of the shallowness of soils). In the laboratory, soil samples were sieved (<2 mm) and stored at 4 °C until analysis. The total soil organic carbon (%) content was determined by oxidation with K2CrO7 in an acid medium and titration of the excess dichromate with (NH4)2Fe(SO4)2 [39]. Samples were analyzed by assessing three replicates in the laboratory, and the mean value was used as the sampling data.

2.4. Data Analysis

The influence of main factors on soil respiration (Rs, µmol CO2 m−2 s−1) was analyzed using a nested linear mixed model (LMM) with woodland type as the fixed factor (two levels: young and mature woodland), measurement day (date) as the repeated fixed factor (17 levels, to study the seasonality in Rs), and collar nested within woodland as the random factor. Random variance components were calculated using restricted maximum likelihood estimation (RMLE). Two variance structures were considered (compound symmetry and continuous AR1). Bayesian Information Criterion (BIC) and Akaike Information Criterion (AIC) were used as criteria for the selection of the best model. Mean values were compared using Fisher’s LSD post-hoc test (α = 0.05). Linear mixed models were made using the nlme package in R [40]. It the model, “woodland type” (W) was a confounded effect of both maturity (age) and soil quality (depth and water retention capacity). For this, “woodland” represents the productivity of the juniper sites.
To analyze the relationships among the total soil CO2 efflux (Rs, µmol CO2 m−2 s−1), soil temperature (Ts, °C), and/or soil water content (Sw, %) throughout the seasons included in the study period, the following bivariate model was fitted [41]:
Rs = e x p ( β 0 + β 0 W ) + ( α + α W ) × Ts   S w ( β 1 + β 1 W ) × ε
In Model 1, the effect of the juniper woodland type on the soil CO2 efflux was included through the dummy variable “W” (W = 0 for mature woodland, and W = 1 for young woodland). Model 1 shows the exponential relationship between cell respiration and temperature [42] and adds the influence of soil moisture on this relationship. In the model, Ts was standardized by 10 °C (Ts/10) to obtain the Q10 value [43]. When the soil water content (Sw) was not significant and was therefore removed from Model 1, we obtained a univariate model to describe the sensitivity of Rs to soil temperature, described by the coefficient Q10 (temperature coefficient):
Rs = e x p ( β 0 + β 0 W ) + ( α + α W ) × Ts   × ε
where α and α′ are the coefficients of temperature sensitivity of soil respiration for mature and young woodlands, respectively. The temperature coefficient, Q10 (rate of variation of Rs when the soil temperature increased by 10 °C), was calculated from the univariate function as [41,43]: Q 10 = e ( α + α W ) , α for mature woodland and α + α′ for young woodland, if W was significant. Thus, significant equations in function of the woodland type could be formulated in their exponential forms [5,44]: Rs = Rr × Q 10 T s T r 10 , where Rr is the respiration at the reference temperature (Tr), which was fixed at 0 °C in our study. Models and Q10 values were estimated for the short term, i.e., seasons (“seasonality” of Q10), and the long term (yearly, i.e., the annual whole data for all seasons without division by years [16]) for each woodland area.
The selection of significant parameters in Model 1 was carried out by means of logarithmic transformation (linearization of the exponential function [44,45]) and stepwise regression [46]: log ( Rs ) = ( β 0 + β 0 W ) + ( α + α W ) × Ts + ( β 1 + β 1 W )   ln ( Sw ) + ε .
This corresponds with the comparison of two regression lines as well as the study of significant differences in Q10 between the two woodlands during the seasons [44]. In all regressions fitted, coefficients with a value of p < 0.05 were considered significant [46]. The linear regressions were assessed according to the F ratio (p < 0.05) and the adjusted R2 (%). Values with absolute DIFT > (2 × n p ) were considered influential points (p is the number of coefficients, and n is the number of data [47]) and were removed. Regressions were fitted using Statgraphics Centurion XVIII® software (Statgraphics Technologies, Inc., The Plains, VA, USA). Regression models were assessed for seasonal and annual periods.

3. Results

3.1. Effects of Juniper Woodland Type on Soil CO2 Efflux

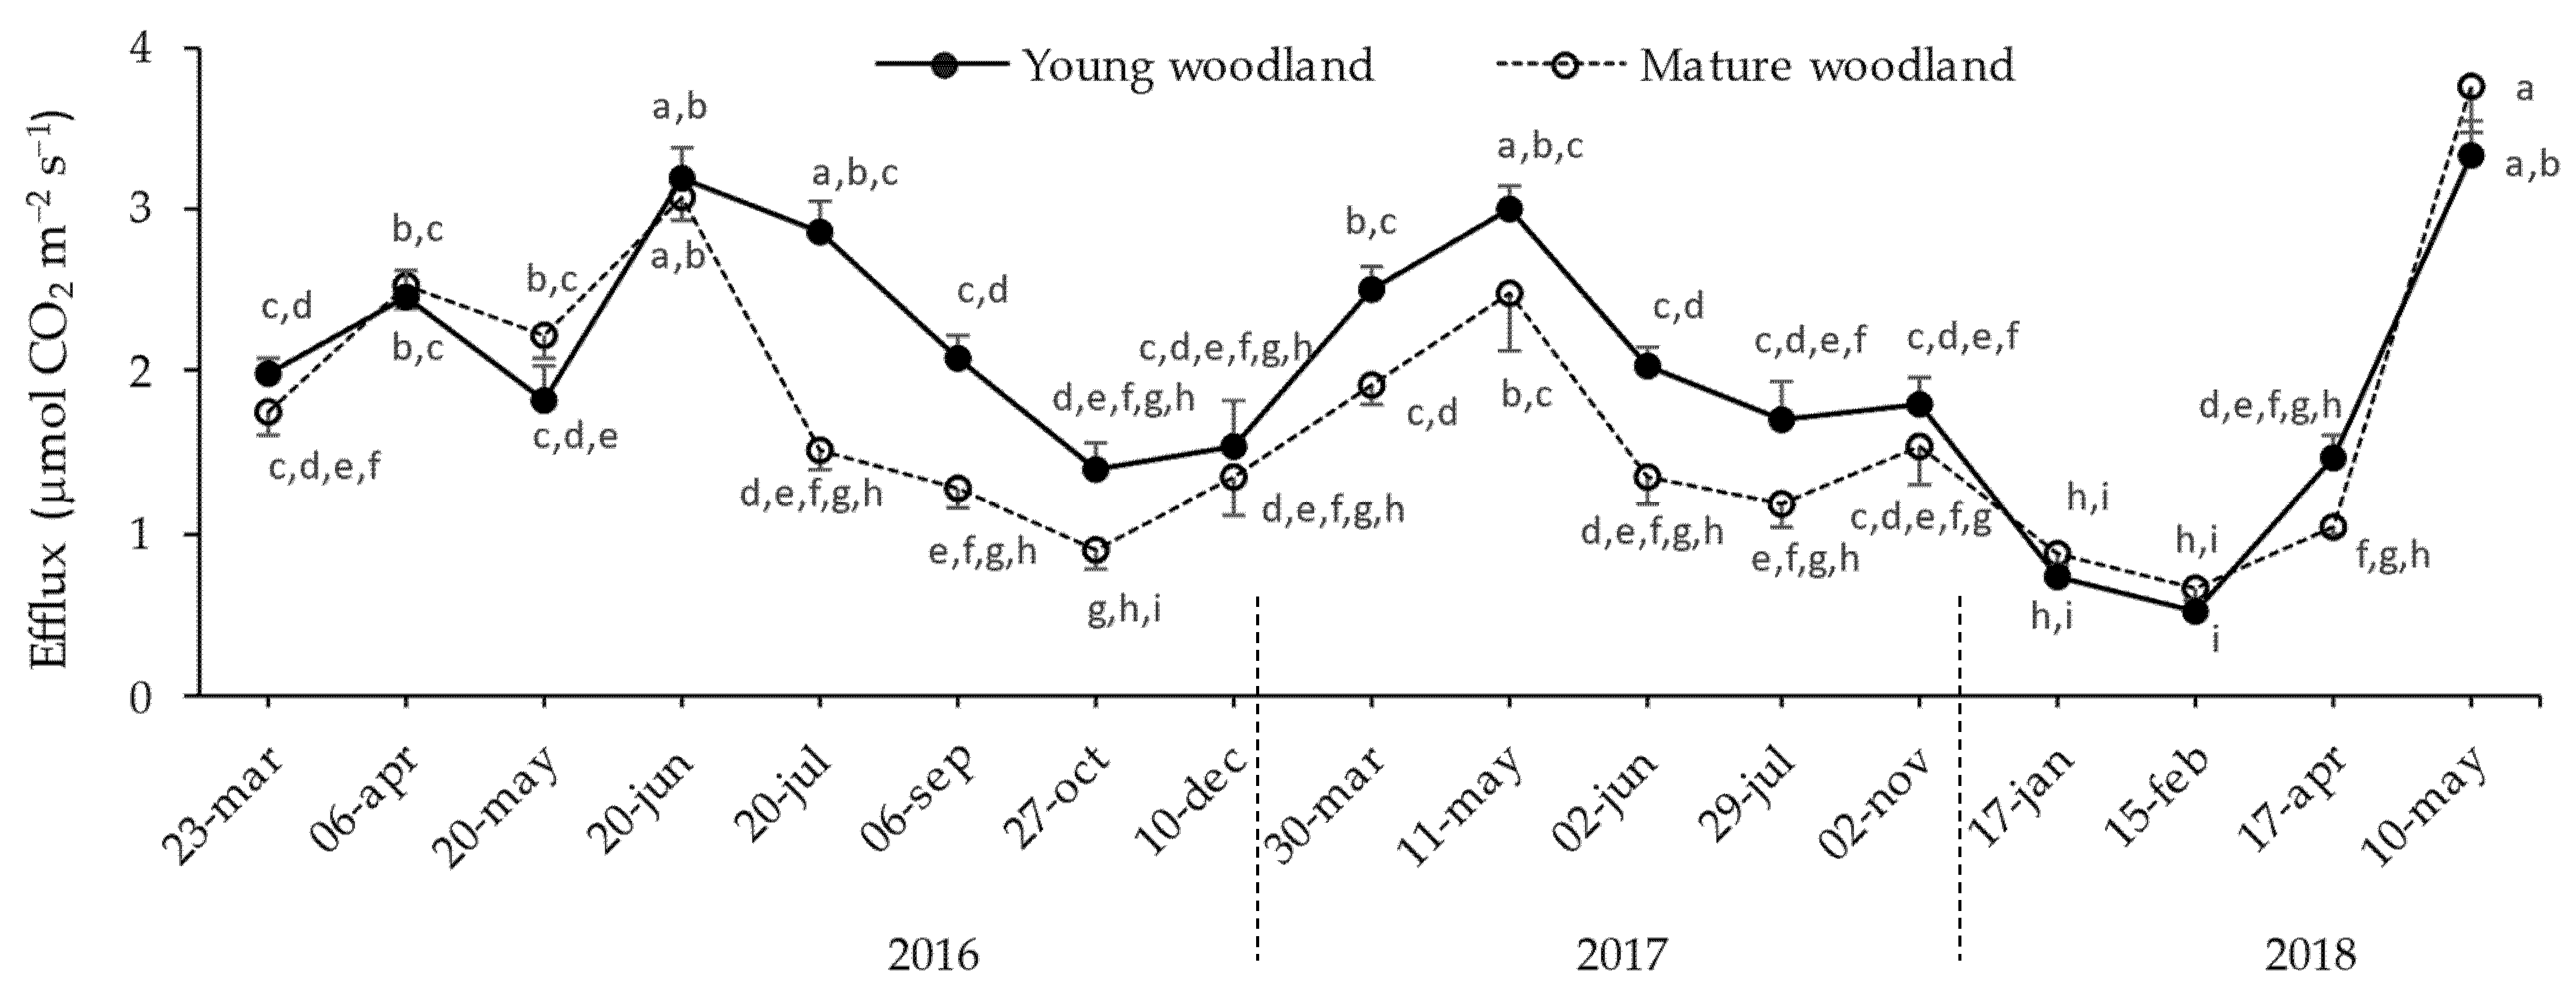
Table 2 shows the main statistics for the selected linear mixed model with the lowest AIC (482.30) and BIC (654.77). The continuous AR1 variance was included in this model. The “woodland type” (W, productivity) was shown to significantly affect soil CO2 efflux (F = 7.8; p = 0.006; Table 2) because the mean soil respiration was higher in the young woodland (2.03 ± 0.10 vs. 1.73 ± 0.10 μmol CO2 m−2 s−1). The interaction between the fixed factors also significantly influenced Rs (p = 0.028). Thus, throughout the study period, the soil respiration response differed in function of seasonality for each woodland type.

3.2. Seasonal Variation of Soil CO2 Efflux in the Juniper Woodlands

The “date” factor (D) was shown to have a significant effect (F = 21.9; p < 0.001) on the response variable, Rs (Table 2); thus, the total soil respiration exhibited a clear seasonal variation throughout the study period (Figure 4). Overall, the maximum soil respiration rate for the two woodlands occurred in the spring months (more pronounced in May 2018, under a higher soil temperature and water content; Figure 5), the most important period for vegetation activity, whereas the minimum values were registered in the winter months (January and February), the colder season (Figure 4).
The soil CO2 efflux as a function of the woodland type was found to be clearly significant in summer months, the most important drought period. In this case, the CO2 efflux in soils was higher for the young woodland area (Figure 4). Additionally, in spring of 2017, there were significant differences between measures. In general, the soil respiration significantly decreased from spring to autumn in both sites. In the cold seasons, winter and autumn, there were no significant differences between juniper woodland types.

3.3. Microclimatic Conditions and Organic Matter: Soil Temperature (Ts, °C), Soil Water Content (Sw, %), and Soil Organic C (%)

Seasonal changes in soil temperature (Ts, °C) and soil water content (Sw, %) are shown in Figure 5. We observed that the temporal variation of the soil temperature was similar for mature and young woodland areas. However, Figure 5 shows that the soil moisture was often lower in the mature woodland because soils have less depth and water retention capacity (Table 1). The microclimatic variables were negatively correlated, in such a way that when the soil temperature increased, the soil moisture was progressively depleted.
The soil temperature (Figure 5) ranged from −1.3 ± 0.8 °C and −0.4 ± 0.3 °C (mean ± standard error) for young and mature woodlands in winter, respectively, to 27.8 ± 1.7 °C and 24.3 ± 2.9 °C (summer months, young and mature woodlands, respectively). The seasonal behavior of the soil temperature indicated a positive correlation between this variable and the soil CO2 efflux: greater soil CO2 efflux was obtained with higher soil temperature values, i.e., in spring and summer.
The soil water content (Figure 5) varied from 0.9% ± 0.1% and 1.7% ± 0.2% (27 July 2017, in summer, for mature and young woodland, respectively) to 27.9% ± 1.9% and 27.1% ± 1.9% (27 April and 10 May 2018, in spring, for mature and young woodland, respectively), with a peak of 27.6% ± 1.9% on 17 January for the young site. Due to the inherent variability that defines this semi-arid climate, mainly the soil water content in spring showed a great variation between years: in spring of 2018, the soil humidity was much higher than that recorded in the previous springs. Contrary to what happened with the soil temperature, the seasonal variation in soil moisture was not always positively correlated with the soil CO2 efflux: when the soil moisture was maximal, the soil efflux was minimal (e.g., winter), and the low value of moisture in summer did not correspond to the lower soil CO2 efflux rates. In summer, the peak of soil C could also contribute to increase the respiration (Figure 6).
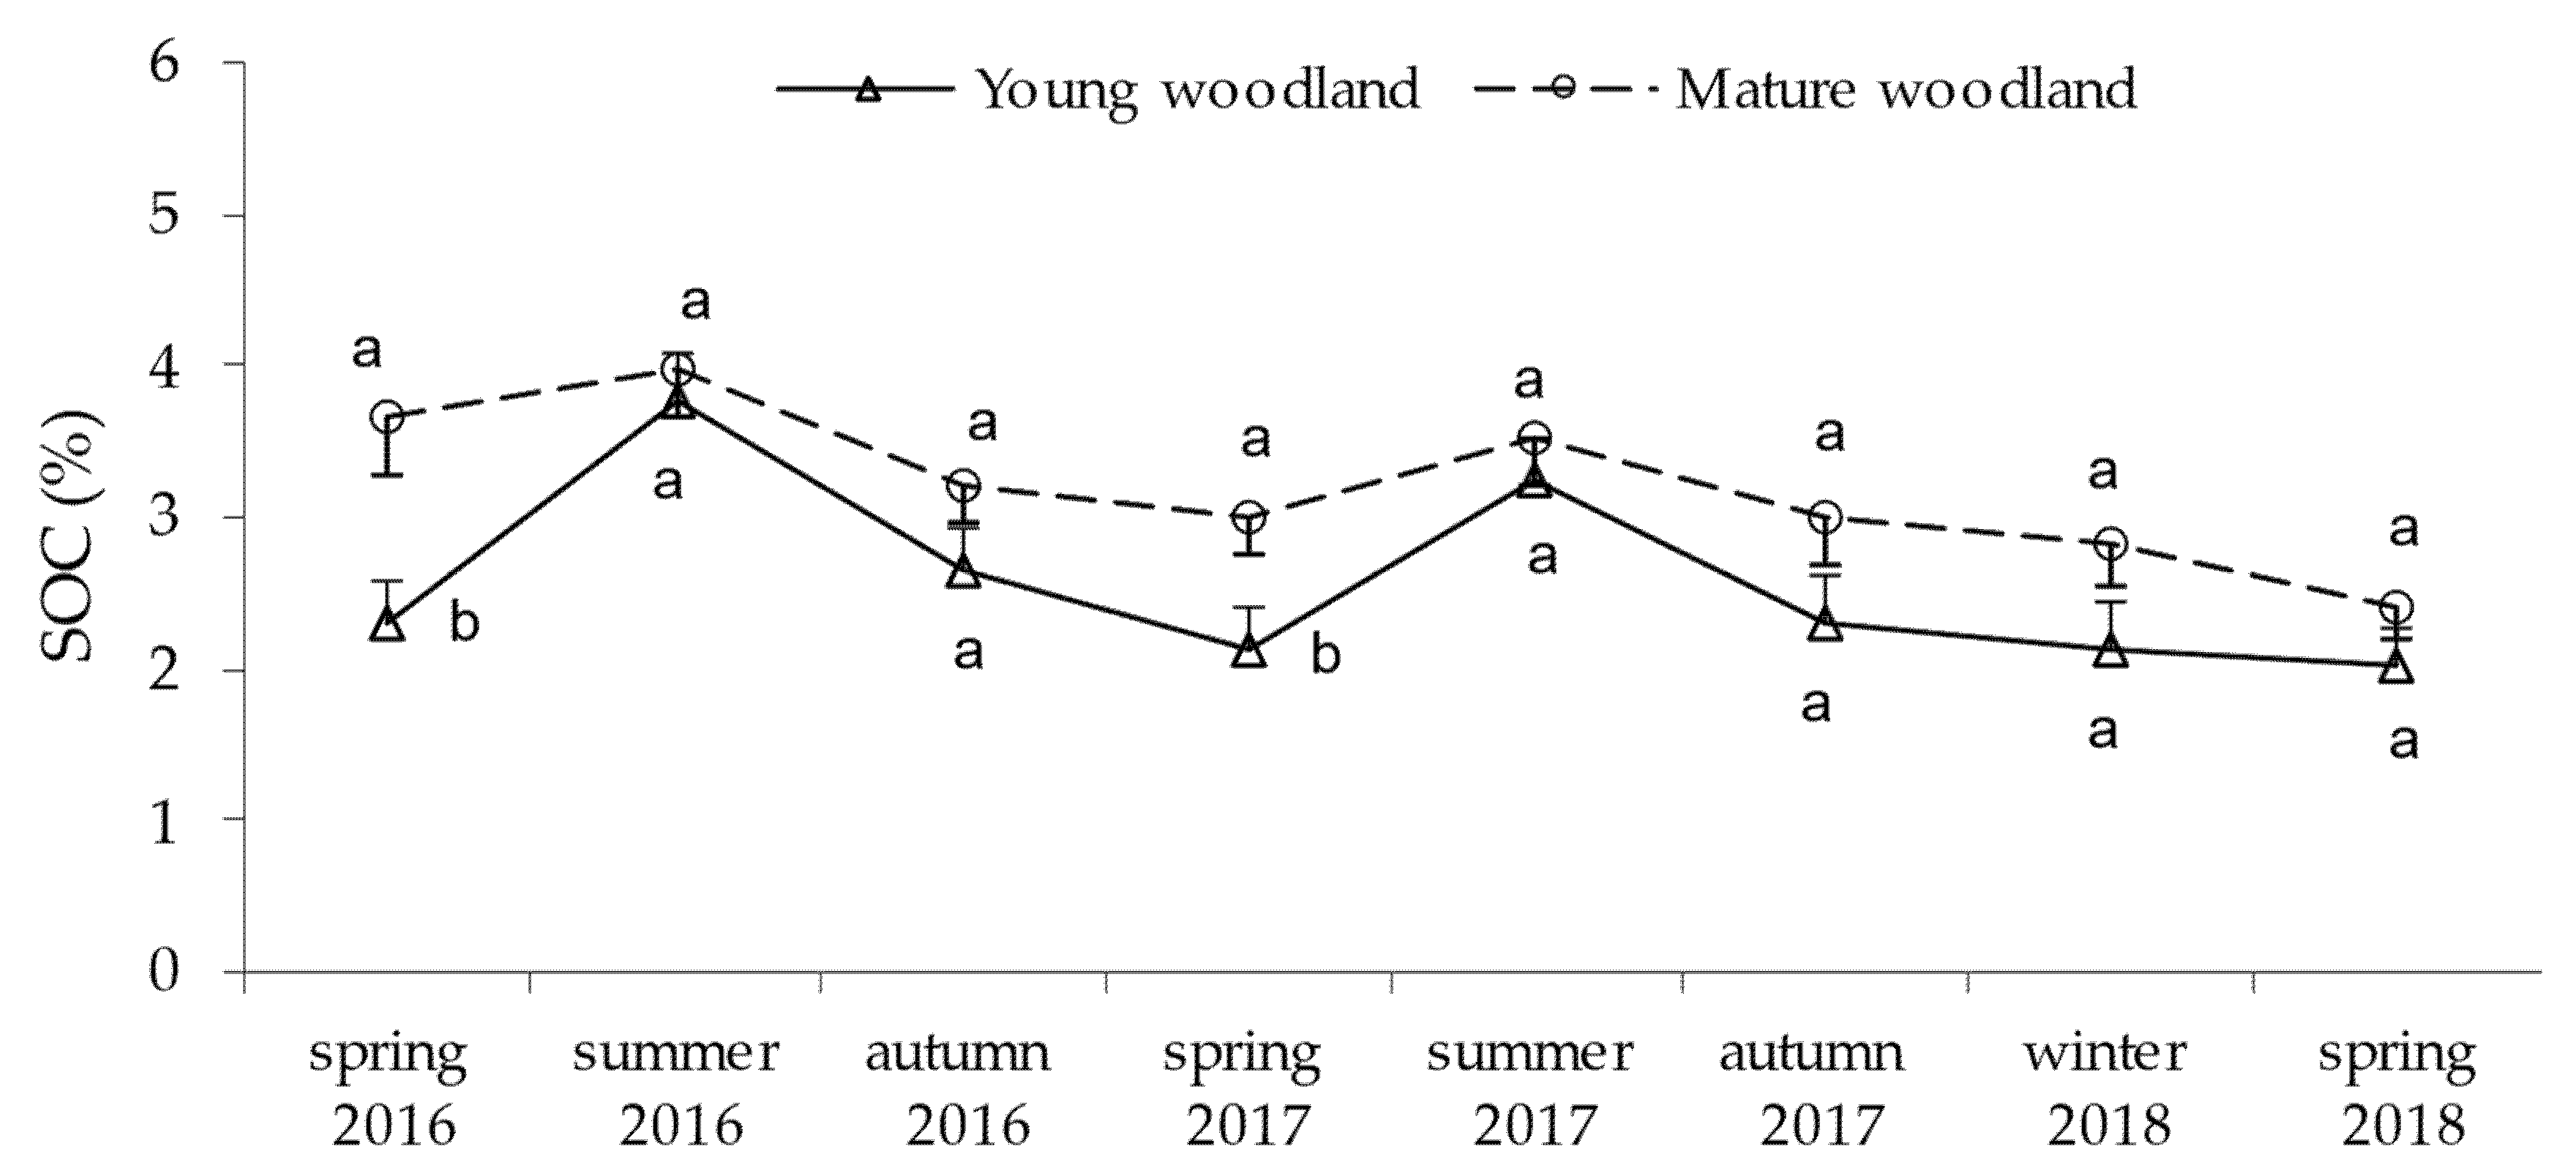
Finally, the measures of total soil organic C (SOC; Figure 6) were in the range cited by Lal [48] for forest soils. Overall, the value of SOC was slightly greater in mature than in young woodlands (average annual value of 3.27% vs. 2.58%, respectively). Despite the higher litterfall in the young site, the existence of a greater amount of organic C in the mature woodland area is noteworthy and could be a consequence of the greater cumulative deposition of organic matter over the years [35]. SOC also experienced seasonal variations, reflecting a general trend with the peak in the summer (more pronounced in the young juniper woodland) and decreases in autumn and winter. At the season level, significant differences in SOC between sites were obtained in the months of spring. In spring 2016 and 2017 (the soil respiration was only measured until 10 May 2018), soil organic C was higher in the older woodland, probably due to the greater accumulation of C that did not return to the atmosphere by respiration, and a fraction of the annual C input was stabilized in soils [49]. As a consequence, the soil organic C content was more stable in the mature forest across the seasons.

3.4. Seasonal Effects of Soil Temperature and Soil Water Content on Soil CO2 Efflux

Table 3 shows the results of adjusting the regression model of soil CO2 efflux (Rs) as a function of soil temperature (Ts, °C), soil water content (Sw, %), and the woodland type, “W” (bivariate, full model: Model 1). Parameters showing that the dummy variable (W) was significant (this represents two independent equations for each woodland) resulted only in fitted regressions for summer, spring 2017, and for all seasons or yearly (Table 3).
As a result of the above, Table 4 reflects the models fitted for each woodland type and as a function of seasons. This table also summarizes the microclimatic conditions (Ts and Sw) for the study period. No differences in soil temperature between juniper sites were found within a season (p > 0.05). Therefore, the differences in the respiratory process between woodlands should be attributed to other factors, such as those related to site or soil water content.
The full bivariate model (Model 1, soil temperature and soil water content as independent variables) was only significant in spring 2018 for both woodlands, and spring 2017 in the young site (Table 3 and Table 4). In addition, Model 1 reached the highest goodness of fit in spring 2018 (R2 = 94.1%; Table 3). In this model fitted for spring 2018, the high weight of the “soil water” variable (1.09) reflected that the exceptional CO2 efflux rate was mainly due to high edaphic moisture levels.
The soil water content seems to control the fitted models of soil respiration under two microclimatic conditions (Table 4): (i) under drought or low edaphic humidity (summer 2016 and spring 2017), and (ii) under high levels of soil moisture content (Sw > 25%) coinciding with warm-temperate temperatures (15–20 °C) in the growing season (conditions in spring of 2018). These microclimatic conditions also coincided with the season of the highest CO2 efflux recorded in both woodlands (especially in the mature site; Figure 4).
The univariate model (Model 2, soil respiration as a function of soil temperature) was only significant in spring 2016 (with moderate soil water content levels) and yearly or throughout all seasons (Table 3 and Table 4). Univariate models explained no more than 37% of the variance in CO2 efflux (minor compared to when Sw was included in the models). Model 2 was the same for young and mature woodland areas in spring 2016, whereas when the model was fitted for all seasons (annual data in 2016, 2017, and all data pooled), two models resulted as a function of the woodland type. Thus, the model explained different annual rates of soil respiration for both types of juniper woodland as a function of only the soil temperature: for a certain increase in soil temperature (Ts), the variation in soil CO2 efflux was significantly greater in the young juniper woodland, the most productive site (for example 1.40 vs. 1.20 in 2017). In these cases, the intra-annual effect of soil water content was confounded with the evolution of the soil temperature. Consequently, the global temperature coefficient, Q10 (rate of respiration increases when the temperature increases by 10 °C), was significantly higher for the young woodland (1.40) than for the mature one (1.20). Regardless of the reference temperature (0 °C), Q10 was invariant when the annual data were fitted by utilizing the exponential form.
Finally, for winter and autumn in the two woodland types, and in summer 2017 also for both woodlands (when soil moisture was minimal), the resulting models showed that soil respiration was independent of the soil temperature and soil water (Table 3 and Table 4), thus representing a constant function or value (eβ0). For this, the regression was not significant (p > 0.05; Table 3). The constant value indicated a higher level of respiration from summer to winter, and in the colder season, the estimated soil respiration was minimal (0.64 μmol CO2 m−2 s−1). Models of soil respiration with low, constant values could indicate minimal activity in soil, due to low or high temperatures or a severe lack of humidity, conditions that would induce junipers and soil microbes to slow down their activity. However, the response of each woodland type to the mentioned edaphic conditions was different: under the microclimatic conditions of autumn and winter (no lack of moisture), no differences in soil respiration between sites were found, whereas in the driest season of the study period, summer 2017, the soil respiration was higher in the young site, which seems to indicate that this woodland could have a better response to most severe droughts.

4. Discussion

4.1. Effects of Juniper Woodland Type and Seasonality on Soil CO2 Efflux

Due to the strong relationship between woodland type (confounding effect of productivity and maturity) and seasonality, we discuss the effects of these factors together. Globally, the total soil CO2 efflux measured at both juniper woodland sites fits the previously reported range (0.5–5 μmol CO2 m−2 s−1) for forest ecosystems [50,51]. However, the annual mean soil CO2 efflux appeared low (2.03 and 1.73 µmol CO2 m−2 s−1, for young and mature junipers, respectively) when comparing it with values from other biomes. For example, it was lower than the mean soil respiration for evergreen needleleaf forests (2.4 [50]). The results are an indicator that Spanish juniper woodlands have low productivity, which is in accordance with a previous study that focused on stem respiration in juniper trees [44].
We highlight that our results indicated a great level of seasonality in soil CO2 efflux in both juniper woodlands. It is expected that the highest level of soil respiration will be obtained in spring, the season of the greatest growth activity [52], whereas the low soil respiration activity during cold seasons could result from minimal microbial respiration and maintenance respiration from the roots of juniper trees [53]. This semi-arid climate, with a warm and dry season alternating with a cold, wet season, seemed to be a decisive factor in driving the seasonal behavior of soil activity [13].
Further, the overall mean annual soil CO2 efflux was higher in the young woodland. This is because the soil at this site maintained more respiratory activity in periods with a lack of soil humidity (summer, or dry spring); in the other seasons, there were no significant differences between sites, except for the driest spring (2017). Several factors can explain this difference in soil respiration in drought conditions, but the most important could be: (i) the higher productivity (growth rate) of the young woodland area, (ii) the higher quality of the soil (soil depth and water storage capacity) at this site, and (iii) the better adaptation or response to drought in younger juniper sites. In fact, the latter two factors are related to tree physiology and growth rates, which partly define forest production.
Referring to productivity, parameters that define the growth rate of a forest site are correlated with soil respiration [3]. The LAI is the main factor correlated with soil respiration in forest ecosystems, due to the higher accumulation of organic matter (litterfall) and Net Primary Production [8,50]. Soil C in Mediterranean ecosystems is one of the main components of the soil efflux because the C pool provides the substrate for heterotrophic organisms [54]. Spanish Juniper is a conifer species that deposits a large proportion of litter in the late spring, or early summer, to reduce transpiration when soil water content reaches a minimum [33]. Although we have only measured the soil C (the values of litterfall of Table 1 only describe the site productivity), the peak of soil organic C in summer (which was more pronounced in the young woodland) reflected an increase in deposition of litter. This could be due to the labile C released in the first stage of litter decomposition in soils [55]. Previous studies (for example, García Morote et al. [35]) also revealed the increase of the organic C pool in the season of abscission (late spring or early summer). Therefore, soil organic C could also contribute to greater respiration in young woodland areas in summer compared to mature ones. In relation to this physiological adaptation, it was found that β-glucosidase activity and basal respiration increased in summer in juniper woodlands due to the peak of organic matter accumulation [35]. The study presented by Hibbard et al. [50] confirmed that soil respiration is positively related to previous litterfall, and Chiang et al. [56] showed that soil respiration increased immediately after litterfall input to the soil.
In accordance with Jia et al. [57] and Allison et al. [58], maturity is another factor that influences soil respiration and microbial activity. Gustavo et al. [59] identified a negative correlation between stand maturity and total soil respiration, but whereas root respiration declined with age, heterotrophic respiration was correlated with soil C, and this factor slightly increased in mature forests [35]. Thus, in our study, differences in the soil CO2 efflux under drought conditions (mainly in summer, or dry spring) may have resulted from increased root respiration in young trees, as cited previously [41]. Other studies also found that the contribution of root–rhizosphere respiration increased during the drought, due to an increasing supply of recent photosynthates to the belowground system [60].
Regardless of the soil microclimatic conditions, our results also highlight an important link between tree physiology and soil processes. Given the scarcity of water resources in the mature site (with the worst soil; lower water storage capacity, in mm), it is likely that older junipers adapt to episodes of water stress by reducing growth and autotrophic respiration. This response was also observed for the stem respiration of mature juniper trees [44]. On the contrary, in the site with better soil (young woodland), vegetal activity (and autotrophic respiration) could be continued in dry periods due to the greater reserves of water and nutrients. In addition, soils in the study area have a bedrock of fissured and karstified dolomite, which permits juniper trees to obtain water from the deeper soil profiles in the summer [35], because Juniperus thurifera is a species that inverts a high percentage of biomass in its roots (belowground biomass above 30% [34]). Research in areas with similar Mediterranean climates has confirmed that deep-rooted trees have greater water availability in dry seasons [61].

4.2. Effects of Soil Temperature and Soil Water on Soil CO2 Efflux

The response of soil respiration to microclimatic conditions has not been consistent across all ranges because there are multiple confounding factors in different seasons [62,63]. In our research, the temperature sensitivity of respiration decreased under colder, wet conditions (winter and autumn), suggesting that seasonality is explained by the soil temperature without water limitations, in the temperate-growing season (spring), or when the effect of soil water was confounded (annual data). On the contrary, soil moisture was found to be significant when it is a limiting factor for soil. It is known that, for ecosystems without drought stress, soil temperature is the most important factor in determining the seasonal variation of soil respiration [41]. However, soil respiration, like other physiological processes of plants, usually responds to the most limiting factor [64], and soil moisture can become a limiting factor, especially as temperature and evaporative demand increase [14]. Especially in arid and semi-arid ecosystems, soil water can be the major factor that limits respiration sensitivity to temperature, particularly in summer [53]. In this sense, previous authors have shown that soil temperature is the main driver of soil respiration under high soil moisture conditions (above 15%), whereas under low levels, the soil water content becomes a better predictor [41,54]. In accordance with Reichstein et al. [65], soil respiration was shown to have a decreasing sensitivity to temperature in response to drought. In this semi-arid climate, high soil temperatures coincide with low moisture availability (except for spring 2018), thus confounding the effects of temperature and soil water on soil CO2 efflux.
However, our study also reflects the joint effect of high soil temperatures with very high soil moisture content (>25%) in a growing season (spring 2018). Under these microclimatic conditions, the highest respiration rates in both sites were recorded. The inherent interannual variability of the Mediterranean climate also determined differences in soil respiration and their relationships with edaphics conditions, for the same season between years, and mainly in the spring. Previous studies have also found that the relationship between CO2 efflux and microclimatic conditions depends on the magnitude of soil moisture, for example above 15% was the better predictor of the total soil respiration [54]. Some researches fixed the optimal soil moisture content for total soil respiration within a range of 15–20% [66]. Other studies showed that maximum soil respiration occurred when the soil moisture content reached the field capacity, for example 31% in beech [67]. In this sense, we hypothesize that when junipers have high levels of available soil water under warm temperatures, soil respiration could be acceleretad, as cited by Inclán et al. [54] in other mediterranean forests. These conditions would also be favorable to increase microbial activity [68,69].
Finally, the global Q10 of total soil respiration calculated for the two juniper sites fell within the range of 1.0–5.0 [70] reported for European and North-American forest ecosystems. However, in connection with the soil efflux rates measured, the Q10 value was low compared with those reported for coniferous forest [70]. The Q10 quotient may vary depending on the season, growth rate, or acclimatization situation [10,71]. Based on our results (when data were analyzed throughout all seasons), the Q10 coefficient in juniper woodlands also depends on the site. Thus, we conclude that soil respiration rates also vary within the same species as a function of ecological requirements (for example soil quality), i.e., productivity, as has been cited for respiration at the stem level [44,72].

5. Conclusions

Our results confirmed the hypothesis that, in semi-arid juniper woodlands, there is a high correlation between the total soil respiration and productivity (quality site). Seasonality was also found to be a decisive factor in the variations in soil respiration as functions of microclimatic conditions in each woodland area. Total soil respiration was positively correlated to soil water content under low moisture conditions, i.e., in dry spring, and summer (the season in which soil organic C peaks). Under these conditions, young woodland appears to be better adapted to drought conditions, due to the higher respiration rates in most dry seasons. Our study has also shown that the effect of soil temperature on soil respiration can depend on changes in soil moisture content: soil respiration was maximum when soil moisture content reached the highest values (>25%) in both sites in the growing season (spring).
In accordance with the soil efflux rates measured, the Q10 coefficient was found to be dependent on the site and seasons, although an exponential response of soil respiration as a function of soil temperature is only possible if soil moisture is not limiting and in temperate seasons. Pooling the data yearly makes it possible to calculate a “mean” Q10 coefficient to represent the mean rate of soil activity (it was significantly higher for the young woodland than for the mature one), but seasonal information is lost, and the effects of soil moisture and soil C can be minimized at the season level (and confounded yearly).
Therefore, research in semi-arid sites that attempts to model respiration or upscale data to the ecosystem level should analyze data by phenophase.
In conclusion, our study represents an advance in knowledge on the variation in soil respiration in classic juniper forests (mature and young woodlands) growing in a semi-arid climate (at their distribution limits). The uniqueness of this juniper species is reflected by low soil respiratory rates (especially in the older stands), typical of species linked to scarcely productive woodlands, relict species that must be protected by law.

Author Contributions

Conceptualization, F.A.G.M., E.M.G. and F.R.L.S.; methodology, F.A.G.M., F.R.L.S. and E.R.; software, F.A.G.M. and E.M.G.; validation, F.R.L.S. and F.G.S.; resources, M.A.A. and F.G.S.; writing—original draft preparation, F.A.G.M. and E.M.G.; writing—review and editing, F.A.G.M., M.A.A. and E.R.; laboratory analysis, M.I.P.C. and M.A.A.; supervision, M.A.A., M.I.P.C. and F.R.L.S.; funding acquisition, F.R.L.S. and E.R. All authors have read and agreed to the published version of the manuscript.

Funding

This research was made possible with the aid of the Projects: (i) “Respuesta adaptativa de la gestión del pino carrasco al cambio climático. Mejorando la productividad y eficiencia en el uso del agua” (REF: PID2020-119861RB-I00 (MCIN/AEI/10.13039/501100011033)), and (ii) “Mejorando la eficiencia en el uso del agua de ecosistemas agrarios a través de la gestión para la adaptación al cambio climático” (MINECO/AEI/FEDER), REF: CGL2017-83538-C3-2-R.

Institutional Review Board Statement

Not applicable.

Informed Consent Statement

Not applicable.

Data Availability Statement

Not applicable.

Acknowledgments

We are grateful to the two anonymous reviewers for their comments, which allowed us to improve the initial manuscript.

Conflicts of Interest

The authors declare no conflict of interest.

References

  1. Teskey, R.O.; Saveyn, A.; Steppe, K.; McGuire, M.A. Origin, fate and significance of CO2 in tree stems. New Phytol. 2008, 177, 17–32. [Google Scholar] [CrossRef] [PubMed]
  2. Bond-Lamberty, B. New Techniques and Data for Understanding the Global Soil Respiration Flux. Earth’s Future 2018, 6, 1176–1180. [Google Scholar] [CrossRef] [Green Version]
  3. Landsberg, J.J.; Gower, S.T. Applications of Physiological Ecology to Forest Management; Academic Press: San Diego, CA, USA, 1997. [Google Scholar]
  4. Bond-Lamberty, B.; Wang, C.; Gower, S.T. A global relationship between the heterotrophic and autotrophic components of soil respiration? Glob. Chang. Biol. 2004, 10, 1756–1766. [Google Scholar] [CrossRef]
  5. Zhao, J.-F.; Liao, Z.-Y.; Yang, L.-Y.; Shi, J.-K.; Tan, Z.-H. Characteristics of Soil Respiration and Its Components of a Mixed Dipterocarp Forest in China. Forests 2021, 12, 1159. [Google Scholar] [CrossRef]
  6. Gower, S.T. Patterns and Mechanisms of the Forest Carbon Cycle. Annu. Rev. Environ. Resour. 2003, 28, 169–204. [Google Scholar] [CrossRef]
  7. Jiao, Z.; Wang, X. Contrasting Rhizospheric and Heterotrophic Components of Soil Respiration during Growing and Non-Growing Seasons in a Temperate Deciduous Forest. Forests 2019, 10, 8. [Google Scholar] [CrossRef] [Green Version]
  8. Waring, R.; Running, S. Forest Ecosystems. Analysis at Multiple Scales, 3rd ed.; Academic Press: San Diego, CA, USA, 2007; p. 440. [Google Scholar]
  9. Damesin, C.; Ceschia, E.; Le Goff, N.; Ottorini, J.M.; Dufrêne, E. Stem and branch respiration of beech: From tree measurements to estimations at the stand level. New Phytol. 2002, 153, 159–172. [Google Scholar] [CrossRef]
  10. Han, M.; Jin, G. Seasonal variations of Q10 soil respiration and its components in the temperate forest ecosystems, northeastern China. Eur. J. Soil Biol. 2018, 85, 36–42. [Google Scholar] [CrossRef]
  11. Xu, B.; Yang, Y.; Li, P.; Shen, H.; Fang, J. Global patterns of ecosystem carbon flux in forests: A biometric data-based synthesis. Glob. Biogeochem. Cycles 2014, 28, 962–973. [Google Scholar] [CrossRef]
  12. Azizi-Rad, M.; Guggenberger, G.; Ma, Y.; Sierra, C.A. Sensitivity of soil respiration rate with respect to temperature, moisture and oxygen under freezing and thawing. Soil Biol. Biochem. 2022, 165, 108488. [Google Scholar] [CrossRef]
  13. Aponte, C.; Marañón, T.; García, L.V. Microbial C, N and P in soils of Mediterranean oak forests: Influence of season, canopy cover and soil depth. Biogeochemistry 2010, 101, 77–92. [Google Scholar] [CrossRef] [Green Version]
  14. Tang, J.; Bradford, M.A.; Carey, J.; Crowther, T.W.; Machmuller, M.B.; Mohan, J.E.; Todd-Brown, K. Chapter 8—Temperature sensitivity of soil carbon. In Ecosystem Consequences of Soil Warming; Mohan, J.E., Ed.; Academic Press: Cambridge, MA, USA, 2019; pp. 175–208. [Google Scholar]
  15. Tedeschi, V.; Rey, A.; Manca, G.; Valentini, R.; Jarvis, P.G.; Borghetti, M. Soil respiration in a Mediterranean oak forest at different developmental stages after coppicing. Glob. Chang. Biol. 2006, 12, 110–121. [Google Scholar] [CrossRef]
  16. Glukhova, T.V.; Ilyasov, D.V.; Vompersky, S.E.; Golovchenko, A.V.; Manucharova, N.A.; Stepanov, A.L. Soil Respiration in Alder Swamp (Alnus glutinosa) in Southern Taiga of European Russia Depending on Microrelief. Forests 2021, 12, 496. [Google Scholar] [CrossRef]
  17. Wang, X.; Piao, S.; Ciais, P.; Janssens, I.A.; Reichstein, M.; Peng, S.; Wang, T. Are ecological gradients in seasonal Q10 of soil respiration explained by climate or by vegetation seasonality? Soil Biol. Biochem. 2010, 42, 1728–1734. [Google Scholar] [CrossRef]
  18. Davidson, E.A.; Janssens, I.A.; Luo, Y. On the variability of respiration in terrestrial ecosystems: Moving beyond Q10. Glob. Chang. Biol. 2006, 12, 154–164. [Google Scholar] [CrossRef]
  19. Martínez-García, E.; Dadi, T.; Rubio, E.; García-Morote, F.A.; Andrés-Abellán, M.; López-Serrano, F.R. Aboveground autotrophic respiration in a Spanish black pine forest: Comparison of scaling methods to improve component partitioning. Sci. Total Environ. 2017, 580, 1505–1517. [Google Scholar] [CrossRef]
  20. Raich, J.W.; Tufekciogul, A. Vegetation and soil respiration: Correlations and controls. Biogeochemistry 2000, 48, 71–90. [Google Scholar] [CrossRef]
  21. Sampson, D.A.; Janssens, I.A.; Curiel Yuste, J.; Ceulemans, R. Basal rates of soil respiration are correlated with photosynthesis in a mixed temperate forest. Glob. Chang. Biol. 2007, 13, 2008–2017. [Google Scholar] [CrossRef]
  22. Pennington, S.C.; McDowell, N.G.; Megonigal, J.P.; Stegen, J.C.; Bond-Lamberty, B. Localized basal area affects soil respiration temperature sensitivity in a coastal deciduous forest. Biogeosciences 2020, 17, 771–780. [Google Scholar] [CrossRef] [Green Version]
  23. Talmon, Y.; Sternberg, M.; Grünzweig, J.M. Impact of rainfall manipulations and biotic controls on soil respiration in Mediterranean and desert ecosystems along an aridity gradient. Glob. Chang. Biol. 2011, 17, 1108–1118. [Google Scholar] [CrossRef]
  24. Bastin, J.-F.; Berrahmouni, N.; Grainger, A.; Maniatis, D.; Mollicone, D.; Moore, R.; Patriarca, C.; Picard, N.; Sparrow, B.; Abraham, E.M.; et al. The extent of forest in dryland biomes. Science 2017, 356, 635–638. [Google Scholar] [CrossRef] [PubMed] [Green Version]
  25. Meza, F.J.; Montes, C.; Bravo-Martínez, F.; Serrano-Ortiz, P.; Kowalski, A.S. Soil water content effects on net ecosystem CO2 exchange and actual evapotranspiration in a Mediterranean semiarid savanna of Central Chile. Sci. Rep. 2018, 8, 8570. [Google Scholar] [CrossRef] [PubMed]
  26. Adams, R.P. The Junipers of the World: The Genus Juniperus, 4th ed.; Trafford Publishing: Victoria, BC, Canada, 2014; p. 422. [Google Scholar]
  27. Farjon, A. A Monograph of Cupressaceae and Sciadopitys; Royal Botanic Gardens, Kew: Richmond, Surrey, UK, 2005; p. 648. [Google Scholar]
  28. Mao, K.; Hao, G.; Liu, J.; Adams, R.P.; Milne, R.I. Diversification and biogeography of Juniperus (Cupressaceae): Variable diversification rates and multiple intercontinental dispersals. New Phytol. 2010, 188, 254–272. [Google Scholar] [CrossRef]
  29. Jiménez, J.F.; Werner, O.; Sánchez-Gómez, P.; Fernández, S.; Guerra, J. Genetic variations and migration pathway of Juniperus thurifera L. (Cupressaceae) in the western Mediterranean region. Isr. J. Plant Sci. 2003, 51, 11–22. [Google Scholar] [CrossRef]
  30. Costa, M.; Gómez, F.; Morla, C.; Ollero, H. Caracterización fitoecológica de los sabinares albares de la Península Ibérica. Orsis Organ. Sist. 1993, 8, 79–93. [Google Scholar]
  31. García López, J.M.; Allué Camacho, C. Caracterización y potencialidades fitoclimáticas de la sabina albar (Juniperus thurifera L.) en la Península Ibérica. For. Syst. Investig. Agrar. Sist. Recur. For. 2005, 14, 98–109. [Google Scholar] [CrossRef] [Green Version]
  32. Stocker, T.F.; Qin, D.; Plattner, G.-K.; Tignor, M.; Allen, S.K.; Boschung, J.; Nauels, A.; Xia, Y.; Bex, V.; Midgley, P. IPCC, Climate Change 2013: The Physical Science Basis; Cambridge University Press: Cambridge, UK, 2013. [Google Scholar]
  33. García Morote, F.A. Biomasa y Productividad de la Sabina Albar (Juniperus thurifera L.) en El Campo de Montiel (Albacete). Ph.D. Thesis, Universidad de Castilla-La Mancha, Ciudad Real, Spain, 2008. [Google Scholar]
  34. Garcia Morote, F.A.; Lopez Serrano, F.R.; Andres, M.; Rubio, E.; Gonzalez Jimenez, J.L.; de las Heras, J. Allometries, biomass stocks and biomass allocation in the thermophilic Spanish juniper woodlands of Southern Spain. For. Ecol. Manag. 2012, 270, 85–93. [Google Scholar] [CrossRef]
  35. Garcia-Morote, F.A.; Lopez-Serrano, F.R.; Andres, M.; Martinez-Garcia, E.; Lucas-Borja, M.; Dadi, T.; Candel, D.; Wic, C. Effects of woodland maturity, vegetation cover and season on enzymatic and microbial activity in thermophilic Spanish Juniper woodlands (Juniperus thurifera L.) of southern Spain. Eur. J. Soil Sci. 2012, 63, 579–591. [Google Scholar] [CrossRef]
  36. Kottek, M.; Grieser, J.; Beck, C.; Rudolf, B.; Rubel, F. World Map of the Köppen-Geiger climate classification. Meteorol. Z. 2006, 15, 259–263. [Google Scholar] [CrossRef]
  37. FAO. FAO/UNESCO Soil Map of the World, Revised Legend; FAO-UNESCO: Rome, Italy, 1988. [Google Scholar]
  38. Domingo Santos, J.M.; Fernández de Villarán San Juan, R.; Corral Pazos de Provens, E.; Rapp Arrarás, I. Estimation of water retention capacity in soil: Corrections to the CRA pedotransfer formula. For. Syst. 2006, 15, 14–23. [Google Scholar] [CrossRef]
  39. Yeomans, J.C.; Bremner, J.M. A rapid and precise method for routine determination of organic carbon in soil. Commun. Soil Sci. Plant Anal. 1988, 19, 1467–1476. [Google Scholar] [CrossRef]
  40. Pinheiro, J.B.D.; DebRoy, S.; Sarkar, D.; R Core Team. nlme: Linear and Nonlinear Mixed Effects Models. R Package Version 3.1-155. 2022. Available online: https://CRAN.R-project.org/package=nlme (accessed on 8 March 2022).
  41. Xu, M.; DeBiase, T.A.; Qi, Y.; Goldstein, A.; Liu, Z. Ecosystem respiration in a young ponderosa pine plantation in the Sierra Nevada Mountains, California. Tree Physiol. 2001, 21, 309–318. [Google Scholar] [CrossRef] [PubMed] [Green Version]
  42. Rodríguez-Calcerrada, J.; Martin-StPaul, N.K.; Lempereur, M.; Ourcival, J.-M.; del Rey, M.D.C.; Joffre, R.; Rambal, S. Stem CO2 efflux and its contribution to ecosystem CO2 efflux decrease with drought in a Mediterranean forest stand. Agric. For. Meteorol. 2014, 195–196, 61–72. [Google Scholar] [CrossRef] [Green Version]
  43. Ma, Y.; Piao, S.; Sun, Z.; Lin, X.; Wang, T.; Yue, C.; Yang, Y. Stand ages regulate the response of soil respiration to temperature in a Larix principis-rupprechtii plantation. Agric. For. Meteorol. 2014, 184, 179–187. [Google Scholar] [CrossRef]
  44. García Morote, F.A.; Andrés Abellán, M.; Rubio, E.; Pérez Anta, I.; García Saucedo, F.; López Serrano, F.R. Stem CO2 Efflux as an Indicator of Forests’ Productivity in Relict Juniper Woodlands (Juniperus thurifera L.) of Southern Spain. Forests 2021, 12, 1340. [Google Scholar] [CrossRef]
  45. Lavigne, M.B. Comparing stem respiration and growth of jack pine provenances from northern and southern locations. Tree Physiol. 1996, 16, 847–852. [Google Scholar] [CrossRef] [PubMed]
  46. Neter, J.; Kutner, M.; Wasserman, W.; Nachtsheim, C. Applied Linear Statistical Models, 4th ed.; McGraw-Hill-Irwin: Chicago, IL, USA, 1996; p. 15. 720p. [Google Scholar]
  47. Belsley, D.A.; Kuh, E.; Welsch, R.E. Regression Diagnostics: Identifying Influential Data and Sources of Collinearity; John Wiley & Sons, Ltd.: New York, NY, USA, 2013. [Google Scholar]
  48. Lal, R. Forest soils and carbon sequestration. For. Ecol. Manag. 2005, 220, 242–258. [Google Scholar] [CrossRef]
  49. Powlson, D.S.; Whitmore, A.P.; Goulding, K.W.T. Soil carbon sequestration to mitigate climate change: A critical re-examination to identify the true and the false. Eur. J. Soil Sci. 2011, 62, 42–55. [Google Scholar] [CrossRef]
  50. Hibbard, K.A.; Law, B.E.; Reichstein, M.; Sulzman, J. An analysis of soil respiration across northern hemisphere temperate ecosystems. Biogeochemistry 2005, 73, 29–70. [Google Scholar] [CrossRef]
  51. Maseyk, K.; Grünzweig, J.M.; Rotenberg, E.; Yakir, D.A.N. Respiration acclimation contributes to high carbon-use efficiency in a seasonally dry pine forest. Glob. Chang. Biol. 2008, 14, 1553–1567. [Google Scholar] [CrossRef]
  52. Zha, T.; Kellomäki, S.; Wang, K.-Y.; Ryyppö, A.; Niinistö, S. Seasonal and annual stem respiration of Scots pine trees under boreal conditions. Ann. Bot. 2004, 94, 889–896. [Google Scholar] [CrossRef] [PubMed] [Green Version]
  53. Tang, J.; Bolstad, P.V.; Desai, A.R.; Martin, J.G.; Cook, B.D.; Davis, K.J.; Carey, E.V. Ecosystem respiration and its components in an old-growth forest in the Great Lakes region of the United States. Agric. For. Meteorol. 2008, 148, 171–185. [Google Scholar] [CrossRef]
  54. Inclán, R.; Uribe, C.; De La Torre, D.; Sánchez, D.M.; Clavero, M.A.; Fernández, A.M.; Morante, R.; Cardeña, A.; Fernández, M.; Rubio, A. Carbon dioxide fluxes across the Sierra de Guadarrama, Spain. Eur. J. For. Res. 2008, 129, 93. [Google Scholar] [CrossRef] [Green Version]
  55. Schimel, J.P.; Weintraub, M.N. The implications of exoenzyme activity on microbial carbon and nitrogen limitation in soil: A theoretical model. Soil Biol. Biochem. 2003, 35, 549–563. [Google Scholar] [CrossRef]
  56. Chiang, P.-N.; Yu, J.-C.; Lai, Y.-J. Soil Respiration Variation among Four Tree Species at Young Afforested Sites under the Influence of Frequent Typhoon Occurrences. Forests 2021, 12, 787. [Google Scholar] [CrossRef]
  57. Jia, G.m.; Cao, J.; Wang, C.; Wang, G. Microbial biomass and nutrients in soil at the different stages of secondary forest succession in Ziwulin, northwest China. For. Ecol. Manag. 2005, 217, 117–125. [Google Scholar] [CrossRef]
  58. Allison, V.J.; Condron, L.M.; Peltzer, D.A.; Richardson, S.J.; Turner, B.L. Changes in enzyme activities and soil microbial community composition along carbon and nutrient gradients at the Franz Josef chronosequence, New Zealand. Soil Biol. Biochem. 2007, 39, 1770–1781. [Google Scholar] [CrossRef]
  59. Saiz, G.; Byrne, K.A.; Butterbach-Bahl, K.; Kiese, R.; Blujdea, V.; Farrell, E.P. Stand age-related effects on soil respiration in a first rotation Sitka spruce chronosequence in central Ireland. Glob. Chang. Biol. 2006, 12, 1007–1020. [Google Scholar] [CrossRef]
  60. Högberg, P.; Read, D.J. Towards a more plant physiological perspective on soil ecology. Trends Ecol. Evol. 2006, 21, 548–554. [Google Scholar] [CrossRef] [PubMed]
  61. Querejeta Mercader, J.I.; Egerton-Warburton, L.M.; Allen, M.F. Hydraulic lift may buffer rhizosphere hyphae against the negative effects of severe soil drying in a California Oak savanna. Soil Biol. Biochem. 2007, 39, 409–417. [Google Scholar] [CrossRef]
  62. Ruehr, N.K.; Buchmann, N. Soil respiration fluxes in a temperate mixed forest: Seasonality and temperature sensitivities differ among microbial and root–rhizosphere respiration. Tree Physiol. 2009, 30, 165–176. [Google Scholar] [CrossRef] [Green Version]
  63. Janssens, I.A.; Dore, S.; Epron, D.; Lankreijer, H.; Buchmann, N.; Longdoz, B.; Brossaud, J.; Montagnani, L. Climatic Influences on Seasonal and Spatial Differences in Soil CO2 Efflux. In Fluxes of Carbon, Water and Energy of European Forests; Valentini, R., Ed.; Ecological Studies (Analysis and Synthesis); Springer: Berlin/Heidelberg, Germany, 2003; Volume 163, pp. 235–255. [Google Scholar]
  64. Soil Respiration and the Environment; Luo, Y.; Zhou, X. (Eds.) Academic Press: Burlington, MA, USA, 2006; p. 305. [Google Scholar]
  65. Reichstein, M.; Tenhunen, J.D.; Roupsard, O.; Ourcival, J.-M.; Rambal, S.; Miglietta, F.; Peressotti, A.; Pecchiari, M.; Tirone, G.; Valentini, R. Severe drought effects on ecosystem CO2 and H2O fluxes at three Mediterranean evergreen sites: Revision of current hypotheses? Glob. Chang. Biol. 2002, 8, 999–1017. [Google Scholar] [CrossRef]
  66. Rey, A.; Pegoraro, E.; Tedeschi, V.; De Parri, I.; Jarvis, P.G.; Valentini, R. Annual variation in soil respiration and its components in a coppice oak forest in Central Italy. Glob. Chang. Biol. 2002, 8, 851–866. [Google Scholar] [CrossRef]
  67. Sancho, A.J.J.; Stephanie, B.; Kenneth, A.B. Partitioning of soil respiration in a first rotation beech plantation. Biol. Environ. Proc. R. Ir. Acad. 2017, 117, 91–105. [Google Scholar] [CrossRef]
  68. Moyano, F.E.; Manzoni, S.; Chenu, C. Responses of soil heterotrophic respiration to moisture availability: An exploration of processes and models. Soil Biol. Biochem. 2013, 59, 72–85. [Google Scholar] [CrossRef]
  69. Fernández-Alonso, M.J.; Díaz-Pinés, E.; Ortiz, C.; Rubio, A. Disentangling the effects of tree species and microclimate on heterotrophic and autotrophic soil respiration in a Mediterranean ecotone forest. For. Ecol. Manag. 2018, 430, 533–544. [Google Scholar] [CrossRef] [Green Version]
  70. Wang, W.; Wang, H.; Zu, Y.; Li, X.; Koike, T. Characteristics of the temperature coefficient, Q10, for the respiration of non-photosynthetic organs and soils of forest ecosystems. Front. For. China 2006, 1, 125–135. [Google Scholar] [CrossRef]
  71. Ryan, M.G.; Gower, S.T.; Hubbard, R.M.; Waring, R.H.; Gholz, H.L.; Cropper, W.P.; Running, S.W. Woody tissue maintenance respiration of four conifers in contrasting climates. Oecologia 1995, 101, 133–140. [Google Scholar] [CrossRef] [PubMed]
  72. Rodríguez-Calcerrada, J.; Salomón, R.L.; Gordaliza, G.G.; Miranda, J.C.; Miranda, E.; de la Riva, E.G.; Gil, L. Respiratory costs of producing and maintaining stem biomass in eight co-occurring tree species. Tree Physiol. 2019, 39, 1838–1854. [Google Scholar] [CrossRef]
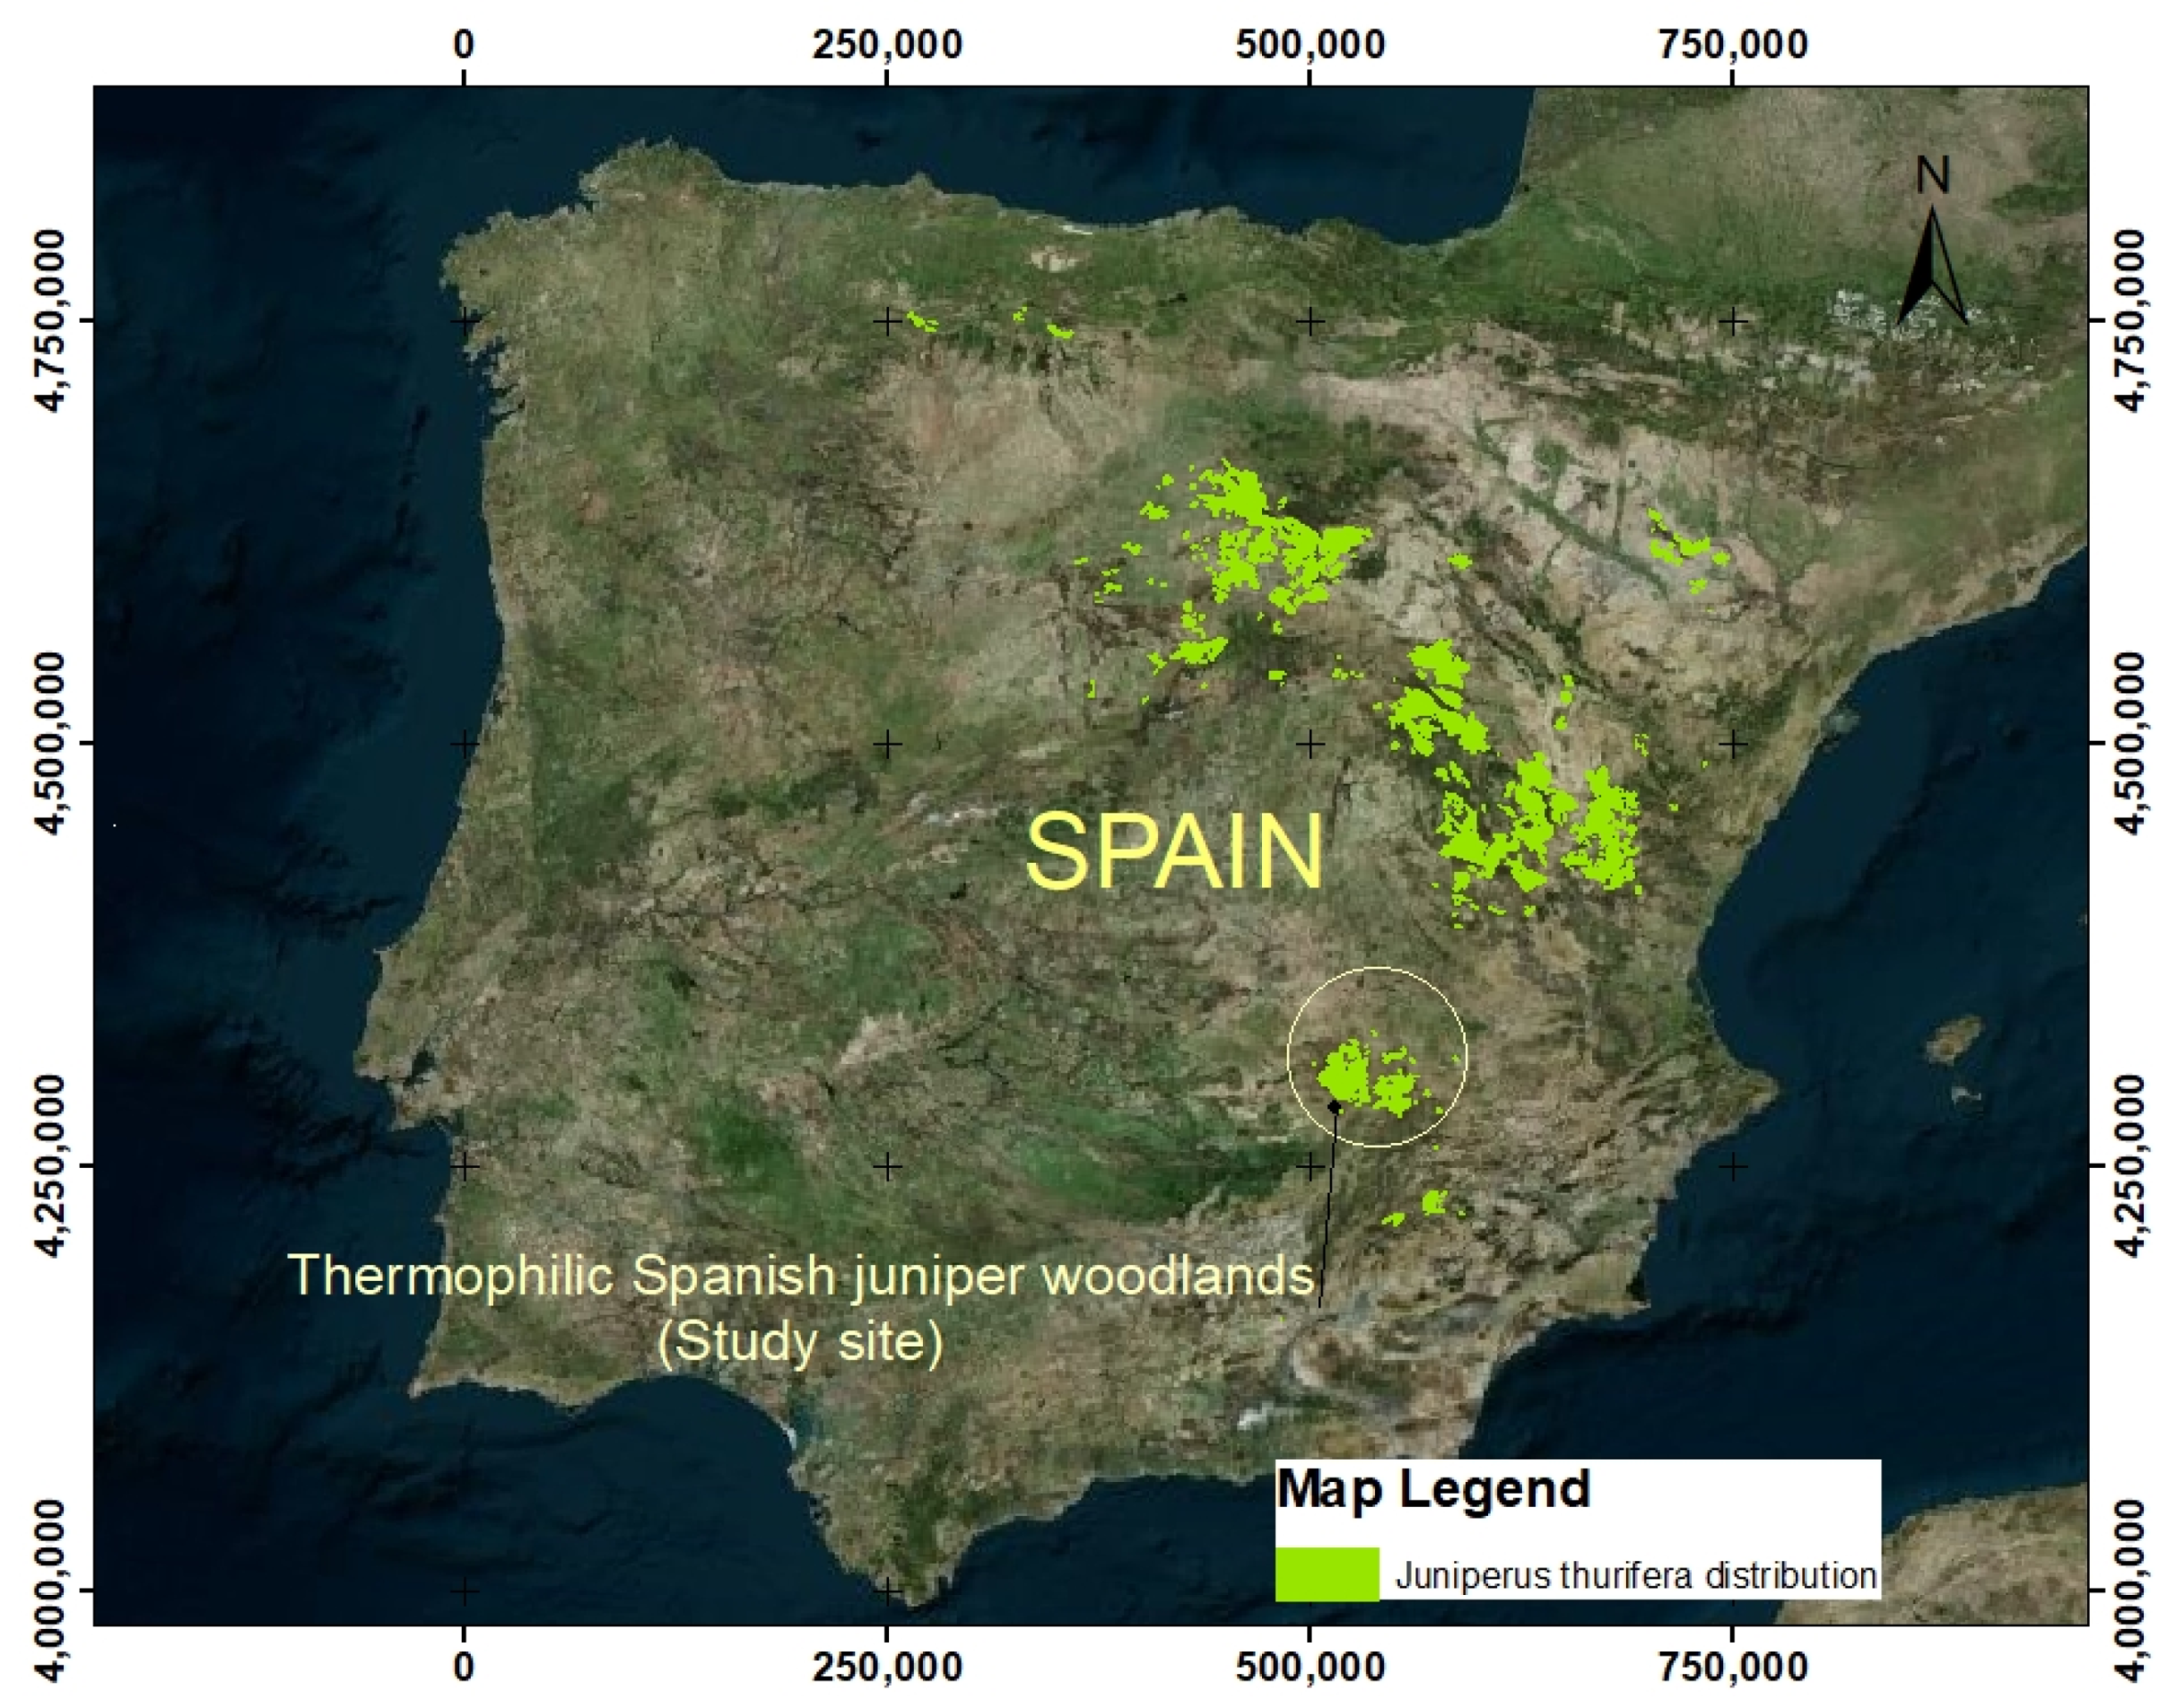
Figure 1. Location of El Campo de Montiel juniper woodlands within the rest of the Spanish juniper formations (Spain). The delimitation of the study area was made with the Forest Map of Biodiversity Data Bank (Ministry of Agriculture and Environment of Spain) and the information published by [30]. UTM coordinates, ETRS89.
Forests 13 00538 g001
Figure 2. Study area: young, more productive juniper woodland in abandoned farmland (a), and mature woodland in Leptosols (b). Below, the soil depth of each site is shown ((c) young woodland, 40 cm depth, and (d) mature woodland, 10 cm depth).
Forests 13 00538 g002
Figure 3. Metallic collar to measure the total soil CO2 efflux in juniper woodland soils.
Forests 13 00538 g003
Figure 4. Variation in the measured soil CO2 efflux (Rs, μmol CO2 m−2 s−1) and results of the linear mixed model (LMM) carried out to analyze differences between the soil CO2 efflux in the two woodlands throughout the measurement days (date: repeated factor). Mean values followed by different letters reflect significant differences (Fisher’s LSD test, 95% probability, α = 0.05). Error bars: standard error.
Forests 13 00538 g004
Figure 5. Variation in the soil temperature (Ts, °C) and the soil water content (Sw, %) for juniper woodlands. Sampling data: n = 204. Error bars: standard error.
Forests 13 00538 g005
Figure 6. Seasonal variation in the soil organic C (SOC, %) for juniper woodlands. Error bars: standard error. Average values for the woodland areas within each season followed by different letters reflect significant differences (Fisher’s LSD test, 95% probability, α = 0.05).
Forests 13 00538 g006
Table 1. Vegetation characteristics and edaphic parameters in soils defining the site quality of the two thermophilic juniper woodlands. Errors: standard error.
Characteristics Young WoodlandMature Woodland
Vegetation 1
Mean age (years)66 ± 4170 ± 5
Woodland density (trees ha−1)308 ± 4095 ± 12
Juniper cover (%)65 ± 2332 ± 14
Total biomass (t ha−1) 30.8 ± 2.67.6 ± 0.6
Net Primary Productivity (NPP, t ha−1 year−1)1.91 ± 0.140.44 ± 0.01
Litter fall (t ha−1 year−1)0.98 ± 0.130.24 ± 0.05
LAI (m2 m−2)1.030.32
Soils 2
Soil taxonomy (FAO [37])Calcaric cambisolLithic leptosol
Mean soil depth (m)0.42 ± 0.040.10 ± 0.02
Soil pH8.3 ± 0.18.6 ± 0.1
Soil texture (sand, %)50 ± 558 ± 5
Soil texture (clay, %)28 ± 112 ± 1
Bulk density (g cm−3)1.37 ± 0.11.54 ± 0.2
Water storage capacity (mm)137.1 20.5
1 Vegetation variables are descriptive for the sites. The parameters have been collected from the study of Garcia [33]. In this study, vegetation variables were measured over a 2-year period. 2 Edaphic parameters: (i) pH: digital pH meter; texture: (ii) bulk density: soil samples oven-dried at 105 °C for 48 h; (iii) water storage capacity: method of Domínguez et al. [38]. No. of soil samples: 5 for site.
Table 2. Summary statistics for the linear mixed model (LMM) describing the influence of the fixed factors (and their interaction) on total soil respiration (Rs, µmol CO2 m−2 s−1) in the two woodlands (n = 204). The effects are significant if p < 0.05 (95% probability, α = 0.05).
EffectsdfF-Valuep-Value
Intercept1459.7<0.0001
Woodland (W)17.80.0061
Date (D)1621.9<0.0001
W × D161.80.0283
Table 3. Significant parameters (±standard error), model significance (p), and goodness of fit (adjusted R2) in the bivariate model (Model 1), fitted for seasonal and annual periods. The model explains the soil respiration (Rs, μmol CO2 m−2 s−1) as a function of soil temperature (Ts, °C), soil water content (Sw, %), and woodland type (W): Rs = e x p ( β 0 + β 0 W ) + ( α + α W ) × Ts   S w ( β 1 + β 1 W ) . n.s. = non-significant (p > 0.05, 95% probability). In the model, Ts is standardized by 10 °C (Ts/10).
YearsSeasons β 0 β 0 α α β 1 β 1 p R 2 ( % )
2016Spring0.52 ± 0.08n.s.0.26 ± 0.06n.s.n.s.n.s.0.0036.2
Summer0.40 ± 0.08n.s.n.s.n.s.n.s.0.60 ± 0.150.0045.4
Autumn0.09 ± 0.01n.s.n.s.n.s.n.s.n.s.n.s.-
Yearly (2016)0.47 ± 0.04n.s.n.s.0.21 ± 0.05n.s.n.s.0.0029.8
2017Spring0.21 ± 0.16n.s.0.23 ± 0.09n.s.n.s.0.11 ± 0.050.0026.1
Summer0.17 ± 0.150.38 ± 0.2n.s.n.s.n.s.n.s.n.s.-
Autumn0.36 ± 0.15n.s.n.s.n.s.n.s.n.s.n.s.-
Yearly (2017)0.02 ± 0.01n.s.0.20 ± 0.070.16 ± 0.06n.s.n.s.0.0026.7
2018Winter−0.44 ± 0.11n.sn.s.n.s.n.s.n.s.n.s.-
Spring−4.49 ± 1.55n.s.0.87 ± 0.06n.s.1.09 ± 0.46n.s.0.0094.1
2016–2018All data
pooled
0.16 ± 0.08n.s.0.18 ± 0.050.16 ± 0.05n.s.n.s.0.0016.7
Table 4. Fitted models for each woodland type and season period. The values of the temperature coefficient, Q10, were calculated when the exponential relationship between soil respiration (Rs) and soil temperature (Ts) was significant (Model 2). In this case, Q10 was calculated by applying: Q 10 = e ( α + α W ) (α for mature woodland, and α + α′ for young woodland, if W was significant). *: Q10 coefficient depends on soil water. Average values of Ts (soil temperature, °C) and Sw (soil water content, %) within each adjusting period followed by different letters reflect significant differences (Fisher’s LSD test, 95% probability, α = 0.05).
YearsSeasonsWoodlandRs (μmol CO2 m−2 s−1)Q10Ts (°C)Sw (%)
2016SpringYoung woodland Rs = 1.68   e 0.26 × ( Ts 10 )   1.3013.7 ± 1.3 A9.0 ± 0.5 A
Mature woodland Rs = 1.68   e 0.26 × ( Ts 10 )   1.3013.1 ± 0.9 A7.4 ± 0.4 B
SummerYoung woodland Rs = 1.49     S w 0.60 -23.4 ± 1.6 A2.2 ± 0.1 A
Mature woodland Rs = 1.49 -24.4 ± 2.4 A1.7 ± 0.1 B
AutumnYoung woodland Rs = 1.09 -10.4 ± 2.0 A13.2 ± 1.0 A
Mature woodland Rs = 1.09 -10.6 ± 2.3 A9.2 ± 0.8 B
Yearly (2016)Young woodland Rs = 1.59   e 0.21 × ( Ts 10 )   1.2315.3 ± 1.1 A8.3 ± 0.7 A
Mature woodland Rs = 1.59 -15.2 ± 0.8 A6.5 ± 0.5 B
2017SpringYoung woodland Rs = 1.23   e 0.23 × ( Ts 10 )     S w 0.11 1.26 *19.1 ± 1.9 A7.8 ± 0.5 A
Mature woodland Rs = 1.23   e 0.23 × ( Ts 10 )   1.2615.8 ± 1.3 A5.4 ± 0.3 B
SummerYoung woodland Rs = 1.73 -27.8 ± 1.6 A1.7 ± 0.2 A
Mature woodland Rs = 1.19 -24.3 ± 1.1 A0.9 ± 0.1 B
AutumnYoung woodland Rs = 1.44 -11.1 ± 0.7 A13.7 ± 0.5 A
Mature woodland Rs = 1.44 -12.0 ± 0.5 A10.6 ± 0.4 B
Yearly (2017)Young woodland Rs = 1.03   e 0.36 × ( Ts 10 )   1.4314.1 ± 1.8 A13.0 ± 1.7 A
Mature woodland Rs = 1.03   e 0.20 × ( Ts 10 )   1.2212.4 ± 1.3 A10.8 ± 1.2 A
2018WinterYoung woodland Rs = 0.64 -1.4 ± 0.9 A25.2 ± 0.7 A
Mature woodland Rs = 0.64 -1.6 ± 0.6 A23.8 ± 0.5 A
SpringYoung woodland Rs = 0.01   e 0.87 × ( Ts 10 )     S w 1.09 2.39 *18.2 ± 2.5 A26,7 ± 1.0 A
Mature woodland Rs = 0.01   e 0.87 × ( Ts 10 )   S w 1.09 2.39 *16.8 ± 1.8 A27.2 ± 0.7 A
2016–2018All data
pooled
Young woodland Rs = 1.17   e 0.34 × ( Ts 10 )   1.4014.3 ± 0.7 A12.5 ± 1.1 A
Mature woodland Rs = 1.17   e 0.18 × ( Ts 10 )   1.2015.2 ± 1.0 A10.7 ± 0.7 A
Publisher’s Note: MDPI stays neutral with regard to jurisdictional claims in published maps and institutional affiliations.