Article

Contribution of Litter Layer to Greenhouse Gas Fluxes between Atmosphere and Soil Varies with Forest Succession

1
Key Laboratory of Vegetation Restoration and Management of Degraded Ecosystems, South China Botanical Garden, Chinese Academy of Sciences, 723 Xingke Road, Tianhe District, Guangzhou 510650, China
2
The Commonwealth Scientific and Industrial Research Organisation, Oceans and Atmosphere, Aspendale, Melbourne 3000, Australia
3
University of Chinese Academy of Sciences, Beijing 100049, China
*
Author to whom correspondence should be addressed.
Forests 2022, 13(4), 544; https://doi.org/10.3390/f13040544
Submission received: 18 February 2022 / Revised: 25 March 2022 / Accepted: 29 March 2022 / Published: 31 March 2022
(This article belongs to the Section Forest Ecology and Management)

Abstract

:
Surface litter layer strongly influences CO2, N2O, and CH4 fluxes (FCO2, FN2O, and FCH4) between the atmosphere and forest floor through litter decomposition (litter-internal, fL-L) or interactions between litter and mineral soil (litter-induced, fL-S). However, the relative contribution of fL-L or fL-S to these greenhouse gas (GHG) fluxes in forests at different succession stages remain unclear. We conducted a field experiment where surface litter was either removed (LR), left intact (CT), doubled (LD), or exchanged (LE) in a Masson pine forest (PF, early stage of succession) and an evergreen broadleaved forest (BF, climax of succession) at the Dinghushan Nature Reserve in southern China, and studied the responses of FCO2, FN2O, and FCH4 from August 2012 to July 2013. The results showed that both FCO2 and FN2O were increased by LD treatment with a greater increase in BF (41% for FCO2 and 30% for FN2O) and decreased by LR treatment with the greater decrease in PF (−61% for FCO2 and −58% for FN2O). LD treatment decreased FCH4 by 14% in PF and 6% in BF, and LR treatment increased FCH4 by 5% in PF and 18% in BF. fL-S contributed more to FCO2 (36%) and FN2O (45%) than fL-L in PF, whereas contributions of fL-L to FCO2 (41%) and FN2O (30%) were much bigger than fL-S in BF. The greater FCH4 in PF and BF resulted from the contributions of fL-L (−14%) and fL-S (−12%), respectively. Our results indicated that fL-L is the major source of GHG fluxes in BF, whereas fL-S dominates GHG fluxes in PF. The results provide a scientific reference for quantifying the contributions of fL-L and fL-S to GHG fluxes during the subtropical forest succession and should be considered in ecosystem models to predict global warming in the future.

1. Introduction

CO2, CH4, and N2O fluxes (FCO2, FCH4, and FN2O) between the atmosphere and forest floor are significant in predicting global warming [1]. The rates of these greenhouse gas (GHG) fluxes are highly variable in different forests in a certain climate regime, depending on carbon (C) and nitrogen (N) inputs, microbial activities, etc. [2,3,4]. As a critical component of forest ecosystems, surface litter layer contributes the largest amount of C and N inputs to forest soils and strongly influences soil physical environments and microbial activities [5,6,7]. Therefore, it significantly affects FCO2, FCH4, and FN2O in forest ecosystems.
Experimental studies are generally conducted by means of litter removal or addition to quantify the contributions of the litter layer on FCO2, FN2O, and FCH4 [2,8,9,10]. Because soil temperature and soil moisture are the two dominant physical environmental factors affecting these GHG fluxes on the forest floor, more attention was paid to the changes in soil temperature and soil moisture under litter removal or additional treatment [4,10,11]. For example, a study in a temperate beech forest reported that litter removal reduced FCO2 by 30% and increased temperature sensitivity (Q10) of FCO2 [2]. A recent study conducted in a subtropical pine forest found that litter removal significantly decreased soil moisture by 5% and thus increasing CH4 diffusion into the soil [6]. However, the litter layer itself also contributes a large proportion of GHG fluxes through its decomposition (i.e., litter-internal) [9,11,12]. A previous study in an old subtropical forest showed that litter addition increased FCO2 by 87% due to its rapid decomposition [11]. Therefore, the contributions of surface litter layer to GHG fluxes in forest ecosystems include the fluxes of the litter layer itself (i.e., litter-internal) and the fluxes of mineral soil resulting from all changing environmental factors caused by the litter layer (i.e., litter-induced) [13,14,15,16]. Despite the important roles of litter-internal and litter-induced in affecting GHG fluxes on the forest floor, those previous studies did not quantify the relative contribution of the two aspects in estimating GHG fluxes. This will inevitably increase the difficulties in estimating GHG fluxes in forest ecosystems [17] and also increase the uncertainties in ecosystem models for predicting future GHG budgets [18,19,20]. Therefore, partitioning the contribution of litter-internal and litter-induced to GHG fluxes has become extremely essential and important in the context of global warming.
Although the surface litter layer strongly influences GHG fluxes through its decomposition or the interactions between the litter layer and mineral soil, the relative contribution of litter-internal and litter-induced to GHG fluxes may vary with forest type due to the differences in litter quantity and quality [10,11,21]. A higher contribution of litter decomposition to GHG fluxes was often observed in the litter layer with higher quality (i.e., low lignin/N or C/N ratios) [13,15]. In addition, a thicker litter layer could prolong the time of the interactions between the litter layer and mineral soil [14,16], resulting in a higher contribution of litter-induced GHG fluxes. Forest succession tends to induce the substantial reorganization of tree species and modify the quantity and quality of litter inputs [22,23], which in turn influences FCO2, FN2O, or FCH4 on the forest floor [10,11,21]. Therefore, forest succession is very likely to cause a shift in the contributions of the litter layer between litter-internal and litter-induced to GHG fluxes on the forest floor. Previous studies showed that pioneer forests in subtropical zones are often dominated by Masson pine species, and the litter layer is mainly needle leaves and is decomposed slowly [21,24], which in turn may increase the relative contribution of litter-induced to FCO2, FN2O, or FCH4 on the forest floor. With the succession of forests, heliophilous broadleaved species invade the pioneer community and occupy the upper canopy, taking the place of the former Masson pine species [21]. The broadleaved litter in the climax forest has a rapid decomposition rate, which in turn may increase the relative contribution of litter-internal to FCO2, FN2O, or FCH4 on the forest floor. Unfortunately, all these speculations have not been fully verified by experiments.
In subtropical China, Masson pine forests (PF) and evergreen broadleaved forests (BF) are considered to represent pioneer and advanced succession stages, as models and obviations indicated [21,24], which allows us to study the effects of forest succession on the total contributions of the surface litter layer to FCO2, FN2O, and FCH4 at the same regional climate. This also allows us to qualify the relative contributions between litter-internal and litter-induced to these GHG fluxes in the two subtropical forests. For this purpose, we investigated the effects of one-year litter manipulation on FCO2, FN2O, and FCH4, and the related soil properties and microbial biomass. We hypothesized that (1) the total contributions of the surface litter layer to FCO2, FN2O, and FCH4 decrease from PF to BF due to the decreased inputs of litter in BF, and (2) the relative contributions of litter-internal to FCO2 and FN2O increase from PF to BF due to the higher quality and rapid decomposition rate of the surface litter layer in BF.

2. Materials and Methods

2.1. Site Description

Our study was conducted at the Dinghushan Biosphere Reserve (23°09′21″–23°11′30″ N, 112°30′39″–112°33′41″ E) in central Guangdong Province, southern China. Most areas of this reserve are coved with rolling hills and low mountains, with an altitude ranging from 100 to 700 m. The region is characterized by a typical subtropical monsoon humid climate and a mean annual temperature of 20.5 °C. The highest and lowest monthly mean temperatures are 28.0 °C in July and 12.0 °C in January, respectively. The average annual rainfall is 1700 mm, of which more than 80% falls during the period of April to September, and is considered the wet season, so the remaining months (October to March) in a year act as the dry season. The predominant soil type is lateritic red earth [25]. Soil pH generally is lower than 4.2 [26]. The flora in this reserve includes 260 families, 864 genera, and 1740 species of wild plants [27]. Most forests distributed in this reserve are PF and BF. The PF was regenerated with native Masson pine after a clear cut about 85 years ago and is at the early succession stage [28]. The BF has been protected from direct human disturbance for more than 400 years and is at the climax of succession [29]. The dominant tree species of the BF are Cryptocarya concinna, Castanopsis chinensis, and Schima superba [27]. Site characteristics and surface litter/mineral soil properties of the two forests were showed in Table 1.

2.2. Litter Manipulation Experiment

Five groups of experimental plots (1 m × 1 m) were randomly located within PF or BF, each group consisting of litter removal (LR), control (CT), litter doubling (LD), and litter exchange (LE) between PF and BF along a certain horizontal line. All aboveground litter was collected carefully by hand from the LR plot and was put into the LD plot in each group. The litter collected from the LE plot in PF was exchanged with the same treatment plot in BF and then was put into the in situ plot in January 2012. A nylon mesh cage (0.3 m height) was placed over the LR plot or LE plot to prevent new litter input. The litter collected from the nylon mesh cage was transferred to the corresponding LD or LE plot monthly since February 2012.

2.3. Gas Sampling and Measurements of FCO2, FN2O and FCH4

A permanent chamber base (0.5 m × 0.5 m) was placed in the center of each experiment plot. The chamber base was pushed 3 cm deep into the soil and covered with a sealed chamber (0.5 m height) during measurements. The sampling tube was connected to the upper part of the chamber. Two small electric fans were installed to mix air inside the chamber. A gas sample was taken using a gas-tight syringe through a septum-covered access port immediately and every 15 min after chamber closure. Five gas samples were collected for laboratory analysis during each measurement. To minimize the effects of disturbance on the soil, gas sampling started 6 months after setting the sample plot in February 2012 and conducted once every month from August 2012 to July 2013. Soil temperature at the top 5 cm soil depth (TES1310, TES, Taibei, China) and volumetric water content at the top 10 cm soil depth (SM300, Delta-T, Cambridge, UK) were monitored at each plot while gas samples were collected. Gas samples were analyzed for CO2, CH4, and N2O concentrations using a HP4890D gas chromatograph (Agilent, Wilmington, DE, USA) equipped with flame ionization detectors [31]. The rates of gas exchange were calculated from the rate of change in gas concentration within the chamber with time after chamber closure. The details of the calculation can be found in Ref. [27]. Positive regression indicates an emission from the soil to the atmosphere. Negative regression indicates a net uptake by the soil from the atmosphere.

2.4. Phospholipid Fatty Acid Analysis

Soil samples at a depth of 0–10 cm in each experiment plot were collected in July 2013 for analyzing microbial community composition using the method of phospholipid fatty acids (PLFAs) [32,33]. In Brief, PLFAs were extracted from 2 g freeze-dried soil (−20 °C) in a single-phase mixture of chloroform: methanol: phosphate buffer (1: 2: 0.8). The extractions were identified by a gas chromatograph (Agilent 6890, Agilent Technologies, Palo Alto, CA, USA) equipped with a flame-ionization (FID) detector. The content of individual PLFAs were expressed as ng per g of dry soil by the 19:0 internal standard nonadecanoate fatty acid. The PLFAs 18:1ω9c, 18:2ω6c, and 18:3ω3c were used as markers for fungi; 14:00, 15:00, 16:00, 17:00, 18:00, i19:0, c19:0ω8c, and 10Me19:1ω7c for general bacteria; i14:0, i15:0, a15:0, i16:0, i17:0, a17:0, i18:0, and i17:1ω9c for gram-positive bacteria (G+); 16:1ω7c, cy17:0, 18:1ω7, 17:1ω8c, and 10Me17: 1ω7c for gram-negative bacteria (G); 10Me16:0, 10Me17:0, and 10Me18:0 for actinomycetes (ACT).

2.5. Long-Term Monitoring of Soil CO2 Efflux and Surface Litter Layer Dynamics

The long-term data of soil CO2 efflux and surface litter aimed to provide additional evidence for explaining the different contributions of the litter layer to GHG fluxes in the two forests. Six polyvinyl chloride collars (0.2 m in diameter, 0.1 m in height) were placed vertically into the surface soil at a depth of 5 cm at random locations in the permanent plot (20 m × 20 m) of PF or BF for the continuous measurement of soil CO2 efflux. The measurement was conducted at 9:00 to 12:00 am on a sunny day once per month using a Li-Cor 8100 Infrared Gas Analyzer (LiCor Inc., Lincoln, NE, USA) with an attached survey chamber [34]. Since 2003, the surface litter layer in the PF or BF was consistently monitored once per month after the soil CO2 efflux measurement. The surface litter samples from three subplots (1 m × 1 m) randomly located in the permanent plot of PF or BF was totally collected and taken to the laboratory for measuring the fresh weights by a centesimal electronic balance (CP2102, Ohaus, Parsippany, NJ, USA). All samples were oven-dried at 105 °C to constant weights for calculating the monthly mean amount of surface litter layer.

2.6. Calculation of the Contributions of fL-L and fL-S to GHG Fluxes

In this study, a modification method based on Ref. [2] was used to quantify the relative contributions of litter-internal and litter-induced to GHG fluxes. The differences in the measured GHG fluxes between CT and LD treatments were considered as the fluxes by litter layer itself (i.e., litter decomposition) and were defined as litter-internal (fL-L), because the interactions between the two litter layers are generally negligible. The differences in the fluxes between CT and LR treatments consistent of litter-internal fluxes and the interaction fluxes between litter layer and mineral soil (defined as litter-induced, fL-S). Therefore, the contributions of fL-L or fL-S to GHG fluxes can be calculated as:
fL-L = (fLD − fCT)/fCT × 100%
fL-S = (2fCT − fLR − fLD)/fCT × 100%

2.7. Statistical Analysis

After testing the data for normal distribution and equal variance, a One-way ANOVA with Fisher LSD (Least-significant difference) multiple range test was applied to assess the effects of different litter manipulation treatments on soil temperature, soil moisture, microbial PLFAs, FCO2, FN2O, and FCH4. Linear regression analysis was employed to evaluate the relationships between the amount of litter layer and CO2 efflux. All statistical analyses were performed using SPSS 24.0 (IBM Corporation, Armonk, NY, USA) with significant differences at p < 0.05, unless otherwise stated. All figures were created by SigmaPlot 14.0 software (Systat Software Inc., San Jose, CA, USA).

3. Results

3.1. Soil Temperature and Soil Moisture

The monthly mean soil temperature in the CT plots had no significant differences between PF and BF, whereas soil moisture in CT plots in BF was significantly higher than that in PF (Table 2). All litter manipulation treatments did not significantly alter soil temperature in either forest (Table 2). LR treatment significantly decreased soil moisture in PF but had not significantly affected soil moisture in BF. LD or LE treatment had no significant effect on soil moisture in both forests (Table 2).

3.2. Soil Microbial PLFAs

The PLFAs of all microbial groups in PF were lower than that in BF under each litter manipulation treatment (Table 3). In PF, LR treatment significantly reduced the PLFAs of G+, G, bacteria, and fungi, whereas the effect of LD or LE treatment on all microbial groups were not significant. In BF, LR treatment had no significant effect on the PLFAs of all microbial groups, whereas LD or LE treatment significantly increased the PLFAs of G+, bacteria, and fungi (Table 3).

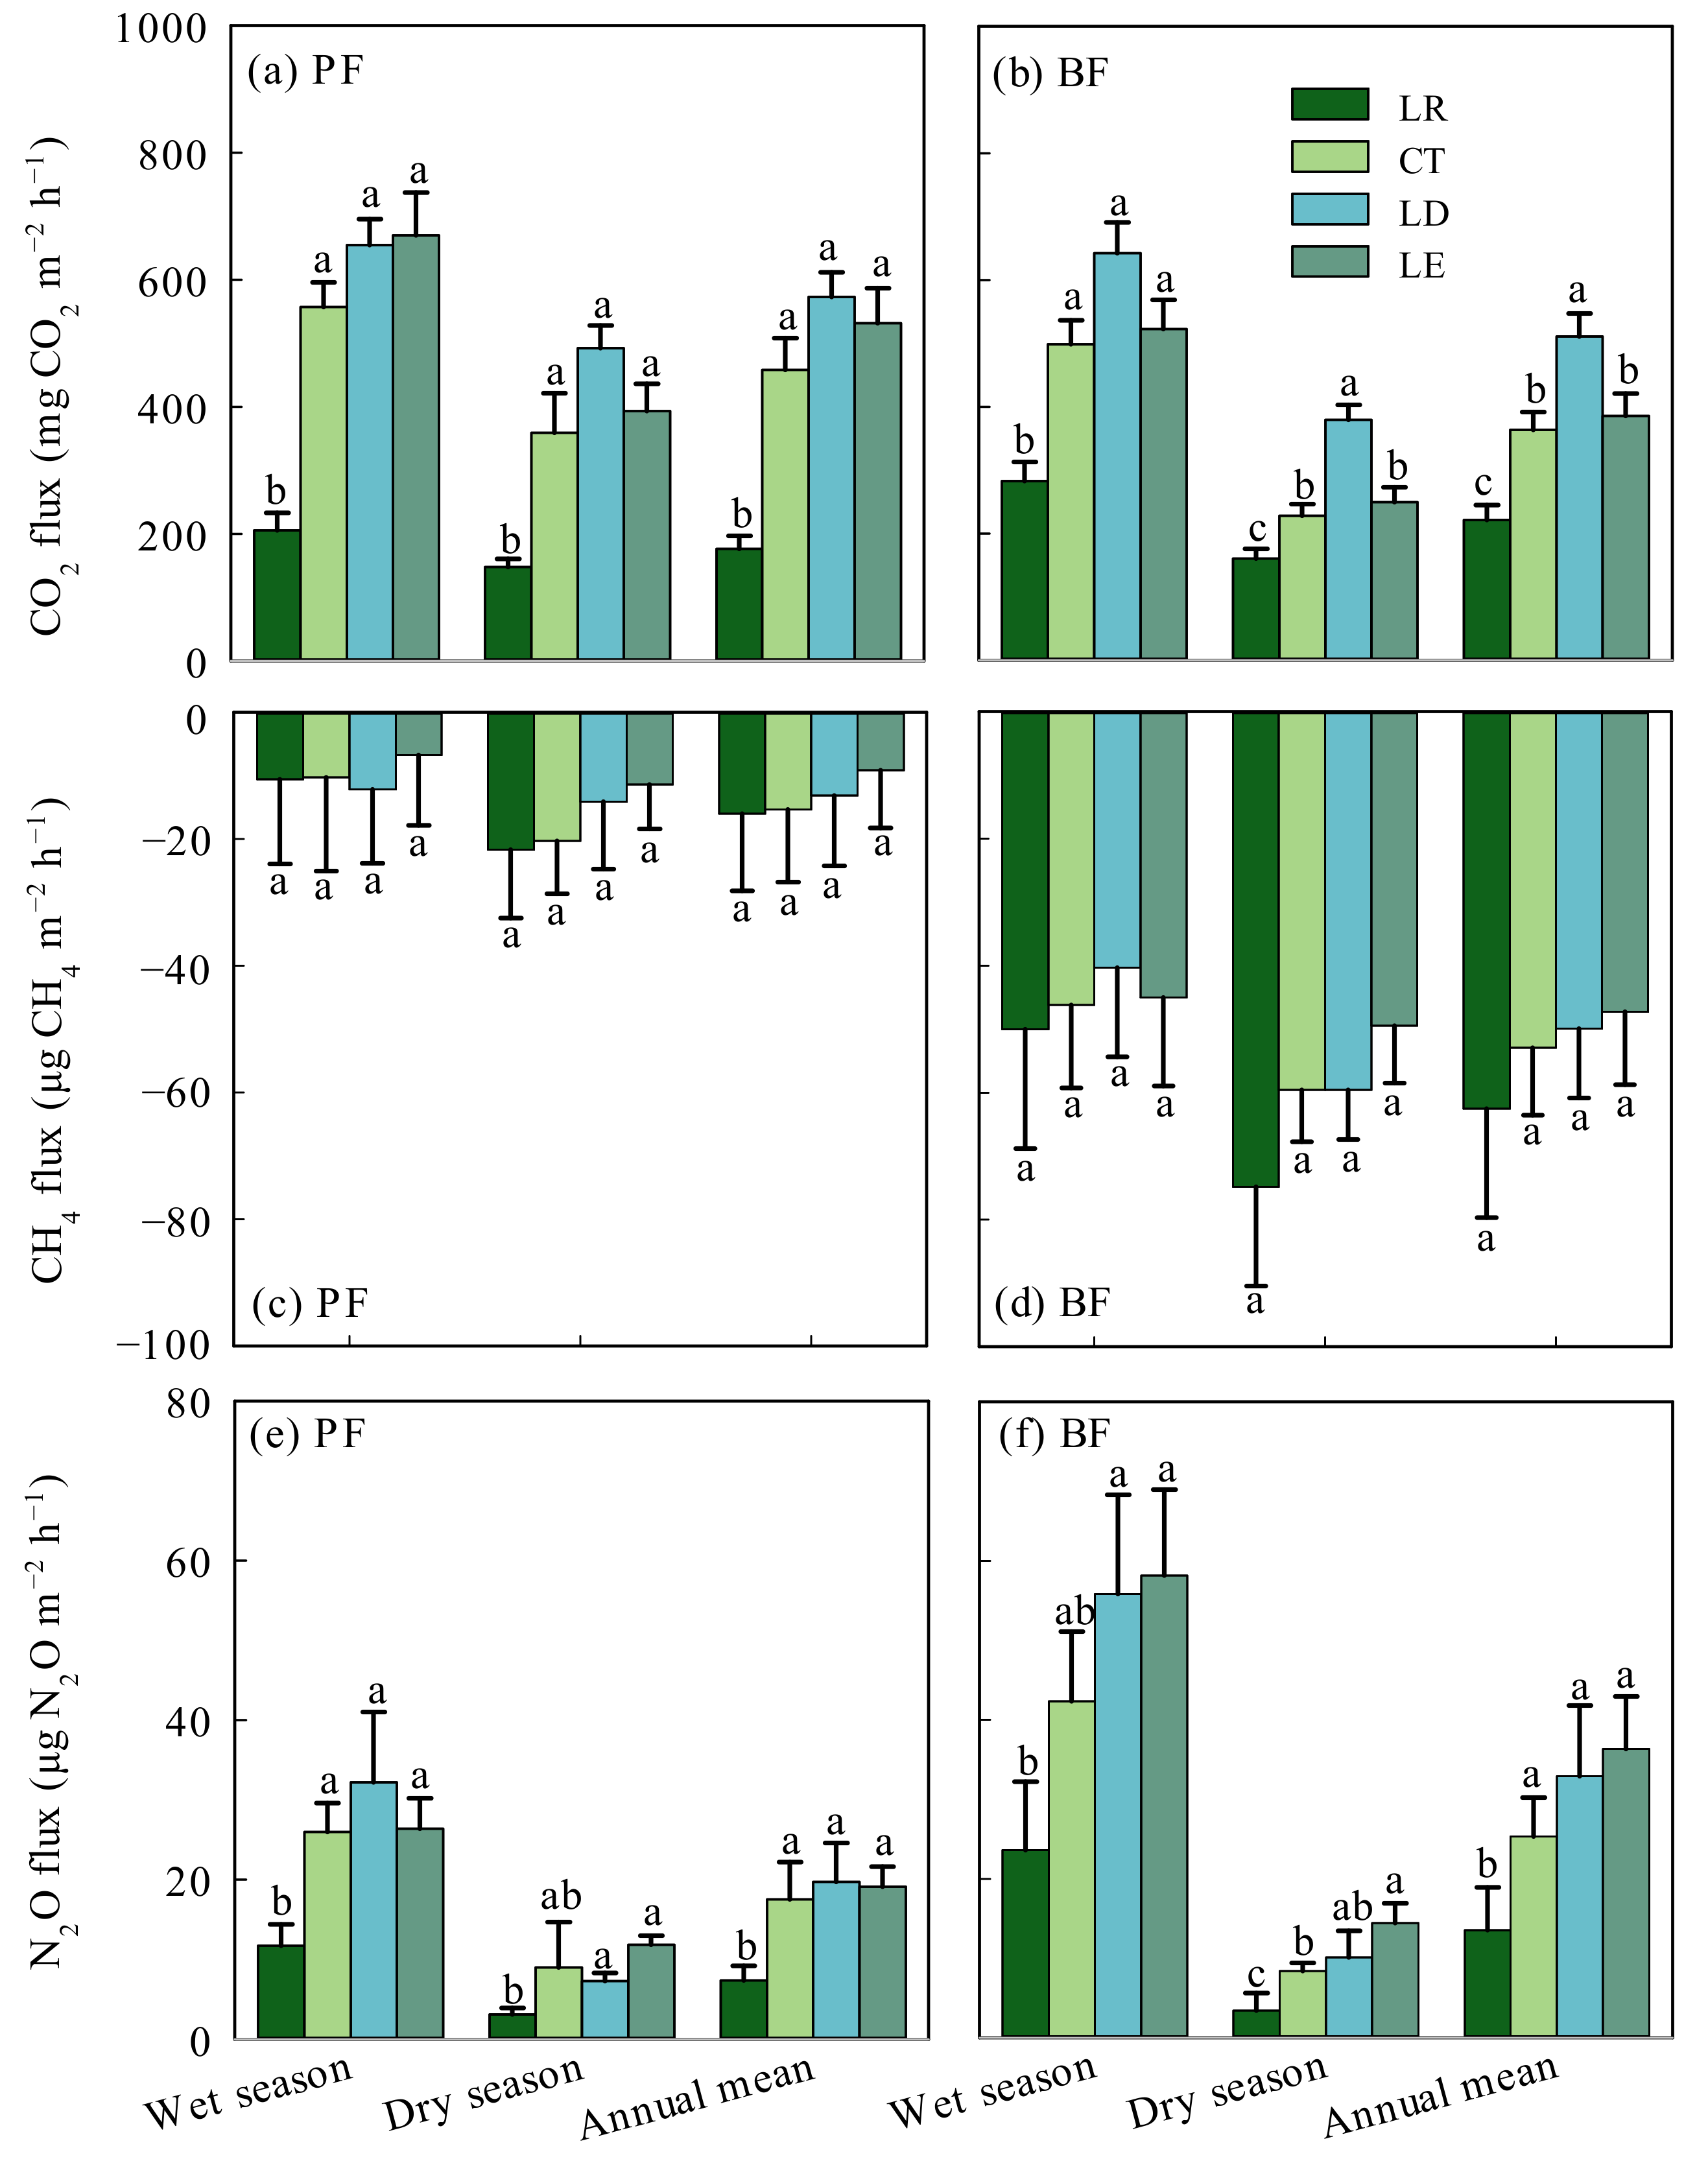
3.3. FCO2, FCH4, and FN2O

During the measured period, both PF and BF floors acted as the C sources under all litter manipulation treatments (Figure 1a,b), with much higher FCO2 in the wet season than that in the dry season (Figure 1a,b). At annual time scales, the mean FCO2 in CT plots were 458.2 ± 50.6 and 363.7 ± 28.1 mg CO2 m−2 h−1 for PF and BF, respectively (Figure 1a,b). LR treatment significantly reduced FCO2 by 61% in PF and 39% in BF, whereas LD treatment increased FCO2 by 25% in PF and 41% in BF. The reduction or increase rate of FCO2 was not significantly influenced by the wet or dry season in both forests. LE treatment increased FCO2 by 16% in PF and only 6% in BF. There was no significant difference between CT and LE treatments for both forests (Figure 1a,b).
Both PF and BF soils acted as atmospheric CH4 sinks under all treatments. At annual time scales, FCH4 in CT plots were −15.3 ± 11.5 and −52.9 ± 10.6 μg CH4 m−2 h−1 for PF and BF, respectively (Figure 1c,d). LR treatment increased soil CH4 uptake by 5% in PF and 18% in BF. LD treatment decreased soil CH4 uptake by 14% in PF and 6% in BF. LE treatment decreased soil CH4 uptake by 41% in PF and 11% in BF (Figure 1c,d).
Both PF and BF soils acted as atmospheric N2O sources under all treatments, with much higher FN2O in the wet season than in the dry season (Figure 1e,f). At annual time scales, FN2O in CT plots were 17.5 ± 4.7 and 25.3 ± 4.9 μg N2O m−2 h−1 for PF and BF, respectively (Figure 1e,f). LR treatment significantly reduced soil N2O emissions by 58% in PF and by 47% in BF. LD treatment increased soil N2O emissions by 13% in PF and by 30% in BF. LE treatment increased soil N2O emissions by 9% in PF and by 43% in BF (Figure 1e,f).

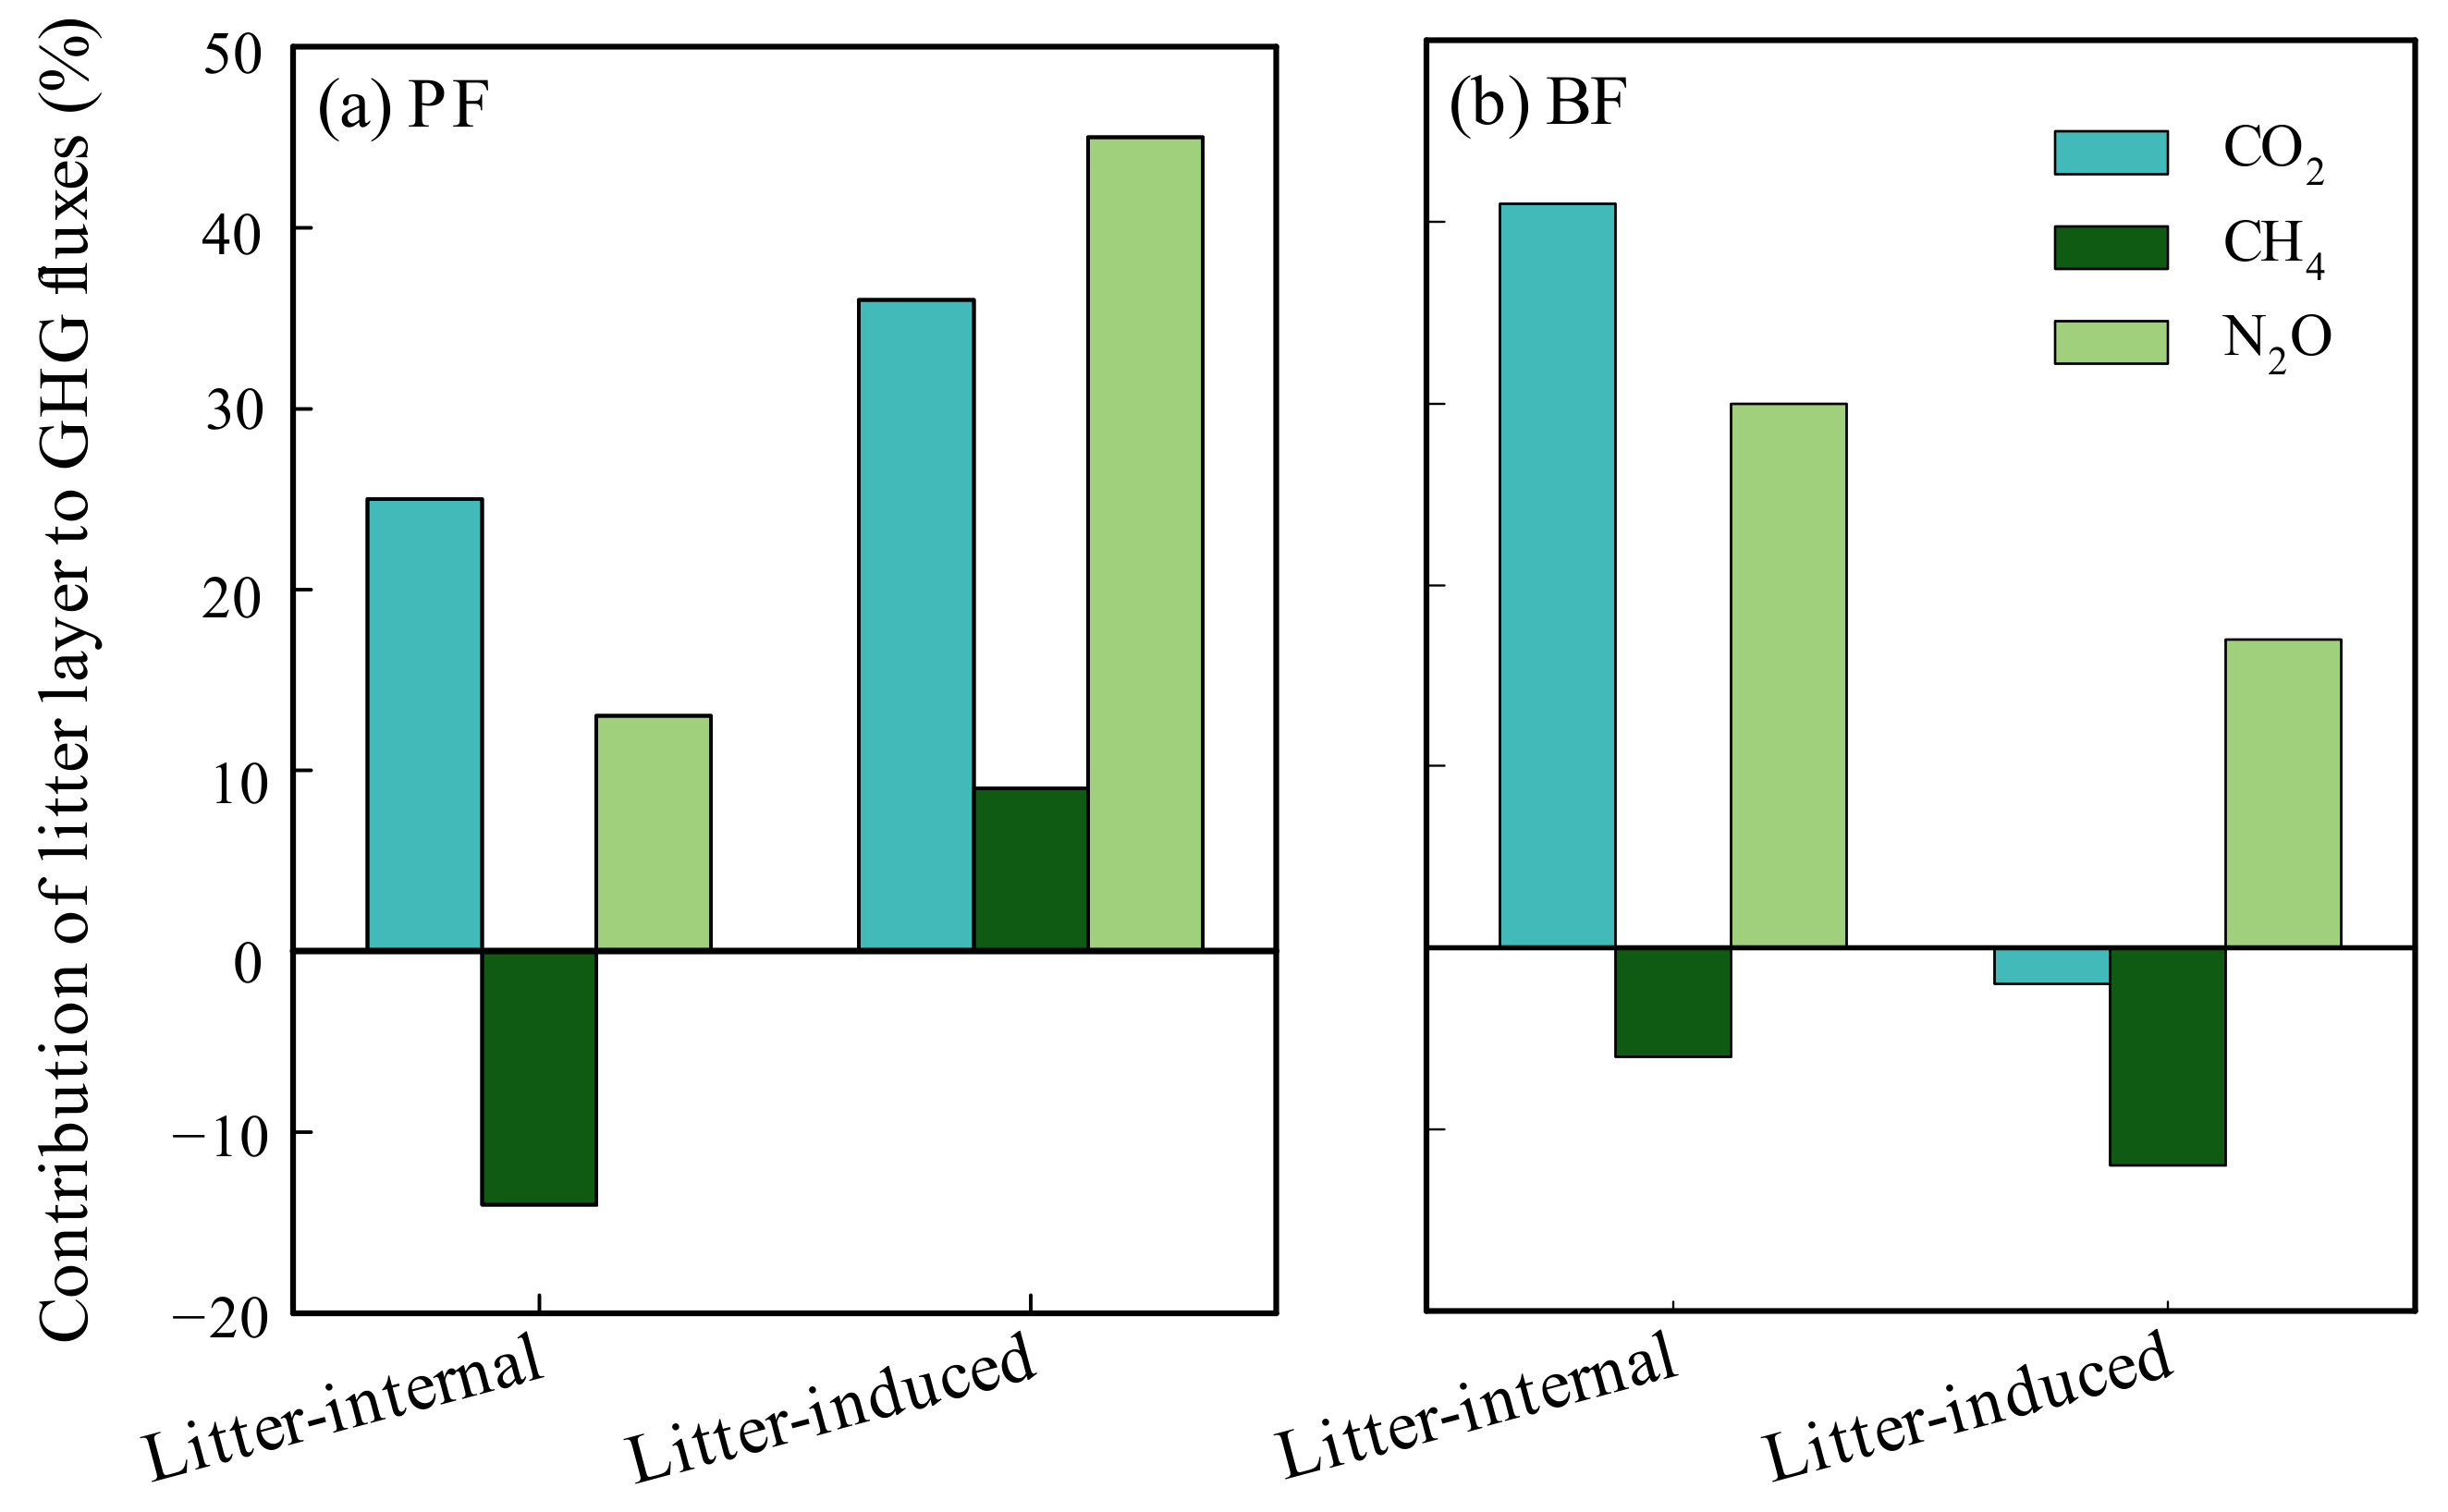
3.4. Contributions of Litter Layer to GHG Fluxes

In PF, the litter layer contributed 61% of FCO2, and the contributions resulting from fL-L and fL-S were 25% and 36%, respectively (Figure 2a). Diffusion of CH4 into the soil was facilitated by litter removal and CH4 uptake increased by 5%. fL-L and fL-S affected FCH4 in the opposite way, where fL-L increased CH4 uptake by 14% and fL-S increased CH4 emission by 9%. The litter layer contributed 58% of FN2O with a larger percentage of increase from fL-S (45%) (Figure 2a). In BF, the litter layer contributed 39% of FCO2; basically, the contributions came from fL-L (Figure 2b). Diffusion of CH4 into the soil was facilitated by litter removal, and CH4 uptake increased by 18%. The effect was stronger in fL-S (−12%) than fL-L (−6%). The litter layer contributed 47% of FN2O with a larger percentage of increase from fL-L (30%) (Figure 2b).

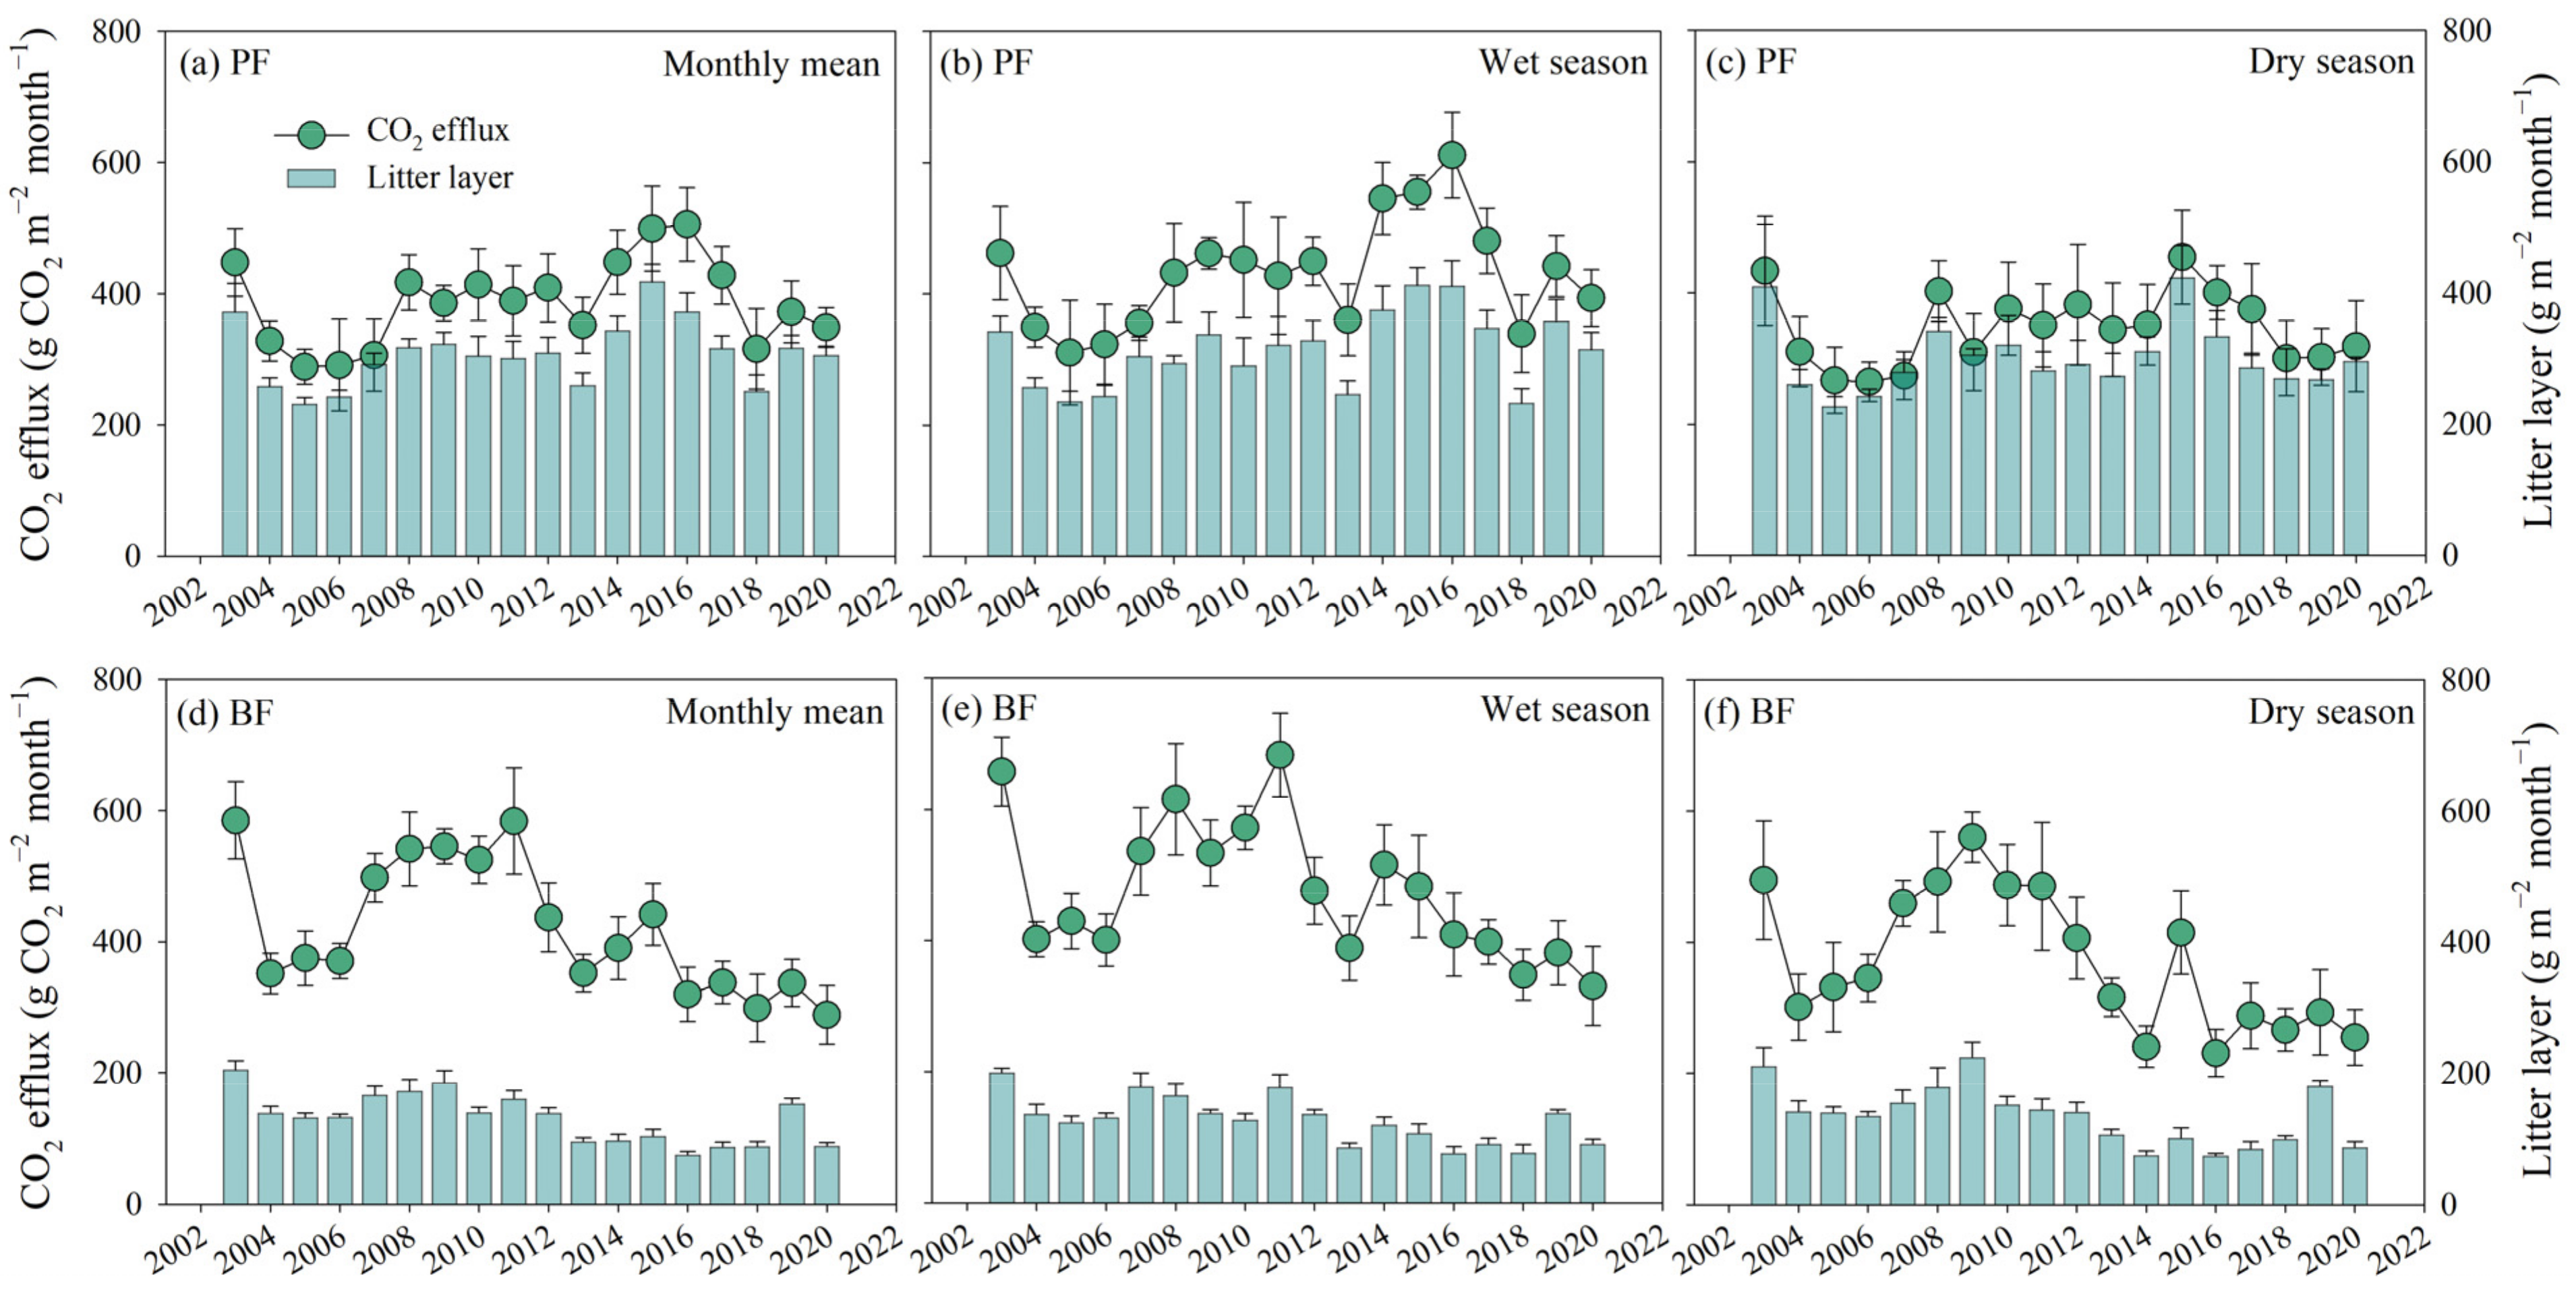
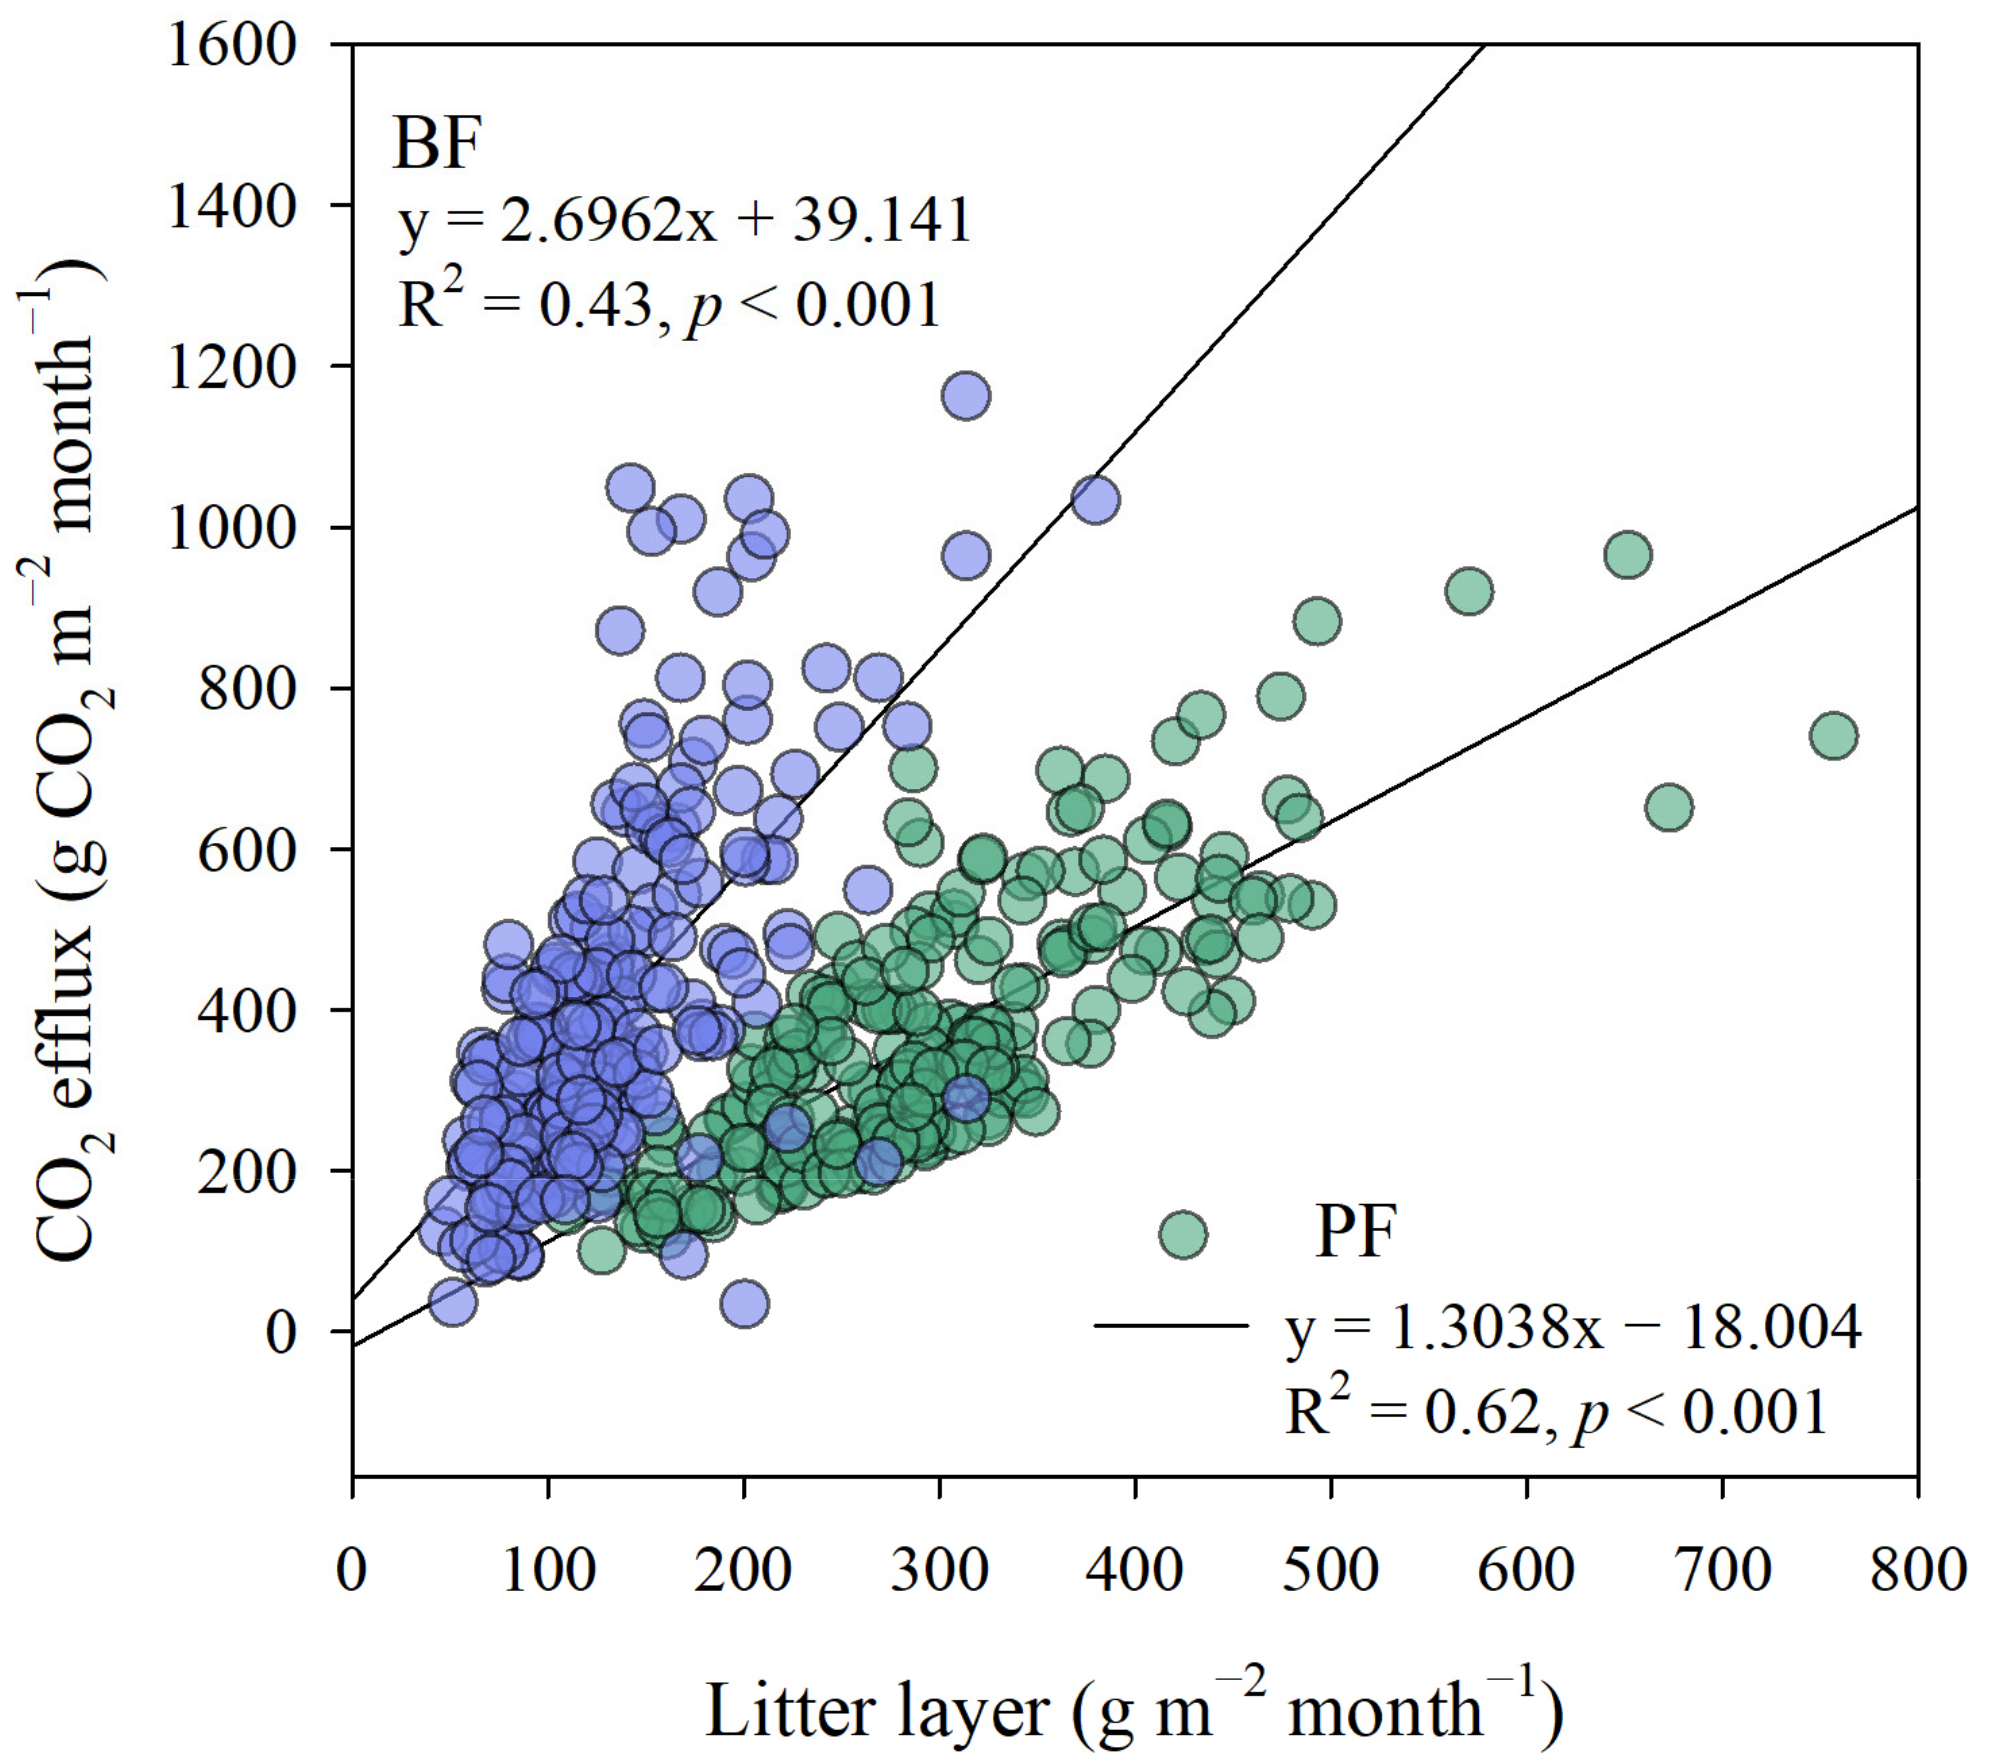
3.5. Interannual Variabilities of the Amount of Litter Layer and CO2 Efflux

The monthly mean amount of surface litter layer in PF was higher than in BF across all measured years (from 2003 to 2020), and the differences of the monthly mean amount of litter layer in both forests were not significantly influenced by wet or dry season (Figure 3). The monthly mean CO2 efflux in the wet season was higher than in the dry season for both forests in most years. Although monthly mean CO2 effluxes in PF and BF showed an unequal amplitude fluctuation at the interannual scale, the variational trends were consistent with the monthly mean amount of litter layer (Figure 3). Monthly mean CO2 efflux had a significant positive correlation with the monthly mean amount of litter layer, and the sensitivities of the linear regressions for the two forests differed significantly (PF: slope = 1.30; BF: slope = 2.70) (Figure 4).

4. Discussion

4.1. Effects of Litter Manipulation Treatments on FCO2

Our results showed that the LR treatment significantly reduced mean CO2 emissions from the forest floor in both forests (Figure 1), which was consistent with previous studies [9,11,12]. On the one hand, litter removal usually reduces the decomposition of organic matter due to the decreased supplies of easily decomposable substrates (i.e., litter-derived compounds) for microbes in both the litter layer and mineral soil [7,9,35,36]. This results in a decline in microbial respiration, supported by the significant decrease of soil microbial biomass (i.e., bacteria, fungi, G+, and G) in PF under LR treatment (Table 3). On the other hand, litter removal may reduce the moisture content of the surface soil, thus reducing the downward transport of C, nutrients, and the catabolism of microbes, resulting in a decrease in CO2 emissions from the mineral soil [7]. This was also confirmed by the significant decrease of soil moisture content in PF under LR treatment (Table 2). In contrast, LD treatment increased FCO2 in both forests (Figure 1a,b), indicating that increased litter inputs can promote CO2 emissions from the forest floor [9,11,12]. Because litter material is rich in easily available C and nutrients [2], microbial respiration can be stimulated by litter addition due to the increased supplies of these easily decomposable substrates for soil microbes [37,38]. The increased microbial biomass in both forest soils under LD treatment confirmed this statement, although the responses of most microbial groups were not statistically significant (Table 3). Moreover, litter addition can also increase leaching transports of DOC from the litter layer into mineral soil, which can accelerate internal soil C cycling in forest ecosystems [39]. Some previous studies attributed the increased soil FCO2 by litter addition to priming effects, whereby extant soil organic C mineralization is stimulated by the increased input of fresh organic matter [12,40,41]. This process could actually increase net soil organic C losses to the atmosphere [12]. However, we did not detect strong evidence that priming effects played an important role in the two subtropical forests since LR treatment had a stronger effect on CO2 emissions than LD treatment (Figure 1a,b). This was consistent with Leff et al. (2012) [9], who found the litter-derived priming effects were weak after two years of litter manipulation treatments in tropical forests.

4.2. Effects of Litter Manipulation Treatments on FCH4

The mean FCH4 was negative during the measured period (Figure 1c,d), which indicates a constant uptake of atmospheric CH4 by the two forest soils under all litter treatments. Similar results were also found in temperate and subtropical forests [2,6,36]. As found in this study, average CH4 uptake increased by LR treatment and decreased by LD treatment, although it was not statistically significant (Figure 1c,d). This result does not mean that litter can produce or consume CH4 efficiently because CH4 is mainly oxidized by methanotrophs at the soil and water interface or rhizosphere aerobic environment. The litter layer mainly acts as a physical barrier inhibiting CH4 diffusion into the soil [3,36]. Therefore, soil CH4 uptake was increased by litter removal and decreased by litter addition, which was also observed in previous studies [2,6,36]. In addition, soil CH4 uptake rate is negatively related to soil moisture [42], so higher soil CH4 uptake is often observed in the dry season (Figure 1c,d). Firstly, the excessive soil moisture content in the wet season may influence soil CH4 uptake by decreasing gas diffusion and the activities of CH4 consuming microbes (e.g., methanotrophs) [10]. Secondly, higher leachates such as monoterpenes from the wet litter layer may suppress CH4 diffusion into mineral soils [2]. Therefore, the increase in soil CH4 uptake under LR treatment may be bigger in the wet season than in the dry season.

4.3. Effects of Litter Manipulation Treatments on FN2O

N2O production in forest soils is mainly via the opposing processes of nitrification and denitrification [43], which are strongly affected by the surface litter layer [44]. In this study, LD treatment slightly increased annual mean soil N2O emissions in both forests (Figure 1e,f). The increase in N2O flux was mainly the result of the decomposition of the litter, which supplies sufficient substrates (i.e., NH4-N and NO3-N) for N2O production [45,46]. In addition, LD treatment could also promote soil N2O emissions by enhancing the anaerobic soil environment [6,47] because a thicker litter layer in LD plots may act as a diffusion barrier for oxygen and form anoxic microsites for N2O production [2]. Because of the important contribution of the litter layer to soil N2O emissions, litter removal may cause a substantial reduction of N2O flux, which was confirmed by our results (Figure 1e,f). A previous study suggested that soil temperature is the main factor influencing N2O fluxes when the litter layer is removed [48]. However, our study found that soil temperature was not significantly affected by LR or LD treatment in both forests (Table 2). Therefore, the decreased supplies of C and N substrates for nitrification and/or denitrification from surface litter removal was responsible for the decreased soil N2O emissions in the two subtropical forests. Another possible mechanism for this phenomenon was the increased runoff by LR treatment resulting in higher local aeration and, therefore, reduction of N2O to N2 in an aerobic environment, which was supported by the lower soil moisture content in the LR plots in PF (Table 2).

4.4. Forest Succession Regulates the Contributions of Litter Layer to GHG Fluxes

Although we observed that the surface litter layer was the major source of FCO2 and significantly influenced FCH4 and FN2O through our experiment, these GHG fluxes showed contrasting responses to litter manipulation treatment in PF and BF (Figure 1). The major reason for this phenomenon may be related to the differences in the total contribution of the litter layer and the percentage of fL-L or fL-S to GHG fluxes in the two successional subtropical forests (Figure 2).
In the present study, the PF is a young forest regenerated about 80 years ago and at the early stage of succession [28], and the BF is an old mature forest (>400 years) at the late stage of succession [29]. Therefore, the patterns of aboveground and belowground C allocation may be quite different. During the last 30 years, aboveground litter inputs have significantly increased, but SOC accumulation remained at a lower rate (26 ± 4 g C m−2 yr−1) in the PF [8]. However, the BF shows a declining trend of aboveground litter inputs, and the SOC rapidly accumulates at a higher rate (61 g C m−2 yr−1) [29]. The progressive C accumulation in soils with forest succession implies a lower loss of litter mass through microbial respiration in the BF than in the PF [8]. Long-term monitoring data of the decreased trend of CO2 efflux from the BF soils during the last two decades further supported our experimental results (Figure 3). Because the fraction of the net primary production allocated belowground increases with forest succession [27], the influence of belowground C compounds on CO2 fluxes would increase in the advanced forests [11]. Previous studies indicated that fine root biomass in the older forest is higher than in the younger forest [10,49,50,51]. Therefore, the contribution of aboveground litter to CO2 fluxes may decrease with forest succession due to the increased autotrophic respiration by fine root. This was indirectly confirmed by our result that the litter layer contributed a higher percentage to CO2 fluxes in PF (61%) than that in BF (39%) (Figure 2).
In addition to the quantity of litter, FCO2 is also positively correlated to litter quality [52]. Surface litter with higher quality (i.e., low lignin/N or C/N ratios) often decomposes more quickly [13,15]. According to a previous study, the litter C/N ratios and lignin contents gradually decrease with forest succession, which in turn increases litter decomposition rate, thus shortening residence times of the surface litter layer in BF [8]. Therefore, the monthly mean amount of surface litter in BF was lower than that in PF (Figure 3). This evidence supported that the contributions of litter decomposition to CO2 emissions were higher in BF than that in PF (Figure 2 and Figure 4). Due to the higher quality and quicker decomposition of BF litter than PF litter (Table 1), the increase of FCO2 by LD treatment was higher in BF than that in PF (Figure 1a,b), which was also confirmed by the higher increase of microbial PLFAs in BF than PF under LD treatment (Table 3). In contrast, the PF is dominated by needle litter, which is characterized by high polyphenol contents that would delay decomposition processes [53]. The slower litter decomposition rate could prolong the time of the interactions between the litter layer and mineral soil, resulting in a higher contribution of fL-S to FCO2 in PF (Figure 2a). Given that the PF soils have lower C and nutrient contents than the BF soils (Table 1), litter is the major C source for soil microbes in PF. Therefore, the decrease in FCO2 and microbial PLFAs (i.e., Bacteria, Fungi, G+, and G) in PF induced by LR treatment were all significant (Table 3, Figure 1a). Our results were consistent with previous studies [11,54], indicating that the effect of litter removal on FCO2 decreases with forest succession.
The low proportion of fL-L or fL-S contributing to FCH4 for both forests (Figure 2) indicated that the surface litter layer mainly acts as a physical barrier influencing CH4 diffusion into the soil rather than producing or consuming CH4 by itself [3,36]. Interestingly, our study showed that soil CH4 uptake increased with progressive forest succession (Figure 1c,d), consistent with previous studies in tropical/subtropical forests [10,55]. The major reason for this phenomenon could be related to the differences in soil properties between the two forests. Although both forest soils developed on the same parent materials and have experienced similar climatic conditions [21], soil properties were altered significantly during forest succession. In this study, lower soil bulk density and higher soil porosity in BF than PF (Table 1) suggested the BF soils are more beneficial to oxygen transport and thus enhance methane oxidase activity and methane-oxidizing microorganisms, resulting in a greater CH4 uptake [10,52,55]. In addition, the increased fine root biomass with forest succession implies greater root penetration and larger root water uptake and thus resulting in greater soil aeration for CH4 uptake [3].
Our results showed that the total contribution of the surface litter layer to FN2O decreased with forest succession, whereas a higher proportion of fL-L and fL-S contributing to FN2O was observed in BF and PF, respectively (Figure 2). This is very similar to the response pattern of FCO2. The major reason may be related to litter quality (i.e., lignin/N or C/N ratios), decomposition rates, and labile substrates, as discussed above. It should be noted that elevated N deposition in the study area may alter the relationship between the litter layer and FN2O by inhibiting the breakdown of C and N compounds in the litter layer and mineral soil through inhibiting oxidative extracellular enzyme activity or even by promoting the formation of recalcitrant compounds [56] and thus influencing N2O emissions from forest soils. Although the surface litter layer can significantly influence FN2O, N2O production in subtropical forest soils is mainly through the denitrification process [48,57], which depends heavily on soil N availability [58]. In this study, lower soil N content in PF was responsible for the lower FN2O at annual time scales (Table 1, Figure 1e,f). In contrast, the BF is N saturated with larger N pools and higher N availability (mainly as NO3) [59], contributing to the higher FN2O in BF. Moreover, higher soil organic C content in BF than PF (Table 1) would also contribute to the higher FN2O in BF since higher soil organic C can enhance denitrification through promoting the growth of denitrifying bacteria [46].

5. Conclusions

The surface litter layer regulates C and nutrient cycling in forest ecosystems [5,54,60]. Changes in aboveground litter inputs can have important influences on GHG fluxes [9,10,61,62]. This study showed that LD treatment increased FCO2 and FN2O with a greater increase in BF (41% for FCO2 and 30% for FN2O), and LR treatment decreased FCO2 and FN2O with the greater decrease in PF (−61% for FCO2 and −58% for FN2O). In contrast, LD treatment decreased FCH4 by 14% in PF and 6% in BF, and LR treatment increased FCH4 by 5% in PF and 18% in BF. Additionally, fL-S contributed more to FCO2 (36%) and FN2O (45%) than fL-L in PF, whereas contributions of fL-L to FCO2 (41%) and FN2O (30%) were much bigger than fL-S in BF. These results supported our hypothesis and indicated that fL-L is the major source of GHG fluxes in the BF, whereas fL-S dominates GHG fluxes in the PF. The results highlight that forest succession regulates the relative contributions of fL-L and fL-S to GHG fluxes via direct or indirect effects on biogeochemical processes in the forest floor and mineral soils and should be considered in the terrestrial ecosystem models when estimating GHG budgets in the context of global warming. Our study not only improves the quantitative method for calculating the contributions of surface litter layer to GHG fluxes in forest ecosystems but also provides a scientific reference for forest management and protection to increase carbon sink in the future.

Author Contributions

J.J. and J.Y. designed the research; H.Z. and M.Y. conducted the experiment; J.J., F.L. and S.X. performed the analysis; J.J., Y.-P.W. and J.Y. wrote the manuscript. All authors have read and agreed to the published version of the manuscript.

Funding

This research was funded by the National Natural Science Foundation of China [41825020, 31901296], and the Guangdong Basic and Applied Basic Research Foundation [2021A1515010652].

Institutional Review Board Statement

Not applicable.

Informed Consent Statement

Not applicable.

Data Availability Statement

The data presented in this study are available on request from the corresponding author.

Acknowledgments

Thanks are due to the editors and two anonymous reviewers for their suggestions on improving the manuscript. We are also grateful to Hongying Li and Chuanyin Xiang for their skillful assistance in laboratory and field work.

Conflicts of Interest

The authors declare that no conflict of interest exits in the submission of this manuscript, and the manuscript is approved by all authors for publication.

References

  1. IPCC. Climate Change 2013: The Physical Science Basis; Contribution of Working Group I to the Fifth Assessment Report of the Intergovernmental Panel on Climate Change; Cambridge University Press: Cambridge, UK, 2013; p. 1535. [Google Scholar]
  2. Leitner, S.; Sae-Tun, O.; Kranzinger, L.; Zechmeister-Boltenstern, S.; Zimmermann, M. Contribution of litter layer to soil greenhouse gas emissions in a temperate beech forest. Plant Soil 2016, 403, 455–469. [Google Scholar] [CrossRef] [Green Version]
  3. Peichl, M.; Arain, M.A.; Ullah, S.; Moore, T.R. Carbon dioxide, methane, and nitrous oxide exchanges in an age-sequence of temperate pine forests. Glob. Chang. Biol. 2010, 16, 2198–2212. [Google Scholar] [CrossRef]
  4. Yan, J.; Zhang, W.; Wang, K.; Qin, F.; Wang, W.; Dai, H.; Li, P. Responses of CO2, N2O and CH4 fluxes between atmosphere and forest soil to changes in multiple environmental conditions. Glob. Chang. Biol. 2014, 20, 300–312. [Google Scholar] [CrossRef] [PubMed]
  5. Attiwill, P.M.; Adams, M.A. Nutrient cycling in forests. New Phytol. 1993, 124, 561–582. [Google Scholar] [CrossRef]
  6. Fan, J.; Luo, R.; McConkey, B.G.; Ziadi, N. Effects of nitrogen deposition and litter layer management on soil CO2, N2O, and CH4 emissions in a subtropical pine forestland. Sci. Rep. 2020, 10, 8959. [Google Scholar] [CrossRef]
  7. Xu, S.; Liu, L.L.; Sayer, E.J. Variability of above-ground litter inputs alters soil physicochemical and biological processes: A meta-analysis of litterfall-manipulation experiments. Biogeosciences 2013, 10, 7423–7433. [Google Scholar] [CrossRef] [Green Version]
  8. Huang, Y.H.; Li, Y.L.; Xiao, Y.; Wenigmann, K.O.; Zhou, G.Y.; Zhang, D.Q.; Wenigmann, M.; Tang, X.L.; Liu, J.X. Controls of litter quality on the carbon sink in soils through partitioning the products of decomposing litter in a forest succession series in South China. For. Ecol. Manag. 2011, 261, 1170–1177. [Google Scholar] [CrossRef]
  9. Leff, J.W.; Wieder, W.R.; Taylor, P.G.; Townsend, A.R.; Nemergut, D.R.; Grandy, A.S.; Cleveland, C.C. Experimental litterfall manipulation drives large and rapid changes in soil carbon cycling in a wet tropical forest. Glob. Chang. Biol. 2012, 18, 2969–2979. [Google Scholar] [CrossRef]
  10. Tang, X.; Liu, S.; Zhou, G.; Zhang, D.; Zhou, C. Soil-atmospheric exchange of CO2, CH4, and N2O in three subtropical forest ecosystems in southern China. Glob. Chang. Biol. 2006, 12, 546–560. [Google Scholar] [CrossRef]
  11. Han, T.; Huang, W.; Liu, J.; Zhou, G.; Xiao, Y. Different soil respiration responses to litter manipulation in three subtropical successional forests. Sci. Rep. 2015, 5, 18166. [Google Scholar] [CrossRef]
  12. Sayer, E.J.; Heard, M.S.; Grant, H.K.; Marthews, T.R.; Tanner, E.V.J. Soil carbon release enhanced by increased tropical forest litterfall. Nat. Clim. Chang. 2011, 1, 304–307. [Google Scholar] [CrossRef]
  13. Cepakova, S.; Frouz, J. Changes in chemical composition of litter during decomposition: A review of published C-13 NMR spectra. J. Soil Sci. Plant. Nutr. 2015, 15, 805–815. [Google Scholar]
  14. Kooch, Y.; Bayranvand, M. Labile soil organic matter changes related to forest floor quality of tree species mixtures in Oriental beech forests. Ecol. Indic. 2019, 107, 105598. [Google Scholar] [CrossRef]
  15. Prescott, C.E. Litter decomposition: What controls it and how can we alter it to sequester more carbon in forest soils? Biogeochemistry 2010, 101, 133–149. [Google Scholar] [CrossRef]
  16. Zheng, Y.; Hu, Z.; Pan, X.; Chen, X.; Derrien, D.; Hu, F.; Liu, M.; Hattenschwiler, S. Carbon and nitrogen transfer from litter to soil is higher in slow than rapid decomposing plant litter: A synthesis of stable isotope studies. Soil Biol. Biochem. 2021, 156, 108196. [Google Scholar] [CrossRef]
  17. Tian, H.; Xu, X.; Lu, C.; Liu, M.; Ren, W.; Chen, G.; Melillo, J.; Liu, J. Net exchanges of CO2, CH4, and N2O between China's terrestrial ecosystems and the atmosphere and their contributions to global climate warming. J. Geophys. Res. Biogeosci. 2011, 116, G02011. [Google Scholar] [CrossRef] [Green Version]
  18. Del Grosso, S.J.; Parton, W.J.; Mosier, A.R.; Ojima, D.S.; Potter, C.S.; Borken, W.; Brumme, R.; Butterbach-Bahl, K.; Crill, P.M.; Dobbie, K.; et al. General CH4 oxidation model and comparisons of CH4 oxidation in natural and managed systems. Glob. Biogeochem. Cycles 2000, 14, 999–1019. [Google Scholar] [CrossRef]
  19. Hashimoto, S.; Morishita, T.; Sakata, T.; Ishizuka, S.; Kaneko, S.; Takahashi, M. Simple models for soil CO2, CH4, and N2O fluxes calibrated using a Bayesian approach and multi-site data. Ecol. Model. 2011, 222, 1283–1292. [Google Scholar] [CrossRef]
  20. Luo, Y.; Gerten, D.; Le Maire, G.; Parton, W.J.; Weng, E.; Zhou, X.; Keough, C.; Beier, C.; Ciais, P.; Cramer, W.; et al. Modeled interactive effects of precipitation, temperature, and CO2 on ecosystem carbon and water dynamics in different climatic zones. Glob. Change Biol. 2008, 14, 1986–1999. [Google Scholar] [CrossRef]
  21. Yan, J.; Zhang, D.; Zhou, G.; Liu, J. Soil respiration associated with forest succession in subtropical forests in Dinghushan Biosphere Reserve. Soil Biol. Biochem. 2009, 41, 991–999. [Google Scholar] [CrossRef]
  22. Yan, J.; Li, K.; Peng, X.; Huang, Z.; Liu, S.; Zhang, Q. The mechanism for exclusion of Pinus massoniana during the succession in subtropical forest ecosystems: Light competition or stoichiometric homoeostasis? Sci. Rep. 2015, 5, 10994. [Google Scholar] [CrossRef] [Green Version]
  23. Zhou, G.; Guan, L.; Wei, X.; Zhang, D.; Zhang, Q.; Yan, J.; Wen, D.; Liu, J.; Liu, S.; Huang, Z.; et al. Litterfall Production Along Successional and Altitudinal Gradients of Subtropical Monsoon Evergreen Broadleaved Forests in Guangdong, China. Plant Ecol. 2006, 188, 77–89. [Google Scholar] [CrossRef]
  24. Peng, S.L.; Wang, B.S. Forest succession at Dinghushan, Guangdong, China. Chin. J. Bot. 1995, 7, 75–80. [Google Scholar]
  25. Yan, J.; Li, K.; Wang, W.; Zhang, D.; Zhou, G. Changes in dissolved organic carbon and total dissolved nitrogen fluxes across subtropical forest ecosystems at different successional stages: Carbon and nitrogen fluxes response to forest succession. Water Resour. Res. 2015, 51, 3681–3694. [Google Scholar] [CrossRef]
  26. Jiang, J.; Wang, Y.P.; Yu, M.; Cao, N.; Yan, J. Soil organic matter is important for acid buffering and reducing aluminum leaching from acidic forest soils. Chem. Geol. 2018, 501, 86–94. [Google Scholar] [CrossRef]
  27. Yan, J.; Wang, Y.; Zhou, G.; Zhang, D. Estimates of soil respiration and net primary production of three forests at different succession stages in South China. Glob. Chang. Biol. 2006, 12, 810–821. [Google Scholar] [CrossRef]
  28. Mo, J.; Brown, S.; Peng, S.; Kong, G. Nitrogen availability in disturbed, rehabilitated and mature forests of tropical China. For. Ecol. Manag. 2003, 175, 573–583. [Google Scholar] [CrossRef]
  29. Zhou, G.; Liu, S.; Li, Z.; Zhang, D.; Tang, X.; Zhou, C.; Yan, J.; Mo, J. Old-growth forests can accumulate carbon in soils. Science 2006, 314, 1417. [Google Scholar] [CrossRef] [Green Version]
  30. Jiang, J.; Wang, Y.P.; Yu, M.; Li, K.; Shao, Y.; Yan, J. Responses of soil buffering capacity to acid treatment in three typical subtropical forests. Sci. Total Environ. 2016, 563–564, 1068–1077. [Google Scholar] [CrossRef]
  31. Wang, Y.S.; Wang, Y.H. Quick measurement of CH4, CO2 and N2O emissions from a short-plant ecosystem. Adv. Atmos. Sci. 2003, 20, 842–844. [Google Scholar]
  32. Frostegard, A.; Baath, E.; Tunlid, A. Shifts in the structure of soil microbial coumunites in limed forests as revealed by phospholipid fatty-acid analysis. Soil Biol. Biochem. 1993, 25, 723–730. [Google Scholar] [CrossRef]
  33. Frostegard, A.; Baath, E. The use of phospholipid fatty acid analysis to estimate bacterial and fungal biomass in soil. Biol. Fertil. Soils 1996, 22, 59–65. [Google Scholar] [CrossRef]
  34. Haettenschwiler, S.; Aeschlimann, B.; Couteaux, M.M.; Roy, J.; Bonal, D. High variation in foliage and leaf litter chemistry among 45 tree species of a neotropical rainforest community. New Phytol. 2008, 179, 165–175. [Google Scholar] [CrossRef] [PubMed]
  35. Wang, Q.; He, T.; Wang, S.; Liu, L. Carbon input manipulation affects soil respiration and microbial community composition in a subtropical coniferous forest. Agric. For. Meteorol. 2013, 178, 152–160. [Google Scholar] [CrossRef]
  36. Wang, Y.; Wang, H.; Ma, Z.; Dai, X.; Wen, X.; Liu, Y.; Wang, Z.L. The litter layer acts as a moisture-induced bidirectional buffer for atmospheric methane uptake by soil of a subtropical pine plantation. Soil Biol. Biochem. 2013, 66, 45–50. [Google Scholar] [CrossRef]
  37. Crow, S.E.; Lajtha, K.; Bowden, R.D.; Yano, Y.; Brant, J.B.; Caldwell, B.A.; Sulzman, E.W. Increased coniferous needle inputs accelerate decomposition of soil carbon in an old-growth forest. For. Ecol. Manag. 2009, 258, 2224–2232. [Google Scholar] [CrossRef]
  38. Kalbitz, K.; Meyer, A.; Yang, R.; Gerstberger, P. Response of dissolved organic matter in the forest floor to long-term manipulation of litter and throughfall inputs. Biogeochemistry 2007, 86, 301–318. [Google Scholar] [CrossRef]
  39. Cleveland, C.C.; Reed, S.C.; Townsend, A.R. Nutrient regulation of organic matter decomposition in a tropical rain forest. Ecology 2006, 87, 492–503. [Google Scholar] [CrossRef]
  40. Fontaine, S.; Barot, S.; Barre, P.; Bdioui, N.; Mary, B.; Rumpel, C. Stability of organic carbon in deep soil layers controlled by fresh carbon supply. Nature 2007, 450, 277–280. [Google Scholar] [CrossRef]
  41. Kuzyakov, Y.; Friedel, J.K.; Stahr, K. Review of mechanisms and quantification of priming effects. Soil Biol. Biochem. 2000, 32, 1485–1498. [Google Scholar] [CrossRef]
  42. Verchot, L.V.; Davidson, E.A.; Cattanio, J.H.; Ackerman, I.L. Land-Use Change and Biogeochemical Controls of Methane Fluxes in Soils of Eastern Amazonia. Ecosystems 2000, 3, 41–56. [Google Scholar] [CrossRef]
  43. Wang, Y.; Wang, H.; Wang, Z.L.; Ma, Z.; Dai, X.; Wen, X.; Liu, Y. Effect of litter layer on soil-atmosphere N2O flux of a subtropical pine plantation in China. Atmos. Environ. 2014, 82, 106–112. [Google Scholar] [CrossRef]
  44. Ley, M.; Lehmann, M.F.; Niklaus, P.A.; Luster, J. Alteration of nitrous oxide emissions from floodplain soils by aggregate size, litter accumulation and plant-soil interactions. Biogeosciences 2018, 15, 7043–7057. [Google Scholar] [CrossRef] [Green Version]
  45. Eickenscheidt, N.; Brumme, R. Regulation of N2O and NOx emission patterns in six acid temperate beech forest soils by soil gas diffusivity, N turnover, and atmospheric NOx concentrations. Plant Soil 2013, 369, 515–529. [Google Scholar] [CrossRef] [Green Version]
  46. Zhang, W.; Mo, J.; Yu, G.; Fang, Y.; Li, D.; Lu, X.; Wang, H. Emissions of nitrous oxide from three tropical forests in Southern China in response to simulated nitrogen deposition. Plant Soil 2008, 306, 221–236. [Google Scholar] [CrossRef]
  47. Chapuis-Lardy, L.; Wrage, N.; Metay, A.; Chotte, J.L.; Bernoux, M. Soils, a sink for N2O? A review. Glob. Chang. Biol. 2007, 13, 1–17. [Google Scholar] [CrossRef]
  48. Gao, J.; Zhou, W.; Liu, Y.; Zhu, J.; Sha, L.; Song, Q.; Ji, H.; Lin, Y.; Fei, X.; Bai, X.; et al. Effects of Litter Inputs on N2O Emissions from a Tropical Rainforest in Southwest China. Ecosystems 2018, 21, 1013–1026. [Google Scholar] [CrossRef]
  49. Kooch, Y.; Parsapour, M.K.; Egli, M.; Moghimian, N. Forest floor and soil properties in different development stages of Oriental beech forests. Appl. Soil Ecol. 2021, 161, 103823. [Google Scholar] [CrossRef]
  50. Schmidt, M.W.I.; Torn, M.S.; Abiven, S.; Dittmar, T.; Guggenberger, G.; Janssens, I.A.; Kleber, M.; Koegel-Knabner, I.; Lehmann, J.; Manning, D.A.C.; et al. Persistence of soil organic matter as an ecosystem property. Nature 2011, 478, 49–56. [Google Scholar] [CrossRef] [Green Version]
  51. Yuan, Z.Y.; Chen, H.Y.H. Fine Root Biomass, Production, Turnover Rates, and Nutrient Contents in Boreal Forest Ecosystems in Relation to Species, Climate, Fertility, and Stand Age: Literature Review and Meta-Analyses. Crit. Rev. Plant Sci. 2010, 29, 204–221. [Google Scholar] [CrossRef]
  52. Rowlings, D.W.; Grace, P.R.; Kiese, R.; Weier, K.L. Environmental factors controlling temporal and spatial variability in the soil-atmosphere exchange of CO2, CH4 and N2O from an Australian subtropical rainforest. Glob. Chang. Biol. 2012, 18, 726–738. [Google Scholar] [CrossRef]
  53. Gartner, T.B.; Cardon, Z.G. Decomposition dynamics in mixed-species leaf litter. Oikos 2004, 104, 230–246. [Google Scholar] [CrossRef]
  54. Wei, H.; Man, X. Increased Litter Greatly Enhancing Soil Respiration in Betula platyphylla Forests of Permafrost Region, Northeast China. Forests 2021, 12, 89. [Google Scholar] [CrossRef]
  55. Wu, X.; Zang, S.; Ma, D.; Ren, J.; Chen, Q.; Dong, X. Emissions of CO2, CH4, and N2O Fluxes from Forest Soil in Permafrost Region of Daxing'an Mountains, Northeast China. Int. J. Environ. Res. Public Health 2019, 16, 2999. [Google Scholar] [CrossRef] [PubMed] [Green Version]
  56. Nottingham, A.T.; Turner, B.L.; Stott, A.W.; Tanner, E.V.J. Nitrogen and phosphorus constrain labile and stable carbon turnover in lowland tropical forest soils. Soil Biol. Biochem. 2015, 80, 26–33. [Google Scholar] [CrossRef]
  57. Braker, G.; Conrad, R. Diversity, structure, and size of N2O-producing microbial communities in soils-what matters for their functioning? Adv. Appl. Microbiol. 2011, 75, 33–70. [Google Scholar] [PubMed]
  58. Fan, J.; Xu, Y.; Chen, Z.; Xiao, J.; Liu, D.; Luo, J.; Bolan, N.; Ding, W. Sulfur deposition suppressed nitrogen-induced soil N2O emission from a subtropical forestland in southeastern China. Agr. For. Meteorol. 2017, 233, 163–170. [Google Scholar] [CrossRef]
  59. Lu, X.K.; Vitousek, P.M.; Mao, Q.G.; Gilliam, F.S.; Luo, Y.Q.; Turner, B.L.; Zhou, G.Y.; Mo, J.M. Nitrogen deposition accelerates soil carbon sequestration in tropical forests. Proc. Natl. Acad. Sci. USA 2021, 118, e2020790118. [Google Scholar] [CrossRef]
  60. Sayer, E.J. Using experimental manipulation to assess the roles of leaf litter in the functioning of forest ecosystems. Biol. Rev. 2006, 81, 1–31. [Google Scholar] [CrossRef]
  61. Huang, W.; Spohn, M. Effects of long-term litter manipulation on soil carbon, nitrogen, and phosphorus in a temperate deciduous forest. Soil Biol. Biochem. 2015, 83, 12–18. [Google Scholar] [CrossRef]
  62. Osborne, B.B.; Soper, F.M.; Nasto, M.K.; Bru, D.; Hwang, S.; Machmuller, M.B.; Morales, M.L.; Philippot, L.; Sullivan, B.W.; Asner, G.P.; et al. Litter inputs drive patterns of soil nitrogen heterogeneity in a diverse tropical forest: Results from a litter manipulation experiment. Soil Biol. Biochem. 2021, 158, 108247. [Google Scholar] [CrossRef]
Figure 1. CO2, CH4, and N2O fluxes (FCO2, FCH4, and FN2O) in PF (Masson pine forest) and BF (evergreen broadleaved forest) in different experimental plots from August 2012 to July 2013. Error bar represents one standard error. Different lowercase letters indicates that there are significant differences at p < 0.05 between treatments. LR = litter removal; CT = control; LD = litter doubling; LE = litter exchange.
Forests 13 00544 g001
Figure 2. Contributions (%) of litter-internal (fL-L) and litter-induced (fL-S) to CO2, CH4, and N2O fluxes (FCO2, FCH4, and FN2O) in PF (Masson pine forest) and BF (evergreen broadleaved forest).
Forests 13 00544 g002
Figure 3. Monthly mean amount of surface litter layer and CO2 efflux in PF (Masson pine forest) and BF (evergreen broadleaved forest) from 2003 to 2020. Numbers of observations for each data point are 12 for monthly mean and 6 for wet or dry season. Error bar represents one standard error.
Forests 13 00544 g003
Figure 4. Correlations between monthly mean amount of surface litter and CO2 efflux in PF (Masson pine forest) and BF (evergreen broadleaved forest) (n = 216).
Forests 13 00544 g004
Table 1. Site characteristics and surface litter/mineral soil properties in PF (Masson pine forest) and BF (evergreen broadleaved forest) at the Dinghushan Biosphere Reserve. Data with special character “£”, “&”, and “§” were cited from Ref. [30], Ref. [11], and Ref. [26], respectively.
ParametersVariablesPF BF
Site characteristics Age (year) £80>400
Elevation (m) £200–300220–300
Surface litter C (mg g−1) &523.0 ± 8.0482.0 ± 22.0
N (mg g−1) &9.1 ± 0.817.0 ± 0.9
P (mg g−1) &0.2 ± 0.00.6 ± 0.1
C/N &57.5 ± 3.828.3 ± 2.7
N/P &53.5 ± 2.128.4 ± 3.3
Mineral soil Soil pH £ 4.0 ± 0.13.8 ± 0.1
Soil moisture content (%) £22.4 ± 2.233.5 ± 2.6
Bulk density (g cm−3) §1.4 ± 0.11.0 ± 0.0
Clay content (%) §12.5 ± 0.719.7 ± 0.8
Organic C (g kg−1) §23.9 ± 1.834.5 ± 3.1
Total N (g kg−1) §1.6 ± 0.12.4 ± 0.2
Table 2. Soil temperature (0–5 cm) and moisture (0–10 cm) in PF (Masson pine forest) and BF (evergreen broadleaved forest) exposed to different litter manipulation treatments from August 2012 to July 2013. Data are shown by mean ± se. Different lowercase letters indicate significant differences between treatments in each forest (p < 0.05). LR = litter removal; CT = control; LD = litter doubling; LE = litter exchange.
Forest Type TreatmentSoil Temperature (°C)Soil Moisture (%)
Wet SeasonDry SeasonAnnual MeanWet SeasonDry SeasonAnnual Mean
PFLR25.1 ± 0.8 a15.3 ± 0.9 a20.3 ± 1.2 a15.4 ± 0.9 b10.1 ± 0.5 b13.0 ± 0.7 b
CT24.0 ± 1.4 a15.9 ± 1.6 a19.9 ± 1.6 a22.2 ± 0.8 a14.2 ± 1.1 a18.2 ± 1.4 a
LD23.8 ± 1.7 a15.6 ± 0.7 a19.5 ± 1.1 a23.4 ± 0.9 a15.0 ± 1.3 a17.7 ± 1.7 a
LE22.7 ± 1.5 a16.3 ± 1.4 a18.7 ± 0.6 a22.6 ± 0.5 a14.8 ± 0.8 a18.9 ± 0.3 a
BFLR23.3 ± 0.9 a18.2 ± 1.2 a19.8 ± 0.8 a26.9 ± 1.1 a21.5 ± 0.7 a23.8 ± 0.6 a
CT23.5 ± 1.1 a17.1 ± 1.3 a20.3 ± 1.3 a27.2 ± 0.8 a20.9 ± 0.8 a24.1 ± 1.1 a
LD23.4 ± 1.5 a16.7 ± 0.3 a20.9 ± 1.6 a27.8 ± 1.2 a22.5 ± 1.6 a24.3 ± 0.9 a
LE24.1 ± 0.7 a17.6 ± 0.8 a19.5 ± 1.1 a26.8 ± 0.5 a21.3 ± 1.4 a23.7 ± 1.6 a
Table 3. Soil microbial phospholipid fatty acids (PLFAs) content (ng g−1) in PF (Masson pine forest) and BF (evergreen broadleaved forest) exposed to different litter manipulation treatments from August 2012 to July 2013. Data are shown by mean ± se. Different lowercase letters indicate significant differences between treatments in each forest (p < 0.05). LR = litter removal; CT = control; LD = litter doubling; LE = litter exchange; G+ =gram-positive bacteria; G = gram-negative bacteria; ACT = Actinomycetes.
Forest Type TreatmentBacteriaFungiG+GACT
PFLR825.3 ± 55.2 b193.4 ± 27.6 b428.1 ± 27.6 b383.4 ± 41.4 b193.4 ± 27.6 a
CT1227.2 ± 124.3 a287.8 ± 37.8 a667.4 ± 78.3 a547.2 ± 55.2 a196.8 ± 41.4 a
LD1266.0 ± 193.4 a294.6 ± 56.7 a685.5 ± 96.7 a593.9 ± 61.3 a221.5 ± 23.0 a
LE1473.2 ± 188.7 a359.1 ± 46.0 a779.2 ± 101.3 a662.9 ± 82.9 a210.8 ± 46.0 a
BFLR1528.7 ± 104.5 b321.8 ± 60.3 b774.4 ± 70.4 b744.3 ± 130.2 a297.3 ± 55.3 a
CT1569.0 ± 141.4 b352.0 ± 51.3 b824.7 ± 90.5 b754.3 ± 171.0 a301.2 ± 47.2 a
LD2293.1 ± 202.3 a593.0 ± 72.4 a1377.3 ± 111.1 a1035.9 ± 181.0 a332.0 ± 69.3 a
LE2285.9 ± 231.9 a604.0 ± 100.6 a1318.7 ± 150.9 a1057.2 ± 171.0 a346.2 ± 78.4 a
Publisher’s Note: MDPI stays neutral with regard to jurisdictional claims in published maps and institutional affiliations.

