Article

Bulk Density of Shrub Types and Tree Crowns to Use with Forest Inventories in the Iberian Peninsula

1
Centre for Applied Ecology “Professor Baeta Neves” (CEABN), InBIO, School of Agriculture, University of Lisbon, Tapada da Ajuda, 1349-017 Lisbon, Portugal
2
Department of Physics, NOVA School of Science and Technology, NOVA University Lisbon, 2829-516 Caparica, Portugal
3
Subdirección General de Política Forestal y Lucha Contra la Desertificación, Ministerio para la Transición Ecológica y el Reto Demográfico, 28071 Madrid, Spain
4
INIA, CSIC, Departamento Selvicultura y Gestión de Sistemas Forestales, Ctra. La Coruña, Km. 7.5, 28040 Madrid, Spain
5
Centro de Investigación Forestal de Lourizán, Estrada Pontevedra-Marín, Km. 4, 36153 Pontevedra, Spain
*
Author to whom correspondence should be addressed.
Forests 2022, 13(4), 555; https://doi.org/10.3390/f13040555
Submission received: 19 January 2022 / Revised: 24 March 2022 / Accepted: 29 March 2022 / Published: 31 March 2022
(This article belongs to the Section Forest Ecology and Management)

Abstract

:
Bulk density for shrubs and tree crowns is an important variable, useful for many purposes, namely estimations for biomass and carbon sequestration and potential fire behavior prediction. In the latter case, bulk density is required to predict the rate of spread and intensity of crown fires. However, bulk density information is scarce. The estimation of bulk density is crucial to help choosing proper pyrosilviculture options to decrease fire susceptibility. Due to the similar environmental conditions and fuel characteristics in Portugal and Spain, we modelled bulk density for the most common woody species in all the Iberian Peninsula. We used 10 different shrub type formations and a set of tree species or groups common to both countries. Equations for bulk density, in both forest canopy and understory layers, were fitted as a function of biometric variables commonly used in forest inventories for the selected species. Standardized estimates of bulk density can be associated with data from the National Forest Inventories from Portugal and Spain, to estimate biomass of the forest ecosystems and to evaluate potential fire behavior involving tree canopies and shrubs.

1. Introduction

Forest structure has an important influence on the rate of spread and intensity of wildfires. National forest inventories (NFIs) are essential sources of forest information, providing thorough and accurate information on forest stands characteristics over large areas. NFIs in Portugal and Spain started in 1965 and periodically cover their entire territory. These instruments provide information on the species composition of different vegetation layers (vertical structure) including understory characteristics [1]. This information is key for characterizing fuel in each vegetation type and for predicting the behavior of a wildfire. Vertical structure is also essential for classifying and identifying forest types [2], evaluating ecosystem services and assisting on the estimation of the chemical components of the system, including volatile organic compounds. It is therefore important to have information on forest vertical structure for specific variables such as species biomass, leaf area index and bulk density.
The Iberian Peninsula faces a major problem every year due to wildfires; they affect not only the economy and social sectors but also biodiversity, conservation and ecological aspects due to their severity, frequency and extent [3,4,5,6]. Wildfires have become in the last decades one of the main environmental problems and one of the most important natural hazards in Spain and Portugal [7]. The necessity of improving national fire management systems is apparent in both countries in order to reduce the high severity area burned in the Iberian Peninsula [7,8]. The burn probability of these countries’ forests is expected to be influenced by forest composition and structure [9,10]. Characterization of the structural vegetation components and fuel loading is essential for fire hazard assessment [11] and for potential fire behavior models implemented in decision support systems for fire management [12,13,14]. To predict the behavior of a potential fire burning through different plant communities it is important to know the mass of fuel per unit volume, or the bulk density of the various vegetation components, from tree canopies to understory layers. Despite this, Botequim et al. [13] pointed out that the consideration of shrub biomass in forest planning has been hindered by the inability to predict its growth and accumulation, which is information that could assist in forecasting biomass and carbon storage dynamics. Changing this situation is imperative because shrubs are an important component of Mediterranean ecosystems and should be considered in forest management, particularly in fire risk mitigation plans. In Portugal shrublands comprise about 31% [15] of the land and in Spain around 19% [16].
The estimation of bulk densities is applied in several fields, such as in biomass estimations for energy use, carbon sequestration estimations or potential fire behavior predictions [17,18], allowing, for e.g., the prediction of the rate of spread and intensity of a surface or crown fire, fuel consumption or carbon emissions. Generically, the bulk density of a canopy layer is the mass of canopy fuel per unit of canopy volume [17,19], including empty spaces. Canopy fuel is the fine fuel which would be consumed in the flaming front of a fully active crown fire; the same applies to the shrub layer.
The importance of the Canopy Layer Bulk Density (CLBD) in determining the possibility and spread of crown fires was first highlighted by Van Wagner [17] for pine forests in Canada. He established the concept of a critical mass flow rate, under which the fire is too slow or the canopy insufficiently dense to allow the fire to spread through the crowns. The critical mass flow rate was estimated by Van Wagner [17] to be around 0.05 kg m−2 s−1, a value close to those estimated by Thomas [20] in experimental fuel beds. This concept shows that crown fires depend on fire rate of spread (determined mostly by wind) but also on the CLBD. On an operational approach, Alexander et al. [21] suggested that above a value of 0.1 kg m−3, active crowning is likely if crowns are ignited. The relevance of these findings is in their possible operational use in forest management, particularly in thinning [22], reducing the proximity of the crowns and thus the risk of active crown fires. The same rationale can be applied for fire propagation in the shrub layer [23,24,25].
Quantitative information on bulk density variables and on how to estimate them is lacking [12]. Direct measurement is difficult and time consuming [11,26,27,28] because it requires destructive sampling of the vertical distribution of fuel. Bulk density is usually estimated from instrument based optical techniques [29] or from inventory-based methods [12] and, more recently, with other methods such as air-borne lidar [30,31,32,33,34,35], radar remote sensing [36] or spectral indexes from remote sensing [37].
Due to similar environmental conditions and fuel characteristics in Portugal and Spain, standardized estimation of bulk densities for Iberian Peninsula would be helpful to support forest and fire management and planning. The development of allometric equations for bulk density estimation, both for understory shrubs and for tree canopies, can support the assessment of fuel hazard and fire behavior characteristics in the Iberian Peninsula forests.
Assessing bulk density of tree canopies and understory shrubs requires data that are possible to obtain or derive from NFIs, and other data that complement NFIs information. The first data group refers to the vertical structure or the volume of the different fuels for the various strata. From NFIs we can directly assess or estimate mean stand structural variables such as Crown Length (CL), Shrub Height (SH), Fraction Cover of the Canopy Layer (FCCL) and Fraction Cover of the Shrub Layer (FCSL). However, these variables are not sufficient for many applications involving biomass and fuels, therefore requiring supplementary information on bulk densities of tree canopies and shrub stands [12,38]. The second data group is only possible to obtain through specific research work or literature review.
In this study, we developed allometric equations for predicting the bulk density of individual shrubs and tree crowns from easily measurable descriptors. The equations were based on the most representative vegetation types (including trees and shrubs) and common groups of the Iberian Peninsula. With this information, we provide a simple approach to estimate bulk densities for forest canopies and for shrub layers to use in stands with tree and shrub species commonly associated with the NFIs data in the Iberian Peninsula.

2. Materials and Methods

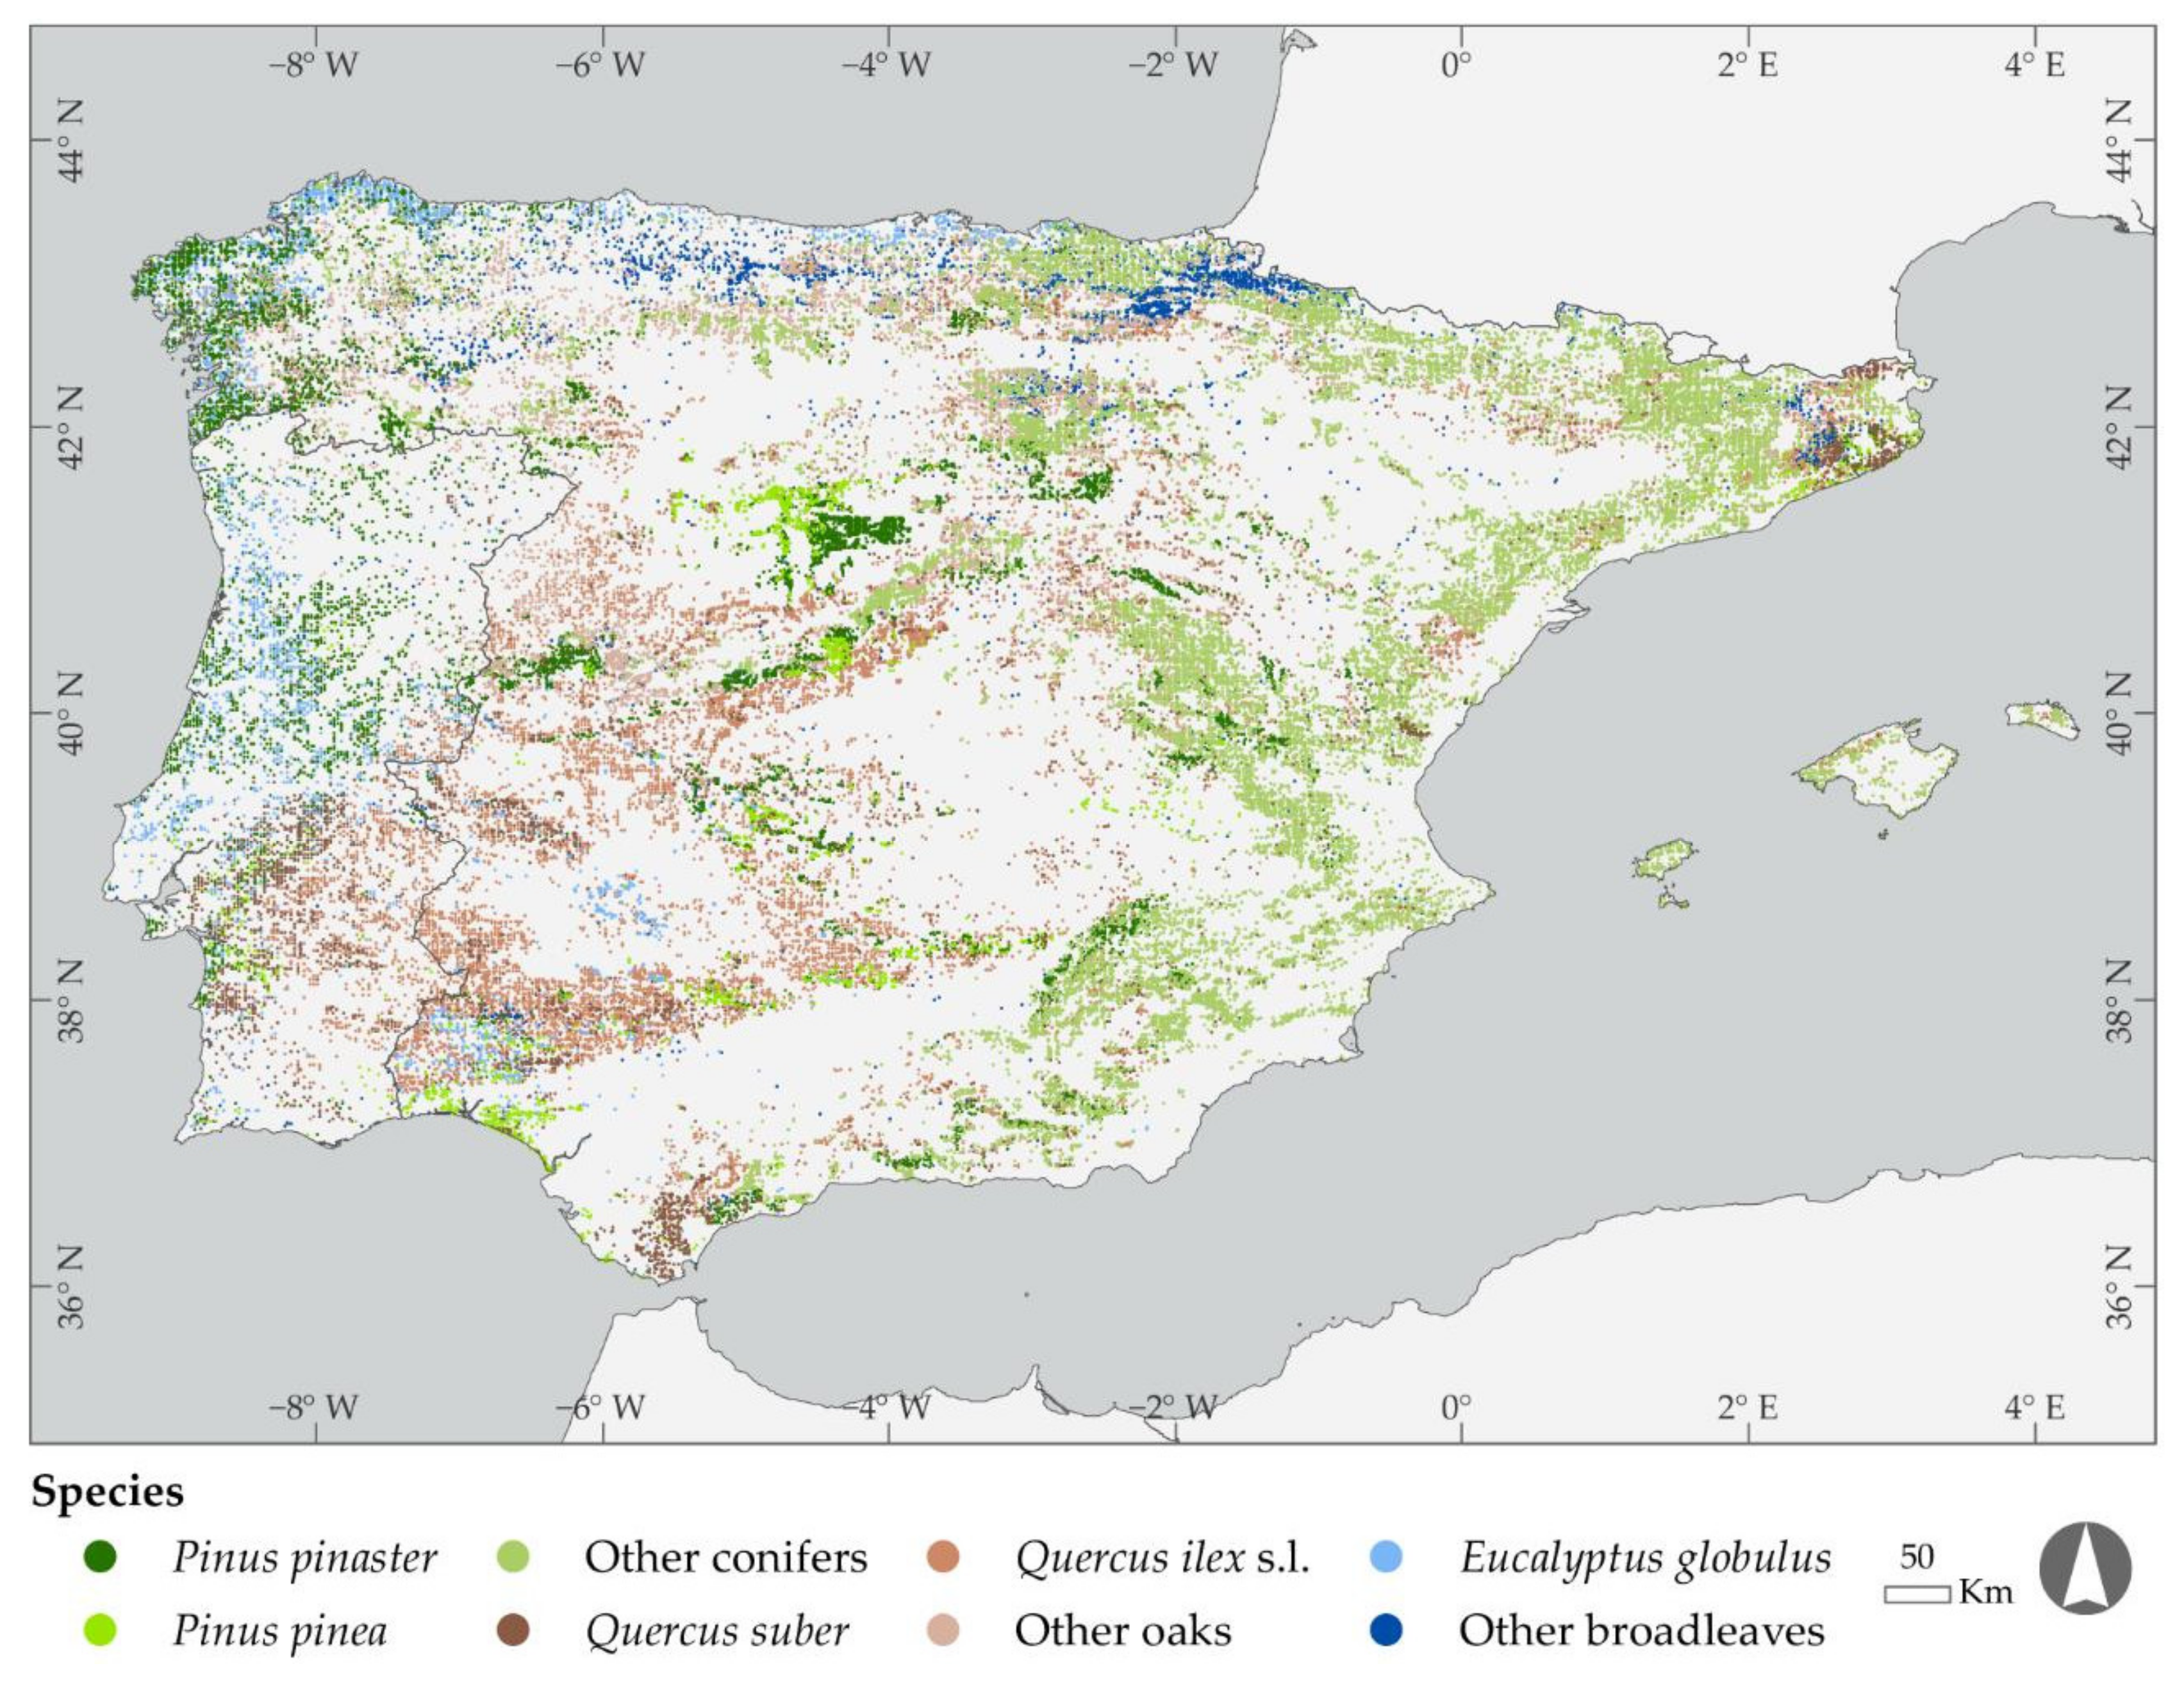
2.1. Establishing Common Groups of Trees and Shrub Species for the Iberian Peninsula

The dataset used for this study consist of observations for 57,550 sample plots from the Third Spanish National Forest Inventory (SNFI3) covering all forest of the mainland and the Baleares islands [39], and 4875 sample plots from the Fifth Portuguese National Forest Inventory (PTNFI5) which covers the entire mainland territory [40]. These sample plots are distributed throughout the Iberian Peninsula.
The SNFI3 has established permanent sample plots at the nodes of a 1-km × 1-km grid and was conducted between 1997 and 2007 [1]. Shrub attributes were measured for circular, 10 m radius, sample plots. The SNFI3 visually assesses mean height (h) and cover for each shrub species using a percentage scale with 1% interval widths. The Spanish NFI shrub assessment is based on shrub taxa lists defined using criteria based mainly on shrub dominance in the defined NFI forest stratum [1]. However, there are also minor species selected as bioindicators or key species (Table S1). The PTNFI5 has established permanent location plots at the nodes of a 2-km × 2-km grid and was conducted between 2005 and 2006. Shrub attributes were measured for circular, 10 m radius, sample plots.
A common designation of species or group of species in the Iberian Peninsula was developed by comparing tree and shrub species (or group of species) present in Portuguese and Spanish NFIs.
For trees, this process resulted in a final set of 12 types of canopies based on the dominant tree species or group of species (Table S2): Pinus pinaster Aiton, Pinus pinea L., Pinus halepensis Mill., Pinus sylvestris L., other conifers, Eucalyptus spp., Quercus suber L., Quercus ilex L. s.l., Quercus pyrenaica Willd., other oaks, Castanea sativa Mill. and other broadleaves. The nomenclature of species follows Flora Iberica [41].
A similar process was taken for shrub (and grass) species, based on previous works [42], and consistent with the PTNFI5 [43] and the SNFI3 and Spanish Forest Map (SFM25) [42] hierarchical categorization. The SFM25 data model is hierarchical, disaggregating the different forestry land uses according to the Spanish NFI, classifying the structural type and percentage cover of the dominant vegetation. The spatial unit used is the tessella, in which the territory is an ecological homogeneous space occupied by its specific natural vegetation [44,45]. The matching of species from both NFIs led to the definition of 14 grass and shrub types identified by codes according to the SFM25 species categorization. Overall, the shrub species or group of species present in the two countries NFIs are representative of the Mediterranean flora. Species such as Pterospartum tridentatum and gorse (Ulex spp.) shrublands are particularly important for fire management activities due to their fuel characteristics, and have been addressed within fuel and fire behavior modelling in Portugal [25] and Spain [46]. Some shrub types, such as “Kermes oak, thicket of mastic trees” and “Big size Cistaceae shrubs”, include the same plant species in both countries. However, species within other shrub types are specified in more detail in the Spanish NFI than in the Portuguese NFI, e.g., “Heathers, Ericaceae shrubs and related groups” and “Mixture of broom leguminous shrubs”. Considering the shrub classes proposed by Pasalodos-Tato et al. [27], we adopted 10 shrub types common to both countries (Table S1). The 10 shrub types are (i) Machias, terebinths, garrigues (140, 150 and 160); (ii) Quercus coccifera and Pistacia lentiscus (170 and 180); (iii) Heathers, Ericaceae shrubs and related groups (210); (iv) Small size Cistaceae shrubs (220a); (v) Big size Cistaceae shrubs (220b); (vi) Mixture of broom leguminous shrubs (230); (vii) Ulex spp. shrubs and related groups (240); (viii) Rosmarinus officinalis (250a); (ix) Lavandula spp., Rosmarinus officinalis, Thymus spp. shrubland and Phlomis purpurea (250b); (x) Ampelodesmos spp. and other grasses (34).

2.2. Methods for Estimating Bulk Densities from Individual Shrubs and Trees to Shrubs Formations and Forest Canopies

The biomass of individual shrubs or individual tree crowns divided by their occupied volume is their bulk density, here termed Shrub Bulk Density (SBD) or tree Crown Bulk Density (CBD), respectively. SBD and CBD are specific for given species or group of similar species. However, bulk density can also be defined at the plot or stand levels. The stand level is generally defined at the plot scale where individual plots are measured for percentage vegetation cover by layer. For the two layers, this results in the estimation of a Shrub Layer Bulk Density (SLBD) and a Canopy Layer Bulk Density (CLBD). SBD and SLBD are only equal if shrub cover is total, i.e., when the Fraction Cover of the Shrub Layer (FCSL) is 1. Similarly, CBD and CLBD are only equal when the forest canopy cover is total, or the Fraction Cover of the Canopy Layer (FCCL) is 1. This terminology is not always clear, as CBD is often used for both tree and canopy bulk densities. In this study, we used the variables according to Figure 1, as follows: Tree Crown Bulk Density (CBD) and Shrub Bulk Density (SBD) are properties of specific species or group of species. Tree Canopy Layer Bulk Density (CLBD) and Shrub Layer Bulk Density (SLBD) are stand properties that depend on bulk densities of tree crowns and the vegetation growing under the tree canopy forming the understory layer, respectively. In Mediterranean climates, the understory is commonly composed of woody shrub vegetation (shrubs). Finally, both bulk densities at stand level also depend on their respective Fraction Cover in the stand (FCCL and FCSL).

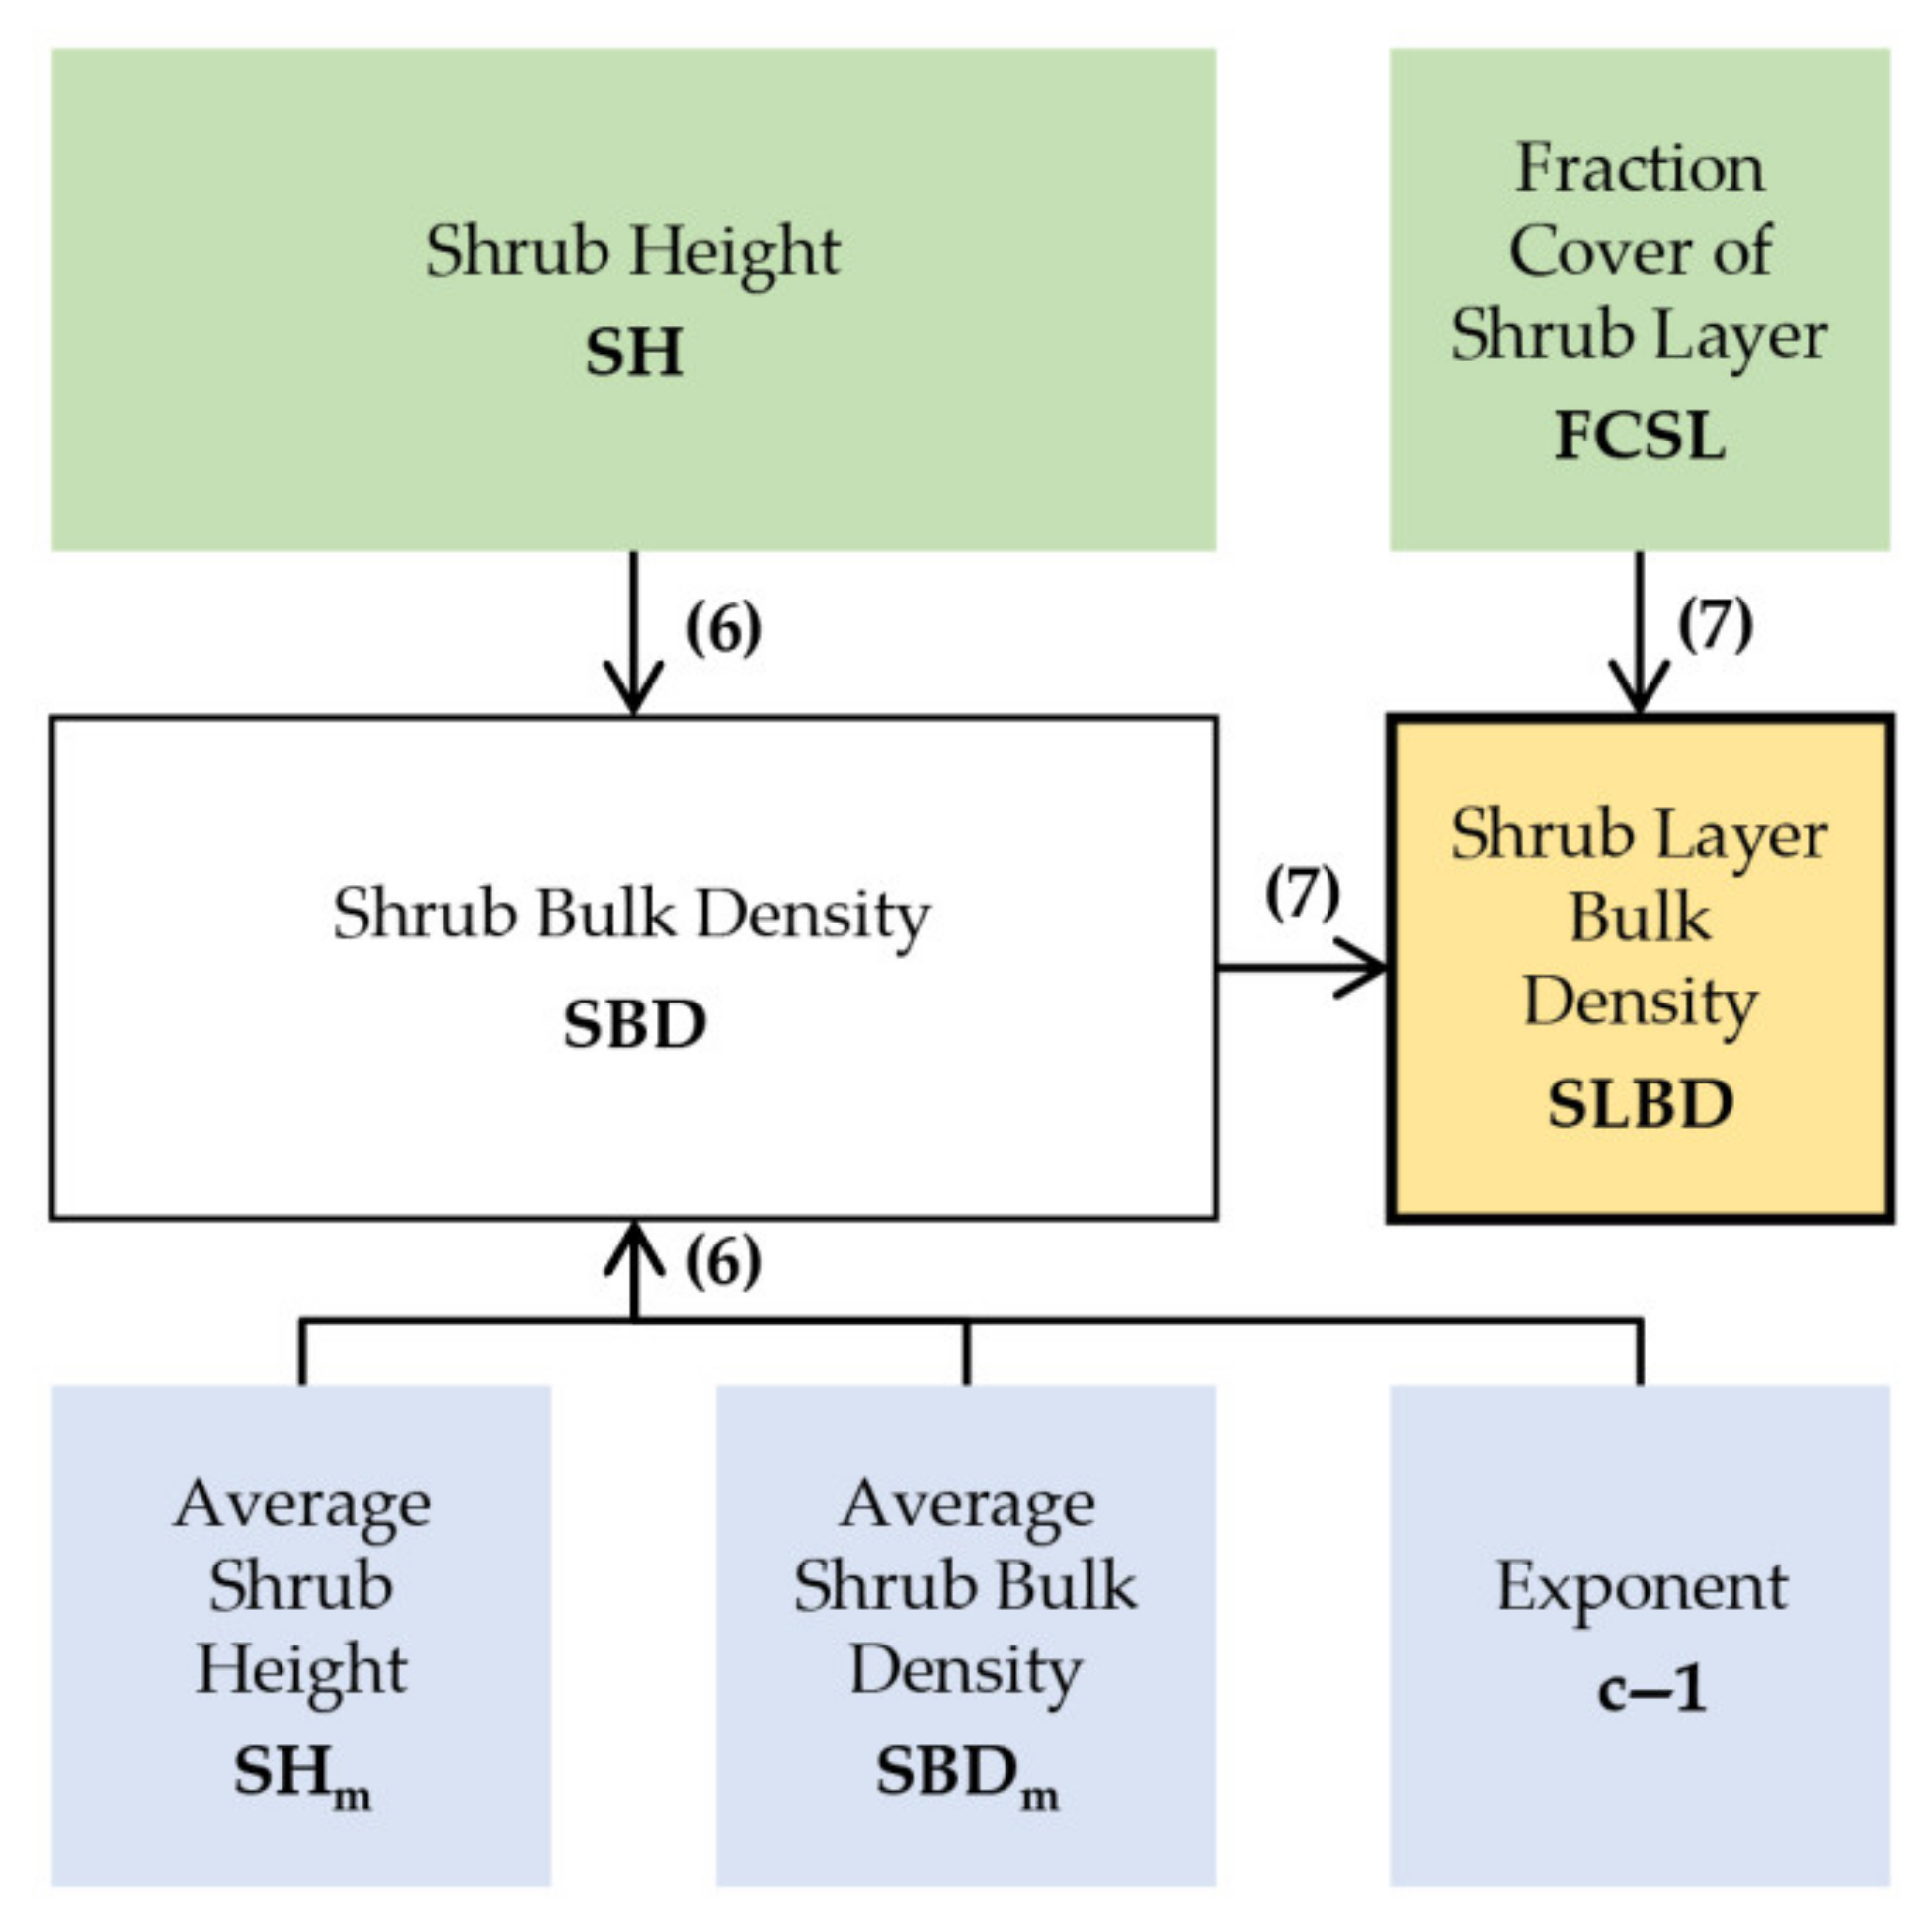
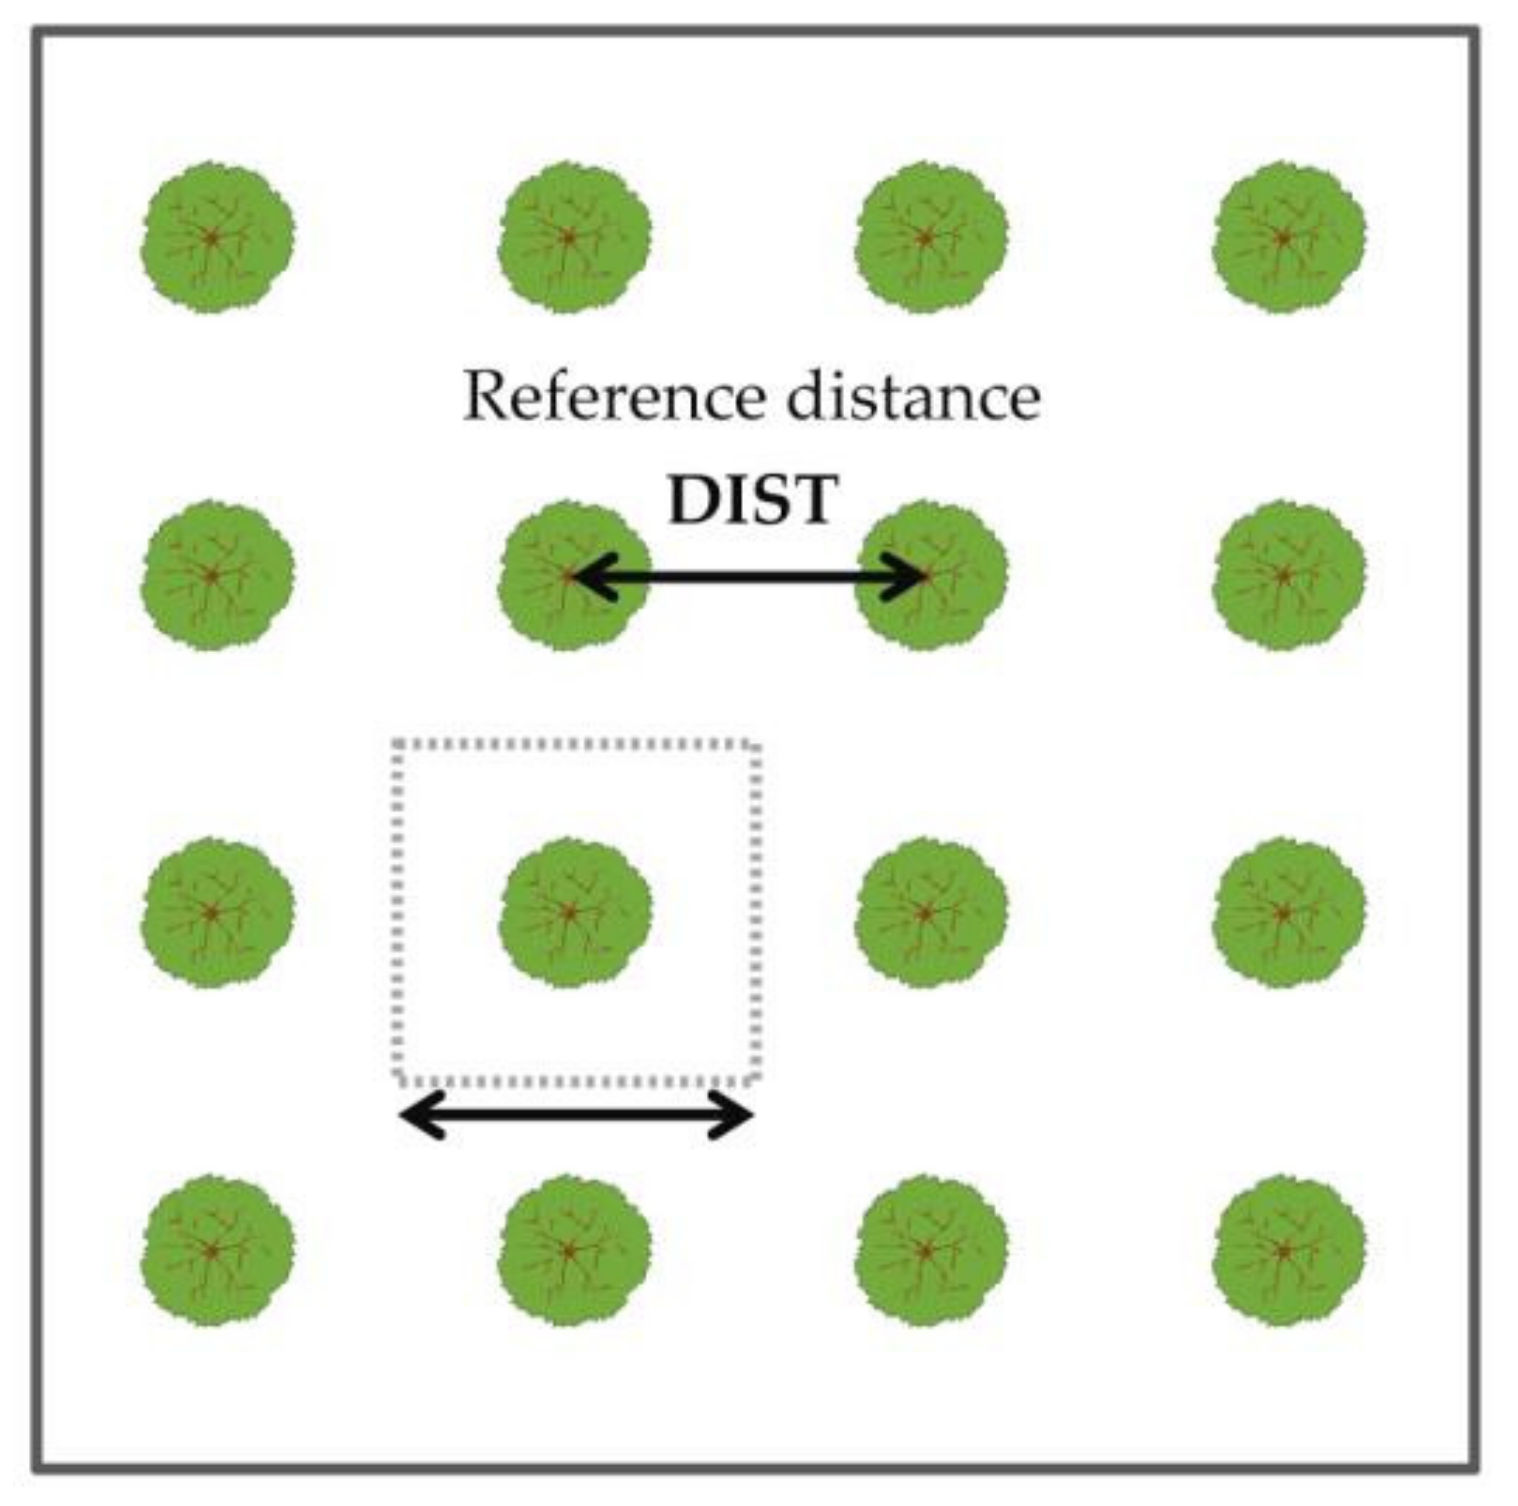
2.3. Estimating Bulk Densities for Shrubs and Shrub Layers

Pasalodos-Tato et al. [27] fitted the following equation to estimate fuel load (W) from shrub height (SH) and fraction cover of the shrub layer (FCSL) in Spain:
ln W = a 0 + a 1 ln S H + a 2 ln a r c s i n s q r t F C S L
where W is in units of ton ha−1 and a0, a1, and a2 are coefficients of the model.
Equation (1) does not allow a straightforward calculation of bulk density. However, the very extensive database based on 709 plots subdivided in 10 different shrub formations [27] is ideal to provide estimates of bulk density using other equation forms.
We used the database and the results of [27] to develop simpler equations to estimate bulk density for the 10 shrub types indicated in Table S1. For each measured plot, the database includes the biomass dry weight per unit area (W), the fraction of shrub cover (FCSL) and shrub height (SH). The first model used was based on the simple assumption that the fuel load, or biomass per unit area (W) of a certain shrub layer was only dependent on the product of its cover (FCSL) by its height (SH). The fitted equation was a simple multiplication model:
W = S B D · S H · F C S L ,   or     S B D = W F C S L · S H
where W = fuel load (kg m−2), SBD = Shrub Bulk Density (kg m−3), FCSL = fraction cover of the shrub layer (proportion), SH = shrub height (m).
This first approach is too simplistic, as we know that allometric scaling laws characterize all organisms [47] and the relations between biological variables are typically nonlinear. In particular, the relation between biomass and height is expected to follow an allometric equation, as the rate of accumulation of biomass through time is not necessarily the same as the rate of height growth. Therefore, a more general equation was used:
W = b · F C S L · S H c
The values of b and c were then adjusted for each of the 10 shrub types. The coefficient c allows for the flexibility of the model. When c = 1 , Equation (3) reduces to Equation (2), and b = S B D is therefore an estimate of SBD.
However, when c 1 , the fitted value of b cannot be simply interpreted as an estimate of the mean bulk density. Therefore, we may modify the equation to generate a more interpretable model. We can then rewrite Equation (3) and, as from Equation (2), S B D = W F C S L . S H , we can derive Equation (4):
W = b · F C S L · S H · S H c 1 ,     o r   S B D = W F C S L · S H = b · S H c 1
We can now use Equation (4) to estimate a reference value for mean Shrub Bulk Density ( S B D ¯ ) associated to a mean observed Shrub Height ( S H ¯ ). This is simply calculated as:
S B D ¯ = b · S H ¯ c 1
where S B D ¯ = estimated mean Shrub Bulk Density (kg m−3), S H ¯ = observed mean height of shrubs measured in the plots (cm).
Combining and rearranging Equations (4) and (5), we obtain:
S B D = S B D ¯ S H S H ¯ c 1
This shows the dependency of SBD on SH. As S H S H ¯ is dimensionless, the units of height (SH) should be the same as those of S H ¯ .
Equation (6) is based on parameters that are easily computed or understandable: S B D ¯ is a mean value for SBD (corresponding to mean Shrub Height S H ¯ ) and c 1 is the exponent related to the dependency of SBD on SH.
If c 1 = 0 , there is no dependency and mean Shrub Bulk Density ( S B D ¯ ) can be applied to all shrub heights;
if c 1 > 0 , shrub heights (SH) above the mean height S H ¯ have higher values of bulk density SBD than average shrubs;
and if c 1 < 0 , lower shrubs have higher bulk density.
The Shrub Layer Bulk Density (SLBD) can then be easily computed (7) as the product of Shrub Bulk Density (SBD) and the Fraction Cover of the Shrub Layer (FCSL):
S L B D = S B D · F C S L
Figure 2 presents a scheme of how the estimated SLBD relates to the different variables.

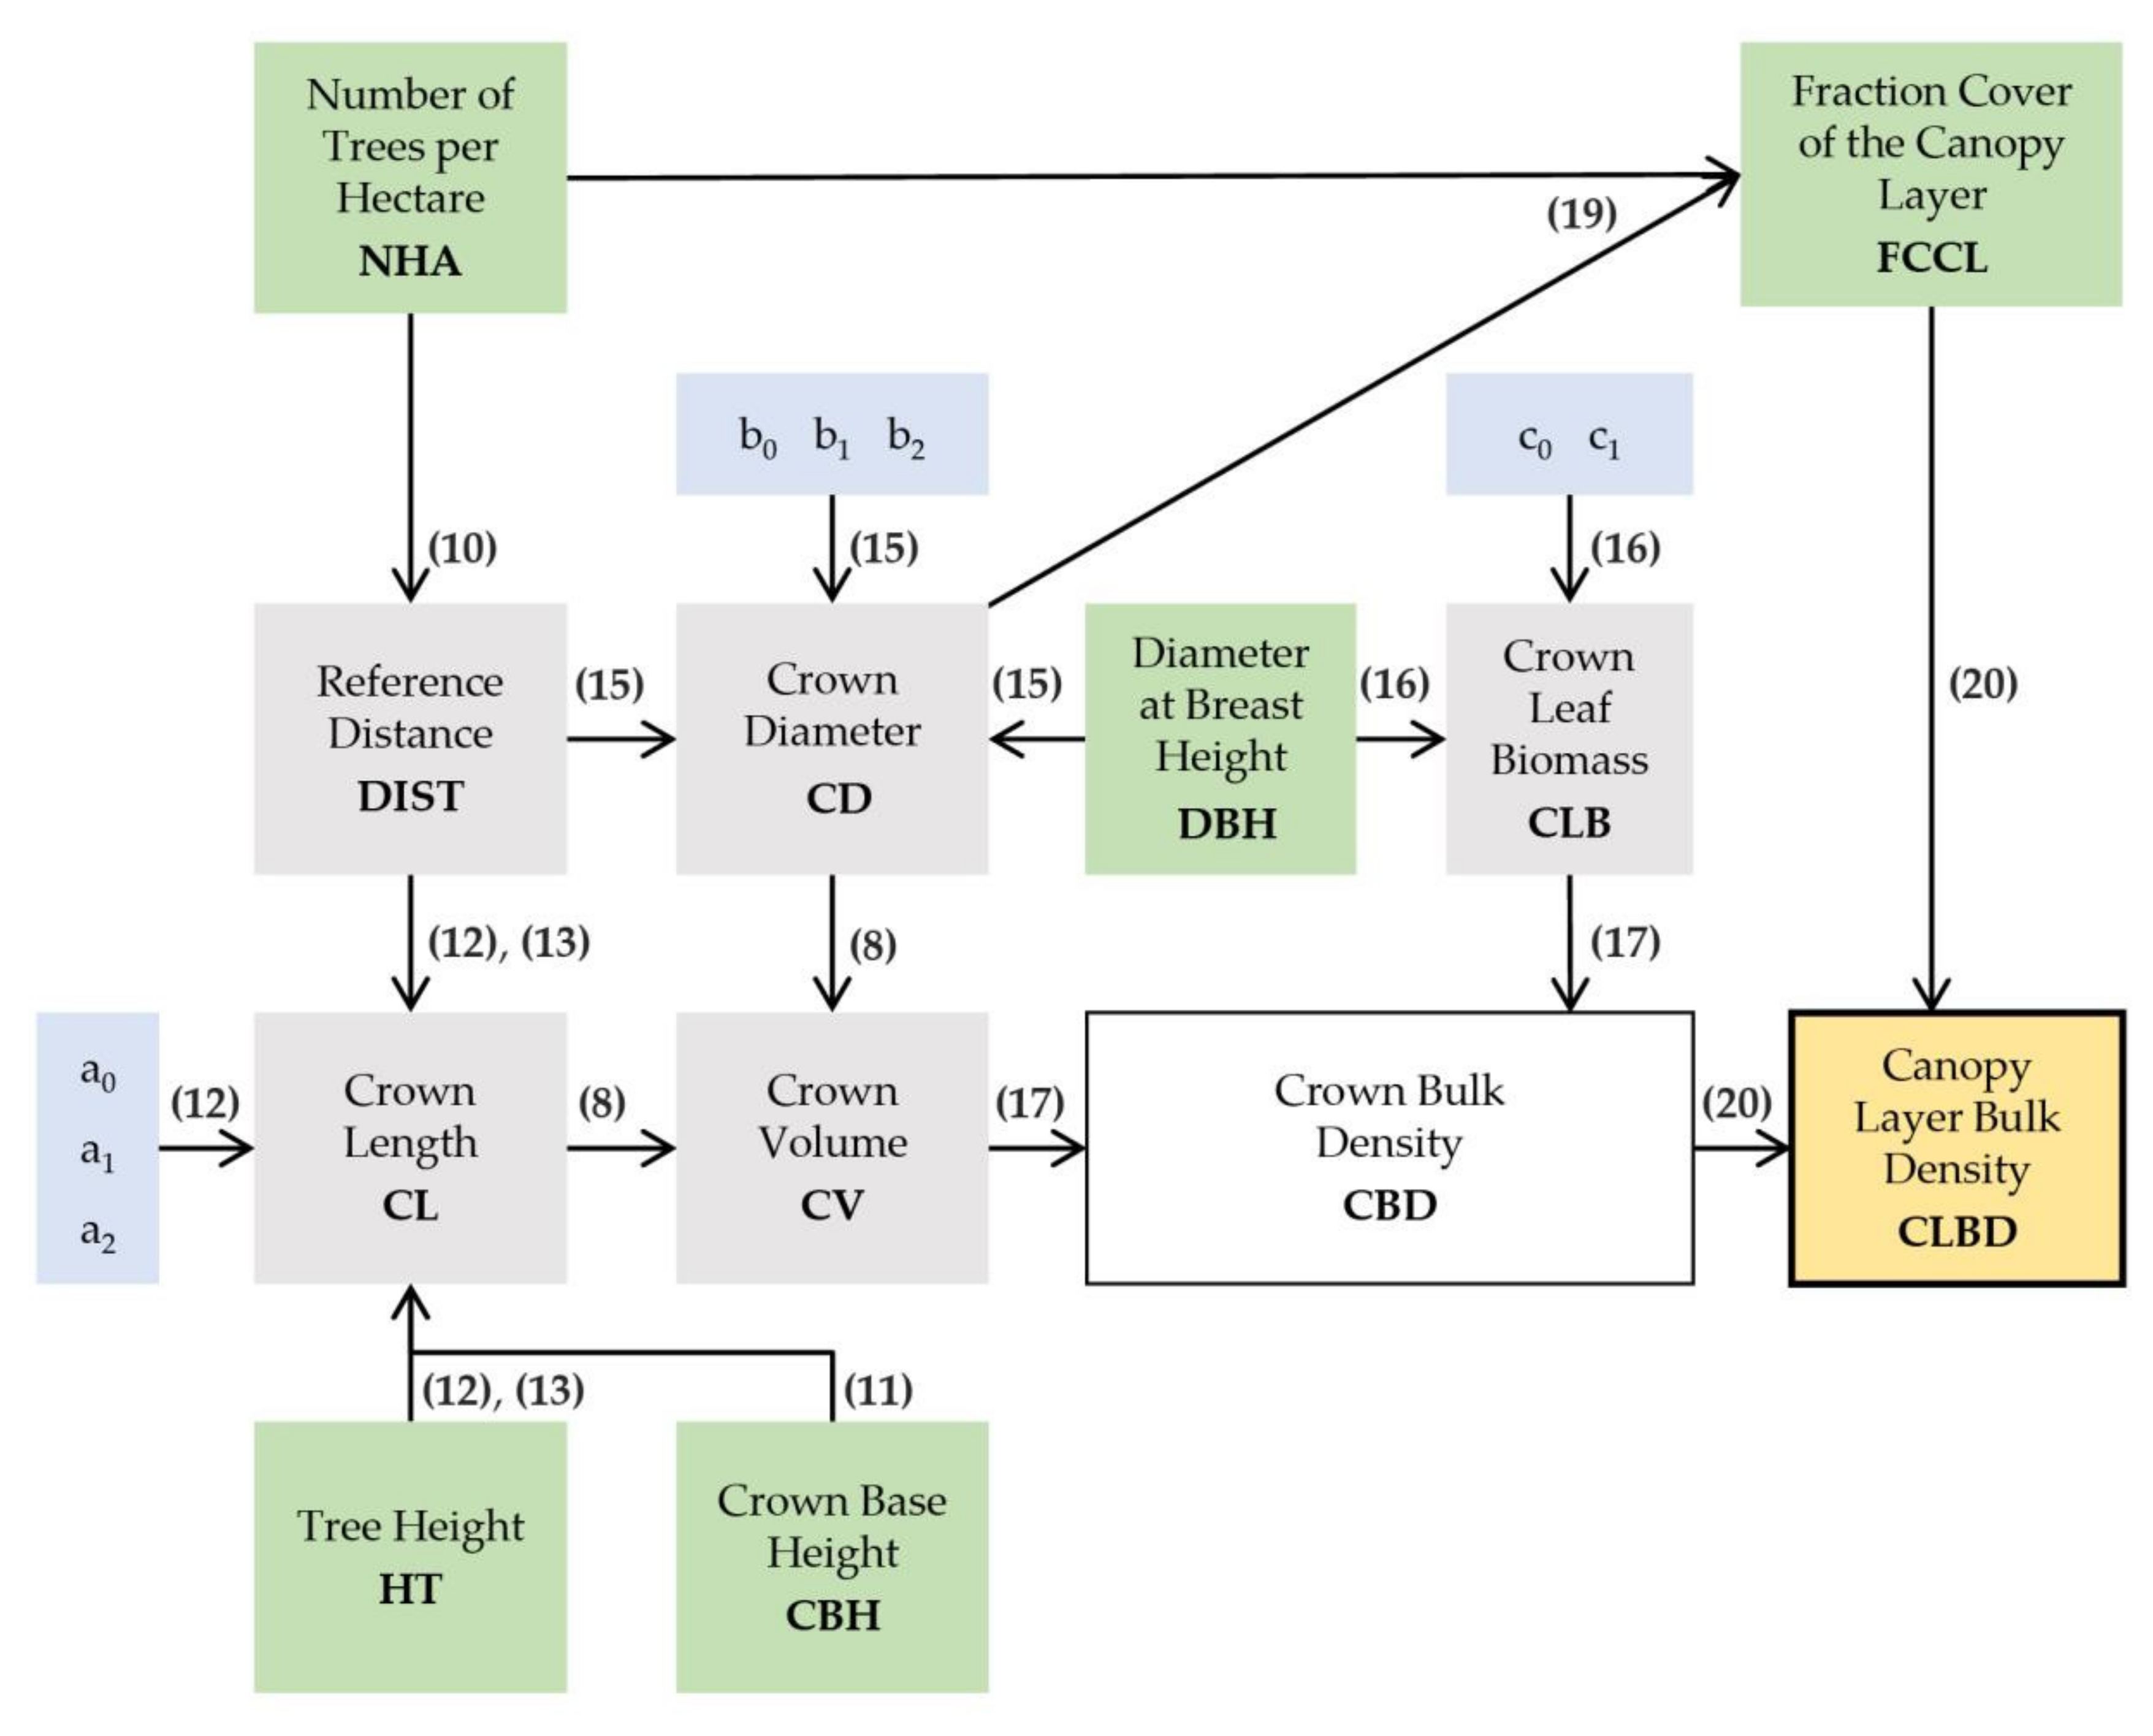
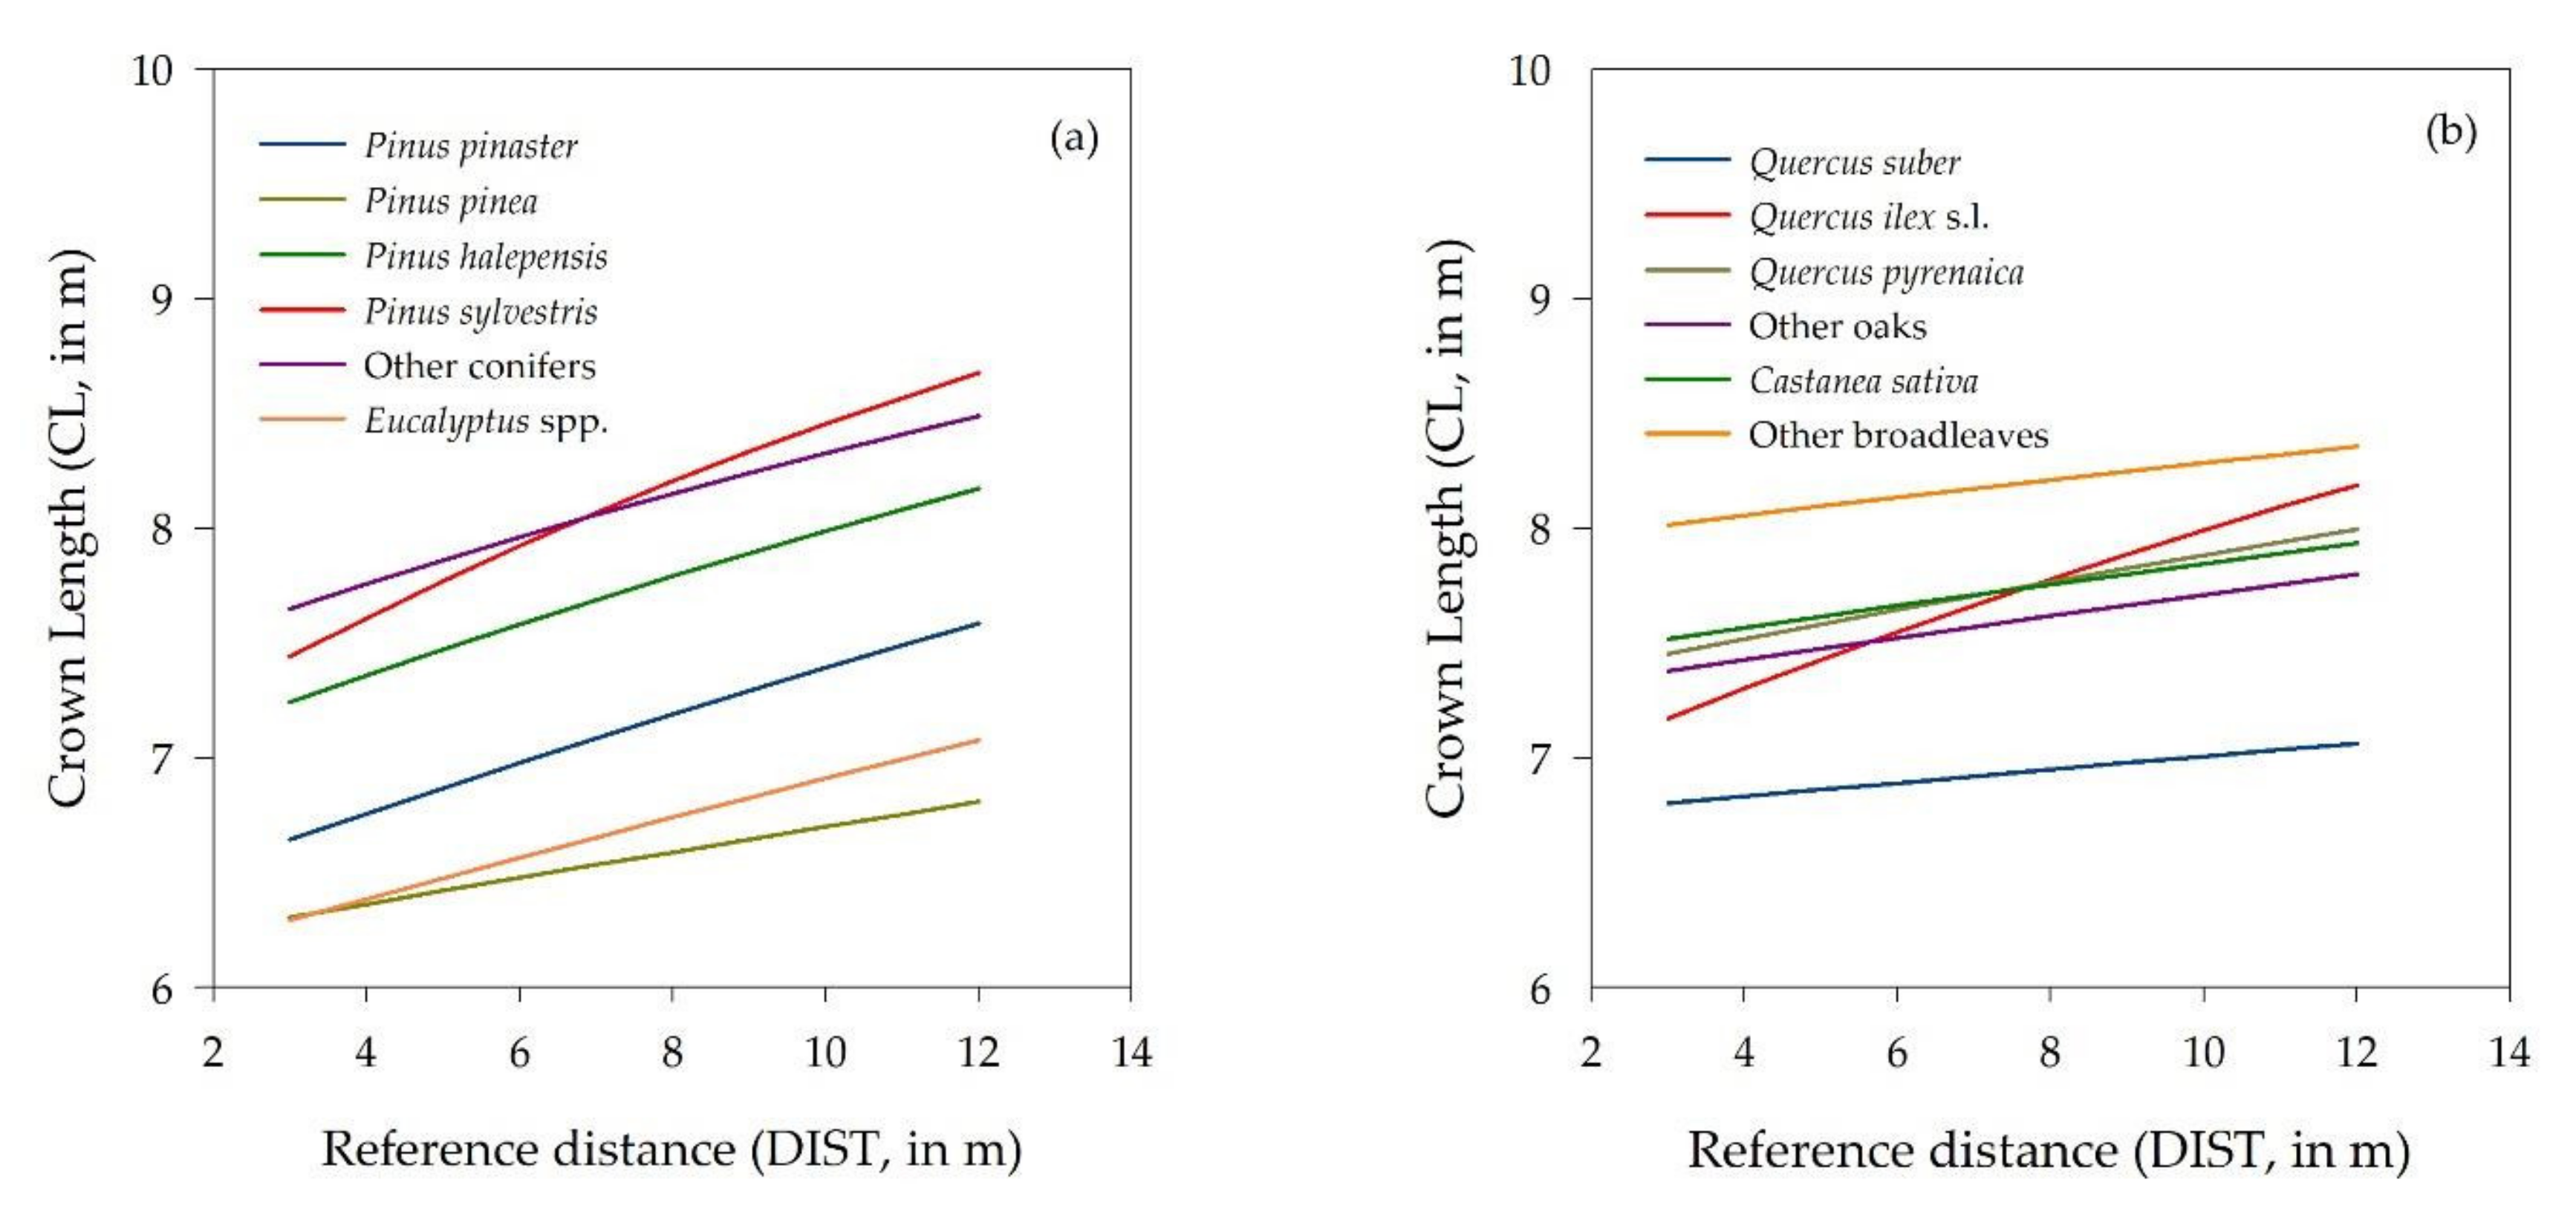
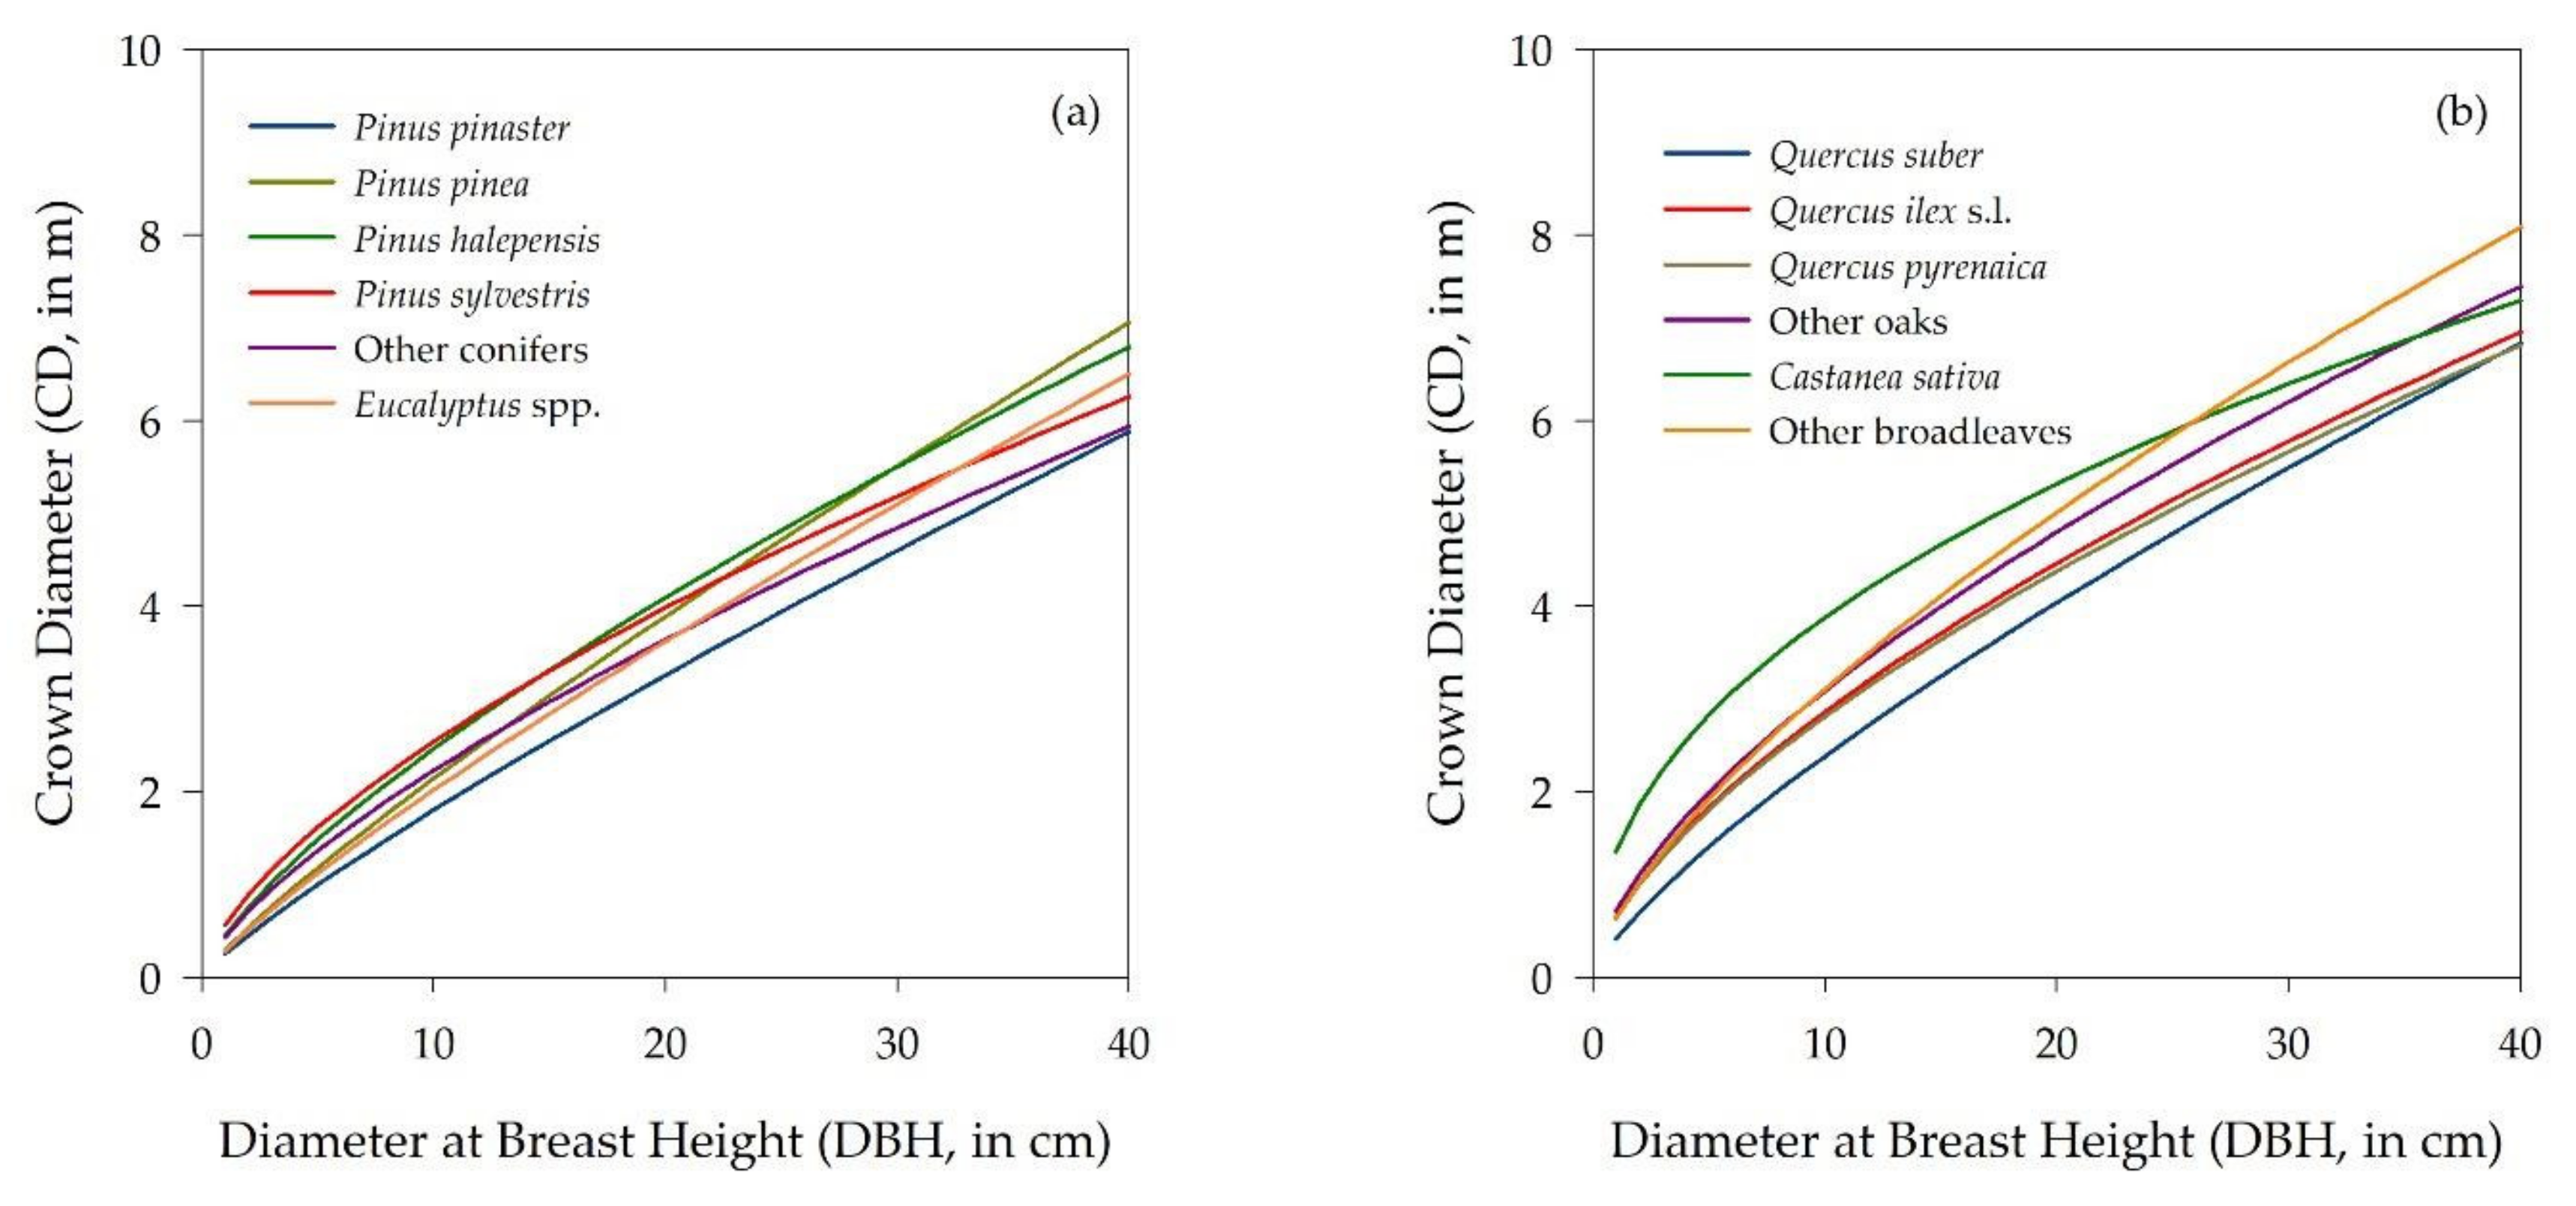
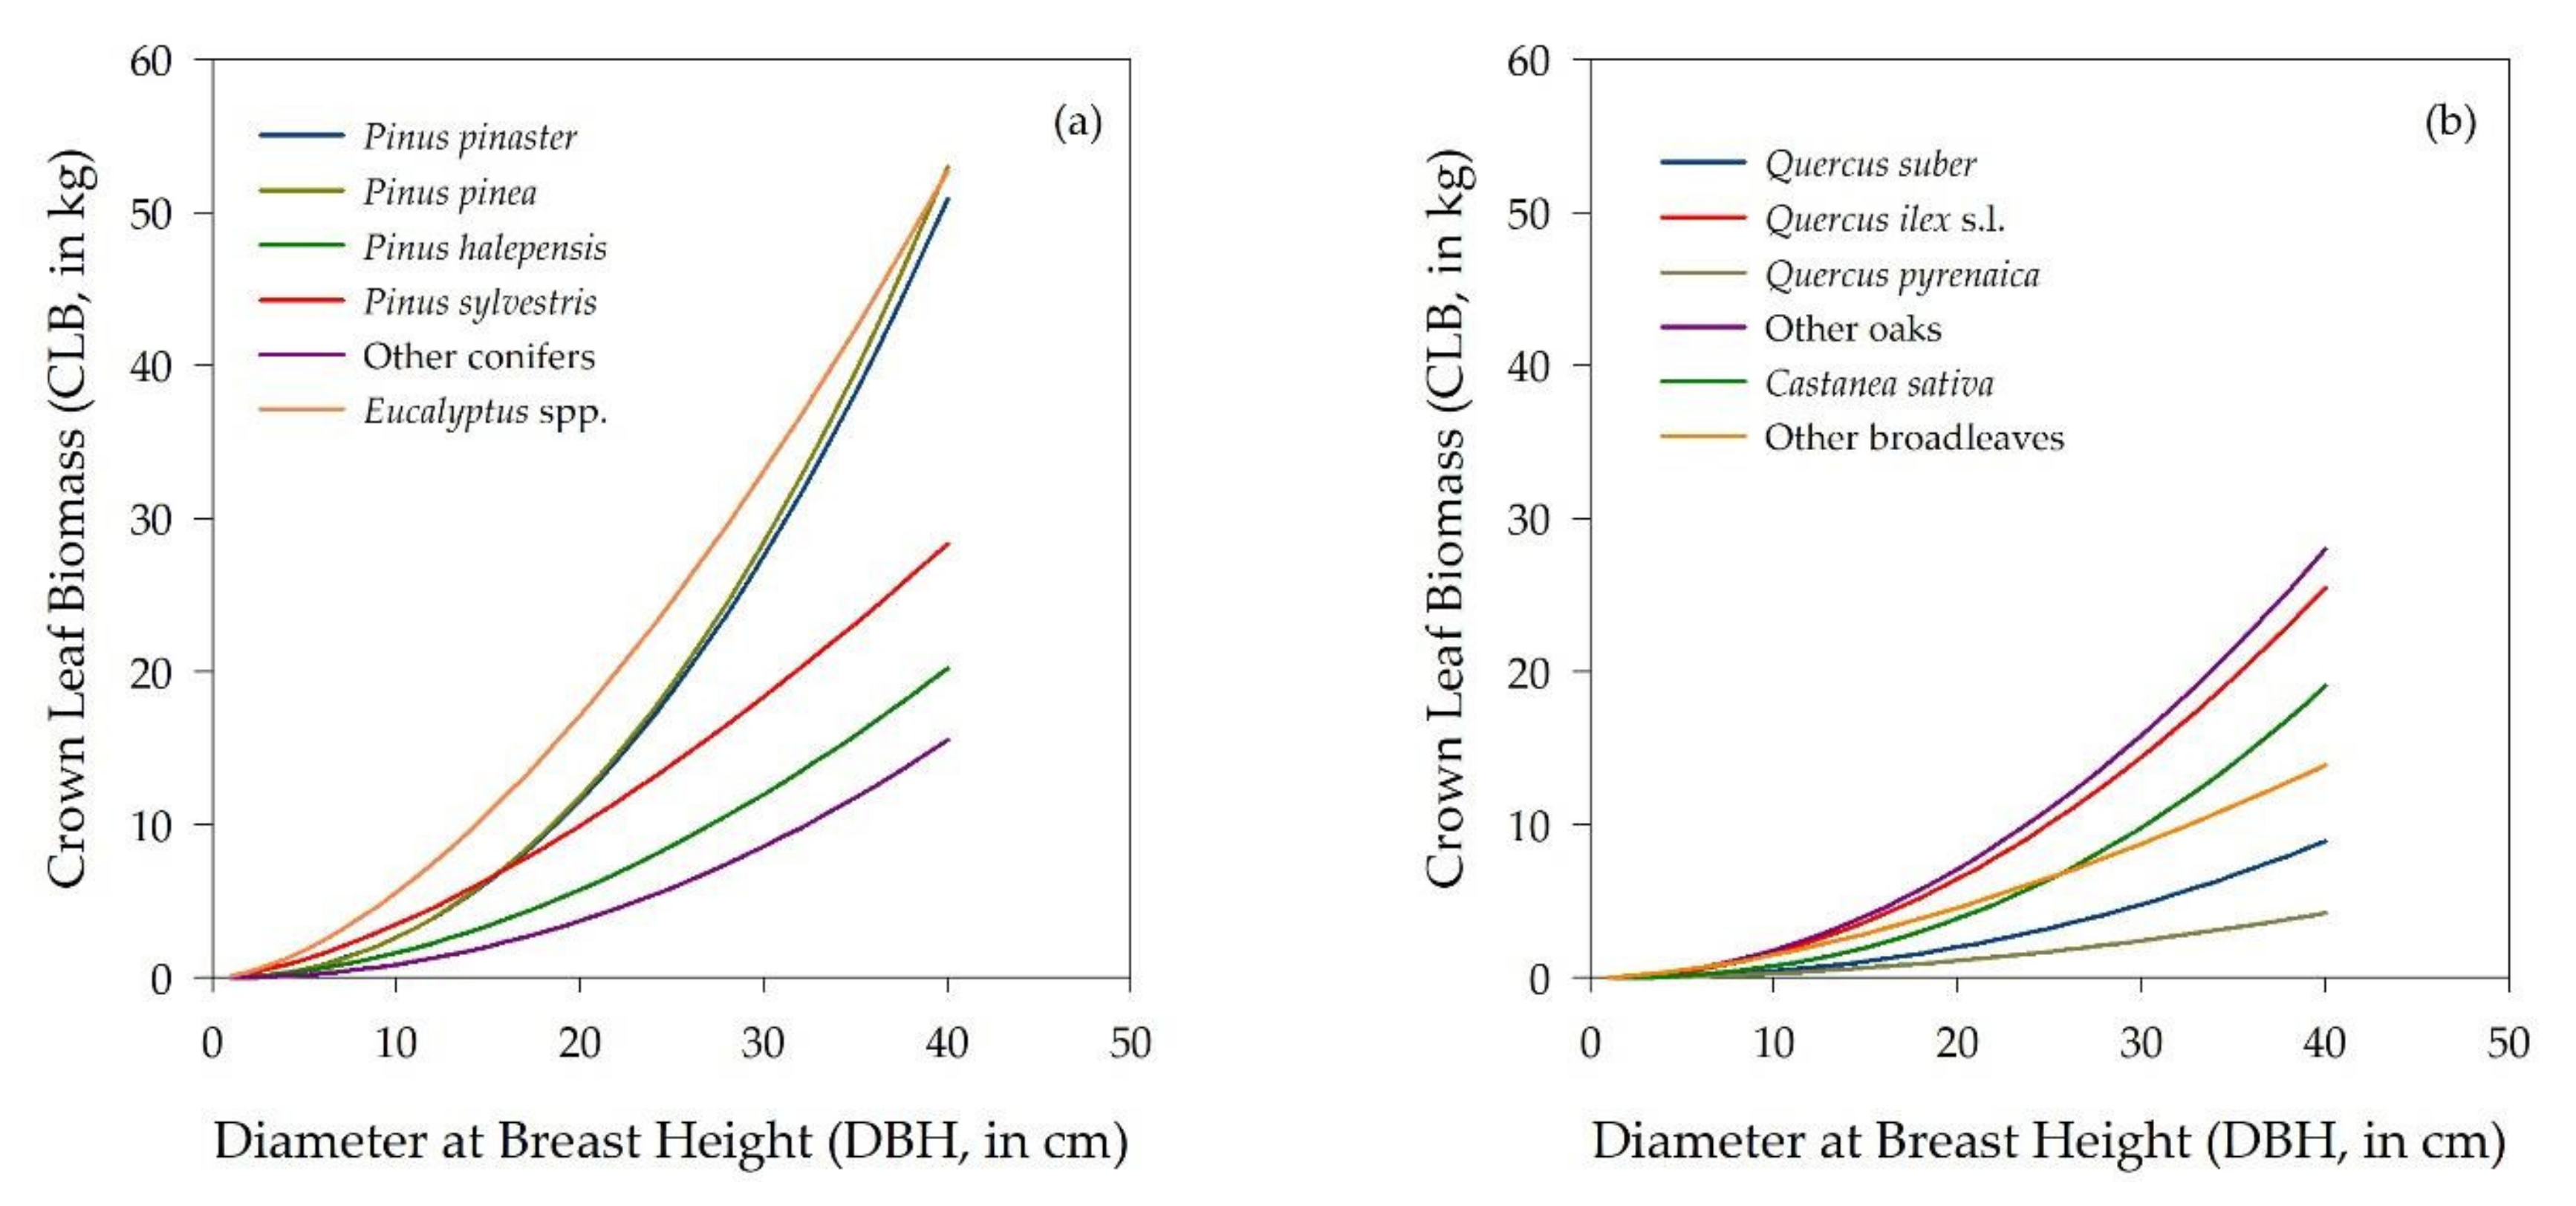
2.4. Estimating Bulk Densities for Tree Crowns and Canopies

There are several important geometric characteristics of tree crowns that are related with the possibility of initiation and spread of crown fires. Some of these characteristics are related with tree crown geometry (Figure 3) that is often approximated by a cylinder characterized by a horizontal circular section with a Crown Diameter (CD) and a vertical height termed Crown Length (CL), going from the Crown Base Height (CBH) to the top of the tree. These variables are often related through allometric equations to the stem Diameter at Breast Height (DBH).
We developed models to estimate the geometry of individual tree crowns using information from four sample trees systematically selected on each sample plot of the Second Spanish NFI (SNFI2). This database includes more than 255 thousand trees (Table S3) covering the distribution area of all the forest species and all the combinations of age, stand density and site qualities [48].
The volume of the crown (CV) of an individual tree represented by Figure 3 can then be calculated as a cylinder with a certain diameter (CD) and a certain length (CL). We have therefore for each individual tree:
C V = π 4 C D 2 · C L
where CV is in units of m3, CD is in units of m and CL is in units of m.
Often it is more practical to measure total Tree Height (HT) and CBH. In that case, the length of the crown is generally measured as the difference between total tree height and the crown base height:
C L = H T C B H
where HT is in units of m and CBH is in units of m.
Other characteristics of the forest stand can also be important in determining the geometry of the tree crowns. In this study, we included a variable related to the density of the stand, as competition for space limits the growth of individual canopies and crown length and crown diameter decrease when stands are dense. This variable, reflecting competition for space, was defined here as a reference distance (DIST), representing the distance of each tree to its four neighbors in a regular square distribution of trees (Figure 4). In fact, if the distribution is completely regular in a square grid, each tree will have an available square area to grow that is the inverse of the tree density, and the square root of that area is the distance between each tree and its four closest neighbors:
D I S T = ( 10000 N H A ) 0.5 = 100 · N H A 0.5
where DIST is in units of m and NHA = density of trees in the stand (number of trees ha−1).
The reference distance calculated by Equation (10) is also twice the distance to the nearest neighbor tree in randomly distributed forests.
CBH, or the gap between the shrub layer and the canopy layer, is one of the most important characteristics governing the probability of crown fire initiation [49]. In fact, as the height of the base of the crown increases the more difficult it is for a surface fire to ignite the crown layer. The estimation of CBH is like that of CL as the sum of the two is total HT, which results in the following equation:
C B H = H T C L ,         or   C L = H T C B H
For Crown Length (CL) estimation, a logistic model was fitted for each species or group of species, assuming tree height as an asymptotic value and using the reference distance as independent variable (Equation (12)). It is clear from Equation (11) that when tree density increases the value of the DIST tends to zero and the crown ratio, i.e., CL as a fraction of total height, tends to the expression on Equation (13):
C L = H T 1 + a 0 · e a 1 · D I S T ,   or         C L H T = 1 1 + a 0 · e a 1 · D I S T
min C L H T = 1 1 + a 0
where C L H T = crown ratio and a0 and a1 are coefficients to be estimated.
Coefficient a0 can be interpreted as related to the self-pruning characteristics of the tree species. Small values of a0 indicate low self-pruning resulting in deep canopies. Coefficient a1 represents the effect of competition and is associated with a negative sign, as when the distance between trees increases the denominator of the equation decreases, resulting in the increase of the estimated CL for a given HT. Smaller a1 values (closer to zero) indicate smaller effects of distance to neighbor trees. A zero value for a1 would indicate that competition with neighbor trees has no effect on CL. The characteristics of the sample trees of each species used to fit the CL Equation (12) are presented on Table S4.
If we were interested directly in Crown Base Height (CBH), we could use the alternative equation:
C B H = H T C L = H T 1 1 1 + a 0 · e a 1 · D I S T
For the estimation of Crown Diameter (CD), we used a similar approach as in CL. In this case, as we were dealing with a variable related to the horizontal structure, the tree variable used to estimate CD was the Diameter at Breast Height (DBH) of the stem, as this is the most common measure taken in forest inventories [50]. The effect of competition by neighbor trees was included based on the DIST. The expression of the equation that provided the best interpretable fit was of the form as follows:
C D = b 0 · D B H b 1 · D I S T b 2
where DBH is in units of cm. Coefficient b0 accounts for the crown tendency to extend horizontally. Coefficients b1 and b2 are both positive as they relate with the positive relationship between stem and crown diameters and between inter-tree spacing and CD. The characteristics of the sample trees of each species used to fit the CD Equation (15) are presented on Table S5.
The biomass equations developed by Montero et al. [51] for Spain, supplemented with those developed by other authors for Portugal [52,53] and other studies for the Mediterranean regions [54,55], allow estimating leaf (or needle) biomass of the crown (CLB) from stem diameter (DBH). Since foliage is the main aerial fuel consumed during a crown fire [17,56], crown fuel properties are based on the quantification of live needle foliage. The allometric equation is of the form:
C L B = c 0 · D B H c 1
where CLB is the dry weight biomass of crown leaves or needles, in units of kg.
Finally, we can calculate the tree Crown Bulk Density (CBD), a variable influencing the rate of spread of a crown fire. CBD is expressed in dry weight of leaves in the tree crown per unit volume of the crown [17] (Equation (17)):
C B D = C L B C V
where CBD is in units of kg m−3.
We can now use the equations for Crown Leaf Biomass (CLB) and those for Crown Length (CL) and Crown Diameter (CD) to calculate the bulk density of the crown (CBD) from simple variables at the tree level (DBH and HT) and at the stand level (NHA or DIST), as follows:
C B D = C L B π 4 C L · C D 2 = c 0 · D B H c 1 · 1 + a 0 · e a 1 · D I S T π 4 H T · b 0 2 · D B H 2 · b 1 · D I S T 2 · b 2
As with the shrub layer, it is possible to calculate a tree Canopy Layer Bulk Density (CLBD) from the CBD and the Fraction Cover of the Canopy Layer (FCCL). FCCL can be measured directly, or it can be estimated from the stand density (NHA) and their mean CD:
F C C L = π 4 C D 2 · N H A / 10000
C L B D = C B D · F C C L
Figure 5 presents a scheme of how the estimated CLBD relates to the different variables.

3. Results

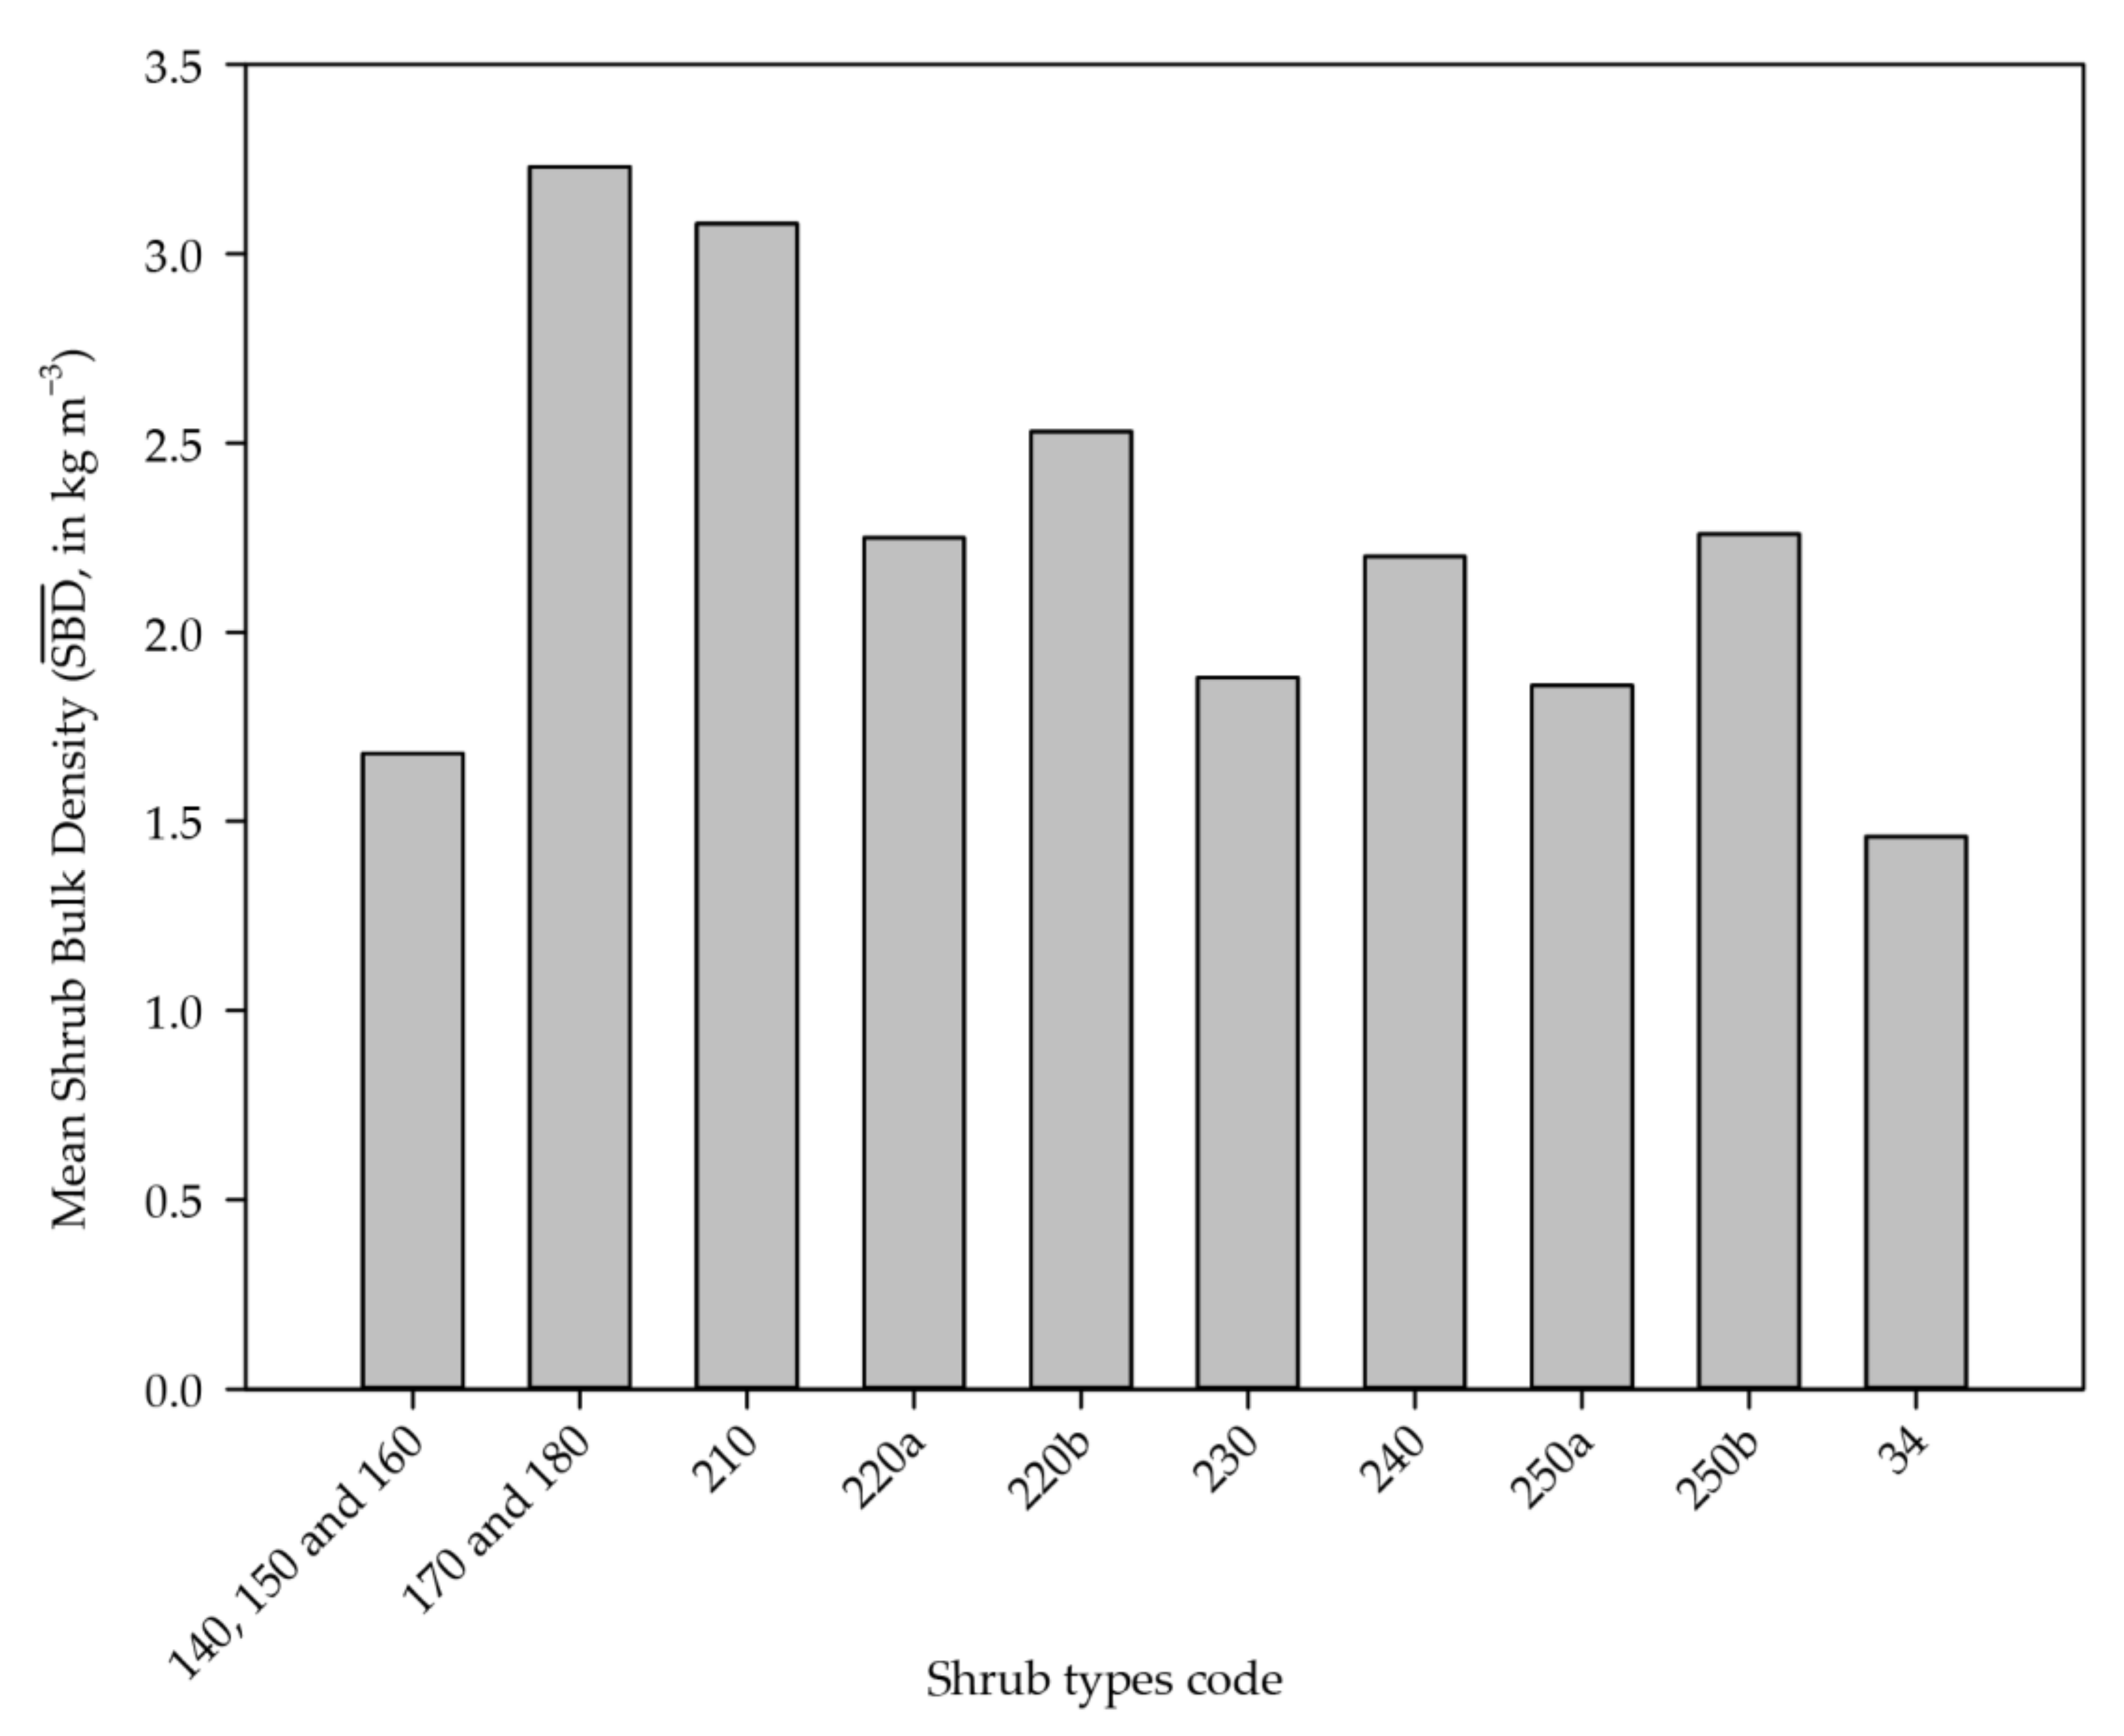
3.1. Shrub Bulk Densities

According to Equation (6), Shrub Bulk Densities (SBD) were estimated for each one of the 10 shrub types defined in Pasalodos-Tato et al. [27], and the coefficient for the dependency on height (c − 1) and the coefficient of determination (R2) are presented on Table 1. The type “Big size Cistaceae shrubs” has more plots (20% in total) that any other, followed by “Lavandula spp., Rosmarinus officinalis, Thymus spp. shrubland and Phlomis purpurea”. “Quercus coccifera and Pistacia lentiscus” and “Heathers, Ericaceae shrubs and related groups” are the type with higher values of mean Bulk Density ( S B D ¯ ) (Figure 6). Figure 7 shows the graphical representation of results based on Equation (6).
From the observation of the Figure 7, it is possible to conclude that there is a general pattern showing that bulk density decreases with shrub height. This is evident for the seven shrub types analyzed.
In one shrub type (“Big size Cistaceae shrubs”), bulk density is almost independent of height and there are only two types where shrub bulk density increases with height. It is also clear that, under the same general pattern, there are formations that tend to be much denser than others: “Quercus coccifera and Pistacia lentiscus” are denser than “Machias, terebinths or garrigues”; “Heathers and Ericaceae shrubs” are denser than “Ulex spp. shrubs and related groups”; and “small size Cistaceae” are denser than “Lavandula spp., Rosmarinus officinalis, Thymus spp. shrubland and Phlomis purpurea” or “Ampelodesmos spp. and other grasses”.

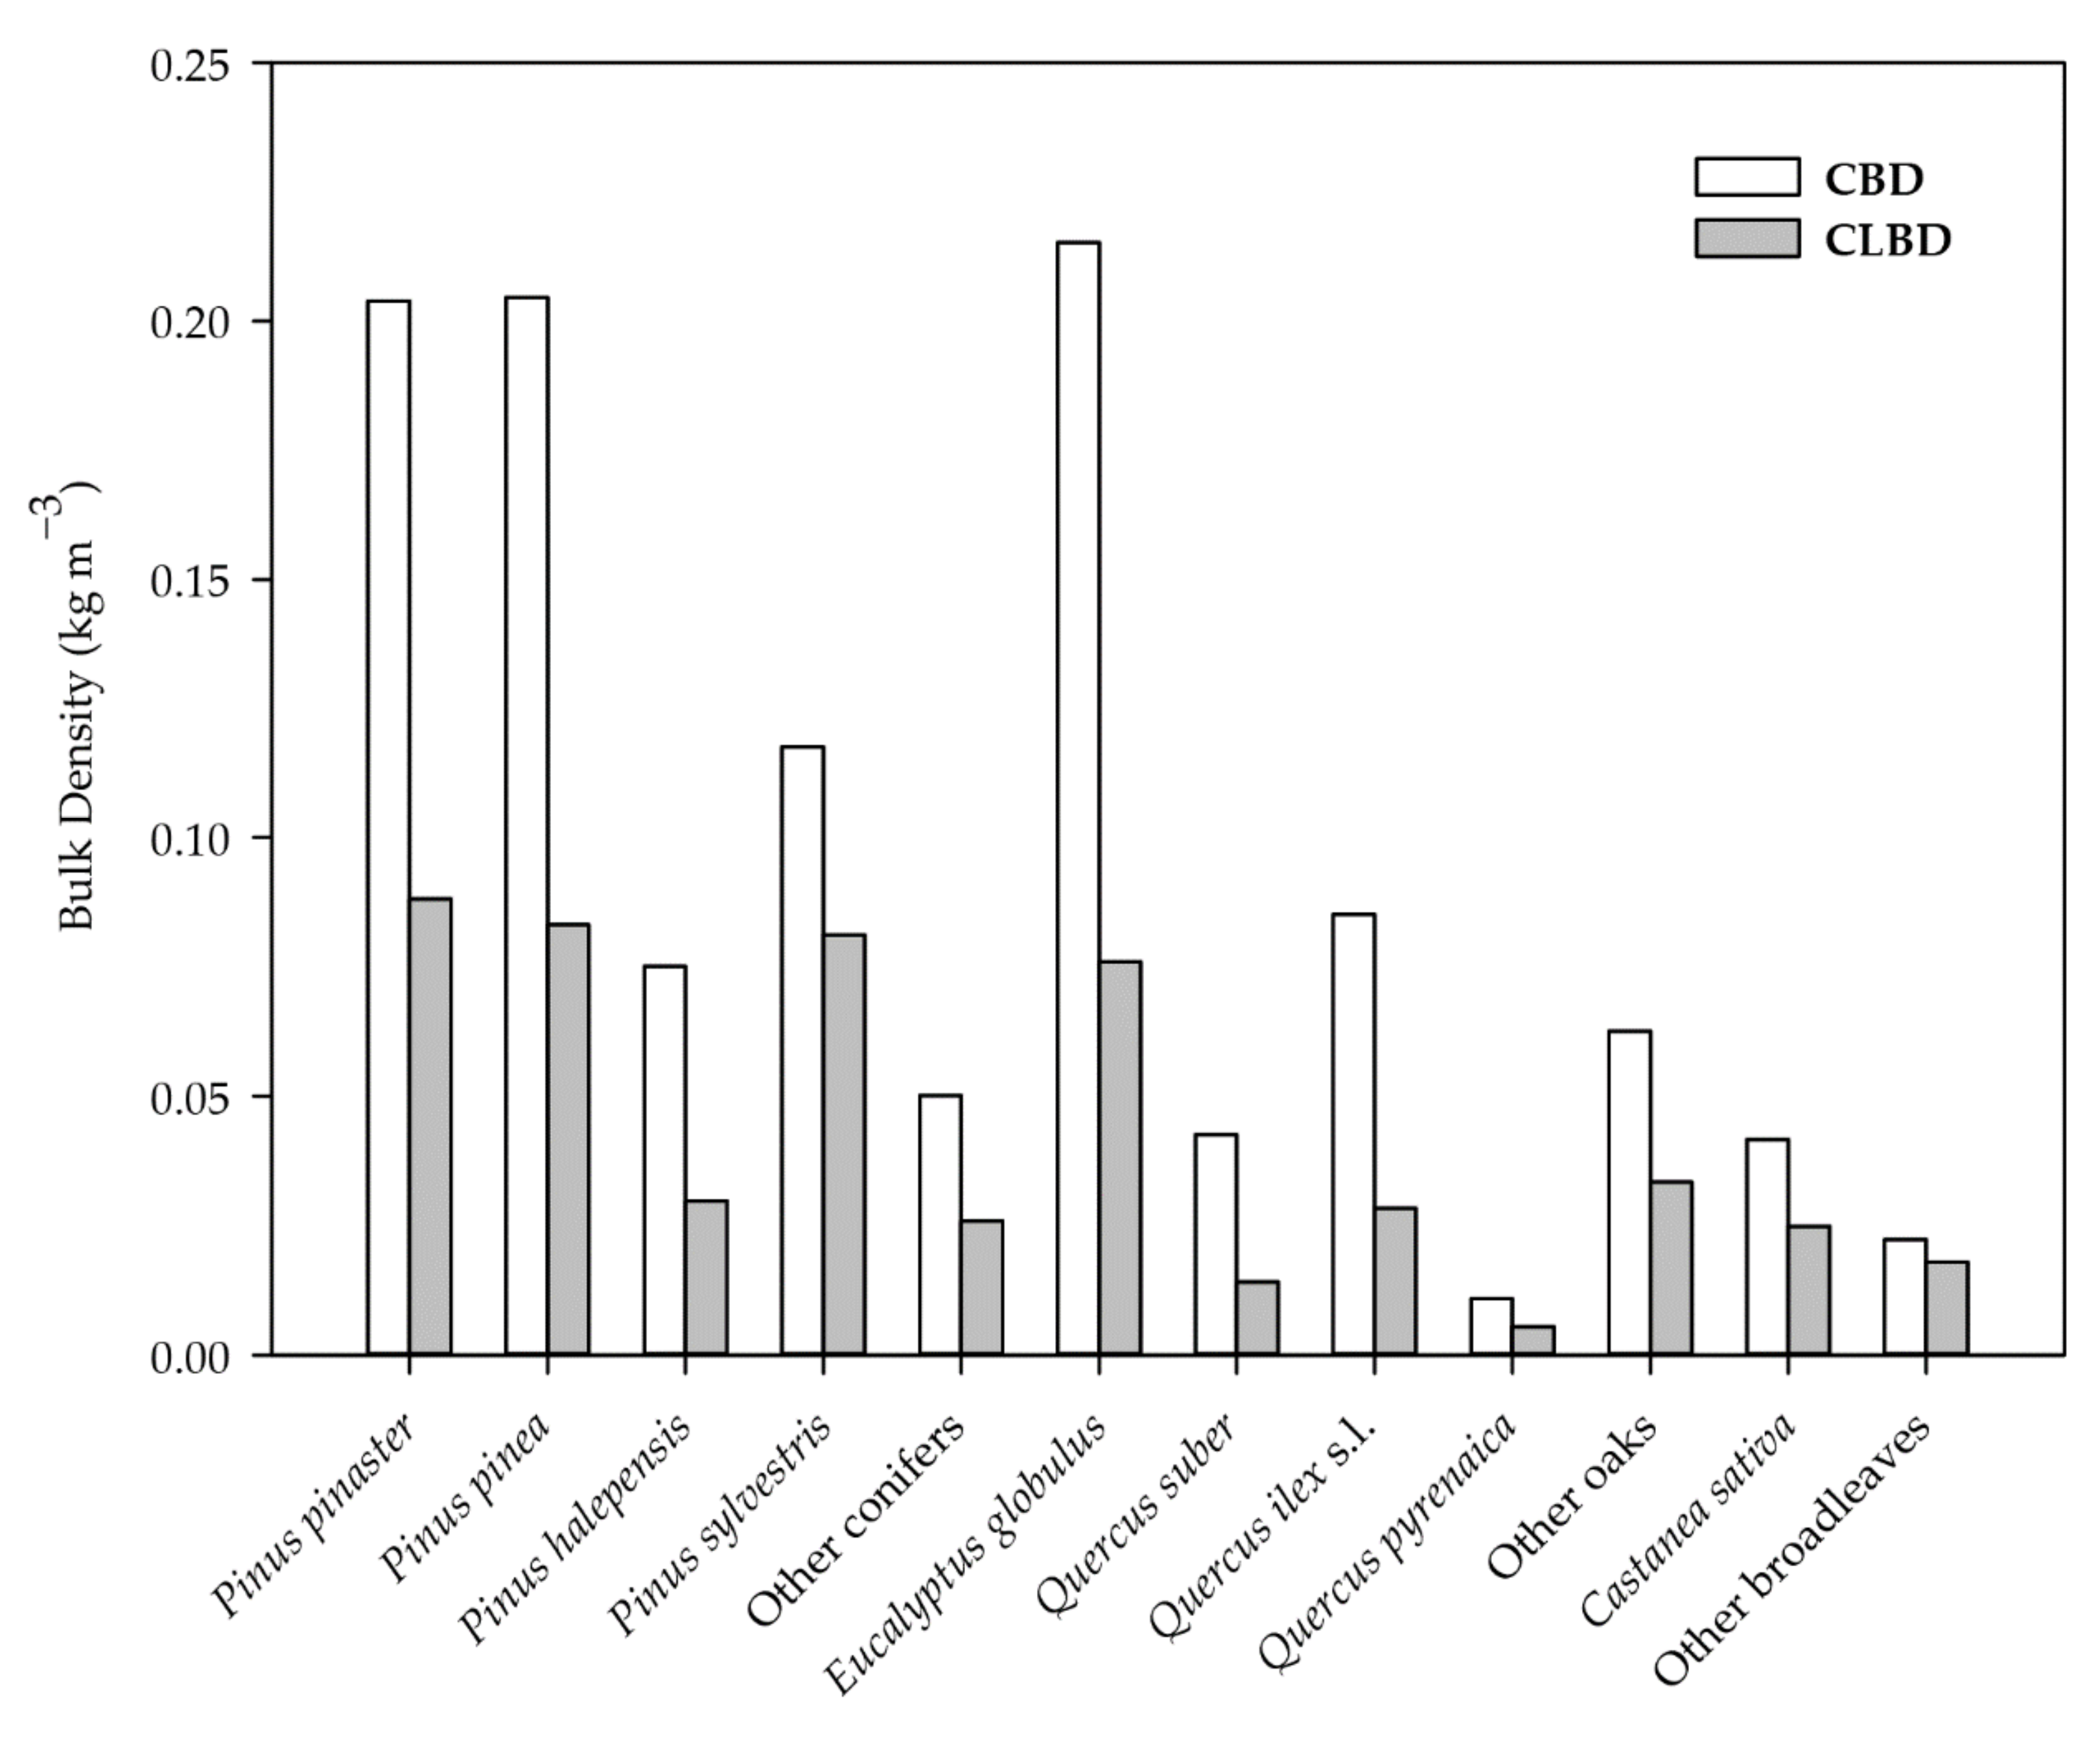
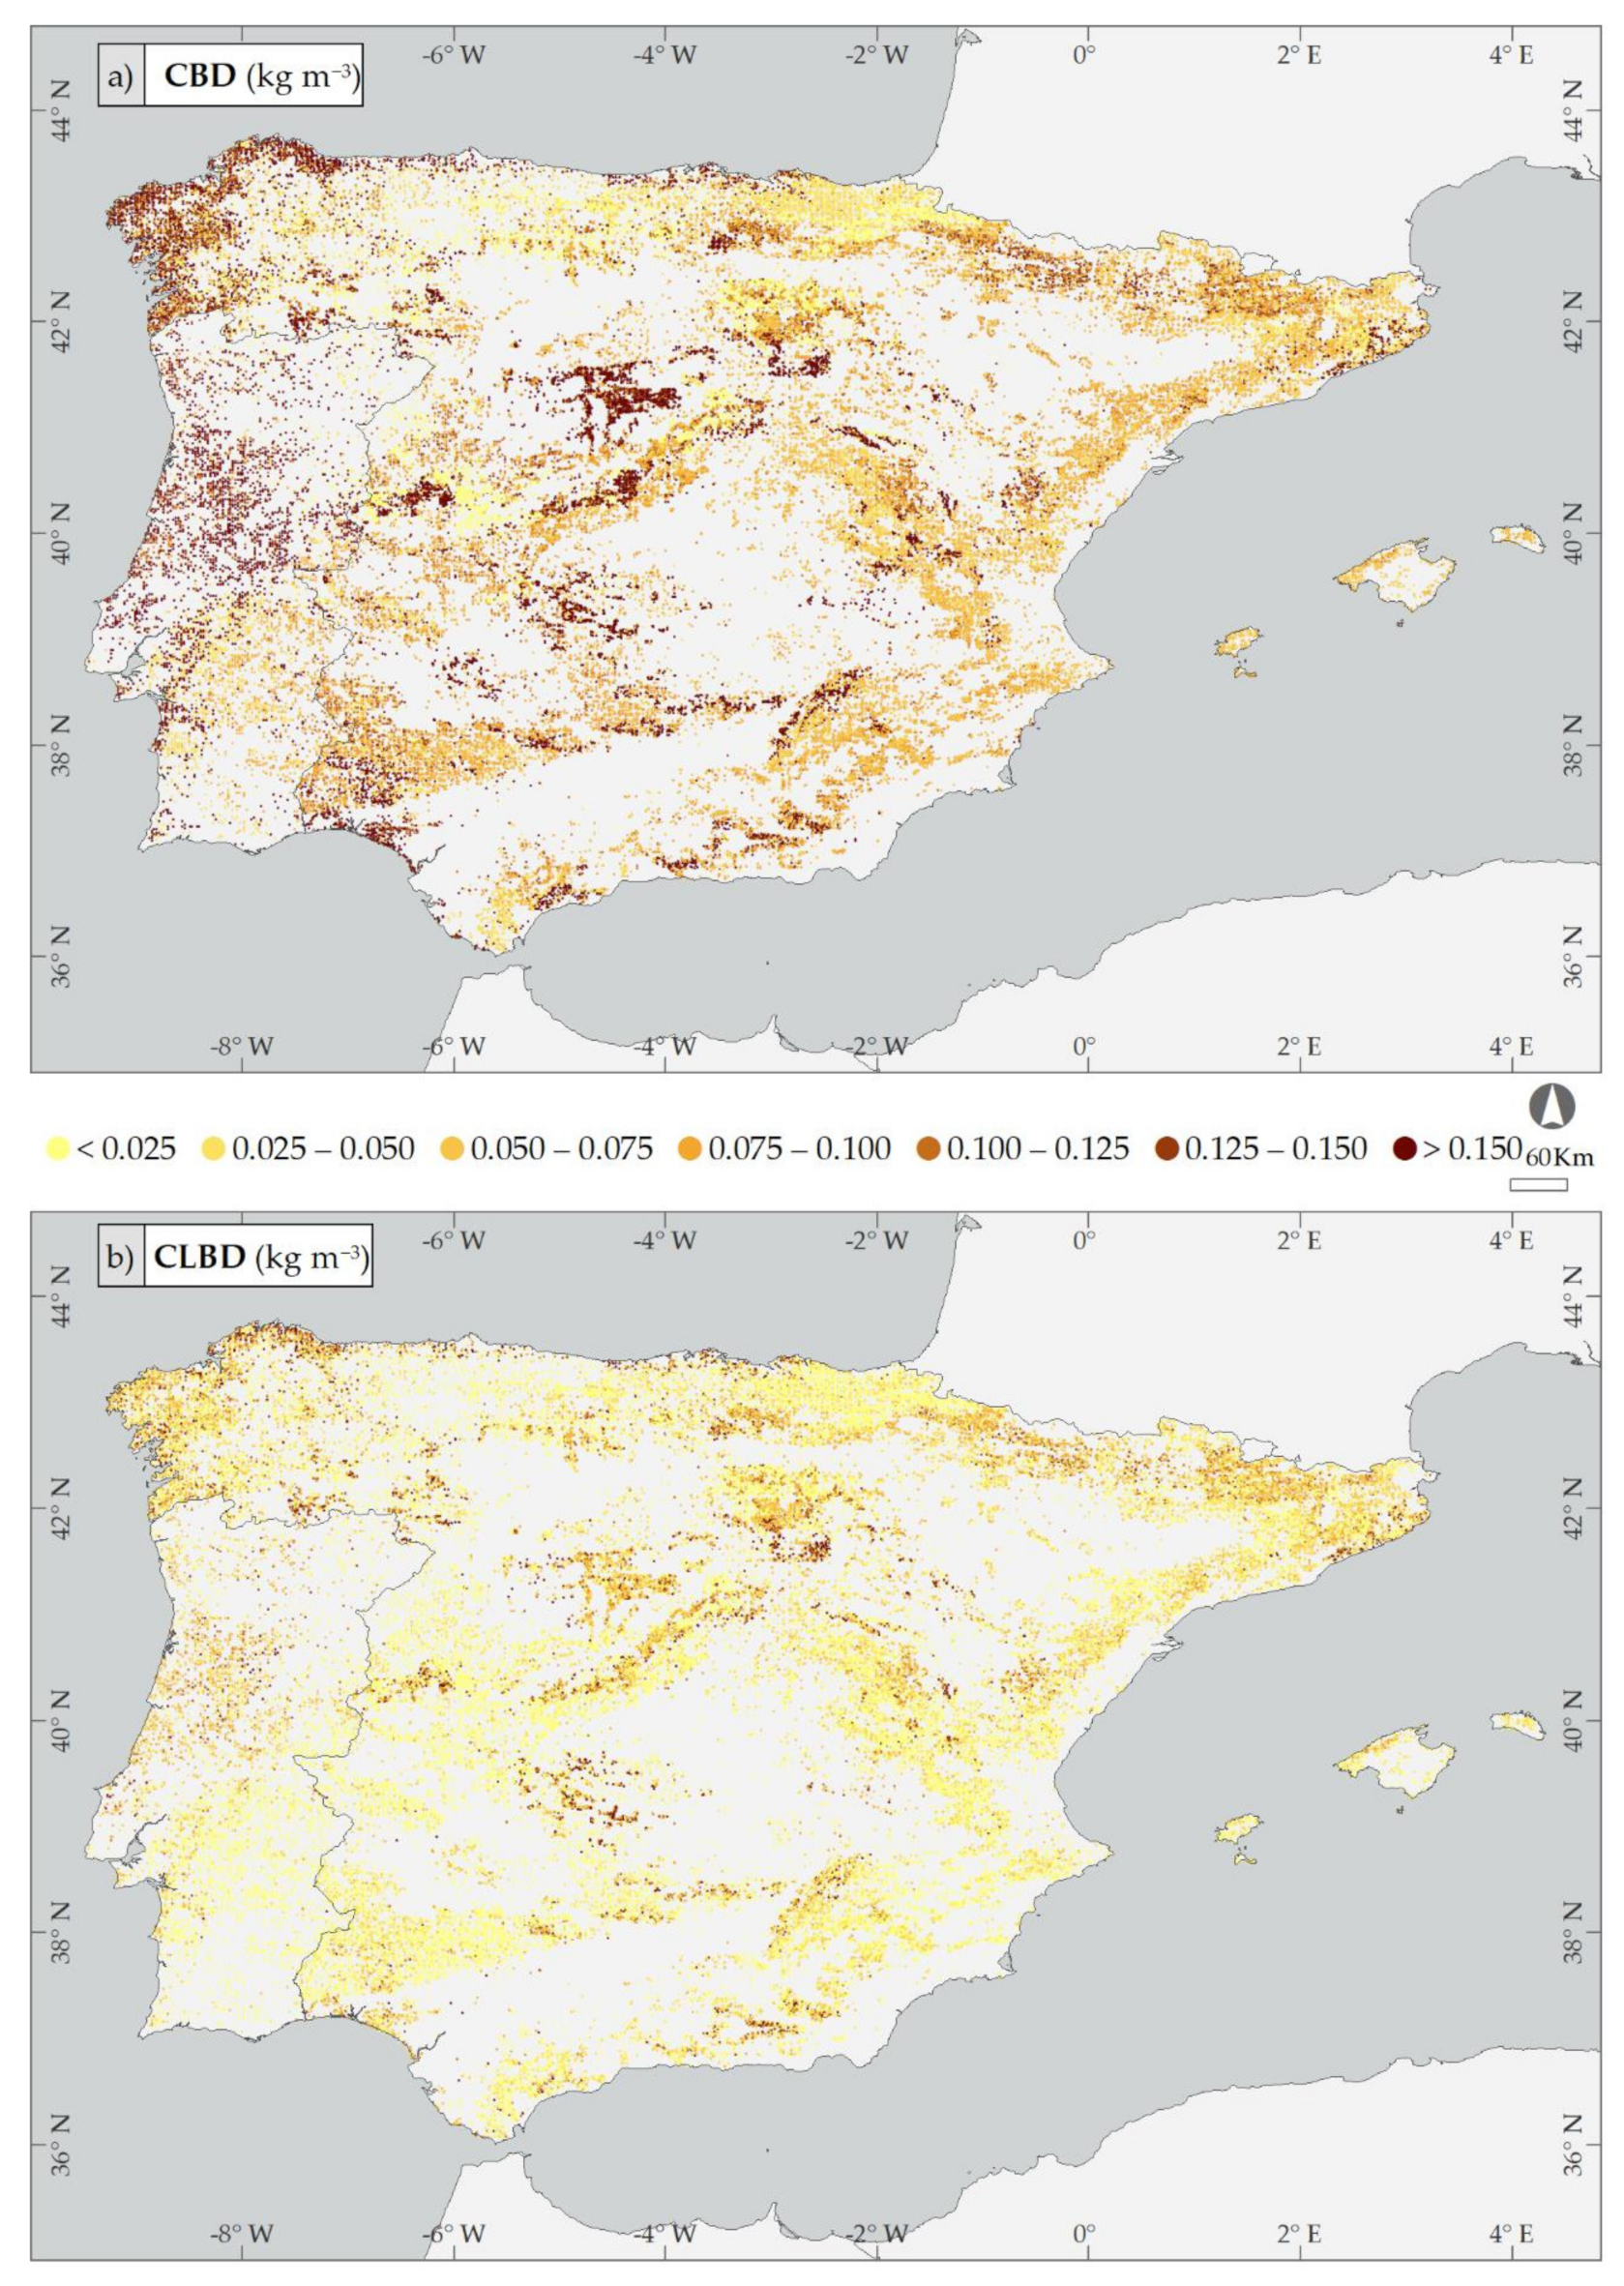
3.2. Bulk Density for Tree Crowns and Canopies

The database collected for sample trees (Table S3) in the framework of the Second Spanish National Forest Inventory [48] allowed for the development of simple equations where crown length was possible to correlate with total tree height and the reference distance. Equation (12) was fitted for all tree species or group of species. The results for the a0 and a1 parameters for the species or group of species considered for the Iberian Peninsula (Table S1) are shown in Table 2.
We can illustrate the behavior of the Crown Length (CL) equation by plotting the estimated crown length of 10 m tall trees of different species or group of species as a function of the distance to the closest trees, expressed by the reference distance (DIST), as shown in the Figure 8.
Table 2 and Figure 8 show that the behavior of conifers and eucalypts is very different from that of oaks and other broadleaves. While Figure 8a shows a clear dependence of CL on the distance to the closest trees (DIST), the species in Figure 8b, except for Quercus ilex s.l., seem very little dependent on competition from neighbors (low a1 values). Figure 8 also shows large differences between crown lengths of different species. In Figure 8a, Pinus sylvestris and other conifers show larger CL, whereas Pinus pinea and Eucalypts spp. show smaller CL. In Figure 8b, the smaller CL is from Quercus suber, possibly related to management for cork extraction, whereas other broadleaves show the larger values.
The fitted equation for all species or group of species for Crown Diameter (CD) shows the relations between the Diameter at Breast Height (DBH) and the DIST as in Equation (15). The results for the coefficients of b0, b1 and b2 for the species or group of species considered for the Iberian Peninsula are shown in the Table 3.
We can illustrate the differences between the different species (or group of species) by plotting estimated Crown Diameter (CD) as a function of stem diameter (DBH) for a constant value of the reference distance (DIST). In this case, we illustrate this situation for a DIST = 5 m, equivalent to a regular stand with a density of 400 trees per hectare (Figure 9).
It is apparent that, for a reference distance DIST = 5 m, the group of conifers and eucalypts represented in Figure 9a tends to have smaller CD than the group of oaks and other broadleaves. In Figure 9b Castanea sativa shows a different behavior with much larger CD for smaller DBH values, but with similar values for larger DBH. Quercus suber, Quercus ilex s.l. and Quercus pyrenaica have smaller CD for the same DBH than other oaks or other broadleaves.
We can now illustrate the effect of competitor neighbors by plotting CD against distance to neighbors (DIST) for a fixed stem diameter (DBH = 20 cm) (Figure 10).
Figure 10 shows important differences between conifers with eucalypts (smaller CD for DBH = 20 cm) and oaks and other broadleaves (larger CD). On the one hand, from Figure 10a it is apparent that the effect of competition is stronger in the two fastest growing species (Eucalyptus spp. and Pinus pinaster) with the higher values for the coefficient b2 (Table 3). On the other hand, Figure 10b shows that two of the species with lower CD (Quercus suber and Quercus ilex s.l.) have the highest values for b2, indicating that competition from neighbors is an important factor. Quercus pyrenaica and other oaks show very little effect of neighbors (low b2 values) whereas Castanea sativa and other broadleaves have the larger crowns but intermediate effects of neighbors.
Crown Leaf Biomass (CLB) is a major fuel component of tree crowns and Equation (16) expresses its allometric relation with the Diameter at Breast Height (DBH). The results for the coefficients of c0 and c1 and the coefficient of determination (R2) are shown in Table 4 for the tree species or group of species considered for the Iberian Peninsula.
For a visual understanding of the relationships between Crown Leaf Biomass (CLB) and Diameter at Breast Height (DBH), and to observe the diversity of relationships between the different species, we plot Equation (16) in Figure 11.

3.3. Application of Bulk Density Results to the National Forest Inventories of the Iberian Peninsula

The results of this study allow for a global vision of the forests in the Iberian Peninsula from the perspective of bulk density. As an example of the application of results to the tree component, we used standardized data from the Portuguese NFI (PTNFI5, 2005–2006) and the Spanish NFI (SNFI3, 1997–2007), for the tree species or group of species in the mainland and Baleares, concerning stand level information of Diameter at Breast Height (DBH, in cm), Total Height (HT, in m), number of trees per hectare (NHA, in n.ha−1) and plot coverage (FCCL). A total of 4875 and 57,550 plots from Portugal and Spain NFIs, respectively (Table 5), were used for the estimation of tree Crown Bulk Density (CBD) and Canopy Layer Bulk Density (CLBD) for all those plots in the Iberian Peninsula (Figure 12). Values of CLBD are estimated, as for the shrub layer, considering the properties of the species involved by their CBD but also the characteristics of the stand measured by the Fraction Cover of the Canopy Layer (FCCL).
Species such as Eucalyptus globulus Labill., Pinus pinea, Pinus pinaster and Pinus sylvestris have the highest values of CBD and CLBD. Broadleaves have lower values, with Quercus ilex s.l. as the species with high value of CBD, but low CLBD because of low tree density, and other oaks as the group of species with higher value of CLBD because they generally form dense stands.
The differences found between CBD and CLBD are in accordance with previous results on percentage cover by each vertical layer for the tree species/groups in the Iberian Peninsula [2].
The three most important tree species in Portugal, by area of occupation, are Pinus pinaster, widely spread in the north of the Tagus River, Eucalyptus globulus, distributed in the coastal part and Quercus suber mostly located in the south. According to the Spanish NFI, the most important tree species are Quercus ilex s.l., Pinus halepensis, Pinus sylvestris, Quercus pyrenaica and Pinus pinaster. In order to have a better visualization of the species distribution, some species were aggregated in the same group: Pinus halepensis and Pinus sylvestris were included in other conifers; Quercus pyrenaica was included in other oaks; and Castanea sativa was included in other broadleaves. Figure 13 presents the distribution of the tree species/groups in the Iberian Peninsula according with NFIs data.
The estimated CBD values per plot are plotted for the Iberian Peninsula in Figure 14a. Higher values of CBD are mostly located in the north and Atlantic coast of the Iberian Peninsula, which is an area with dominance of pines and eucalypts (Figure 13). The estimated CLBD values per plot are shown in Figure 14b. Larger CLBD values are also in areas dominated by Pinus pinaster and Eucalyptus globulus in central and northern Portugal and Pinus pinea in central Spain. In southern Spain areas with high CBD with Quercus ilex s.l. (Figure 13) have lower CLBD values because of the small tree densities in the typical agroforestry “dehesa” type systems.

4. Discussion

The ability to predict fire propagation through shrub canopy and fire intensity is necessary to manage fire risk in Mediterranean areas [57].
Fuel loading is an indicator of the maximum quantity of fuel that can be burned in a fire with maximum intensity [11]. Therefore, if other factors are constant, shrub types with higher values of Shrub Bulk Density (SBD) are likely to burn with higher intensity according to Byram’s equation [58]. The shrub types with higher SBD are “Quercus coccifera and Pistacia lentiscus”, “Heathers, Ericaceae shrubs and related groups” and “Big size Cistaceae shrubs”. These formations are generally composed of taller individuals than the other formations, which according to Papió and Trabaud [11] results in a higher level of combustibility and may lead both to a great increase in temperature in the first 5 cm below the soil surface, and to a greater potential for destroying the below-ground plant organs. The high values of SBD found in Quercus coccifera fuel strata, and their decrease with shrub height, are consistent with the dynamics model of garrigues ecosystems from Pimont et al. [59].
Papió and Trabaud [11] studied the structural vegetation components that influence flammability and fire behavior of five Mediterranean mature, well-developed shrub species and found different fire hazard per species. Rosmarinus officinalis is one of the species with the lowest fire hazard, which is in line with the lower value of SBD for this species in this study.
The fuel to feed a fire is dependent on the fuel load dimensions, thus it is important to categorize fuel by their size classes [11]. In this study, we considered the fuel loading foliage and small branches (10 h fuels) for shrubs [26] and only leaf biomass for trees for a better comparison with other studies.
The mean Shrub Bulk Densities ( S B D ¯ ) reported in our study are in general agreement with results from previous studies. Scott and Burgan [60] reported SBD values between 1.05 and 1.76 kg m−3 (except for one fuel type) for shrubs in arid to semiarid climate in North America, while Countryman and Philpot [61] measured a range of 0.2–2.1 kg m−3 in chaparral. Our results for the shrub types “Machias, terebinthus, garrigues” and “Rosmarinus officinalis” (1.68 and 1.86 kg m−3, respectively) are similar to those found by Fernandes and Pereira [26] in a study conducted in Serra da Arrábida, in Portugal for Phyllirea angustifolia, Phyllirea latifolia, Arbutus unedo, Rhamnus alaternus and Rosmarinus officinalis (1.41, 1.71, 1.28, 1.30 and 2.18 kg m−3, respectively). However, the same authors observed substantially lower SBD values for the species Pistacia lentiscus and Quercus coccifera (1.42 and 1.61 kg m−3, respectively) and Erica arborea (1.88 kg m−3) than the ones obtained in our study for types “Quercus coccifera and Pistacia lentiscus” (3.23 kg m−3) and “Heathers, Ericaceae shrubs and related groups” (3.08 kg m−3). Other study in Portugal [62] reported a mean SBD value of 1.94 kg m−3 for Phyllirea angustifolia, Phillyrea angustifolia, Ilex aquifolium and Rhamnus alaternus, slightly higher than that obtained in our study for “Machias, terebinthus, garrigues” (1.68 kg m−3). Another study in central-west Portugal [63], in the Candeeiros mountain, indicated bulk densities of 2.16 kg m−3 for Ulex europaeus, which is similar to the ones we obtained for the shrub type “Ulex spp. shrubs and related groups” (2.20 kg m−3), whereas in more Mediterranean climates, SBD values as high as 9.5 kg m−3 have been measured in Ulex densus in S Portugal [26] and 2.6–9.6 kg m−3 in Ulex parviflorus [64,65,66]. In Galicia (NW Spain), Arellano et al. [67] measured values of Shrub Layer Bulk Density (SLBD) for the fine fraction (<6 mm) ranging 1.8–3.5 kg m−3, for Ulex spp., 2–3 kg m−3 for heathers alone or mixed with leguminous species, whereas broom shrublands showed lower values (1.1–1.5 kg m−3), depending on the dominant species. Many factors could explain the differences found in studies using the same species. Among them are the different plant sizes and fuel particles range sampled, different environmental or management conditions, as grazing pressure or fuel hazard reduction treatments [68,69], and phenotypic variability. For e.g., SBD values between 6% and 53% lower for the biomass of fine portions of shrubs (diameter < 6 mm), compared to the whole plant has been reported in scrublands of NW Spain and N Portugal [26,70,71,72]. This decrease was smaller (21% less) when comparing biomass <2 mm with <6 mm [73] in similar heathland fuel complex in NW Spain. In addition, plant age has a strong influence on the structural distribution of its biomass and therefore on its SBD [64]. Initial increases with age in SBD for the late building stage and later decreases in the mature and senescent stage have been reported for different Iberian communities [74,75] and also frequently found in other shrub ecosystems [76,77,78].
Overall, our results demonstrate a decrease in SBD as shrub height increases that seems consistent with the decrease detected with age in different shrub ecosystems [68,74,78,79,80]. This is important because fire rate of spread is expected to change with changes in bulk density [81]. Moreover, Pimont et al. [59] pointed out that bulk density has a complex effect on fire behavior since fire intensity is proportional to fuel load and to the rate of fire spread. Nonetheless, fire characteristics are related to the Shrub Layer Bulk Density (SLBD), which depends not only on the SBD but also on the Fraction Cover of the Shrub Layer (FCSL). The reduction of the horizontal continuity of shrub fuels is an important component of fuel management of shrublands to avoid easy wildfire propagation.
Forest canopy characteristics have an important impact on the spread of wildfires [12,28,57]. Higher Crown Bulk Density (CBD) also influences the surface fire because average crown fuel temperature increases and ignition occurs at higher bulk density [57]. In this study, we found higher values of CBD in trees species such as Pinus pinaster and Eucalyptus globulus. These are species with high probability to burn [2], and have been the most affected by wildfires in the Iberian Peninsula [82,83].
Differences in tree crown fuel characteristics generally lead to a difference in the unsteady interaction between the surface fire and crown fuel [57]. Several studies demonstrate the importance of the bulk density of the crowns and canopies on fire propagation as a crucial variable to evaluate the fuel structure effect on vegetation [84]. However, whereas CBD is determinant for crown fire initiation, it is the Canopy Layer Bulk Density (CLBD) that controls the likelihood and the speed of active crown fires, as shown for conifer stands [19].
The CLBD results obtained in this study are lower than those from several other studies (see Table S6; [85,86,87,88,89,90,91,92,93,94]). One reason for that difference could be that the NFI plots include many stands with low tree cover whereas studies planned to obtain CLBD values typically focused on stands with more trees per hectare, larger basal areas (Table S6) and therefore closer canopies. While this bias can affect studies with a low number of plots, other studies based on a high number of plots with a broad range of conditions (e.g., [95]) or based on NFIs data offer also higher values (e.g., [12,96]). Other possible explanation can be the different approach applied in this study and that used in other studies. Apparent variation in CLBD obtained by different methods is not unusual [29,97]. In fact, remote sensed canopy bulk density estimates frequently show appreciable deviations from ground-based CLBD values [32,33,36] (see other studies in Table S6). The mean CLBD values presented are therefore representative of the stands included in the NFIs. However, the models adjusted are applicable to any forest stand with available data.
It should be noted that these results apply for the whole crown and whole canopy layer. However, previous results in North America [22] and in the Iberian Peninsula [2] showed that bulk density varies with height within the canopy indicating that the maximum value of CLBD can be almost twice than the mean CLBD value. This should be considered when simulating crown fire propagation.
It is worth highlighting the structural differences between shrub and tree canopy fuels. Fine fuel in the shrub layer generally encompasses more dead fuel than in the tree canopy layer [23], resulting in a lower moisture content of their respective canopy fuels, whereas canopy height is dramatically lower in shrubs than in forest stands. However, bulk density is frequently 10–50 times higher in shrubs. Tachajapong et al. [57] have noted these conditions make it easier the ignition of pyrolizates under lower heat fluxes than those that occur in conifer forests. In terms of application of crown fire initiation theory of Van Wagner [17] to shrubs [98,99], this explains the remarkably higher propensity to crown fire in the understory layer, compared to the tree canopy layer. It is important to note that there is feedback between the two fuel layers. On the one hand, competition for light and water availability reduces the moisture content of understory fuels and decreases their bulk density, and on the other hand, the more flammable and less compact understory fuel facilitates a higher linear fire intensity, which is necessary to ignite the canopy fuels and maintain an active fire in the canopy.

5. Summary

The role of bulk density on fire behavior is known, but operational information to be used in simulations and predictions is often difficult to obtain. In the case of the Iberian Peninsula, structural information from the National Forest Inventories is useful but it must be complemented with auxiliary information from measures or estimates of bulk density to be used in fire behavior simulations.
We propose in this study a simple way to estimate the values of the bulk densities of the shrub and the canopy layer based on the association of NFI data with research results in the Iberian Peninsula on bulk densities of shrubs and tree crowns. Bulk density equations were adjusted for 10 shrub types of selected shrub species and for 12 tree species or groups of species. The equations developed can be used, in association with the fraction cover of the corresponding layer, to parametrize models that predict fire behavior (e.g., Behave) or to analyze the probability of a fire to spread. We show how bulk density data for individual shrub or tree crown types can be associated with structural data from the NFIs to estimate biomass of the forest ecosystems and to evaluate potential fire behavior involving shrubs and tree crowns.
The estimations of bulk density for a specific ecosystem could also be used to evaluate the number of chemical components of the system including volatile organic compounds which can contribute to extreme forest fire behavior.
In general, Canopy Layer Bulk Density (CLBD) values are relatively small in comparison with thresholds for active crown fire propagation and, in comparison, with Shrub Layer Bulk Density (SLBD) values. This suggests that most fire management actions dedicated to reducing fire propagation might prioritize on reducing the load and continuity of the shrub layer in the understory.

Supplementary Materials

The following supporting information can be downloaded at: https://www.mdpi.com/article/10.3390/f13040555/s1, Table S1: Common groups of shrub formations in the Portuguese NFI and Spanish NFI. Codes of the formations: (a) according to SFM25 [42]; (b) used by Pasalodos-Tato et al. [27] based on the SFM25 codes. For each formation there are the corresponding species in Portugal and Spain NFIs, Table S2: Common groups of tree species in the Portuguese NFI and Spanish NFI, Table S3: Species and group of species considered for the adjustments of the equations, with the number of trees sampled in the study with information of crown diameter and crown length in the SNFI2 [48], Table S4: Characteristics of the sample trees used in the development of the crown length Equation (12), Table S5: Characteristics of the sample trees used in the development of the crown diameter Equation (15), Table S6: Examples of studies for estimation of Crown Bulk Density (CBD) at stand level in forest ecosystems in the Iberian Peninsula (mean values and standard deviation in parenthesis).

Author Contributions

Conceptualization, L.N., M.P.-T., I.A. and F.C.R.; methodology, L.N., M.P.-T., I.A. and F.C.R.; data analysis, L.N., M.P.-T., I.A., A.C.S., J.A.V., F.C.R.; data processing, L.N., M.P.-T., I.A., A.C.S., F.C.R.; results analysis and review, L.N., M.P.-T., I.A., A.C.S., J.A.V., V.S., P.V., F.C.R.; writing—original draft preparation, L.N., A.C.S., J.A.V., F.C.R.; writing—review and editing, L.N., M.P.-T., I.A., A.C.S., J.A.V., V.S., P.V., F.C.R. All authors have read and agreed to the published version of the manuscript.

Funding

This research was funded from the European Union’s Horizon 2020 research and innovation programme, DIABOLO project “Distributed, integrated and harmonized forest information for bioeconomy outlooks”, EU Grant Agreement no. 633464, and from the EXTREME project “Influence of VOCs (volatile organic compounds) on the extreme behavior of forest fires” (PCIF/GFC/0078/2018), Foundation for Science and Technology. This research was also funded by the National Institute of Agricultural Research of Spain (INIA) through project RTA2017-00042-C05-02, co-funded by FEDER.

Data Availability Statement

Not applicable.

Acknowledgments

The authors wish to thank Roberto Vallejo, Elena Robla and Vicente Sandoval of the Spanish Ministry of Agriculture, Food and Environment for kindly providing access to the full Spanish NFI datasets and to Paula Sarmento and Conceição Ferreira of the Portuguese National Forest Services for kindly providing access to the Portuguese NFI datasets. We express our thanks to the TRAGSA field teams of the Spanish National Forest Inventory.

Conflicts of Interest

The authors declare no conflict of interest.

References

  1. Alberdi, I.; Condés, S.; McRoberts, R.E.; Winter, S. Mean species cover: A harmonized indicator of shrub cover for forest inventories. Eur. J. For. Res. 2018, 137, 265–278. [Google Scholar] [CrossRef] [Green Version]
  2. Nunes, L.; Moreno, M.; Alberdi, I.; Álvarez-González, J.G.; Godinho-Ferreira, P.; Mazzoleni, S.; Castro Rego, F. Harmonized Classification of Forest Types in the Iberian Peninsula Based on National Forest Inventories. Forests 2020, 11, 1170. [Google Scholar] [CrossRef]
  3. ICNF. 10o Relatório Provisório de Incêndios Florestais—2017: 01 de Janeiro a 31 de Outubro; Departamento de Gestão de Áreas Públicas e de Proteção, Instituto da Conservação da Natureza e das Florestas: Lisbon, Portugal, 2017. [Google Scholar]
  4. MAPAMA. Estadística General de Incendios Forestales; Ministerio de Agricultura y Pesca, Alimentación y Medio Ambiente: Madrid, Spain, 2017. Available online: https://www.miteco.gob.es/es/biodiversidad/temas/inventarios-nacionales/inventario-espanol-patrimonio-natural-biodiv/sistema-indicadores/06c-estadistica-incendios-forestales.aspx (accessed on 30 June 2020).
  5. González, J.R.; Palahí, M.; Trasobares, A.; Pukkala, T. A fire probability model for forest stands in Catalonia (north-east Spain). Ann. For. Sci. 2006, 63, 169–176. [Google Scholar] [CrossRef]
  6. ICNF. Incêndios Rurais. Informação Sobre Áreas Ardidas e Ocorrências de 2001 a 2021. Available online: http://www2.icnf.pt/portal/florestas/dfci/relat/rel-if (accessed on 30 October 2021).
  7. San-Miguel-Ayanz, J.; Moreno, J.M.; Camia, A. Analysis of large fires in European Mediterranean landscapes: Lessons learned and perspectives. For. Ecol. Manag. 2013, 294, 11–22. [Google Scholar] [CrossRef]
  8. Rego, F.; Catry, F.X.; Montiel, C.; Karlsson, O. Influence of territorial variables on the performance of wildfire detection systems in the Iberian Peninsula. For. Policy Econ. 2013, 29, 26–35. [Google Scholar] [CrossRef]
  9. Nunes, L.; Álvarez-González, J.G.; Alberdi, I.; Silva, V.; Rocha, M.; Rego, F.C. Analysis of the occurrence of wildfires in the Iberian Peninsula based on harmonised data from national forest inventories. Ann. For. Sci. 2019, 76, 27. [Google Scholar] [CrossRef] [Green Version]
  10. Nunes, M.C.S.; Vasconcelos, M.J.; Pereira, J.M.C.; Dasgupta, N.; Alldredge, R.J.; Rego, F.C. Land Cover Type and Fire in Portugal: Do Fires Burn Land Cover Selectively? Landsc. Ecol. 2005, 20, 661–673. [Google Scholar] [CrossRef]
  11. Papió, C.; Trabaud, L. Comparative study of the aerial structure of five shrubs of mediterranean shrublands. For. Sci. 1991, 37, 146–159. [Google Scholar] [CrossRef]
  12. Cruz, M.G.; Alexander, M.E.; Wakimoto, R.H. Assessing canopy fuel stratum characteristics in crown fire prone fuel types of western North America. Int. J. Wildl. Fire 2003, 12, 39–50. [Google Scholar] [CrossRef] [Green Version]
  13. Botequim, B.; Zubizarreta-Gerendiain, A.; Garcia-Gonzalo, J.; Silva, A.; Marques, S.; Fernandes, P.M.; Pereira, J.M.C.; Tomé, M. A model of shrub biomass accumulation as a tool to support management of portuguese forests. IForest 2014, 8, 114–125. [Google Scholar] [CrossRef] [Green Version]
  14. Hevia, A.; Álvarez-González, J.G.; Ruiz-Fernández, E.; Prendes, C.; Ruiz-González, A.D.; Majada, J.; González-Ferreiro, E. Modelling canopy fuel and forest stand variables and characterizing the influence of thinning in the stand structure using airborne LiDAR. Rev. Teledetec. 2016, 2016, 3979. [Google Scholar] [CrossRef] [Green Version]
  15. ICNF. 6.o Inventário Florestal Nacional IFN6. Relatório Final; Instituto da Conservação da Natureza e das Florestas: Lisbon, Portugal, 2019; Available online: http://www2.icnf.pt/portal/florestas/ifn/resource/doc/ifn/ifn6/IFN6_Relatorio_completo-2019-11-28.pdf (accessed on 18 January 2022).
  16. MITECO. Anuario de Estadística Forestal. 2018. Available online: https://www.miteco.gob.es/es/biodiversidad/estadisticas/forestal_anuario_2018.aspx (accessed on 15 September 2021).
  17. Van Wagner, C.E. Conditions for the start and spread of crown fire. Can. J. For. Res. 1977, 7, 23–34. [Google Scholar] [CrossRef]
  18. Cruz, M.G.; Alexander, M.E.; Wakimoto, R.H. Development and testing of models for predicting crown fire rate of spread in conifer forest stands. Can. J. For. Res. 2005, 35, 1626–1639. [Google Scholar] [CrossRef]
  19. Scott, J.H.; Reinhardt, E.D. Assessing Crown Fire Potential by Linking Models of Surface and Crown Fire Behavior; Rocky Mountain Research Station. Research Paper RMRS-RP-29; USDA Forest Service: Ogden, UT, USA, 2001.
  20. Thomas, P.H. Some Aspects of the Growth and Spread of Fire in the Open. For. Int. J. For. Res. 1967, 40, 139–164. [Google Scholar] [CrossRef] [Green Version]
  21. Alexander, M.E.; Cruz, M.G.; Vaillant, N.M.; Peterson, D.L. Crown Fire Behavior Characteristics and Prediction in Conifer Forests: A State-of-Knowledge Synthesis; Final Report to the Joint Fire Science Program; Joint Fire Science Program: Boise, ID, USA, 2013.
  22. Scott, J.H.; Reinhardt, E.D. Stereo Photo Guide for Estimating Canopy Fuel Characteristics in Conifer Stands; Gen. Tech. Rep. RMRS-GTR-145; Department of Agriculture, Forest Service, Rocky Mountain Research Station: Fort Collins, CO, USA; Boise, ID, USA, 2005. [CrossRef] [Green Version]
  23. Rego, F.C.; Morgan, P.; Fernandes, P.; Hoffman, C. Fire Science: From Chemistry to Landscape Management; Textbooks in Earth Sciences, Geography and Environment; Springer: New York, NY, USA, 2021; ISBN 9783030698157. [Google Scholar]
  24. Anderson, W.R.; Cruz, M.G.; Fernandes, P.M.; McCaw, L.; Vega, J.A.; Bradstock, R.A.; Fogarty, L.; Gould, J.; McCarthy, G.; Marsden-Smedley, J.B.; et al. A generic, empirical-based model for predicting rate of fire spread in shrublands. Int. J. Wildl. Fire 2015, 24, 443–460. [Google Scholar] [CrossRef] [Green Version]
  25. Fernandes, P.M.; Catchpole, W.R.; Rego, F.C. Shrubland fire behaviour modelling with microplot data. Can. J. For. Res. 2000, 30, 889–899. [Google Scholar] [CrossRef]
  26. Fernandes, P.A.; Pereira, J.P. Caracterização de combustíveis na Serra da Arrábida. Silva Lusit. 1993, 1, 237–260. [Google Scholar]
  27. Pasalodos-Tato, M.; Ruiz-Peinado, R.; del Río, M.; Montero, G. Shrub biomass accumulation and growth rate models to quantify carbon stocks and fluxes for the Mediterranean region. Eur. J. For. Res. 2015, 134, 537–553. [Google Scholar] [CrossRef]
  28. Mitsopoulos, I.; Mallinis, G.; Arianoutsou, M. Wildfire Risk Assessment in a Typical Mediterranean Wildland–Urban Interface of Greece. Environ. Manag. 2014, 55, 900–915. [Google Scholar] [CrossRef]
  29. Keane, R.E.; Reinhardt, E.D.; Scott, J.; Gray, K.; Reardon, J. Estimating forest canopy bulk density using six indirect methods. Can. J. For. Res. 2005, 35, 724–739. [Google Scholar] [CrossRef]
  30. Skowronski, N.S.; Clark, K.L.; Duveneck, M.; Hom, J. Three-dimensional canopy fuel loading predicted using upward and downward sensing LiDAR systems. Remote Sens. Environ. 2011, 115, 703–714. [Google Scholar] [CrossRef]
  31. Riaño, D.; Chuvieco, E.; Condés, S.; González-Matesanz, J.; Ustin, S.L. Generation of crown bulk density for Pinus sylvestris L. from lidar. Remote Sens. Environ. 2004, 92, 345–352. [Google Scholar] [CrossRef]
  32. Andersen, H.E.; McGaughey, R.J.; Reutebuch, S.E. Estimating forest canopy fuel parameters using LIDAR data. Remote Sens. Environ. 2005, 94, 441–449. [Google Scholar] [CrossRef]
  33. Hermosilla, T.; Ruiz, L.A.; Kazakova, A.N.; Coops, N.C.; Moskal, L.M. Estimation of forest structure and canopy fuel parameters from small-footprint full-waveform LiDAR data. Int. J. Wildl. Fire 2014, 23, 224–233. [Google Scholar] [CrossRef] [Green Version]
  34. González-Ferreiro, E.; Diéguez-Aranda, U.; Crecente-Campo, F.; Barreiro-Fernández, L.; Miranda, D.; Castedo-Dorado, F. Modelling canopy fuel variables for Pinus radiata D. Don in NW Spain with low-density LiDAR data. Int. J. Wildl. Fire 2014, 23, 350–362. [Google Scholar] [CrossRef]
  35. Marino, E.; Tomé, J.L.; Madrigal, J.; Hernando, C. Effect of airborne LiDAR pulse density on crown fuel modelling. In Proceedings of the 6th International Fire Behavior and Fuels Conference, Marseille, France, 29 April–3 May 2019; pp. 1–6. [Google Scholar]
  36. Saatchi, S.; Halligan, K.; Despain, D.G.; Crabtree, R.L. Estimation of forest fuel load from radar remote sensing. IEEE Trans. Geosci. Remote Sens. 2007, 45, 1726–1740. [Google Scholar] [CrossRef]
  37. Arellano-Pérez, S.; Castedo-Dorado, F.; López-Sánchez, C.A.; González-Ferreiro, E.; Yang, Z.; Díaz-Varela, R.A.; Álvarez-González, J.G.; Vega, J.A.; Ruiz-González, A.D. Potential of Sentinel-2A data to model surface and canopy fuel characteristics in relation to crown fire hazard. Remote Sens. 2018, 10, 1645. [Google Scholar] [CrossRef] [Green Version]
  38. Cruz, M.G.; Alexander, M.E. Evaluating regression model estimates of canopy fuel stratum characteristics in four crown fire-prone fuel types in western North America. Int. J. Wildl. Fire 2012, 21, 168–179. [Google Scholar] [CrossRef]
  39. Alberdi, I.; Condés, S.; Millán, J.; Saura, S.; Sánchez, G.; Pérez, F.; Villanueva, J.; Vallejo, R. National Forest Inventories Report, Spain. In National Forest Inventories. Pathways for Common Reporting; Tomppo, E., Gschwantner, T., Lawrence, M., McRoberts, R., Eds.; Springer: New York, NY, USA, 2010; pp. 529–540. [Google Scholar]
  40. AFN. Inventário Florestal Nacional. In Portugal Continental—IFN5 2005-2006; Relatório Final; Autoridade Florestal Nacional: Lisbon, Portugal, 2010. [Google Scholar]
  41. Castroviejo, S. Coord. gen. (1986–2019). In Flora iberica 1–8, 10–15, 17–18, 20–21; Real Jardín Botánico CSIC: Madrid, Spain, 2019. [Google Scholar]
  42. MAPAMA. 2007 Mapa Forestal de España. Escala 1:25.000 (MFE25); Ministerio de Agricultura y Pesca, Alimentación y Medio Ambiente. Dirección General de Desarrollo Rural y Política Forestal: Madrid, Spain, 2017.
  43. AFN. Instruções Para o Trabalho de Campo do Inventário Florestal Nacional—IFN 2005/2006; Autoridade Florestal Nacional, Direcção Nacional de Gestão Florestal: Lisbon, Portugal, 2009. [Google Scholar]
  44. Costa, J.C.; Aguiar, C.; Capelo, J.H.; Lousã, M.; Neto, C. Biogeografia de Portugal Continental. Quercetea 1998, 1, 5–56. [Google Scholar]
  45. Rivas-Martínez, S.; Penas, A.; Díaz González, T.E.; Cantó, P.; del Río, S.; Costa, J.C.; Herrero, L.; Molero, J. Biogeographic Units of the Iberian Peninsula and Baelaric Islands to District Level. A Concise Synopsis. In The Vegetation of the Iberian Peninsula. Plant and vegetation; Loidi, J., Ed.; Springer: Berlin/Heidelberg, Germany, 2017; pp. 131–188. [Google Scholar]
  46. Vega, J.A.; Fernandes, P.; Cuiñas, P.; Fontúrbel, M.T.; Pérez, J.R.; Loureiro, C. Fire spread analysis of early summer field experiments in shrubland fuel types of northwestern Iberia. For. Ecol. Manag. 2006, 234, S102. [Google Scholar] [CrossRef]
  47. West, G.B.; Brown, J.H.; Enquist, B.J. A general model for the origin of allometric scaling laws in biology. Science 1997, 276, 122–126. [Google Scholar] [CrossRef] [PubMed]
  48. Instituto Nacional para la Conservación de la Naturaleza (España). Segundo Inventario Forestal Nacional, 1986–1995. Explicaciones y Métodos; ICONA: Madrid, Spain, 1990. [Google Scholar]
  49. Cruz, M.G.; Alexander, M.E.; Wakimoto, R.H. Modeling the likelihood of crown fire occurrence in conifer forest stands. For. Sci. 2004, 50, 640–658. [Google Scholar]
  50. Tomppo, E.; Gschwantner, T.; Lawrence, M.; McRoberts, R.E. National Forest Inventories: Pathways for Common Reporting; Springer: Berlin, Germany, 2010; ISBN 978-90-481-3232-4. [Google Scholar]
  51. Montero, G.; Ruiz-peinado, R.; Muñoz, M. Producción de Biomassa y Fijación de CO2 por los Bosques Españoles; Florestal, M.I.S., Ed.; INIA: Madrid, Spain, 2005; ISBN 2014000050000. [Google Scholar]
  52. Lopes, D. Estimating Net Primary Production in Eucalyptus Globulus and Pinus Pinaster Ecossytems in Portugal. Ph.D. Thesis, Kingston University, Surrey, UK, 2005. [Google Scholar]
  53. Mendes, A.; Nunes, L.; Lopes, D.; Soares, P. Ajuste de equações de biomassa total e por componentes para carvalho-negral e pinheiro-bravo no distrito de Vila Real. In 7o Congresso Florestal Nacional. Conhecimento e Inovação, 05-08 Junho; SPCF: Vila Real e Bragança, Portugal, 2013; Available online: http://hdl.handle.net/10400.5/21578 (accessed on 18 January 2022).
  54. Mitsopoulos, I.D.; Dimitrakopoulos, A.P. Estimation of canopy fuel characteristics of Aleppo pine (Pinus halepensis Mill.) forests in Greece based on common stand parameters. Eur. J. For. Res. 2014, 133, 73–79. [Google Scholar] [CrossRef]
  55. Leonardi, S.; Santa Regina, I.; Rapp, M.; Gallego, H.A.; Rico, M. Biomass, litterfall and nutrient content in Castanea sativa coppice stands of southern Europe. Ann. For. Sci. 1996, 53, 1071–1081. [Google Scholar] [CrossRef]
  56. Jiménez, E.; Vega, J.A.; Ruiz-González, A.D.; Guijarro, M.; Alvarez-González, J.G.; Madrigal, J.; Cuiñas, P.; Hernando, C.; Fernández-Alonso, J.M. Carbon emissions and vertical pattern of canopy fuel consumption in three Pinus pinaster Ait. active crown fires in Galicia (NW Spain). Ecol. Eng. 2013, 54, 202–209. [Google Scholar] [CrossRef]
  57. Tachajapong, W.; Lozano, J.; Mahalingam, S.; Xiangyang, Z.; Weise, D.R. An investigation of crown fuel bulk density effects on the dynamics of crown fire initiation in Shrublands. Combust. Sci. Technol. 2008, 180, 593–615. [Google Scholar] [CrossRef] [Green Version]
  58. Byram, G.M. Combustian of Forest Fuels. In Forest Fire Control and Use; Davis, K.P., Ed.; McGraw-Hill Book Company: New York, NY, USA, 1959; pp. 61–89. [Google Scholar]
  59. Pimont, F.; Dupuy, J.L.; Rigolot, E. A simple model for shrub-strata-fuel dynamics in Quercus coccifera L. communities. Ann. For. Sci. 2018, 75, 44. [Google Scholar] [CrossRef] [Green Version]
  60. Scott, J.H.; Burgan, R.E. Standard Fire Behavior Fuel Models: A Comprehensive Set for Use with Rothermel’s Surface Fire Spread Model. Gen. Tech. Rep. RMRS-GTR-153; Department of Agriculture, Forest Service, Rocky Mountain Research Station: Fort Collins, CO, USA; Boise, ID, USA, 2005. [Google Scholar]
  61. Countryman, C.M.; Philpot, C.W. Physical Characteristics of Chamise as a Wildland Fuel; Research Paper PSW-66; USDA Forest Service, Pacific Southwest, Forest and Range Experimental Station: Berkeley, CA, USA, 1970.
  62. Silva, T.P.; Pereira, J.M.C.; Paúl, J.C.P.; Santos, M.T.N.; Vasconcelos, M.J.P. Estimativa de Emissões Atmosféricas Originadas por Fogos Rurais em Portugal. Silva Lusit. 2006, 14, 239–263. [Google Scholar]
  63. Paúl, J.C. Caracterização Biofisica e Georreferenciação de Parcelas de Inventário de Vegetação o Parque Natural das Serras de Airee Candeeiros; ISA: Lisbon, Portugal, 1993. [Google Scholar]
  64. Armand, D.; Etienne, M.; Legrand, C.; Marechal, J.; Valette, J.C. Phytovolume, phytomasse et relations structurales chez quelques arbustes méditerranéens. Ann. Sci. For. 1993, 50, 79–89. [Google Scholar] [CrossRef] [Green Version]
  65. Pereira, J.M.C.; Sequeira, N.M.S.; Carreiras, J.M.B. Structural properties and dimensional relations of some mediterranean shrub fuels. Int. J. Wildl. Fire 1995, 5, 35–42. [Google Scholar] [CrossRef]
  66. Pausas, J.G.; Alessio, G.A.; Moreira, B.; Corcobado, G. Fires enhance flammability in Ulex parviflorus. New Phytol. 2012, 193, 18–23. [Google Scholar] [CrossRef] [PubMed] [Green Version]
  67. Arellano, S.; Vega, J.A.; Ruiz, A.D.; Arellano, A.; Álvarez, J.G.; Vega, D.J.; Pérez, P. Foto-Guía de Combustibles Forestales de Galicia y Comportamiento del Fuego Asociado; Andavira Editora: Santiago de Compostela, Spain, 2017; ISBN 9788484089865. [Google Scholar]
  68. Jaime, M.; Berná, B. Aspectos Ecológicos y Técnicas de Control del Combustiblecombustible (Roza y Quema Controlada) en Matorrales con alto Riesgo de Incendio, Dominados por Ulex Parviflorus (Pourr.); Universidad de Alicante: Alicante, Spain, 2001. [Google Scholar]
  69. Marino, E.; Hernando, C.; Madrigal, J.; Guijarro, M. Short-term effect of fuel treatments on fire behaviour in a mixed heathland: A comparative assessment in an outdoor wind tunnel. Int. J. Wildl. Fire 2014, 23, 1097–1107. [Google Scholar] [CrossRef]
  70. Vega, J.A.; Cuiñas, P.; Fonturbel, T.; Pérez-Gorostiaga, P.; Fernández, C. Predicting fire behaviour in Galician (NW Spain) shrubland fuel complexes. In Proceedings of the 3rd International Conference on Forest Fire Research and 14th Fire and Forest Meteorology, Luso, Portugal, 16–20 November; Viegas, D., Ed.; Universidade de Coimbra: Coimbra, Portugal, 1998; pp. 713–728. [Google Scholar]
  71. Fernandes, P. Fire spread prediction in shrub fuels in Portugal. For. Ecol. Manag. 2001, 144, 67–74. [Google Scholar] [CrossRef]
  72. Marino, E.; Hernando, C.; Madrigal, J.; Dez, C.; Guijarro, M. Fuel management effectiveness in a mixed heathland: A comparison of the effect of different treatment types on fire initiation risk. Int. J. Wildl. Fire 2012, 21, 969–979. [Google Scholar] [CrossRef]
  73. Vega, J.A.; Jiḿnez, E.; Dupuy, J.L.; Linn, R.R. Effects of flame interaction on the rate of spread of heading and suppression fires in shrubland experimental fires. Int. J. Wildl. Fire 2012, 21, 950–960. [Google Scholar] [CrossRef]
  74. Fernandes, P.; Rego, F.C. Changes in fuel structure and fire behavior with heathland aging in northern Portugal. In Proceedings of the 13th Fire Forest Meteorology Conference, Lorne, Australia, 27–31 October 1996; 1998; pp. 433–436. [Google Scholar]
  75. Baeza, M.J.; Raventós, J.; Escarré, A. Structural changes in relation to age in prone Mediterranean shrublands. In Proceedings of the 3rd International Conference of Forest Fire Research, Luso, Portugal, 16–20 November 1998; Viegas, D.X., Ed.; Associação para o Desenvolvimento da Aerodinamica Industrial: Coimbra, Portugal, 1998; Volume II, pp. 2567–2578. [Google Scholar]
  76. Conroy, B. Fuel data for fire management. In Bushfire Management in Natural Areas; Conroy, B., Ed.; National Parks and Wildlife Service: Sydney, NSW, Australia, 1987; pp. 43–59. [Google Scholar]
  77. McFarland, D.C. Fire and the vegetation composition and structure of subtropical heathlands in southeastern Queensland. Aust. J. Bot. 1988, 36, 533–546. [Google Scholar] [CrossRef]
  78. Davies, G.M.; Legg, C.J.; Smith, A.A.; MacDonald, A.J. Rate of spread of fires in Calluna vulgaris-dominated moorlands. J. Appl. Ecol. 2009, 46, 1054–1063. [Google Scholar] [CrossRef]
  79. Fernandes, P. Fuel dynamics in Northern Portugal low shrubland. In Proceedings of the Workshop on Fire Ecology and the European Biota; European Commission: Brussels, Belgium, 1996. [Google Scholar]
  80. Marino, E.; Guijarro, M.; Hernando, C.; Madrigal, J.; Diez, C. Fire hazard after prescribed burning in a gorse shrubland: Implications for fuel management. J. Environ. Manag. 2011, 92, 1003–1011. [Google Scholar] [CrossRef]
  81. Marino, E.; Dupuy, J.L.; Pimont, F.; Guijarro, M.; Hernando, C.; Linn, R. Fuel bulk density and fuel moisture content effects on fire rate of spread: A comparison between FIRETEC model predictions and experimental results in shrub fuels. J. Fire Sci. 2012, 30, 277–299. [Google Scholar] [CrossRef]
  82. CEABN. Fireland. In Efeitos do Fogo sobre a Dinâmica da Vegetação à Escala da Paisagem em Portugal; FCT Project PTDC/AGR-CFL/104651/2008; CEABN-ISA: Lisbon, Portugal, 2013. [Google Scholar]
  83. MAPAMA. Los Incendios Forestales en España. Decenio 2001–2010. Available online: http://www.mapama.gob.es/es/desarrollo-rural/estadisticas/incendiosforestales2001-2010finalmod1_tcm7-349255.pdf (accessed on 16 November 2020).
  84. Marino, E.; Guijarro, M.; Madrigal, J.; Hernando, C.; Diez, C. Assessing fire propagation empirical models in shrub fuel complexes using wind tunnel data. WIT Trans. Ecol. Environ. 2008, 119, 121–130. [Google Scholar] [CrossRef] [Green Version]
  85. Fernandes, P.; Loureiro, C.; Botelho, H.; Ferreira, A.; Fernandes, M. Avaliação Indirecta da Carga de Combustível em Pinhal Bravo. Silva Lusit. 2002, 1, 73–90. [Google Scholar]
  86. Fernandes, P.; Loureiro, C.; Botelho, H. Fire behaviour and severity in a maritime pine stand under differing fuel conditions. Ann. For. Sci. 2004, 61, 537–544. [Google Scholar] [CrossRef] [Green Version]
  87. Gómez-Vázquez, I.; Crecente-Campo, F.; Diéguez-Aranda, U.; Castedo-Dorado, F. Modelling canopy fuel variables in Pinus pinaster Ait. and Pinus radiata D. Don stands in northwestern Spain. Ann. For. Sci. 2013, 70, 161–172. [Google Scholar] [CrossRef] [Green Version]
  88. Dieguez-Aranda, U.; Vargas, M.; Castedo, D.; Cano, J.; Barrio, A.; Abarzua, F.; González, M.; Juárez, C.; Rodriguez, R.; Lopez, F.; et al. Herramientas Selvícolas para la Gestión Forestal Sostenible en Galicia; Xunta de Galicia: Santiago de Compostela, Spain, 2009; Volume 82, ISBN 9788469273951. [Google Scholar]
  89. Ruiz-González, A.D.; Castedo-Dorado, F.; Vega, J.A.; Jiménez, E.; Fernández-Alonso, J.M.; Álvarez-González, J.G. Modelling canopy fuel dynamics of maritime pine stands in north-west Spain. Int. J. Wildl. Fire 2015, 24, 92–102. [Google Scholar] [CrossRef]
  90. Faias, S. Analysis of Biomass Expansion Factors for the Most Important Tree Species in Portugal. Master’s Thesis, Instituto Superior de Agronomia, Lisbon, Portugal, 2009. [Google Scholar] [CrossRef]
  91. Botequim, B.; Fernandes, P.M.; Garcia-Gonzalo, J.; Silva, A.; Borges, J.G. Coupling fire behaviour modelling and stand characteristics to assess and mitigate fire hazard in a maritime pine landscape in Portugal. Eur. J. For. Res. 2017, 136, 527–542. [Google Scholar] [CrossRef]
  92. Botequim, B.; Fernandes, P.M.; Borges, J.G.; González-Ferreiro, E.; Guerra-Hernández, J. Improving silvicultural practices for Mediterranean forests through fire behaviour modelling using LiDAR-derived canopy fuel characteristics. Int. J. Wildl. Fire 2019, 28, 823–839. [Google Scholar] [CrossRef]
  93. Molina, J.R.; Rodriguez y Silva, F.; Herrera, M.A. Comportamiento potencial del fuego de copas en masas de pinus pinea bajo diferentes tratamientos selvícolas. For. Syst. 2011, 20, 266–277. [Google Scholar] [CrossRef] [Green Version]
  94. Balboa-Murias, M.A.; Rodríguez-Soalleiro, R.; Merino, A.; Álvarez-González, J.G. Temporal variations and distribution of carbon stocks in aboveground biomass of radiata pine and maritime pine pure stands under different silvicultural alternatives. For. Ecol. Manag. 2006, 237, 29–38. [Google Scholar] [CrossRef]
  95. Ruiz-González, A.D.; Álvarez-González, J.G. Canopy bulk density and canopy base height equations for assessing crown fire hazard in Pinus radiata plantations. Can. J. For. Res. 2011, 41, 839–850. [Google Scholar] [CrossRef]
  96. Fernández-Alonso, J.M.; Alberdi, I.; Álvarez-González, J.G.; Vega, J.A.; Cañellas, I.; Ruiz-González, A.D. Canopy fuel characteristics in relation to crown fire potential in pine stands: Analysis, modelling and classification. Eur. J. For. Res. 2013, 132, 363–377. [Google Scholar] [CrossRef]
  97. Reinhardt, E.; Scott, J.; Gray, K.; Keane, R. Estimating canopy fuel characteristics in five conifer stands in the western United States using tree and stand measurements. Can. J. For. Res. 2006, 36, 2803–2814. [Google Scholar] [CrossRef]
  98. Plucinski, M.P. The Investigation of Factors Governing Ignition and Development of Fires in Heathland Vegetation. Ph.D. Thesis, University of New South Wales, Canberra, Australia, 2003. [Google Scholar]
  99. Catchpole, W.R. Heathland Fuel and Fire Modelling. Ph.D. Thesis, University of New South Wales, Canberra, Australia, 1987. [Google Scholar]
Figure 1. Schematic representation of a two-layer forest, including a tree canopy layer with height or length (CL) and a shrub layer with height (SH).
Forests 13 00555 g001
Figure 2. Dependency of Shrub Layer Bulk Density (SLBD) on the different independent variables. Numbers indicate the corresponding equations. Green boxes represent variables from National Forest Inventories. Blue boxes are ancillary variables and parameters from supplementary work estimated for each shrub type. White boxes are intermediate results. The yellow box represents the final output for fire behavior simulations.
Forests 13 00555 g002
Figure 3. Schematic representation of the geometry of a tree, showing the variables associated.
Forests 13 00555 g003
Figure 4. Stand geometry based on the mean distance between trees considering a squared grid.
Forests 13 00555 g004
Figure 5. Dependency of Canopy Layer Bulk Density (CLBD) on the different independent variables. Numbers indicate the corresponding equations. Green boxes represent variables from Forest Inventories. Blue boxes are ancillary variables and parameters from supplementary work estimated for each forest type. White boxes are intermediate results. The yellow box represents the final output for fire behavior simulations.
Forests 13 00555 g005
Figure 6. Mean Shrub Bulk Density ( S B D ¯ , in kg m−3) for the 10 shrub types in the Iberian Peninsula. The numbers on the x-axis correspond to the codes of each shrub type (140, 150, 160 = Machias, terebinthus, garrigues; 170, 180 = Quercus coccifera and Pistacia lentiscus; 210 = Heathers, Ericaceae shrubs and related groups; 220a = Small size Cistaceae shrubs; 220b = Big size Cistaceae shrubs; 230 = Mixture of broom leguminous shrubs; 240 = Ulex spp. shrubs and related groups; 250a = Rosmarinus officinalis; 250 = Lavandula spp., Rosmarinus officinalis, Thymus spp. shrubland and Phlomis purpurea; 34 = Ampelodesmos spp. and other grasses).
Forests 13 00555 g006
Figure 7. The variation of Shrub Bulk Density (SBD) for the 10 shrub types depending on shrub height (SH) (ad). The numbers on the legend correspond to the codes of each shrub type (140, 150, 160 = Machias, terebinthus, garrigues; 170, 180 = Quercus coccifera and Pistacia lentiscus; 210 = Heathers, Ericaceae shrubs and related groups; 220a = Small size Cistaceae shrubs; 220b = Big size Cistaceae shrubs; 230 = Mixture of broom leguminous shrubs; 240 = Ulex spp. shrubs and related groups; 250a = Rosmarinus officinalis; 250 = Lavandula spp., Rosmarinus officinalis, Thymus spp. shrubland and Phlomis purpurea; 34 = Ampelodesmos spp. and other grasses).
Forests 13 00555 g007
Figure 8. Crown Length (CL) of a 10 m tall tree (HT = 10 m) as a function of reference distance to neighbor tree (DIST): conifers and eucalypts (a), and oaks and other broadleaves (b).
Forests 13 00555 g008
Figure 9. Crown diameter (CD) as a function of Diameter at Breast Height (DBH) for a reference distance (DIST) of 5 m: conifers and eucalypts (a), and oaks and other broadleaves (b).
Forests 13 00555 g009
Figure 10. Crown diameter (CD) of a tree with 20 cm of Diameter at Breast Height (DBH) as a function of a reference distance (DIST) to neighbor trees: conifers and eucalypts (a), and oaks and other broadleaves (b).
Forests 13 00555 g010
Figure 11. Crown Leaf Biomass (CLB, in kg) as a function of diameter at breast height (DBH): conifers and eucalypts (a), and oaks and other broadleaves (b).
Forests 13 00555 g011
Figure 12. Mean values of tree Crown Bulk Density (CBD, in kg m−3) and Canopy Layer Bulk Density (CLBD, in kg m−3) for the tree species/groups in the Iberian Peninsula.
Forests 13 00555 g012
Figure 13. Geographical distribution of the tree species/groups in the Iberian Peninsula according to NFIs data.
Forests 13 00555 g013
Figure 14. Values of (a) tree Crown bulk density (CBD) and (b) Canopy Layer Bulk Density (CLBD) per NFIs plots in the Iberian Peninsula.
Forests 13 00555 g014
Table 1. Parameters of Equation (6) to estimate Shrub Bulk Density (SBD) for each of the 10 shrub types defined by Pasalodos-Tato et al. [27] (the second column contains the codes for each of the 10 shrub types), including foliage and small branches, from mean Shrub Height ( S H ¯ ) and mean Shrub Bulk Density ( S B D ¯ ).
Shrub TypesCodes [27]Number of Plots S H ¯ (cm) S B D ¯ (kg m−3) Coefficient for the
Dependency on Height
(c −1 )
R2
Machias, terebinthus, garrigues140, 150 and 160521141.68−0.3580.61
Quercus coccifera and Pistacia lentiscus170 and 180921283.23−0.3430.51
Heathers, Ericaceae shrubs and related groups210711343.08−0.1660.74
Small size Cistaceae shrubs220a27852.25−1.0300.52
Big size Cistaceae shrubs220b1441412.530.0790.62
Mixture of broom leguminous shrubs230481281.880.3240.58
Ulex spp. shrubs and related groups240691292.20−0.2010.48
Rosmarinus officinalis250a751271.860.7690.66
Lavandula spp., Rosmarinus officinalis, Thymus spp. shrubland and Phlomis purpurea250b105522.26−0.7770.36
Ampelodesmos spp. and other grasses3425891.46−0.7910.45
Table 2. Parameter estimates and coefficients of determination for the tree species or group of species obtained fitting Equation (12) to model Crown Length (CL) as a function of a reference distance (DIST).
Species/GroupSample Sizea0a1R2
Pinus pinaster43820.5890.0510.377
Pinus pinea12730.6260.0240.416
Pinus halepensis56620.4550.0590.588
Pinus sylvestris46570.4510.0900.489
Other conifers49560.3690.0610.556
Eucalypts12630.6620.0390.258
Quercus suber460.4900.0140.874
Quercus ilex s.l.6210.4780.0640.724
Quercus pyrenaica12040.3790.0340.691
Other oaks14310.3840.0260.724
Castanea sativa1220.3570.0270.798
Other broadleaves3020.2670.0260.742
Table 3. Parameter estimates and coefficients of determination for the species of trees or groups of species obtained fitting Equation (15) to estimate Crown Diameter (CD) from stem Diameter at Breast Height (DBH) and reference Distance (DIST).
Species/GroupSample Sizeb0b1b2R2
Pinus pinaster38,3110.2250.8510.0780.725
Pinus pinea91470.2770.8590.0430.808
Pinus halepensis35,1940.4210.7310.0520.675
Pinus sylvestris27,9610.5270.6500.0470.627
Other conifers35,5420.4160.7050.0350.649
Eucalypts93590.2560.8430.0780.719
Quercus suber87150.3620.7580.0880.700
Quercus ilex s.l.38,4240.5790.6400.0780.742
Quercus pyrenaica11,6600.6080.6380.0390.629
Other oaks19,9040.6790.6340.0360.651
Castanea sativa45631.2360.4550.0600.592
Other broadleaves12,3360.5850.6900.0510.644
Table 4. Parameter estimates and coefficients of determination for the tree species or groups of species, obtained fitting Equation (16), relating Crown Leaf Biomass (CLB) and Diameter at Breast Height (DBH).
Species/Groupc0c1R2Source of Data
Pinus pinaster0.01972.1300.760Lopes [52]
Pinus pinea0.01842.1590.937Montero et al. [51]
Pinus halepensis0.02541.8110.843Mitsopoulos and Dimitrakopoulos [54]
Pinus sylvestris0.10811.5100.625Montero et al. [51]
Other conifers0.00782.0580.739Pinus radiata in Montero et al. [51]
Eucalypts0.13491.6180.859Montero et al. [51]
Quercus suber0.00332.1450.648Montero et al. [51]
Quercus ilex s.l.0.01761.9730.850Montero et al. [51]
Quercus pyrenaica0.00401.8880.830Mendes et al. [53]
Other oaks0.01971.9680.884Quercus faginea in Montero et al. [51]
Castanea sativa0.00402.2960.856Leonardi et al. [55]
Other broadleaves0.03861.5960.727Populus euroamericana in Montero et al. [51]
Table 5. Tree species or group of species used for the estimation of the tree Crown Bulk Density (CBD, in kg m−3) and Canopy Layer Bulk Density (CLBD, in kg m−3), with the indication of the sample size and stand variables in the Iberian Peninsula (mean values and standard deviation in parenthesis). DBH = tree diameter; G = stand basal area.
Species/GroupSample SizeDBH
(cm)
HT
(m)
NHA
(Trees ha−1)
G
(m2 ha−1)
CBD
(kg m−3)
CLBD
(kg m−3)
PortugalSpain
Pinus pinaster1423736919.2 (10.1)11.1 (4.2)739 (806)18.2 (13.3)0.191 (0.072)0.073 (0.060)
Pinus pinea165215222.2 (11.8)8.3 (2.9)406 (460)11.9 (8.7)0.195 (0.065)0.070 (0.050)
Pinus halepensis8926418.5 (7.3)7.8 (2.5)422 (420)9.5 (7.6)0.073 (0.019)0.026 (0.019)
Pinus sylvestris14605318.5 (7.7)10.2 (3.6)909 (796)22.5 (14.2)0.115 (0.038)0.075 (0.039)
Other conifers22631219.4 (9.7)10.2 (5.1)744 (686)18.6 (13.8)0.048 (0.016)0.023 (0.014)
Eucalyptus globulus1059281613.3 (6.8)14.3 (4.9)881 (964)12.9 (11.3)0.217 (0.101)0.073 (0.080)
Quercus suber1051292724.6 (16.2)6.5 (2.7)244 (461)7.1 (7.2)0.039 (0.086)0.011 (0.063)
Quercus ilex s.l.82810,76825.9 (17.2)6.3 (1.7)356 (555)6.7 (6.0)0.082 (0.018)0.027 (0.023)
Quercus pyrenaica144320117.6 (12.5)8.7 (2.9)686 (720)11.3 (9.9)0.010 (0.003)0.005 (0.004)
Other oaks58343120.4 (15.9)8.9 (4.1)584 (669)11.8 (10.5)0.059 (0.021)0.029 (0.021)
Castanea sativa3675828.4 (25.9)11.0 (3.4)689 (923)20.7 (17.4)0.035 (0.039)0.019 (0.020)
Other broadleaves67249927.2 (15.9)15.1 (5.4)584 (606)23.1 (13.0)0.022 (0.008)0.017 (0.008)
Publisher’s Note: MDPI stays neutral with regard to jurisdictional claims in published maps and institutional affiliations.

