Article

Effects of Moisture and Temperature on Soil Organic Carbon Decomposition along a Vegetation Restoration Gradient of Subtropical China

1
College of Resources and Environment, Fujian Agriculture and Forestry University, Fuzhou 350002, China
2
College of Land Resources and Environment, Jiangxi Agricultural University, Nanchang 330045, China
3
Fujian Academy of Forestry Science, Fuzhou 350012, China
4
College of Forestry, Fujian Agriculture and Forestry University, Fuzhou 350002, China
*
Author to whom correspondence should be addressed.
Forests 2022, 13(4), 578; https://doi.org/10.3390/f13040578
Submission received: 27 February 2022 / Revised: 30 March 2022 / Accepted: 4 April 2022 / Published: 6 April 2022
(This article belongs to the Section Forest Soil)

Abstract

:
Vegetation restoration can affect the process of soil organic carbon (SOC) decomposition, but how this effect is related to soil moisture and temperature remains uncertain. Thus, we performed an incubation of 120 days using soils of degraded land, plantation forest, and secondary natural forest, at two levels of temperature under two moisture levels. We found that the amount of cumulative SOC decomposition in the plantation and secondary natural forest soil was ca. 11.7 times higher than that in the soil from degraded land. Higher soil moisture and temperature treatment increased SOC decomposition in the plantation and secondary natural forest soils. However, in the soil from degraded land, higher soil moisture did not increase SOC decomposition, and higher temperature only increased SOC decomposition in the 60%WHC treatment. The amount of cumulative SOC decomposition was positively correlated with soil MBC and DOC content. The responses of SOC decomposition and the decomposability of DOC to moisture and temperature along the vegetation restoration gradient were highly consistent. Furthermore, in the 60%WHC treatment group, the temperature sensitivity (Q10) of SOC decomposition declined with vegetation restoration age increase. Higher soil moisture did not affect Q10 in the plantation and secondary natural forest soil, but increased Q10 in the soil from degraded land. Our results indicate that higher soil temperature and moisture would stimulate SOC decomposition, but it is highly dependent on labile carbon supply and microbial metabolic activity along the vegetation restoration gradient.

1. Introduction

Soil is the largest carbon pool in terrestrial ecosystems, and a small change in the soil carbon pool has a great impact on atmospheric CO2 and global climate change [1,2,3]. Since the middle of the 20th century, vegetation restoration has been expanding worldwide due to environment protection programs and policy incentives, which have substantially contributed to soil carbon sequestration [4,5]. Studies have shown that soil pH decreased, and the quantity of available substrates, and the microbial community, remarkably developed, with vegetation restoration age increase [5,6,7]; nevertheless, how these changes affect the decomposition of SOC under the background of global climate change is not clear. Knowledge of SOC decomposition along vegetation restoration processes is imperative for better management of degraded ecosystems under future climate scenarios [3,8].
It is well known that the decomposition of soil organic carbon (SOC) is related to soil available substrate, microbial community and activities, as well as climate and soil properties, such as moisture, temperature status, and soil texture [9,10,11,12,13]. Previous studies indicated that higher SOC and nutrient contents usually led to a higher amount of SOC decomposition [12,13,14]. However, due to the higher labile carbon content in the plantation forest used in their study, which could support more populations of microbes, Huang et al. [15] found that SOC decomposition was greater in the plantation forest than that in the natural forest. There are also some incubation experiments that have revealed that the fluxes of CO2 released from SOC decomposition were positively correlated with dissolved organic carbon (DOC) [16,17]. Meanwhile, other studies have shown that SOC decomposition slows as soil clay content increases [18], and soil clay content also affects the supply of available substrates in the short term [19]. In addition to soil available substrate and texture, microbes also play an important role in soil C decomposition [20]. As a result of microbial metabolism, the decomposition of soil carbon is highly dependent on the composition and activity of soil microbes [21,22]. Thus, the biochemical complexity of soils along the vegetation restoration gradient would undoubtedly lead to changes in the SOC decomposition.
Among the factors affecting SOC decomposition, soil temperature and moisture have been the focus of many experimental and modeling studies of soil carbon dynamics under the scenario of global climate change [10,15,23]. Soil moisture strongly affects SOC decomposition through soil aeration, substrate supply, and microbial activity [10,24,25]. Generally, the optimum soil moisture for SOC decomposition is usually at intermediate level, and the SOC decomposition rate would decrease above or below this level [10,26]. Meanwhile, results from many studies have shown that rising temperature can stimulate SOC decomposition by increasing the soil extracellular enzyme activity and the microbial consumption rate of available substrates [11,20,23]. On the contrary, some studies have found negative soil respiration responses to warming due to substrate or moisture limitation [27,28]. Thus, in addition to the fact that changes in carbon substrate and the microbial community, caused by vegetation restoration, may lead to uncertain levels of SOC decomposition [11,12,13], climate warming and precipitation change, as a consequence of climatic change, further complicates the moisture and temperature responses of SOC decomposition along the vegetation restoration gradient [25,29,30].
While it is well known that soil substrate, moisture, and temperature are all strong controlling factors in SOC decomposition [10,25,31,32], limited understanding of their interactive effects constrains our ability to predict soil carbon fluxes under future climate conditions. In this study, we investigated SOC decomposition using soils of degraded land, plantation forest, and secondary natural forest, at two temperature levels (18 °C and 28 °C), under two levels of moisture, measured in terms of water holding capacity (30%WHC and 60%WHC). On the basis of our knowledge, we predicted that (1) greater SOC decomposition would occur with vegetation restoration age increase; (2) the effects of soil moisture and temperature on SOC decomposition would be determined by soil substrate supply along the vegetation restoration gradient; (3) with the vegetation restoration age increase, the Q10 value would be decrease and exhibit less sensitivity to soil moisture changes.

2. Materials and Methods
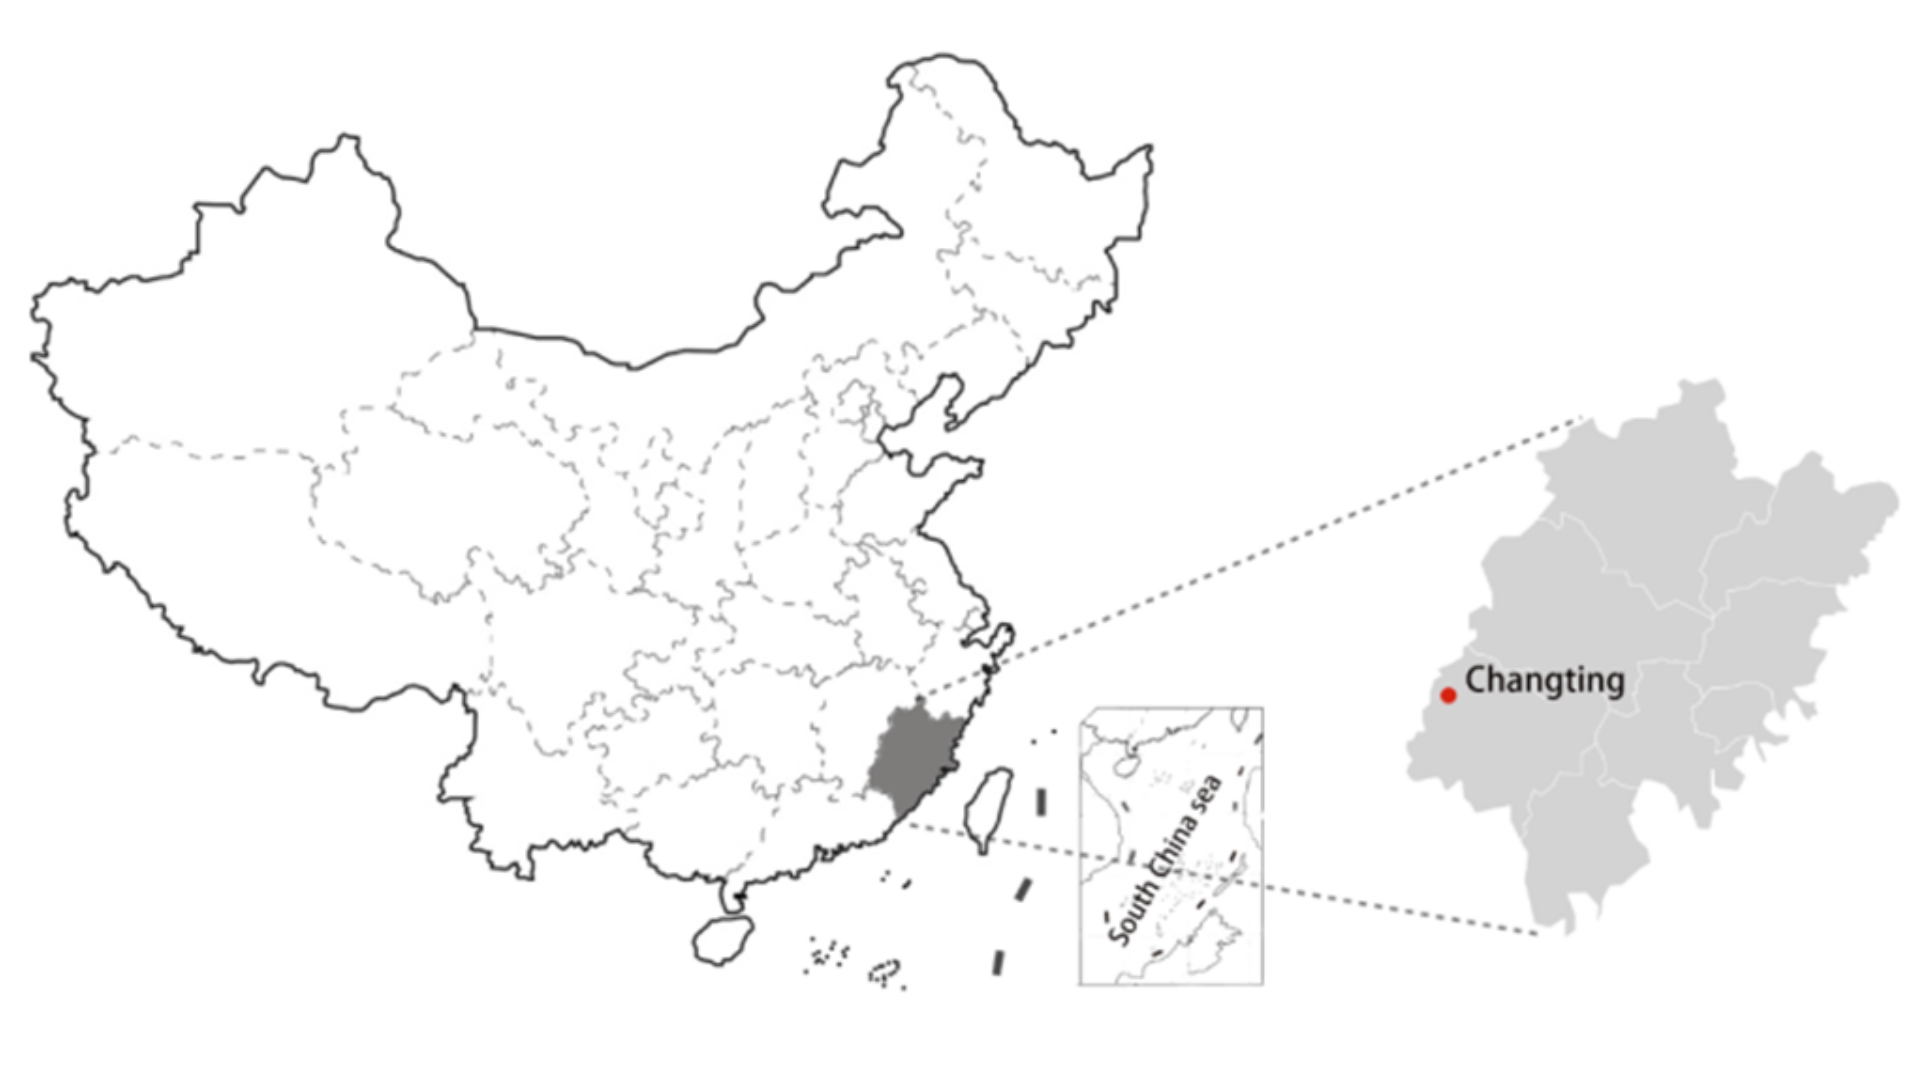
2.1. Study Site

We collected soil samples from a typical vegetation restoration area (116°18′–116°31′ E, 25°33′–25°48′ N) of Changting County, Fujian province in subtropical China (Figure 1). This area has a typical subtropical monsoon climate, with mean annual temperature and rainfall of 18.3 °C and 1730 mm, respectively. The soil of the study site is red soil, equivalent to udults in the USDA soil classification system [33]. Due to overcutting, forest degradation in this area was very serious in the middle of the last century. Since the 1970s, the government began to organize vegetation restoration projects, which led to a notable increase in the vegetation coverage rate [4].

2.2. Soil Sampling and Preparation

We collected soils from three vegetation restoration stages, namely degraded land, plantation forest, and secondary natural forest. Currently, there are almost no serious degraded lands in Changting County. Therefore, the soil of degraded land was collected from a small vegetation degradation site, where it was protected by the local government for the purposes of science, education, and recreation. At the degraded land site, soil erosion is severe, and there is almost no plant life except for several shrubs distributed sporadically. The plantation forest soil was collected from a plantation forest which was restored in 1998. The absolute dominant species of the plantation forest is Pinus massoniana Lamb. We collected the secondary natural forest soil from a secondary natural forest (age >70 years), which was protected as a “fengshui” site by the local peasants and monks. The dominant species in the secondary natural forest are Schima superba Gardn. et Champ., Liquidambar formosana Hance, Syzygium grijsii (Hance) Merr. et Perry, and Ilex pubescens Hook. et Arn.
At each vegetation restoration site, three 10 m × 10 m plots were randomly selected. The slope, parent material, and topography of all sites are similar, and the distance between each site is less than 10 km. Soils from the top 0–10 cm layer were collected from five subplots (1 m × 1 m) of each plot, in April 2017. In addition, from each subplot, three soil samples were collected. Before sampling, the litter layer was excluded. All soil samples from the same plot were mixed into a composite sample and stored in a sterile plastic container. Soil samples were then transported to the laboratory immediately. After stones and other visible plant debris were removed; soil samples were passed through a 2 mm mesh and homogenized. Then, three soil samples of each vegetation restoration site were used to determine chemical and physical properties and phospholipid fatty acid (PLFA) content. Prior to the incubation experiment, we stored the other soil samples at 4 °C for several weeks.

2.3. Soil Properties and PLFA Analyses

Soil pH was determined using a soil: water ratio of 1: 2.5. An elemental analyzer (EuroVector, EA3000, Milan, Italy) was used to determine the contents of SOC and total nitrogen. After soil samples were digested with perchloric acid and hydrofluoric acid, total phosphorous was measured using a photometric method. Soil MBC content was determined using chloroform fumigation–extraction following the developed method of Brookes et al. [34]. The extractable carbon from the unfumigated samples was considered as DOC. Particulate organic carbon (POC) content was determined using a method based on that of Fang et al. [20].
The method for the determination of PLFAs was an improvement of that described by Bossio and Scow [35]. PLFAs were extracted from 8 g of freeze-dried soil using a mixture of chloroform, methanol, and citrate buffer. Subsequently, the extracted fatty acid methyl esters were analyzed based on the procedures described by Fang et al. [20,36]. Total PLFAs was estimated by summing all of the determined PLFAs. PLFAs of Gram-positive bacteria were identified by15:0a, 15:0i, 16:0i, 17:0a, and 17:0i; Gram-negative bacteria were represented by 17:0cy, 19:0cy, 16:1ω7c, and 18:1ω7c. Fungi were identified by 18:1ω9c, 18:2ω6, 9c, and 18:3ω6c. The abundance of PLFAs was calculated from the amount of carbon, and then converted into the molar percentage of PLFA-C.

2.4. Soil Incubation Experiment

Soil samples were incubated under two soil moisture (30%WHC, representing an extreme dry condition, and 60%WHC, close to the optimum soil moisture for microbes) and two temperature (18 °C, close to the annual mean temperature of the sampling site, and 28 °C, for the purpose of obtaining Q10 values) [14,37] regimes for 120 days. Such a design produced 12 treatment combinations with 9 replicates per combination (3 vegetation stages × 2 moisture regimes × 2 temperature regimes × 9 replicates). During the experiment, three replicates were collected from each treatment at day 15, 45, and 120 after the start of the incubation. Each incubated soil sample (equivalent to 50 g dry weight) was placed in a 250 mL Erlenmeyer flask covered by a seal, which had small holes to maintain gas exchange, in order to reduce evaporation. Soil moisture of each sample was adjusted to the designed contents by injecting distilled water slowly into the sample surface to ensure uniform moisture penetration. Incubation samples were first pre-incubated at 23 °C for 7 days to minimize the “plus effect”, and then placed into incubators set at 18 and 28 °C. To maintain stable soil moisture levels, we checked and adjusted the soil water content every 4–5 days by weighing the soil. In the incubators, a certain amount of air was introduced through the air compressor to avoid anaerobic conditions [38].
During the incubation period, three replicates of each treatment were used to measure soil CO2 evolution at days 1, 3, 5, 7, 10, 15, 20, 30, 45, 70, 95, and 120. In order to standardize the initial CO2 concentration of the incubation flask before each measurement, we used compressed air to flush the headspace for ca. 60 s [38]. Needle cylinders were used to collect gas samples immediately after closing the flask, and 30 min later, from the headspace. Gas samples were stored in aluminum foil bags, and the CO2 concentration was measured by gas chromatography (7890B, Agilent, Santa Clara, CA, USA) within 24 h. The gas chromatograph was calibrated with standard gases of four different CO2 concentrations. In accordance with Huang et al. [15], the SOC decomposition rate (R) was determined by Equation (1):
R = 22.4 × v/m × Δct × 273/(273 + T) × Cmass
where v is the total volume of incubation flask minus soil volume, m represents soil dry weight, Δct is the average CO2 concentration difference per hour, T represents temperature of the incubation, and Cmass represents the molar mass of carbon. The ideal gas law was used to determine the molar volume of CO2.
The cumulative amount of SOC decomposition (Cm) was estimated by the following equation:
Cm = Cm−1+ (Rp + Rp−1)/2 × (D − D−1)
where R, p, and D are SOC decomposition rate per day, incubation period, and incubation time (day), respectively. We calculated the Q10 of SOC decomposition during the incubation as follows [14,22,37,39]:
Q 10 = t c / t w 10 / T w T c
where tc and tw represent the times that were required to decompose a given amount of soil carbon at 18 °C (Tc) and 28 °C (Tw) during incubation.
Additionally, three incubation samples were collected from each treatment at day 15, 45, and 120 from the start of the incubation. Each soil sample was divided into two parts, after being passed through a 2 mm sieve. One part was stored at 4 °C for the determination of soil water content, MBC, and DOC content. The other part was freeze-dried and used for the determination of PLFAs, as mentioned above. The metabolic quotient (qCO2) and the decomposability of DOC (Rh: DOC) were calculated by dividing the Cm by the corresponding MBC and DOC, respectively.

2.5. Statistical Analysis

Data that did not meet the assumptions of normality and homogeneity of variance were logarithmically transformed before analysis. A one-way analysis of variance (ANOVA) was used to test the differences between soil properties among the three vegetation restoration stages. A three-way ANOVA was used to test the effects of vegetation restoration, moisture, temperature, and their interactions on cumulative SOC decomposition, MBC, DOC, qCO2, Rh: DOC, and microbial composition. A two-way ANOVA was used to test the effects of soil moisture, temperature, and their interaction on cumulative SOC decomposition, MBC, DOC, qCO2, Rh: DOC, and microbial composition in each vegetation restoration stage, as well as to test the effects of vegetation restoration, moisture, and their interaction on Q10. Individual treatment means within each moisture and temperature regime under the same vegetation restoration stage were compared using Duncan’s multiple range tests. We used regressions to explore the relationships between SOC decomposition, and MBC and DOC contents. Data analyses were conducted using SAS software 9.2 (SAS Institute Inc., Cary, NC, USA), and statistical significance was set at p < 0.05.

3. Results

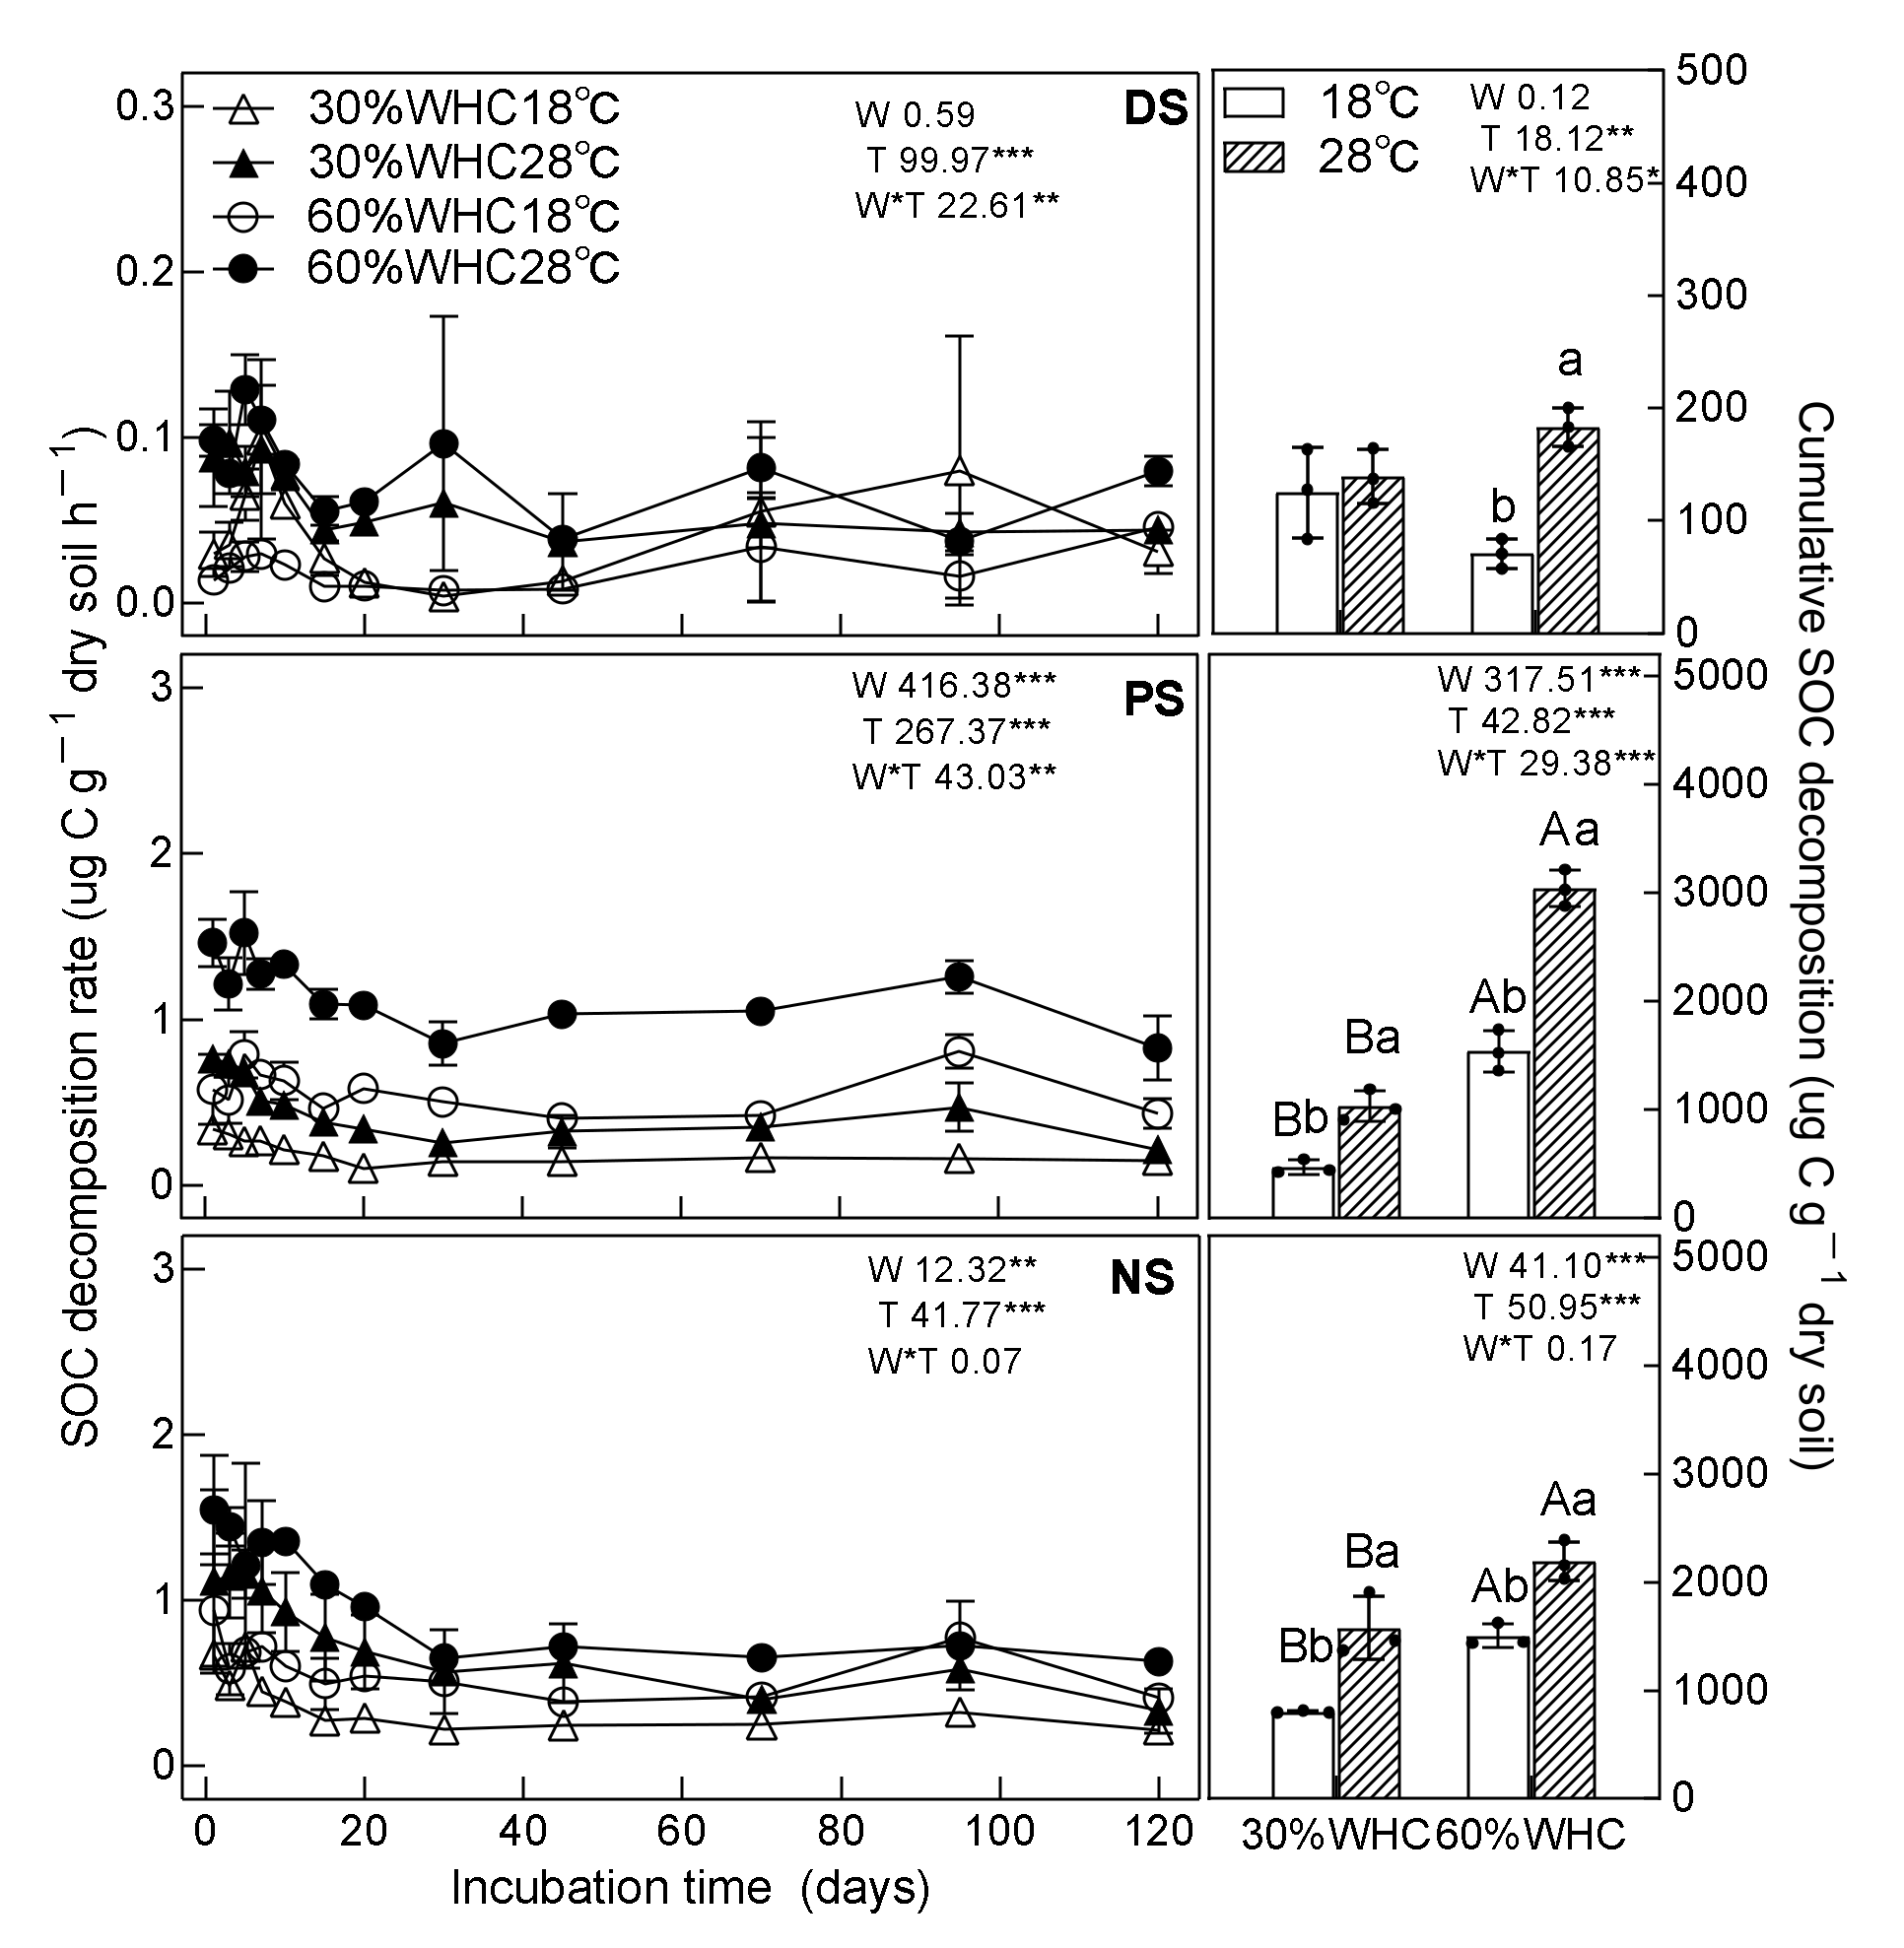
3.1. SOC Decomposition

After 120 days of incubation, the amount of cumulative SOC decomposition was significantly affected by vegetation restoration, moisture, temperature, and their interactions (Figure 2, Table 1). Cumulative SOC decomposition was significantly higher in the plantation forest (1522.7 μg CO2-C g−1 dry soil) and secondary natural forest soil (1521.3 μg CO2-C g−1 dry soil) than in the soil of degraded land (129.5 μg CO2-C g−1 dry soil). Both higher soil moisture and temperature treatments led to significantly higher SOC decomposition in the secondary natural forest and plantation forest soils (Figure 2). However, in the soil from degraded land, higher soil moisture treatment had little effect on SOC decomposition, and higher soil temperature only increased (p < 0.001) SOC decomposition in the 60%WHC treatment.

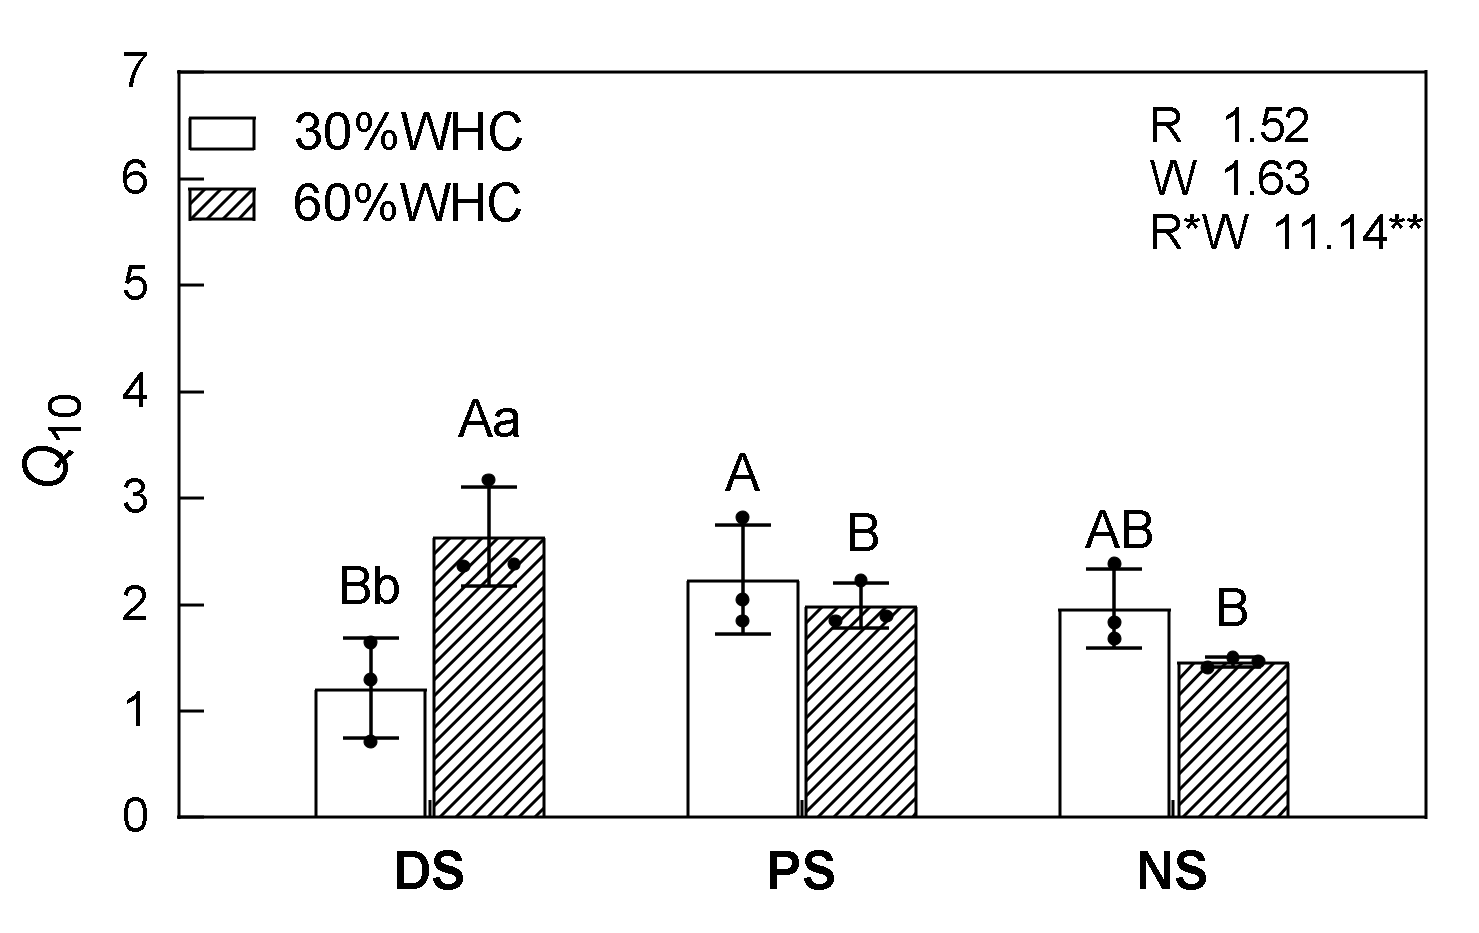
3.2. Temperature Sensitivity

Overall, vegetation restoration and soil moisture had no significant effect on Q10 (Figure 3); however, we detected a significant interaction between the two factors (p < 0.01). We found that Q10 was significantly higher in the soil from degraded land than in the plantation forest and secondary natural forest soil in the 60%WHC treatment, although Q10 was significantly lower in the soil from degraded land than in the plantation forest soil at the 30%WHC treatment. Soil moisture did not markedly influence Q10 in the plantation and secondary natural forest soil, but Q10 was higher (p < 0.05) in the 60%WHC treatment than in the 30%WHC treatment in the soil from degraded land.

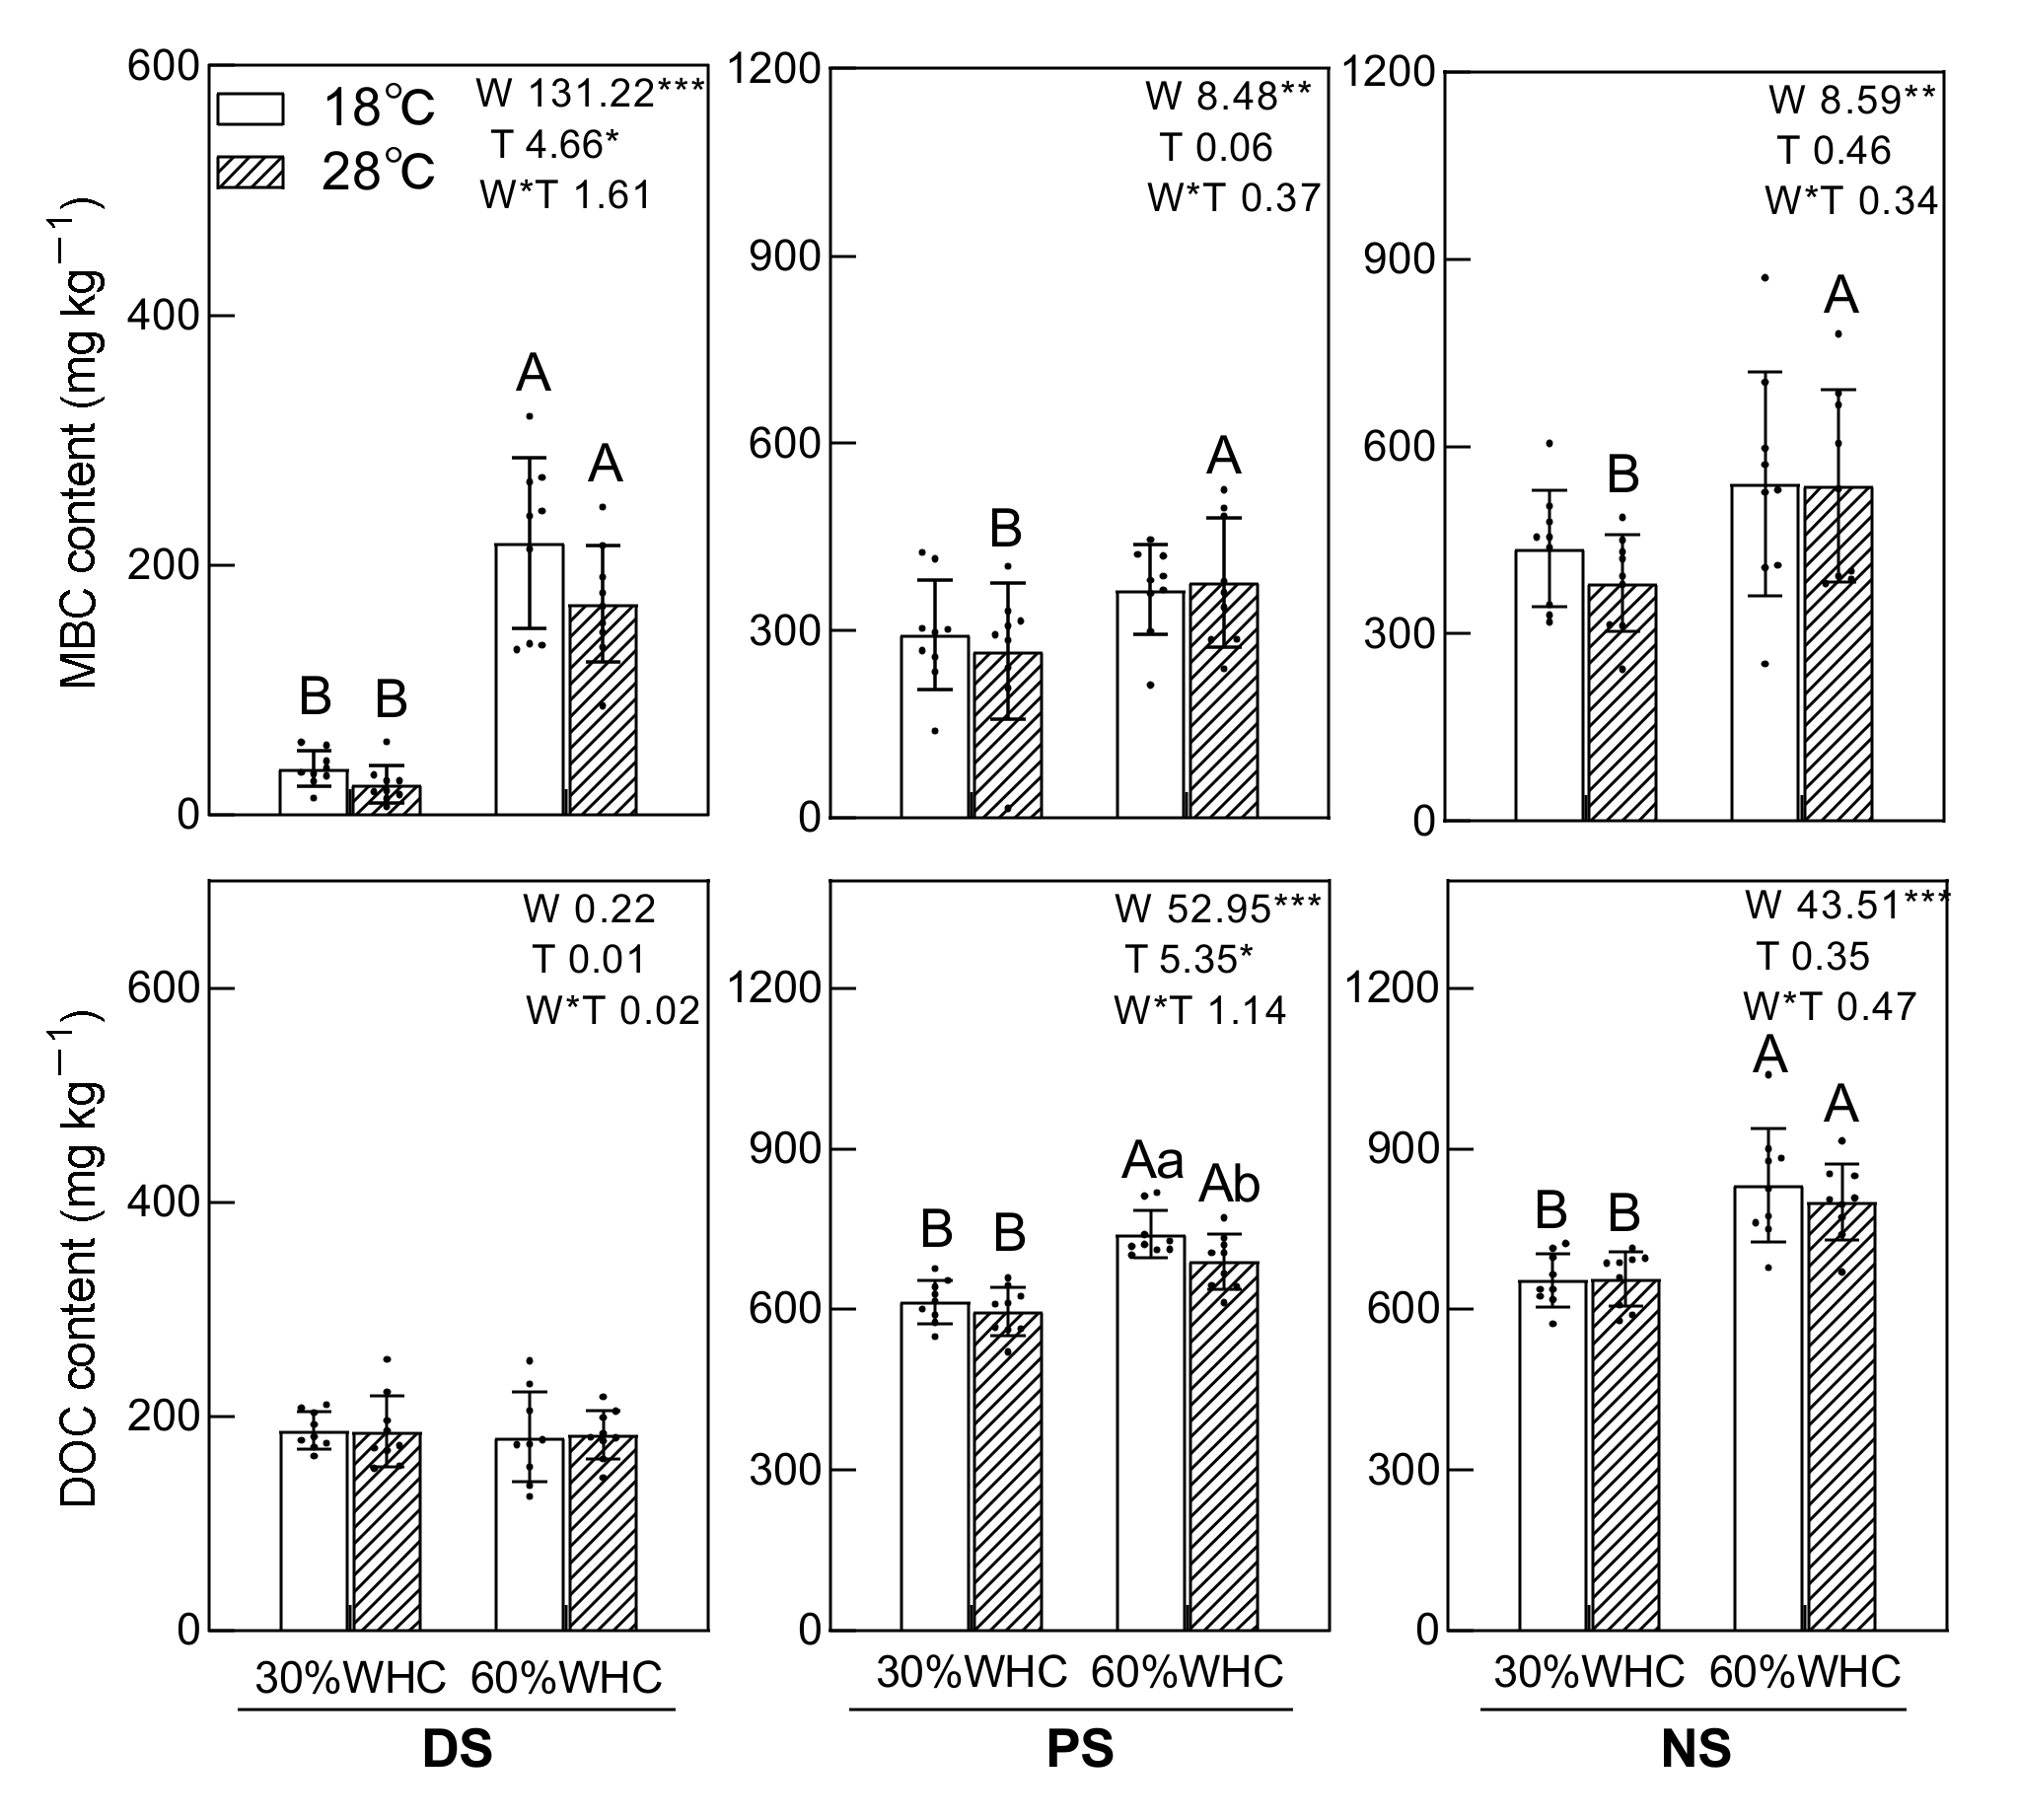
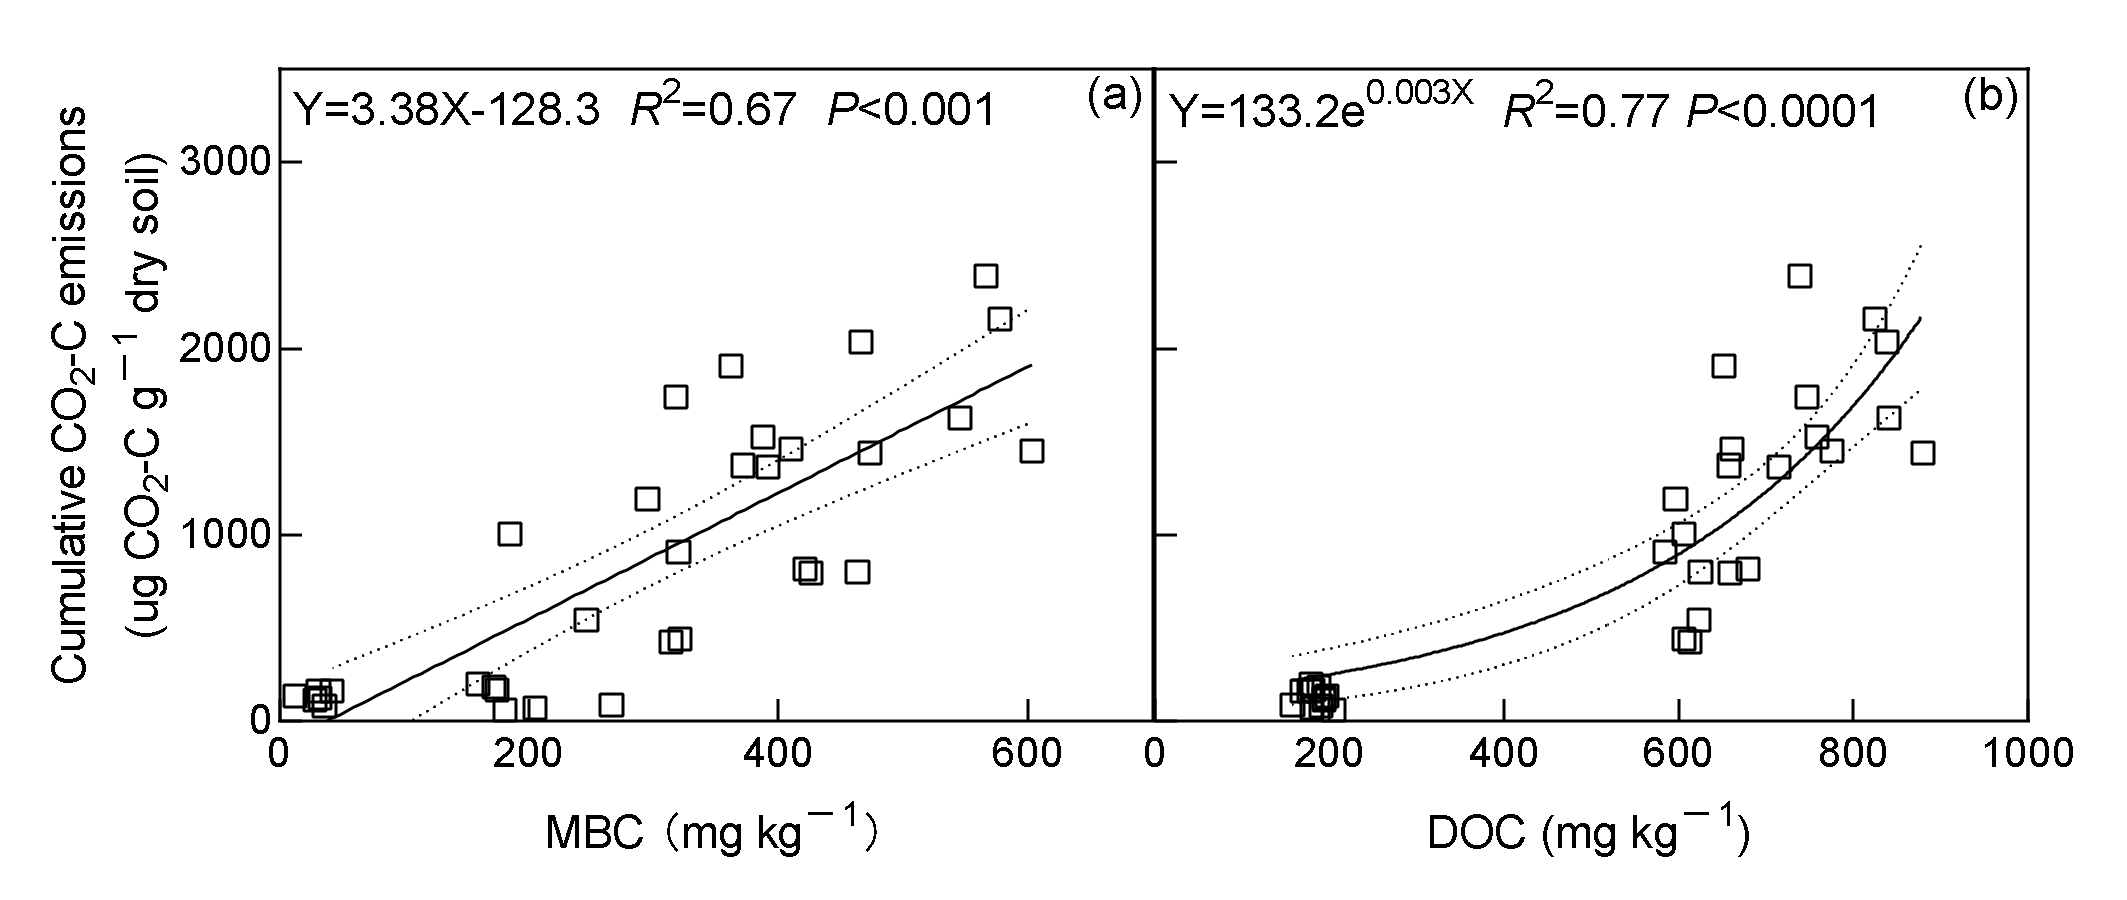
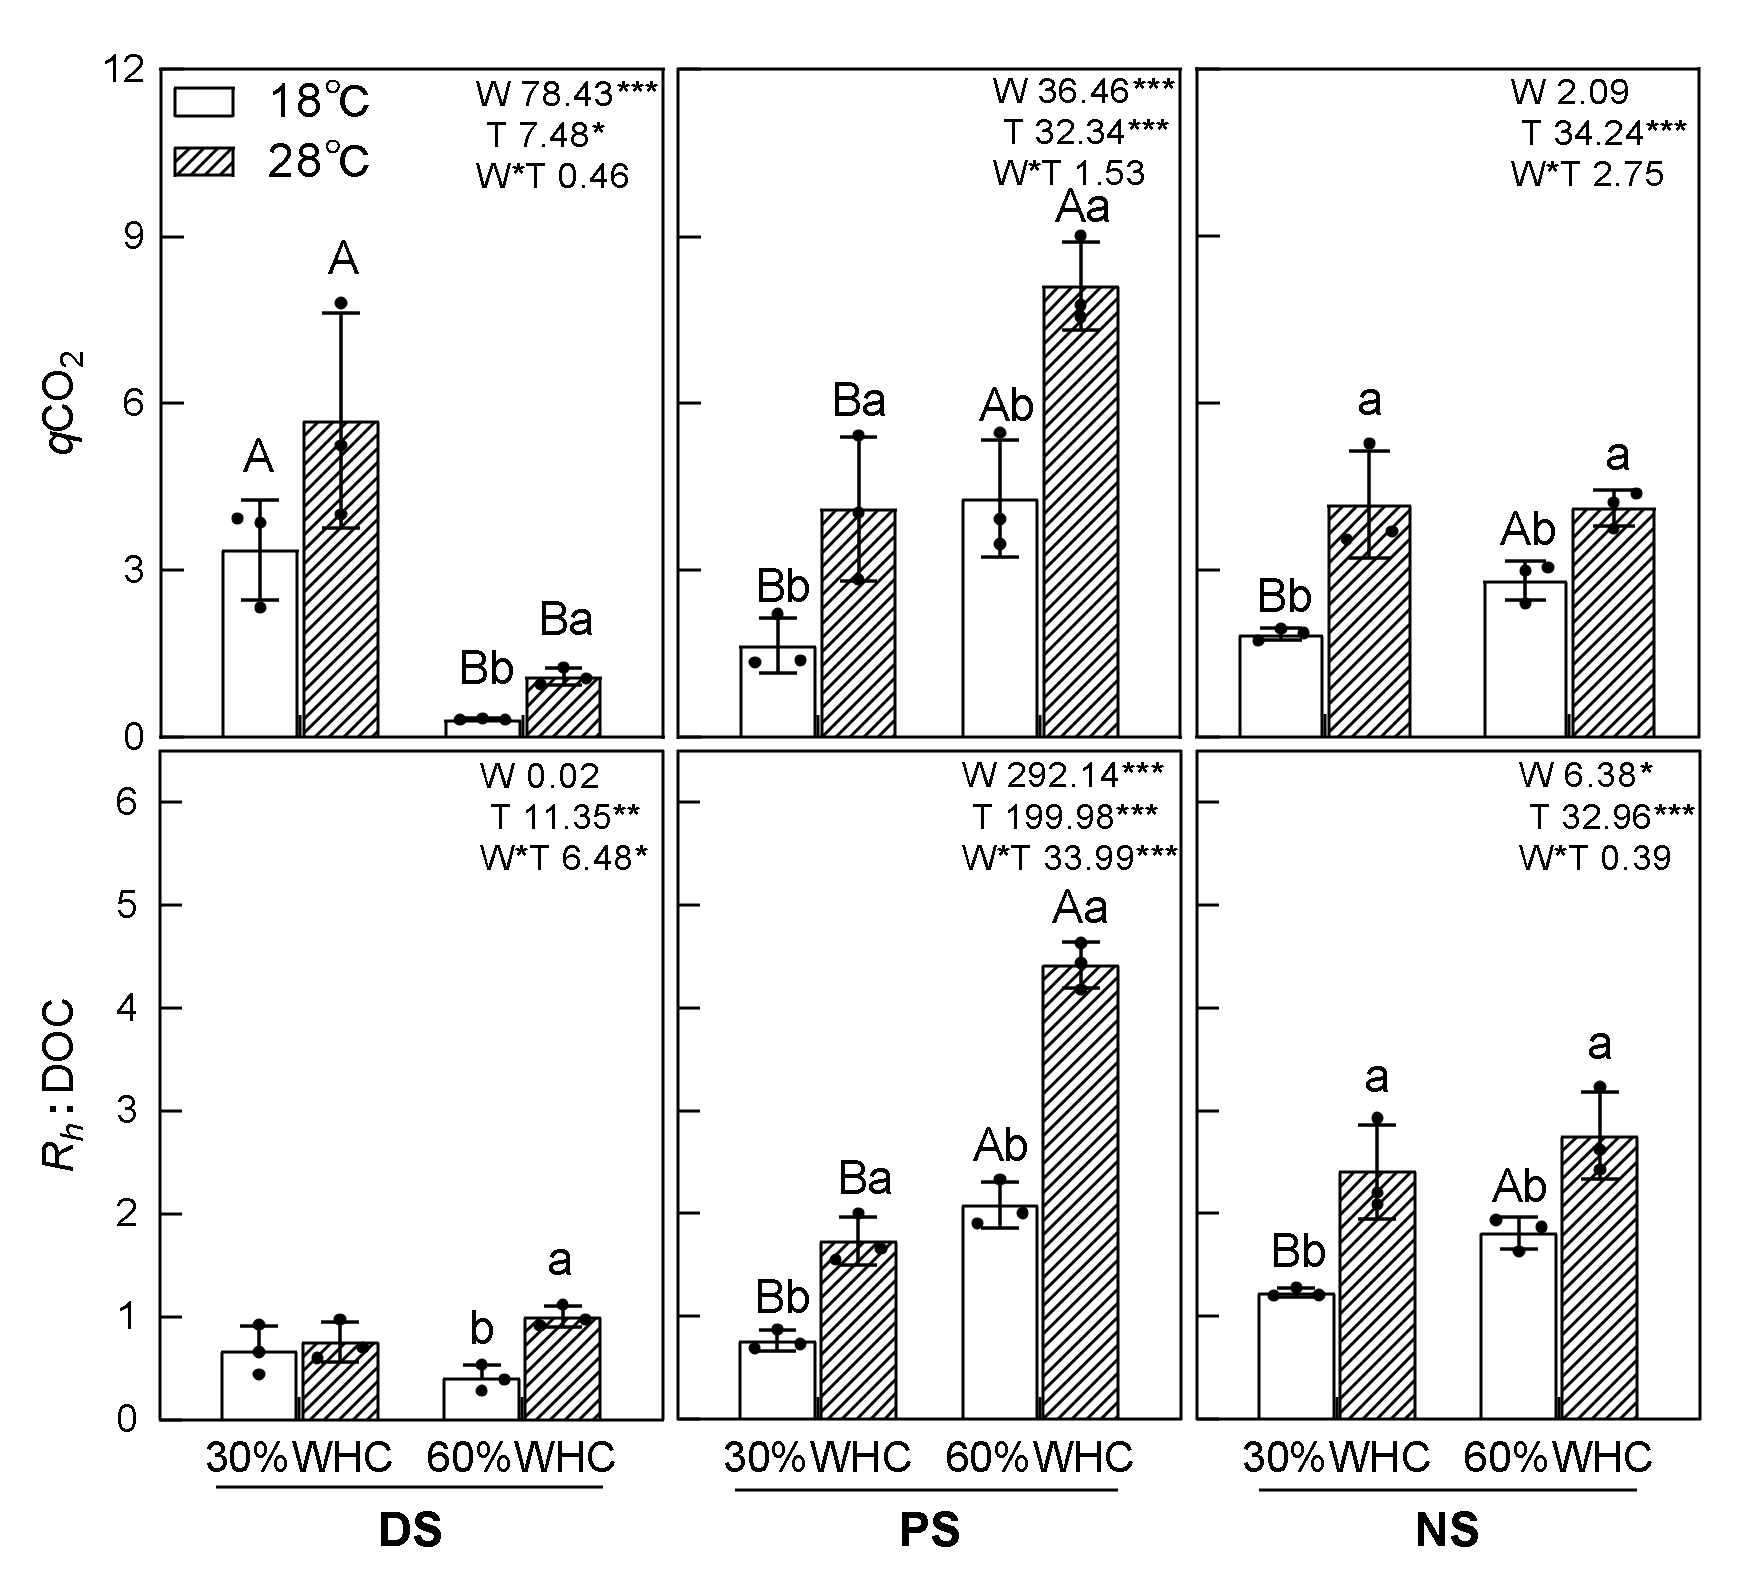
3.3. Soil MBC, DOC, qCO2, Rh: DOC, and Correlations

Overall, MBC was significantly affected by vegetation restoration and soil moisture (Table 1, Figure 4). Soil DOC content was significantly affected by vegetation restoration stage, soil moisture, temperature, and the interaction between vegetation restoration and soil moisture. Soil MBC and DOC contents were higher (p < 0.05) in the secondary natural forest and plantation forest soil than in the soil from degraded land (Figure 4). Higher soil moisture increased (p < 0.05) MBC content in the soil from degraded land at the two temperature levels, but only increased (p < 0.05) soil MBC content at 28 °C in the plantation and secondary natural forest soil. Higher soil moisture treatment increased (p < 0.05) DOC content in the plantation and secondary natural forest soil at the two temperature levels. Higher temperature treatment significantly decreased the DOC content in the 60%WHC treatment with plantation forest soil. At the end of the incubation, soil cumulative SOC decomposition was positively correlated (p < 0.001) with the content of MBC, and increased exponentially with the increase (p < 0.0001) in DOC content (Figure 5).
Vegetation restoration, temperature, and their interaction significantly affected the qCO2 and Rh: DOC (Table 1, Figure 6). Among the three vegetation restoration stages, qCO2 was lowest in the soil from degraded land and highest in the plantation forest soil, especially under the 60%WHC treatment. Soil Rh: DOC was lower (p < 0.05) in the soil from degraded land than in the soil from both the plantation and secondary natural forest. Higher soil moisture significantly increased soil qCO2 in the plantation forest soil, but decreased soil qCO2 in the soil from degraded land. Higher soil moisture significantly increased soil Rh: DOC in the plantation forest soil, and increased soil Rh: DOC only in the 18 °C treatment with the secondary natural forest soil. Except for the 30%WHC treatment with the soil from degraded land, increased soil temperature significantly increased soil qCO2 and Rh: DOC in all treatments.

3.4. Soil Microbial Composition

The relative abundance of Gram-positive and Gram-negative bacteria was solely significantly affected by vegetation restoration (Table 1, Figure 7). The relative abundance of fungi was significantly influenced by vegetation restoration, soil moisture, temperature, and the interaction between vegetation restoration and soil moisture. The relative abundance of Gram-negative bacteria was lower (p < 0.05) in the soil from degraded land than in the plantation and secondary natural forest soil. Conversely, the relative abundance of Gram-positive bacteria and the ratio of Gram-positive to Gram-negative bacteria was higher (p < 0.05) in the soil from degraded land than in the plantation and secondary natural forest soil. The relative abundance of fungi was significantly higher in the plantation forest soil than in the degraded land and secondary natural forest soil, and it was higher in the 30%WHC treatment than in the 60%WHC treatment with the plantation forest soil. In the 60%WHC treatment with the secondary natural forest soil, and in the 30%WHC treatment with the soil from degraded land, increased temperature decreased the relative abundance of fungi.

3.5. Soil Properties among Vegetation Restoration Stages

Vegetation restoration has a significant influence on the soil pH, nitrogen, phosphorus, and SOC content, and on the composition of the microbial community (Table 2). Soil pH was higher (p < 0.05) in the soil from degraded land than in the plantation and secondary natural forest soil. On the contrary, the nitrogen, phosphorus, SOC, MBC, DOC, POC, total PLFA contents, and the relative abundance of Gram-negative bacteria, increased (p < 0.05) with vegetation restoration age increase. Conversely, the relative abundance of Gram-positive bacteria was significantly higher (p < 0.05) in the soil from degraded land than in the plantation and secondary natural forest soil. The relative abundance of fungi was significantly higher in the plantation forest soil than in the degraded land and secondary natural forest soil. The ratio of Gram-positive to Gram-negative bacteria, and fungi to bacteria, decreased (p < 0.05) with vegetation restoration age increase.

4. Discussion

4.1. Responses of SOC Decomposition to Vegetation Restoration, Moisture, and Temperature

Similar to earlier studies [5,7,12,40], we found that vegetation restoration substantially increased total nitrogen, phosphorus, SOC, MBC, DOC, POC, and total PLFA content (Table 2). Previous studies showed that these changes in soil properties, such as SOC content, nutrients, and microbes, can increase the amount of SOC decomposition [12,13,23,31,32]. As we expected, significantly lower SOC decomposition was detected in the soil from degraded land than in the plantation and secondary natural forest soil (Figure 2, Table 1). Lower SOC decomposition in the soil from degraded land could be attributed to lower substrate supply, such as total SOC, POC, and DOC supply (Table 2) and, as a result, less support for the soil microbial community, thus leading to lower SOC decomposition [15,41,42]. Early studies presented a positive microbial biomass effect on SOC decomposition [11,43]. Thus, another explanation is that extremely low (p < 0.001) soil microbial biomass in the soil from degraded land in our study could also lead to limited levels of carbon decomposition (Table 2, Figure 4).
Although the soil properties of plantation and secondary forest are considerably different, the cumulative SOC decomposition did not differ. The possible reason for this is that, although total SOC was remarkably lower in the plantation forest soil than in the secondary natural forest soil, the amount of POC and MBC did not differ (Table 2, p > 0.05) between the two forest soils, which likely resulted in a similar level of SOC decomposition in the two forest soils. Likewise, Huang et al. [15] showed that, although total SOC was higher in the natural forest soil, the amount of labile carbon was 27–28% greater in the plantation soil, leading to greater SOC decomposition in the forest plantation soil than in the natural forest. There are also some incubation experiments that revealed the fluxes of CO2 to be positively correlated with DOC supply [16,17]. The DOC content during the incubation time did not differ between the two forest soils in our study, which partly explained the similar levels of SOC decomposition between the two forest soils (Figure 4 and Figure 5).
The optimum soil moisture for SOC decomposition is usually at an intermediate level; likewise, most studies have revealed that the optimum soil moisture for microbial respiration is usually at intermediate level [10,26,44]. Although the optimal water content for soil microbial respiration is different for different soil types, the 60%WHC is, or close to, the optimal water content of microbial respiration for many soil types. Thus, in line with many previous studies, the 60%WHC treatment significantly stimulated SOC decomposition of the plantation and secondary natural forest soil in our study. Compared to the 30%WHC treatment, significantly increased MBC, DOC content (Figure 4 and Figure 5), and Rh: DOC (Figure 6) in the 60%WHC treatment in the plantation and secondary natural forest soil is likely to be responsible for this result. The 60%WHC treatment not only helped to improve the diffusion of available carbon substrates, microbial density in the water film, and the concentrations of extracellular enzymes, it also facilitated the microbial substrate availability by increasing labile carbon supply [45,46].In addition, compared to the 30%WHC treatment, the 60%WHC treatment decreased the relative abundance of fungi, which has high carbon use efficiency in the plantation and secondary natural forest soil (Figure 7); this could also lead to higher SOC decomposition in the 60%WHC treatment in the plantation and secondary natural forest soil.
Nevertheless, the 60%WHC treatment did not stimulate SOC decomposition in the soil from degraded land in our study, which may due to the limited levels of soluble carbon substrates [29]. In the soil from degraded land, the 60%WHC treatment did not increase DOC content (Figure 4 and Figure 5). Meanwhile, the extremely lower labile SOC content (i.e., POC and DOC) in the soil from degraded land (Table 1) should be responsible for the substrate limitation of microbes. These results mean that soil moisture could affect SOC decomposition by altering soil substrate supply.
In our study, the higher temperature treatment significantly increased (63.4–102.6%) the SOC decomposition in the plantation and secondary natural forest soil under both soil moisture levels, but solely, and remarkably, increased SOC decomposition under 60%WHC level in the soil from degraded land. This is partially in line with most previous observations. For instance, many studies have shown that increased temperature stimulates SOC decomposition [15,20,23]; consequently, increased temperature would decrease SOC use efficiency by changing the physiological processes of microorganisms [21,47]. Consistent with the observed response of SOC decomposition to higher temperature, the higher temperature treatment significantly increased qCO2 in the plantation and secondary natural forest soil under both soil moisture levels, and also solely significantly increased qCO2 under 60%WHC treatment in the soil from degraded land (Figure 6). Such changes in qCO2 suggest that the higher temperature treatment stimulated microbial metabolic quotient in the soils of the plantation and secondary natural forest, and the 60%WHC treatment stimulated microbial metabolic quotient in the soil of the degraded land, in our study. Consistent with our finding that microbial biomass, and the abundance of major microbial groups, were not remarkably altered by temperature treatment (Figure 4 and Figure 7), Schindlbacher et al. [47] also reported that five years of soil warming did not affect microbial biomass or the abundance of major microbial groups, but significantly increased qCO2, thus leading to an increase in soil respiration.
However, the higher temperature treatment did not enhance SOC decomposition under 30%WHC level in the soil from degraded land. This could also be related to the interactive effect of soil water deficit and substrate limitation [10,24]. Under the 30%WHC treatment with the soil from degraded land, the extremely lower labile SOC (i.e., POC and DOC) content (Table 2, Figure 4) combined with a lower soil water content may hinder the diffusion of limited soluble C substrates [10,46], resulting in insensitive responses of SOC decomposition to the higher temperature treatment. Under the 30%WHC treatment, higher temperature did not increase MBC content in the soil of degraded land (Figure 4), which does support this postulated mechanism. Without substrate limitation, even at 20% WHC, Zhou et al. [30] revealed that higher temperature also stimulates SOC decomposition. These findings suggested that, to some extent, rising temperature would stimulate SOC decomposition by enhancing microbial metabolic activity, but the boost would be offset by substrate limitation.

4.2. Responses of Q10 to Vegetation Restoration and Soil Moisture

We found that the response of Q10 to vegetation restoration in our study was heavily dependent on soil moisture. For example, in the 60%WHC treatment, the Q10 value decreased as the vegetation restoration age increased (Figure 3). Conversely, in the 30%WHC treatment, the Q10 value was significantly lower in the soil from degraded land than in the plantation and secondary natural forest soil (Figure 3). Likewise, previous studies have proposed that soil properties may interact with climatic variables, such as temperature and precipitation, to influence Q10 [48].
The optimum soil water content for soil microbial respiration usually occurs at ca. 60%WHC, where the macropore is mostly air filled and facilitates O2 diffusion, and the micropore is mostly water filled and helps to improve the diffusion of available substrates [10,30,44]. Theoretically, under the 60%WHC treatment, soil microbes should be no longer constrained by substrates; however, the substantially limited labile substrate in the soil from degraded land would be rapidly depleted (Table 2). This could explain the fact that the longer the incubation time, the more time for microbes to consume recalcitrant substrate, thus resulting in higher Q10 in the soil from degraded land than that in the plantation and secondary natural forest [23,49]. Secondly, soils with longer vegetation restoration years always have more biodiversity [7], which can stabilize the responses of SOC decomposition to rising temperature [32]. Thirdly, some studies have shown that soils with more fungi, or a higher ratio of Gram-positive to Gram-negative bacteria, usually exhibit larger Q10 values [15,20]. To a certain extent, this hypothesis is supported by our observation of a higher abundance of fungi, and a higher ratio of Gram-positive to Gram-negative bacteria, in the soil from degraded land (Table 2).
The Q10 value was lower in the soil from degraded land than in the plantation and secondary natural forest soil in the 30%WHC treatment (Figure 3). Under a water deficit condition, the substrate supply from the soil may become the predominant factor associated with the variation in soil respiration and Q10 [10,26]. Although water deficit also existed in the plantation and secondary natural forest soil, to some extent, the higher SOC, POC, and DOC content could support microbial consumption in the plantation and secondary natural forest soil (Table 2). On the contrary, in the 30%WHC treatment with soil from degraded land, the limited diffusion of soluble substrates, combined with lower labile SOC, may ultimately inhibit the growth of microbes [26]. The significantly lower MBC content in the 30%WHC treatment in the soil from degraded land (Figure 4) in our study supports this point.
The result that higher soil moisture treatment did not influence Q10 in the plantation and secondary natural forest soil, but increased Q10 in the soil from degraded land, is consistent with our expectations. The potential mechanism could also be explained by substrate supply. Water deficit limited microbial biomass in the 30%WHC treatment with soil from degraded land, which could lead to a lower Q10 (Figure 4 and Figure 5). Previous studies have also indicated that drying would decrease the Q10 value, and that substrate limitation resulted from the limited diffusion of substrates in the thin soil water films [10,49]. In the 60%WHC treatment with soil from degraded land, water condition facilitated, but substrates occasionally limited, microbial growth (Table 2, Figure 4), leading to disproportionate increases in microbial respiration and qCO2 in the 28 °C treatment, which may also lead to a higher Q10 [47]. Thus, the result that the Q10 was less sensitive to soil moisture under increased vegetation restoration age also partly supports the positive biodiversity–ecosystem stability hypothesis [32].

5. Conclusions

In this study, we found that cumulative SOC decomposition in plantation and secondary natural forest soil was ca. 11.7 times higher than in the soil of degraded land, possibly due to the lower substrate supply. Higher soil moisture increased SOC decomposition in the plantation and secondary natural forest soil, as did the MBC, DOC content, and the ratio of Rh: DOC. However, in the soil from degraded land, higher soil moisture did not increase SOC decomposition. Higher soil temperature also increased SOC decomposition in the plantation and secondary natural forest soil, as did qCO2 and the ratio of Rh: DOC. However, higher temperature solely increased SOC decomposition, qCO2, and Rh: DOC in the 60%WHC treatment with the soil of degraded vegetation. The cumulative amount of SOC decomposition was positively correlated with the MBC and DOC content. An obvious interactive effect between vegetation restoration and soil moisture on Q10 was detected. In the 60%WHC treatment, the Q10 value declined as the vegetation restoration age increased. Nevertheless, in the 30%WHC treatment, Q10 was lower in the soil from degraded land than the soil from the plantation forest. Higher soil moisture did not affect Q10 in the plantation and secondary natural forest soil, but enhanced Q10 in the soil from degraded land. Overall, to some extent, rising temperature and moisture stimulates SOC decomposition, but it is highly influenced by soil substrate availability and microbial metabolic activity.

Author Contributions

Z.-G.Y., Y.-P.H. and X.F. conceived and designed the experiment; Y.-L.Z.; J.-D.L., X.-P.L. and H.-Z.S. completed the experiment; X.F.; X.-H.T. and Y.-L.H. analyzed the experimental data; X.F. wrote the paper. All authors have read and agreed to the published version of the manuscript.

Funding

This research was funded by the National Science Foundation of China (Grant Nos. 41907274, 41877326, and U1805243), and Key Science and Technology Research Project of Fujian Pine Forest Reconstruction and Upgrading Action (2021FKJ01).

Institutional Review Board Statement

Not applicable.

Informed Consent Statement

Not applicable.

Data Availability Statement

Not applicable.

Acknowledgments

The authors also thank Jun Liu for his help with field work.

Conflicts of Interest

The authors declare no conflict of interest.

References

  1. Heimann, M.; Reichstein, M. Terrestrial ecosystem carbon dynamics and climate feedbacks. Nature 2008, 451, 289–292. [Google Scholar] [CrossRef] [PubMed]
  2. Bond-Lamberty, B.; Bailey, V.L.; Chen, M.; Gough, C.M.; Vargas, R. Globally rising soil heterotrophic respiration over recent decades. Nature 2018, 560, 80–83. [Google Scholar] [CrossRef] [PubMed]
  3. Stanturf, J.A.; Palik, B.J.; Dumroese, R.K. Contemporary forest restoration: A review emphasizing function. For. Ecol. Manag. 2014, 331, 292–323. [Google Scholar] [CrossRef]
  4. Lu, F.; Hu, H.F.; Sun, W.J.; Zhu, J.J.; Liu, G.B.; Zhou, W.M.; Zhang, Q.F.; Shi, P.L.; Liu, X.P.; Wu, X.; et al. Effects of national ecological restoration projects on carbon sequestration in China from 2001 to 2010. Proc. Natl. Acad. Sci. USA 2018, 115, 4039–4044. [Google Scholar] [CrossRef] [Green Version]
  5. Pang, D.B.; Cui, M.; Liu, Y.G.; Wang, G.Z.; Cao, J.H.; Wang, X.R.; Dan, X.Q.; Zhou, J.X. Responses of soil labile organic carbon fractions and stocks to different vegetation restoration strategies in degraded karst ecosystems of southwest China. Ecol. Eng. 2019, 138, 391–402. [Google Scholar] [CrossRef]
  6. Berthrong, S.T.; Piñeiro, G.; Jobbágy, E.G.; Jackson, R.B. Soil C and N changes with afforestation of grasslands across gradients of precipitation and plantation age. Ecol. Appl. 2012, 22, 76–86. [Google Scholar] [CrossRef] [Green Version]
  7. Yang, Y.S.; Wang, L.X.; Yang, Z.J.; Xu, C.; Xie, J.S.; Chen, G.S.; Lin, C.F.; Guo, J.F.; Liu, X.F.; Xiong, D.C.; et al. Large ecosystem service benefits of assisted natural regeneration. J. Geophys. Res. Biogeosci. 2018, 123, 676–687. [Google Scholar] [CrossRef]
  8. Morriën, E.; Hannula, S.E.; Snoek, L.B.; Helmsing, N.R.; Zweers, H.; DeHollander, M.; Soto, R.L.; Bouffaud, M.L.; Buée, M.; Dimmers, W. Soil networks become more connected and take up more carbon as nature restoration progresses. Nat. Commun. 2017, 8, 14349. [Google Scholar] [CrossRef]
  9. Yang, H.; Mo, B.; Zhou, M.; Zhu, T.; Cao, J. Effects of plum plantation ages on soil organic carbon mineralization in the karst rocky desertification ecosystem of southwest china. Forests 2019, 10, 1107. [Google Scholar] [CrossRef] [Green Version]
  10. Suseela, V.; Conant, R.T.; Wallenstein, M.D.; Dukes, J.S. Effects of soil moisture on the temperature sensitivity of heterotrophic respiration vary seasonally in an old-field climate change experiment. Glob. Chang. Biol. 2012, 18, 336–348. [Google Scholar] [CrossRef]
  11. Wei, H.; Guenet, B.; Vicca, S.; Nunan, N.; Asard, H.; AbdElgawad, H.; Shen, W.J.; Janssens, I.A. High clay content accelerates the decomposition of fresh organic matter in artificial soils. Soil Biol. Biochem. 2014, 77, 100–108. [Google Scholar] [CrossRef]
  12. Zhang, K.R.; Li, X.S.; Cheng, X.L.; Zhang, Z.H.; Zhang, Q.F. Changes in soil properties rather than functional gene abundance control carbon and nitrogen mineralization rates during long-term natural revegetation. Plant Soil 2019, 443, 293–306. [Google Scholar] [CrossRef]
  13. Wu, X.; Xu, H.; Tuo, D.F.; Wang, C.; Fu, B.J.; Lv, Y.H.; Liu, G.H. Land use change and stand age regulate soil respiration by influencing soil substrate supply and microbial community. Geoderma 2020, 359, 113991. [Google Scholar] [CrossRef]
  14. Auwal, M.; Singh, B.P.; Chen, Z.Y.; Kumar, A.; Pan, S.T.; Luo, Y.; Xu, J.M. Nutrients addition regulates temperature sensitivity of maize straw mineralization. J. Soils Sediments 2021, 21, 2778–2790. [Google Scholar] [CrossRef]
  15. Huang, J.X.; Lin, T.C.; Xiong, D.C.; Yang, Z.J.; Liu, X.F.; Chen, G.S.; Xie, J.S.; Li, Y.Q.; Yang, Y.S. Organic carbon mineralization in soils of a natural forest and a forest plantation of southeastern China. Geoderma 2019, 344, 119–126. [Google Scholar] [CrossRef]
  16. Conant, R.T.; Steinweg, J.M.; Haddix, M.L.; Paul, E.A.; Plante, A.F.; Six, J. Experimental warming shows that decomposition temperature sensitivity increases with soil organic matter recalcitrance. Ecology 2008, 89, 2384–2391. [Google Scholar] [CrossRef] [PubMed] [Green Version]
  17. Gershenson, A.; Bader, N.E.; Cheng, W.X. Effects of substrate availability on the temperature sensitivity of soil organic matter decomposition. Glob. Chang. Biol. 2009, 15, 176–183. [Google Scholar] [CrossRef]
  18. Côté, L.; Brown, S.; Paré, D.; Fyles, J.; Bauhus, J. Dynamics of carbon and nitrogen mineralization in relation to stand type, stand age and soil texture in the boreal mixed wood. Soil Biol. Biochem. 2000, 32, 1079–1090. [Google Scholar] [CrossRef]
  19. Müller, T.; Höper, H. Soil organic matter turnover as a function of the soil clay content: Consequences for model applications. Soil Biol. Biochem. 2004, 36, 877–888. [Google Scholar] [CrossRef]
  20. Fang, X.; Zhou, G.Y.; Qu, C.; Huang, W.J.; Zhang, D.Q.; Li, Y.L.; Liu, J.X. Translocating subtropical forest soils to a warmer region alters microbial communities and increases the decomposition of mineral-associated organic carbon. Soil Biol. Biochem. 2020, 142, 107707. [Google Scholar] [CrossRef]
  21. Streit, K.; Hagedorn, F.; Hiltbrunner, D.; Portmann, M.; Saurer, M.; Buchmann, N.; Wild, B.; Richter, A.; Wipf, S.; Siegwolf, R.T.W. Soil warming alters microbial substrate use in alpine soils. Glob. Chang. Biol. 2013, 142, 1327–1338. [Google Scholar] [CrossRef]
  22. Thiessen, S.; Gleixner, G.; Wutzler, T.; Reichstein, M. Both priming and temperature sensitivity of soil organic matter decomposition depend on microbial biomass-An incubation study. Soil Biol. Biochem. 2013, 57, 739–748. [Google Scholar] [CrossRef] [Green Version]
  23. Wang, Q.K.; Zhao, X.C.; Chen, L.C.; Yang, Q.P.; Chen, S.; Zhang, W.D. Global synthesis of temperature sensitivity of soil organic carbon decomposition: Latitudinal patterns and mechanisms. Funct. Ecol. 2019, 33, 514–523. [Google Scholar] [CrossRef]
  24. Moyano, F.E.; Manzoni, S.; Chenu, C. Responses of soil heterotrophic respiration to moisture availability: An exploration of processes and models. Soil Biol. Biochem. 2013, 59, 72–85. [Google Scholar] [CrossRef]
  25. Canarini, A.; Kiaer, L.P.; Dijkstra, F.A. Soil carbon loss regulated by drought intensity and available substrate: A meta-analysis. Soil Biol. Biochem. 2017, 112, 90–99. [Google Scholar] [CrossRef]
  26. Craine, J.M.; Gelderman, T.M. Soil moisture controls on temperature sensitivity of soil organic carbon decomposition for a mesic grassland. Soil Biol. Biochem. 2011, 43, 455–457. [Google Scholar] [CrossRef]
  27. Liu, W.X.; Zhang, Z.; Wan, S.Q. Predominant role of water in regulating soil and microbial respiration and their responses to climate change in a semiarid grassland. Glob. Chang. Biol. 2009, 15, 184–195. [Google Scholar] [CrossRef]
  28. Lu, M.; Zhou, X.H.; Yang, Q.; Li, H.; Luo, Y.Q.; Fang, C.M.; Chen, J.K.; Yang, X.; Li, B. Responses of ecosystem carbon cycle to experimental warming: A meta-analysis. Ecology 2013, 94, 726–738. [Google Scholar] [CrossRef]
  29. Moyano, F.E.; Vasilyeva, N.; Bouckaert, L.; Cook, F.; Craine, J.; Curiel Yuste, J.; Don, A.; Epron, D.; Formanek, P.; Franzluebbers, A.; et al. The moisture response of soil heterotrophic respiration: Interaction with soil properties. Biogeosciences 2012, 9, 1173–1182. [Google Scholar] [CrossRef] [Green Version]
  30. Zhou, W.P.; Hui, D.F.; Shen, W.J. Effects of soil moisture on the temperature sensitivity of soil heterotrophic respiration: A laboratory incubation study. PLoS ONE 2014, 9, e92531. [Google Scholar] [CrossRef]
  31. Li, H.; Yang, S.; Semenov, M.V.; Yao, F.; Ye, J.; Bu, R.; Ma, R.A.; Lin, J.J.; Kurganova, I.; Wang, X.G.; et al. Temperature sensitivity of SOM decomposition is linked with a K-selected microbial community. Glob. Chang. Biol. 2021, 27, 2763–2779. [Google Scholar] [CrossRef]
  32. Xu, M.; Li, X.L.; Kuyper, T.W.; Xu, M.; Li, X.L.; Zhang, J.L. High microbial diversity stabilizes the responses of soil organic carbon decomposition to warming in the subsoil on the Tibetan Plateau. Glob. Chang. Biol. 2021, 27, 2061–2075. [Google Scholar] [CrossRef]
  33. Buol, S.W.; Southard, R.J.; Graham, R.C.; McDaniel, P.A. Soil Genesis and Classification, 5th ed.; Iowa State Press: Ames, IA, USA, 2003. [Google Scholar]
  34. Brookes, P.C.; Landman, A.; Pruden, G.; Jenkinson, D.S. Chloroform fumigation and the release of soil nitrogen: Arapid direct extraction method to measure microbial biomass nitrogen in soil. Soil Biol. Biochem. 1985, 17, 837–842. [Google Scholar] [CrossRef]
  35. Bossio, D.A.; Scow, K.M. Impacts of carbon and flooding on soil microbial communities: Phospholipid fatty acid profiles and substrate utilization patterns. Microb. Ecol. 1998, 35, 265–278. [Google Scholar] [CrossRef] [PubMed]
  36. Fang, X.; Zhou, G.Y.; Li, Y.L.; Liu, S.Z.; Chu, G.W.; Xu, Z.H.; Liu, J.X. Warming effects on biomass and composition of microbial communities and enzyme activities within soil aggregates in subtropical forest. Biol. Fertil. Soils. 2016, 52, 353–365. [Google Scholar] [CrossRef]
  37. Conant, R.T.; Drijber, R.A.; Haddix, M.L.; Parton, W.J.; Paul, E.A.; Plante, A.F.; Steinweg, J.M. Sensitivity of organic matter decomposition to warming varies with its quality. Glob. Chang. Biol. 2008, 14, 868–877. [Google Scholar] [CrossRef] [Green Version]
  38. Whitaker, J.; Ostle, N.; McNamara, N.P.; Nottingham, A.T.; Stott, A.W.; Bardgett, R.D.; Salinas, N.; Ccahuana, A.J.Q.; Meir, P. Microbial carbon mineralization intropical lowland and montane forest soils of Peru. Front. Microbiol. 2014, 5, 1–13. [Google Scholar] [CrossRef]
  39. Xu, X.; Zhou, Y.; Ruan, H.H.; Luo, Y.Q.; Wang, J.S. Temperature sensitivity increases with soil organic carbon recalcitrance along an elevational gradient in the Wuyi Mountains, China. Soil Biol. Biochem. 2010, 42, 1811–1815. [Google Scholar] [CrossRef]
  40. Parsapour, M.K.; Kooch, Y.; Hosseini, S.M.; Alavi, S.J. C and N cycle monitoring under Quercus castaneifolia plantation. For. Ecol. Manag. 2018, 427, 26–36. [Google Scholar] [CrossRef]
  41. Chen, Y.P.; Chen, G.S.; Robinson, D.; Yang, Z.J.; Guo, J.F.; Xie, J.S.; Fu, S.L.; Zhou, L.X.; Yang, Y.S. Large amounts of easily decomposable carbon stored in subtropical forest subsoil are associated with r-strategy-dominated soil microbes. Soil Biol. Biochem. 2016, 95, 233–242. [Google Scholar] [CrossRef]
  42. Yang, K.J.; He, R.Y.; Yang, W.Q.; Li, Z.J.; Zhuang, L.Y.; Wu, F.Z.; Tan, B.; Liu, Y.; Zhang, L.; Tu, L.H.; et al. Temperature response of soil carbon decomposition depends strongly on forest management practice and soil layer on the eastern Tibetan Plateau. Sci. Rep. 2017, 7, 4777. [Google Scholar] [CrossRef] [Green Version]
  43. Fang, X.; Zhao, L.; Zhou, G.Y.; Huang, W.J.; Liu, J.X. Increased litter input increases litter decomposition and soil respiration but has minor effects on soil organic carbon in subtropical forests. Plant Soil 2015, 392, 139–153. [Google Scholar] [CrossRef]
  44. Zhang, Z.S.; Dong, X.J.; Xu, B.X.; Chen, Y.L.; Zhao, Y.; Gao, Y.H.; Hu, Y.G.; Huang, L. Soil respiration sensitivities to water and temperature in a revegetated desert. J. Geophys. Res. Biogeosci. 2015, 120, 773–787. [Google Scholar] [CrossRef]
  45. Davidson, E.A.; Janssens, I.; Luo, Y.Q. On the variability of respiration in terrestrial ecosystems: Moving beyond Q10. Glob. Chang. Biol. 2006, 12, 154–164. [Google Scholar] [CrossRef]
  46. Balogh, J.; Pintér, K.; Fóti, S.; Cserhalmi, D.; Papp, M.; Nagy, Z. Dependence of soil respiration on soil moisture, clay content, soil organic matter, and CO2 uptake in dry grasslands. Soil Biol. Biochem. 2011, 43, 1006–1013. [Google Scholar] [CrossRef]
  47. Schindlbache, A.; Rodler, A.; Kuffner, M.; Kitzler, B.; Sessitsch, A.; Zechmeister-Boltenstern, S. Experimental warming effects on the microbial community of a temperate mountain forest soil. Soil Biol. Biochem. 2011, 43, 1417–1425. [Google Scholar] [CrossRef] [PubMed] [Green Version]
  48. Deng, Q.; Hui, D.F.; Zhang, D.Q.; Zhou, G.Y.; Liu, J.X.; Liu, S.Z.; Chu, G.W.; Li, J. Effects of precipitation increase on soil respiration: A three-year field experiment in subtropical forests in China. PLoS ONE 2012, 7, e41493. [Google Scholar] [CrossRef]
  49. Davidson, E.A.; Janssens, I.A. Temperature sensitivity of soil carbon decomposition and feedbacks to climate change. Nature 2006, 440, 165–173. [Google Scholar] [CrossRef] [PubMed]
Figure 1. Locations of the sampling site in this study.
Forests 13 00578 g001
Figure 2. The SOC decomposition rate (left) and cumulative SOC decomposition emission (right) in soils of degraded vegetation (DS), plantation (PS), and secondary natural forest (NS) incubated under different soil moisture and temperature levels. The individual values of cumulative SOC decomposition are shown as circles on the bar charts. Bars represent standard deviation. Different superscript letters indicate significant differences between temperature treatments under the same soil moisture treatment (lowercase letters) and soil moisture treatments under the same temperature treatment (uppercase letters). F-values of the two-way ANOVA of soil moisture (W), temperature (T), and their interactions (W*T) are shown at each vegetation restoration stage. * p < 0.05, ** p < 0.01, *** p < 0.001.
Forests 13 00578 g002
Figure 3. The Q10 of SOC decomposition in soils of DS, PS, and NS incubated under different soil moisture (W) levels. R is vegetation restoration. The values of individual observations are shown as circles on the bar chart. Bars represent standard deviation. Different superscript letters indicate significant differences among vegetation restoration stages under the same soil moisture treatment (lowercase letters) and soil moisture treatments under the same vegetation restoration stages (uppercase letters). F-values of the two-way ANOVA of vegetation restoration (R), soil moisture (W), and their interactions (R*W) are indicated. ** p < 0.01.
Forests 13 00578 g003
Figure 4. Soil microbial carbon (MBC) and dissolved organic carbon (DOC) contents of DS, PS, and NS under different moisture (W) and temperature (T) levels. The values of individual observations are shown as circles on the bar charts. Bars represent standard deviation. Different superscript letters indicate significant differences between temperature treatments under the same soil moisture treatment (lowercase letters) and soil moisture treatments under the same temperature treatment (uppercase letters). F-values of the two-way ANOVA of soil moisture (W), temperature (T), and their interaction (W*T) are indicated for each vegetation restoration stage. * p < 0.05, ** p < 0.01, *** p < 0.001.
Forests 13 00578 g004
Figure 5. Regression plots linking cumulative CO2-C emission to soil microbial carbon (MBC) (a) and dissolved organic carbon (DOC) content (b). The dotted lines represent 95% confidence intervals.
Forests 13 00578 g005
Figure 6. The metabolic quotient (qCO2) and decomposability of DOC (Rh: DOC) in soils of DS, PS, and NS under different moisture (W) and temperature (T) levels. The values of individual observations are shown as circles on the bar charts. Bars represent standard deviation. Different superscript letters indicate significant differences between temperature treatments under the same soil moisture treatment (lowercase letters) and soil moisture treatments under the same temperature treatment (uppercase letters). F-values of the two-way ANOVA of soil moisture (W), temperature (T), and their interaction (W*T) are indicated for each vegetation restoration state. * p < 0.05, ** p < 0.01, *** p < 0.001.
Forests 13 00578 g006
Figure 7. The relative abundance of Gram-positive bacteria, Gram-negative bacteria, and fungi in soils of degraded land (DS), plantation (PS), and secondary natural forest (NS) under different moisture (W) and temperature (T) levels. The values of individual observations during the incubation process are shown as circles on the bar charts. Bars represent standard deviation. Different superscript letters indicate significant differences between temperature treatments under the same soil moisture treatment (lowercase letters) and soil moisture treatments under the same temperature treatment (uppercase letters). F-values of the two-way ANOVA of soil moisture (W), temperature (T), and their interactions (W*T) are indicated for each vegetation restoration state. * p < 0.05, *** p < 0.001.
Forests 13 00578 g007
Table 1. Effects of vegetation restoration, soil moisture, temperature, and their interactions on cumulative SOC decomposition (Cm), MBC, DOC, metabolic quotient (qCO2), decomposability of DOC (Rh: DOC), the relative abundance of Gram-positive bacteria (GP), Gram-negative bacteria (GN), and fungi. The F-values and their levels of significance are shown in the table. * p < 0.05, ** p < 0.01, *** p < 0.001.
Main Effect
or Interactions
Dependent Variable
CmMBCDOCqCO2Rh: DOCGPGNFungi
Vegetation restoration (R)425.98***126.63***1161.2***31.55***145.32***36.64***73.39***59.91***
Soil moisture (W)183.54***46.78***76.37***1.59103.39***0.280.518.70**
Soil temperature (T)263.88***1.482.54***67.25***160.67***3.754.52*12.18***
R×W98.92***1.2123.31***57.65***56.95***0.540.123.44*
R×T40.55***0.161.046.45**22.27***1.710.571.73
W×T12.37**0.231.070.0111.68**1.641.800.23
R×T×W12.23**0.530.352.258.20**0.230.160.60
Table 2. Soil properties and microbial community composition of degraded land (DS), plantation (PS), and secondary natural forest (NS) before incubation are shown. Different superscript letters indicate significant differences among three vegetation restoration stages.
ParametersVegetation Restoration Stages
DSPSNS
pH4.56 ± 0.05 a4.21 ± 0.15 b4.00 ± 0.12 b
SOC (g kg−1)3.53 ± 0.25 c16.03 ± 3.38 b34.13 ± 4.56 a
TN (g kg−1)1.23 ± 0.11 b1.78 ± 0.30 b2.94 ± 0.37 a
TP (g kg−1)0.04 ± 0.00 c0.08 ± 0.01 b0.13 ± 0.01 a
MBC (mg kg−1)206.6 ± 52.4 b931.9 ± 190.2 a963.9 ± 45.4 a
DOC (mg kg−1)154.9 ± 24.5 c483.9 ± 160.0 b709.3 ± 40.8 a
POC (g kg−1)1.76 ± 0.06 b10.42 ± 4.14 a15.44 ± 5.02 a
GP (%mol)29.11 ± 4.04 a19.6 ± 2.51 b22.66 ± 0.15 b
GN (%mol)7.27 ± 3.37 c18.44 ± 4.83 b25.91 ± 0.09 a
Fungi (%mol)13.89 ± 3.12 ab17.3 ± 0.75 a11.58 ± 0.15 b
GP:GN4.69 ± 2.22 a1.13 ± 0.38 b0.87 ± 0.00 b
F:B0.27 ± 0.05 a0.28 ± 0.01 a0.17 ± 0.00 b
SOC, soil organic carbon; TN, total nitrogen; TP, total phosphorus; MBC, microbial biomass carbon; DOC, dissolved organic carbon; POC, particulate organic carbon; GP, Gram-positive bacteria; GN, Gram-negative bacteria; F:B is the ratio of total fungi to total bacteria PLFAs.
Publisher’s Note: MDPI stays neutral with regard to jurisdictional claims in published maps and institutional affiliations.

