Article

Coupled Relationship between Soil Physicochemical Properties and Plant Diversity in the Process of Vegetation Restoration

1
College of Forestry, Northwest A&F University, Yangling, Xianyang 712100, China
2
Qinling National Forest Ecosystem Research Station, Huoditang, Ningshan, Ankang 711600, China
*
Author to whom correspondence should be addressed.
Forests 2022, 13(5), 648; https://doi.org/10.3390/f13050648
Submission received: 20 March 2022 / Revised: 16 April 2022 / Accepted: 20 April 2022 / Published: 22 April 2022
(This article belongs to the Special Issue The Effect of Vegetation Restoration on Forest Soil Nutrients)

Abstract

:
An in-depth exploration of plant–soil interactions can improve our knowledge of the succession and evolution of forest ecosystems. To understand the coupling relationship between species diversity and soil physicochemical properties in natural secondary forests during the process of vegetation restoration, the species diversity of trees, shrubs and herbs and the physicochemical properties of soil at different depths were investigated in six forest communities in the Qinling Huoditang area over two years (2013 and 2019). The analysis indicated that the soil nutrient content in the region decreased during this period, but the plant diversity index showed no obvious change. Through RDA and regression analysis, we determined that the correlations between plant diversity and soil physicochemical properties were discrete. The tree and herb species diversity were most closely related to the surface soil, while shrub diversity was more strongly regulated by the middle soil layer. Available phosphorus had the strongest effect on trees, and the main factors affecting shrubs were NO3-N and NH4-N. Herb growth was more limited by soil physical properties such as the soil bulk density and porosity. We concluded that evident correlations exist between soil physicochemical properties and plant communities. After six years of natural restoration, the plant diversity index did not change significantly. However, the soil nutrient content decreased obviously. This study provides a reference for the management of vegetation restoration processes in forest ecosystems.

1. Introduction

Soil is the material foundation of plant growth, and soil properties are important indicators that play key roles in the performance of soil functions [1,2]. Soil directly influences the growth of plants by providing water and nutrients and indirectly affects plant development by regulating the decomposition and transformation processes brought about by microorganisms [3,4,5]. Plants can improve soil physicochemical properties and restore soil fertility through root activities and provide litter material for microbial decomposition [6]. It is difficult to separate the effects of plants on soil from the effects of soil on plants themselves, as the synchronization of plant–soil interactions occurs at both temporal and spatial scales [7], playing a crucial role in the succession and evolution of ecosystems [8,9].
Soil physicochemical properties may also play important roles in the maintenance of forest plant diversity due to their regulation of nutrient supplies [10,11]. Soil heterogeneity is widely thought to promote plant species coexistence and plant species diversity by increasing niche availability and creating more shelters [12]. Several studies have considered soil nutrients, pH and soil water to be the most important abiotic factors affecting plant diversity [13,14]. Among these factors, soil acidity and alkalinity affect plant diversity by altering soil enzyme activities and root nutrient absorption [15]. Soil nutrients, especially nitrogen and phosphorus, which are generally considered the two most limiting elements for vegetation development, are closely related to plant diversity [7,16]. However, some studies suggest that the heterogeneity of soil resources (soil nutrients) generally fails to promote plant species diversity, while the heterogeneity of non-resource factors (soil pH and soil type) often has a positive impact on plant diversity [17,18]. The influential mechanisms of soil factors are complex, and there are still many gaps in our knowledge about them [5,19].
Plant species diversity also has a feedback effect on soil properties that can affect soil nutrient availability through “complementary” or “mass” effects [20,21,22], which in turn increase forest ecosystem productivity [23]. Plant diversity can be quantified by diversity indexes, and the α diversity indexes reflect the coexistence of species within a community through competition for resources or the use of the same habitat. Among diversity indexes, the richness index is often used to describe the number of species contained in a community, and the diversity indexes are functions that combine species diversity and species abundance, including Simpson’s index and Shannon’s index [24]. The Peilou index is used to describe the evenness of the distribution of the number of species within a community. Most studies on the relationships between soil physicochemical properties and plant diversity have focused on natural forests and artificial forests, but few studies have focused on natural secondary forests. In addition, few studies have explored the effects of soil physicochemical properties at different depths on the plant diversity of trees, shrubs and herbs. There is no unified conclusion regarding the mechanisms by which soil physicochemical properties regulate each diversity index. Both plant growth and soil property changes occur through long processes, but changes in soil physicochemical characteristics and plant diversity and their interactions over time are rarely reported.
The Huoditang forests are located on the southern slope of the middle part of Qinling, and contain abundant plant resources and various species. The existing forest is a natural secondary forest restored by the original vegetation after logging in the 1960s and 1970s. This forest is an ideal area for community succession and vegetation restoration research. However, there are few reports on the interactions between soil physicochemical characteristics and plant diversity in the Qinling Mountains. In this study, six common forest types—Pinus tabulaeformis forest (YS), Quercus aliena var. acuteserrata forest (RCL), Pinus armandii forest (HSS), mixed Pinus armandii and Tsuga chinensis forest (HSSTS), Picea wilsonii forest (QQ), and Betula albosinensis Burkill forest (HH)—in the Huoditang Forest of Qinling Mountains were selected as the research objects. By analyzing soil and plant data from six forest communities in 2013 and 2019 and the following questions were addressed: (1) assess the patterns of change in soil nutrient content and plant communities in the area over six years; (2) evaluate whether there is a correlation between soil physicochemical properties and plant diversity; (3) if there is a correlation, determine what the mechanisms of soil–plant interactions are during revegetation. We hope that this study will provides a scientific basis for forest management and species diversity protection during the process of vegetation restoration.

2. Materials and Methods

2.1. Site Conditions

The present study was carried out in the 33°25′–33°29′ N and 108°25′–108°30′ E across the southern slope of the middle part of Qinling (Figure 1). The altitude is 800–2500 m above sea level, with a mean annual precipitation of 900–1200 mm and evaporation of 800–950 mm. The average annual temperature is 8–10 °C, with 1100–1300 h of sunshine duration. The growing season lasts for 6 months. The terrain in the area is diverse, with broken slopes and steep mountains. The vegetation in the study area is rich and diverse. And the main tree species are P. tabulaeformis, P. armandii, and Q. aliena var. acuteserrata.

2.2. Site Selection and Plant Investigation

Six forest communities in the Huoditang area of the Qinling Mountains were selected: YS, RCL, HSS, HSSTS, QQ and HH. In June 2013, three tree sample plots in these six communities were chosen (Table 1), considering both the slope exposure and slope. In each plot, five shrub quadrats were defined according to the five-point method, and a 1 m × 1 m grass quadrat was set in the center of each shrub quadrats (totaling 18 tree plots, each 20 × 20 m; 90 shrub quadrats, each 2 m × 2 m; and 90 herb quadrats, each 1 m × 1 m). In 2013 and 2019, we conducted ground surveys to collect data on plant diversity and soil conditions. The two investigations were carried out simultaneously on sunny days in August of the study year and maintained a consistent method. The species names, DBHs (the diameter of the tree at 1.3 m above the ground) and heights of trees; the species names, heights, and quantities of shrubs; and the species names, average heights, coverages and abundances of herbs were recorded.
The species diversity index was described by the richness index (S), Simpson diversity index (D), Shannon–Wiener diversity index (H) and Pielou evenness index (J). The calculation methods were as follows:
Richness index (S): number of plant species in a plot or quadrat.
Simpson diversity index (D):
H = i = 1 S P i ln P i
Shannon–Wiener diversity index (H):
D = 1 i = 1 S P i 2  
Pielou evenness index (J):
J = H / ln S
where Pi is the proportional abundance of species, i is the base of the logarithm, and S is the number of species.

2.3. Soil Sample Collection and Determination

The soil was collected with a 100 cm3 ring knife according to a five-point mixed sampling method from four layers: 0–10 cm, 10–20 cm, 20–40 cm, and 40–60 cm. We gathered six ring knife samples from each layer, and three samples were used to determine the soil bulk density (SBD) and porosity (PV) by the cutting ring method. The other samples were mixed, placed into plastic preservation bags and transported to the laboratory. Soil pH was measured using a pH meter in a soil: water suspension (at a ratio of 1:5) after shaking for 30 min. The soil mechanical composition (clay/silt/sand) was measured using the hydrometer method. Soil organic matter (SOM) was determined using the K2Cr2O7 oxidation method. Soil total nitrogen (TN) was determined using a 2300 Kjeltec Portern Analyzer Unit, and soil total phosphorus (TP) was determined using the molybdenum-antimony anti-colorimetric method. Soil total potassium (TK) was determined by the flame photometer method. Soil nitrate nitrogen (NO3-N) was measured using UV spectrophotometry. Soil ammonium nitrogen (NH4-N) was determined by the KCl extraction–indophenol blue colorimetric method. Soil available phosphorus (AP) was extracted with a solution containing 25 mM HCl and 30 mM NH4F (at a ratio of 1:7) and measured using an ultraviolet spectrophotometer. Available potassium (AK) was determined by a neutral ammonium acetate flame photometer.

2.4. Statistical Analyses

We performed a nonparametric test using the Kolmogorov–Smirnov method. After confirming that the data conformed to a normal distribution, multivariate analyses of variance and correlation analyses (Pearson, α = 0.05) of the diversity index values and soil physicochemical properties in different years, communities and levels were determined using SPSS 25.0. Canoco 5.0 was used for redundancy analysis (RDA) to quantify the degree of explanation of soil physicochemical properties with community species diversity, and stepwise regression analysis was used to build a regression model to identify the soil factors that most strongly affected the community species diversity. Origin 2021 was used to draw the graphs.

3. Results

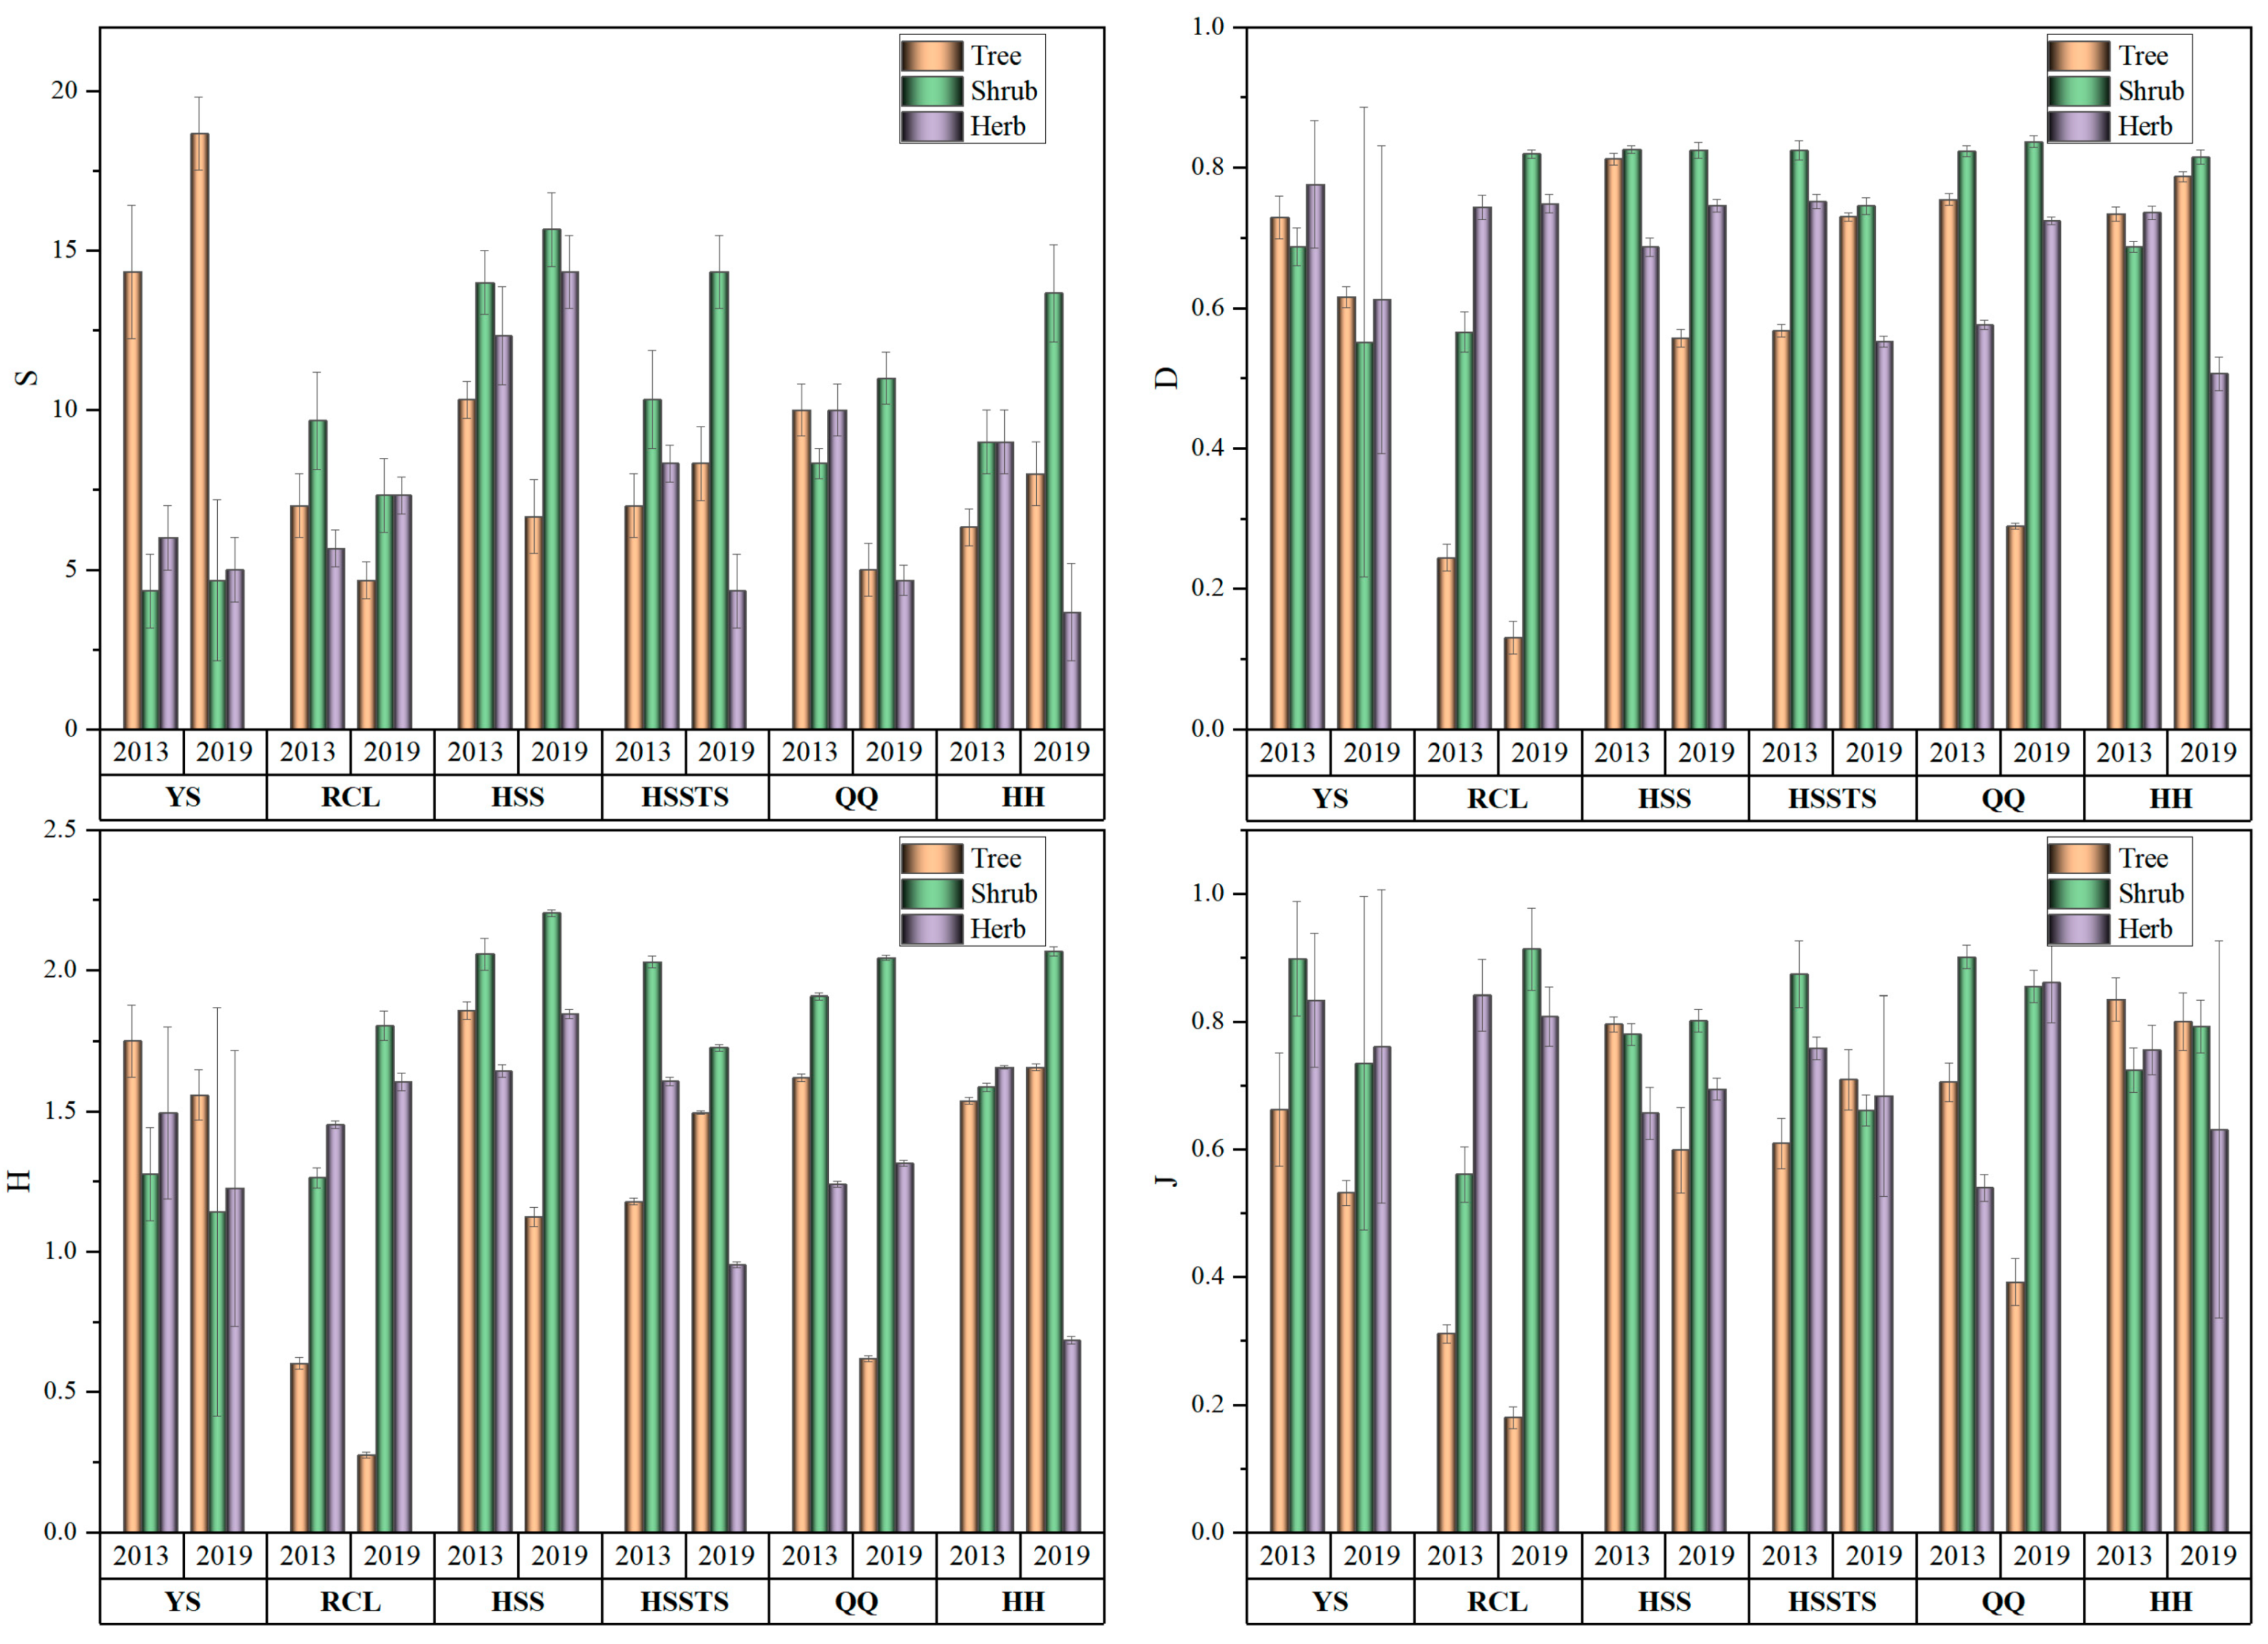
3.1. Species Diversity

The richness index values differed significantly among the six communities and three forest layers (p < 0.05). Except for the YS forest, the richness index and Pielou index values of the other five forests were generally higher for shrubs than for trees and herbs (Figure 2). Overall, the species diversity was lower in the RCL among the six examined communities. And the diversity of the HSS community was slightly higher than those of the other communities. Plant diversity did not fluctuate greatly between the two sampling years. Most of the highest and lowest values of each diversity index appeared in 2019, therefore, the species diversity of each forest community showed greater heterogeneity in 2019. In addition, there were positive correlations between diversity indexes in the same forest layer. The Simpson index and Shannon–Wiener index had the highest correlation, while the correlation between the richness index and Pielou index was very low. The diversity indexes of shrubs and herbs were negatively correlated with the richness index of trees (Figure 3).

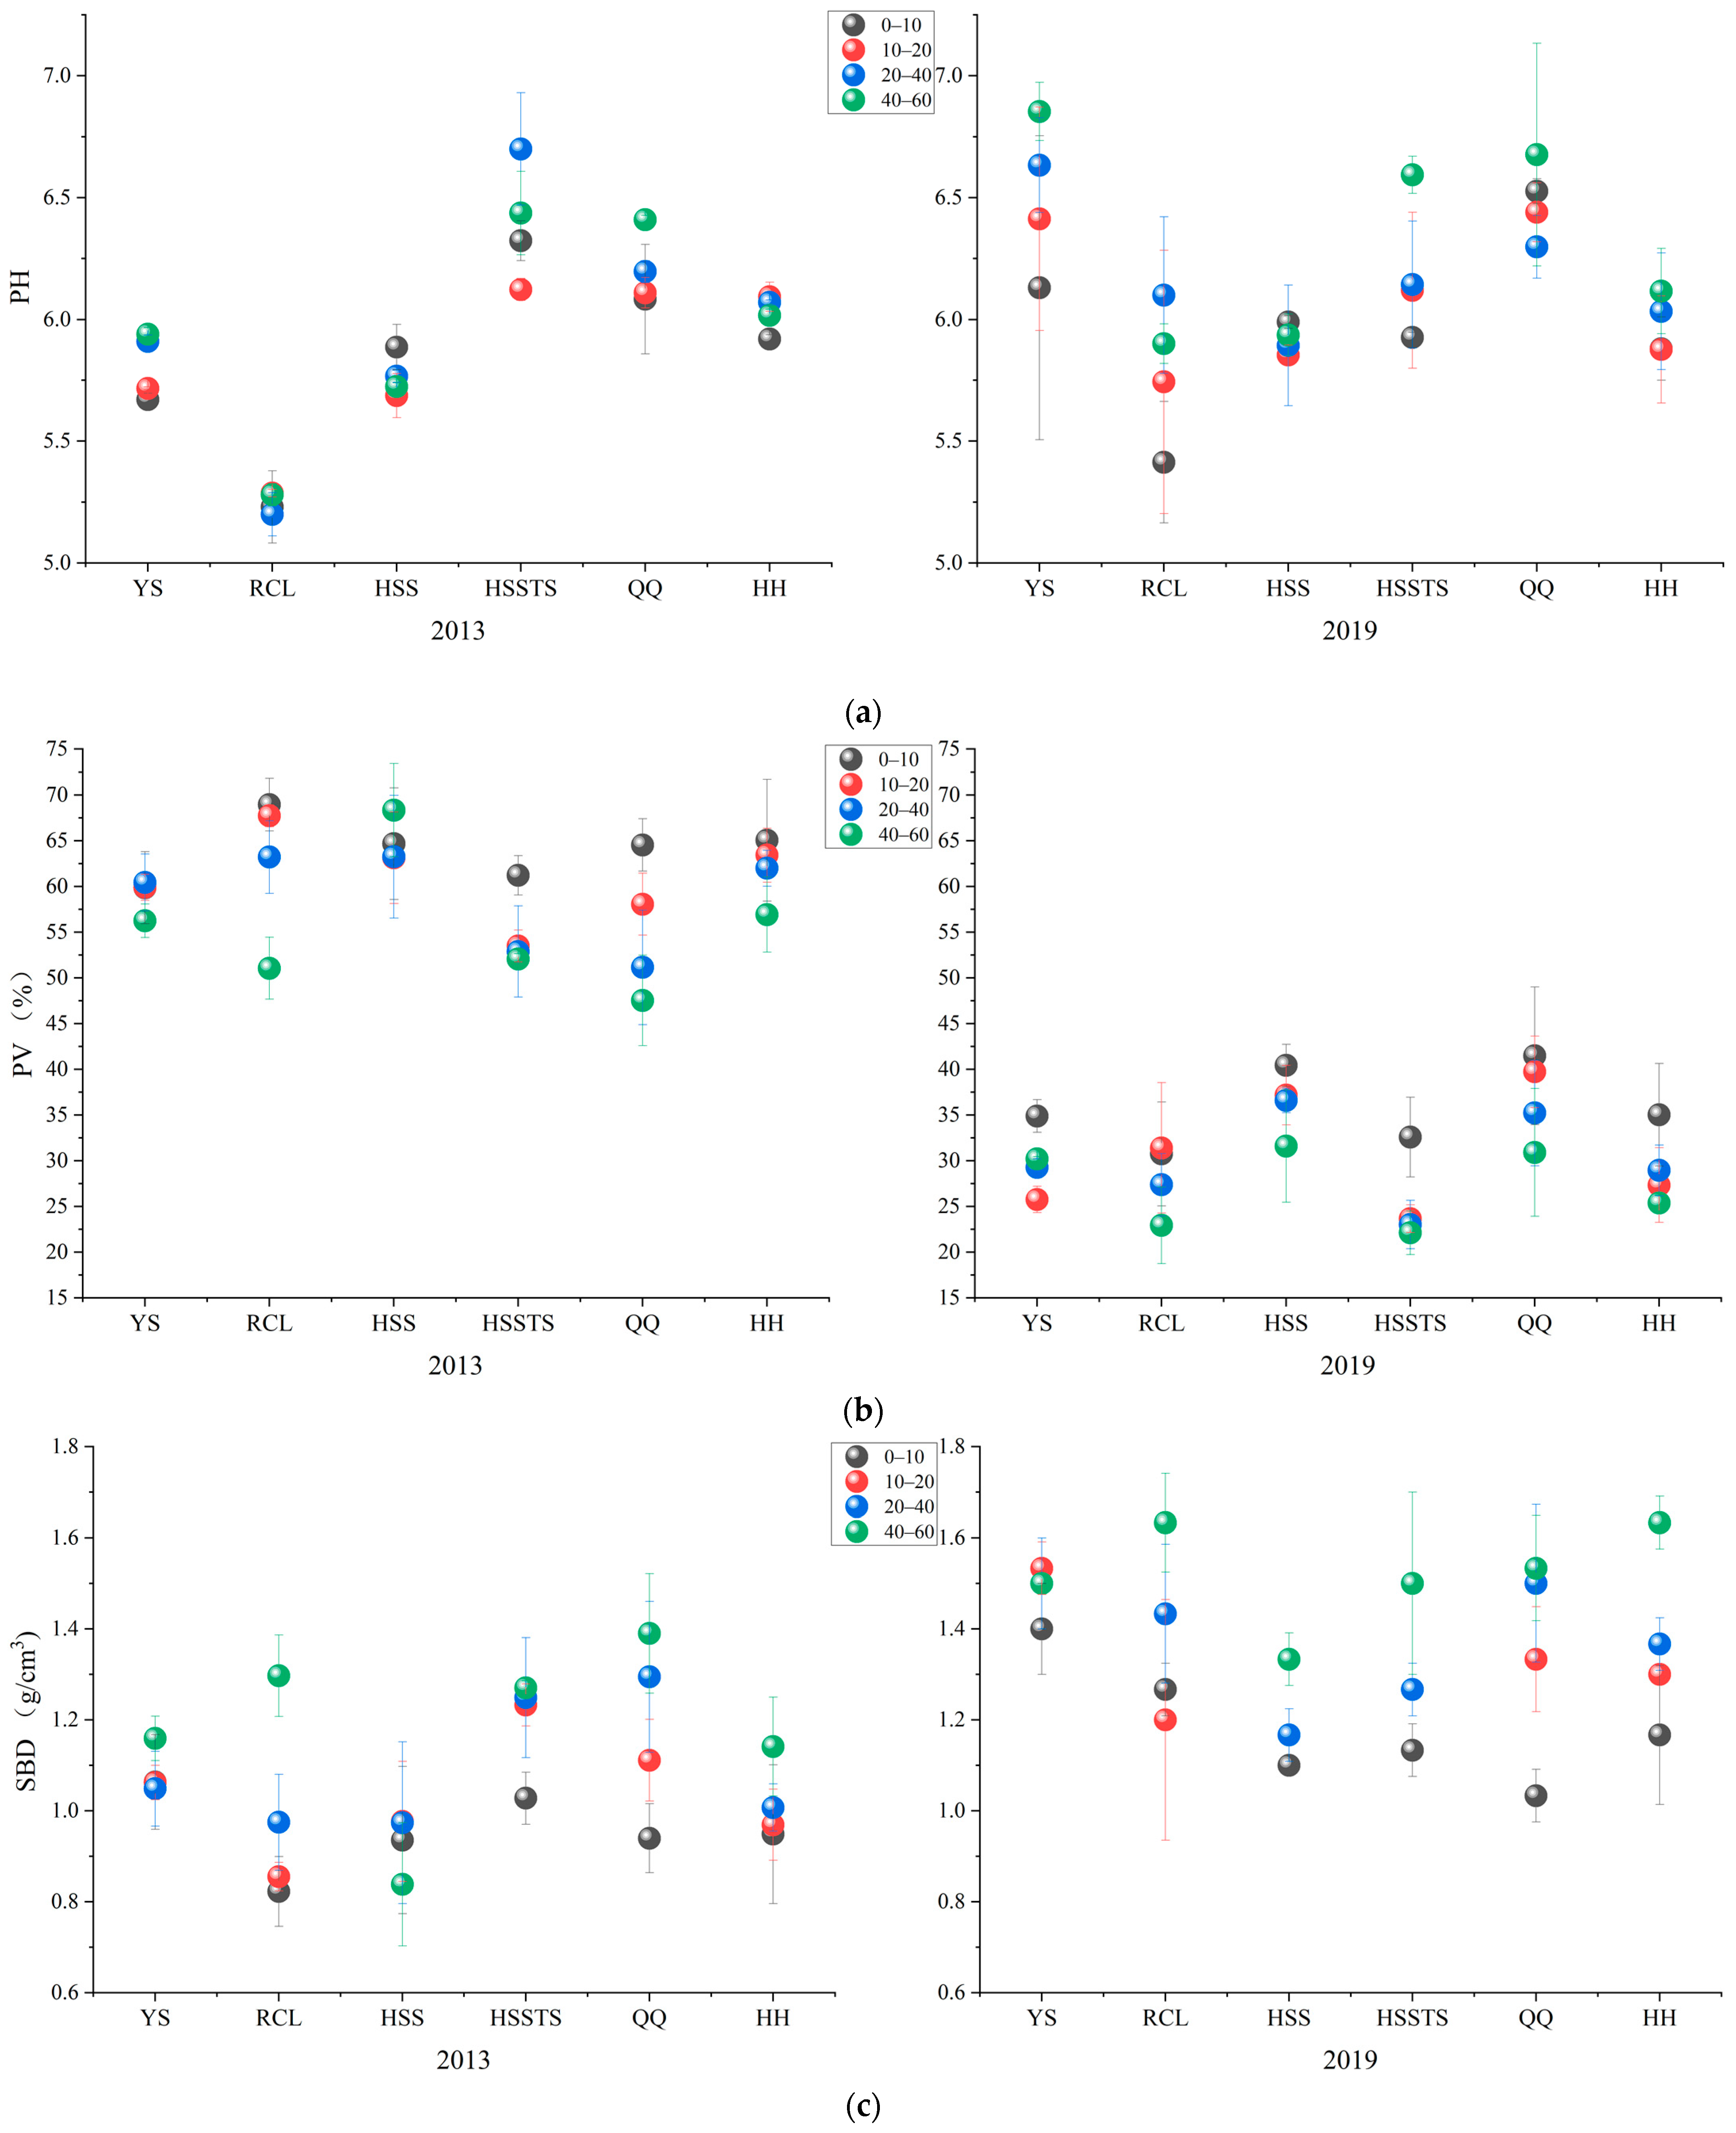
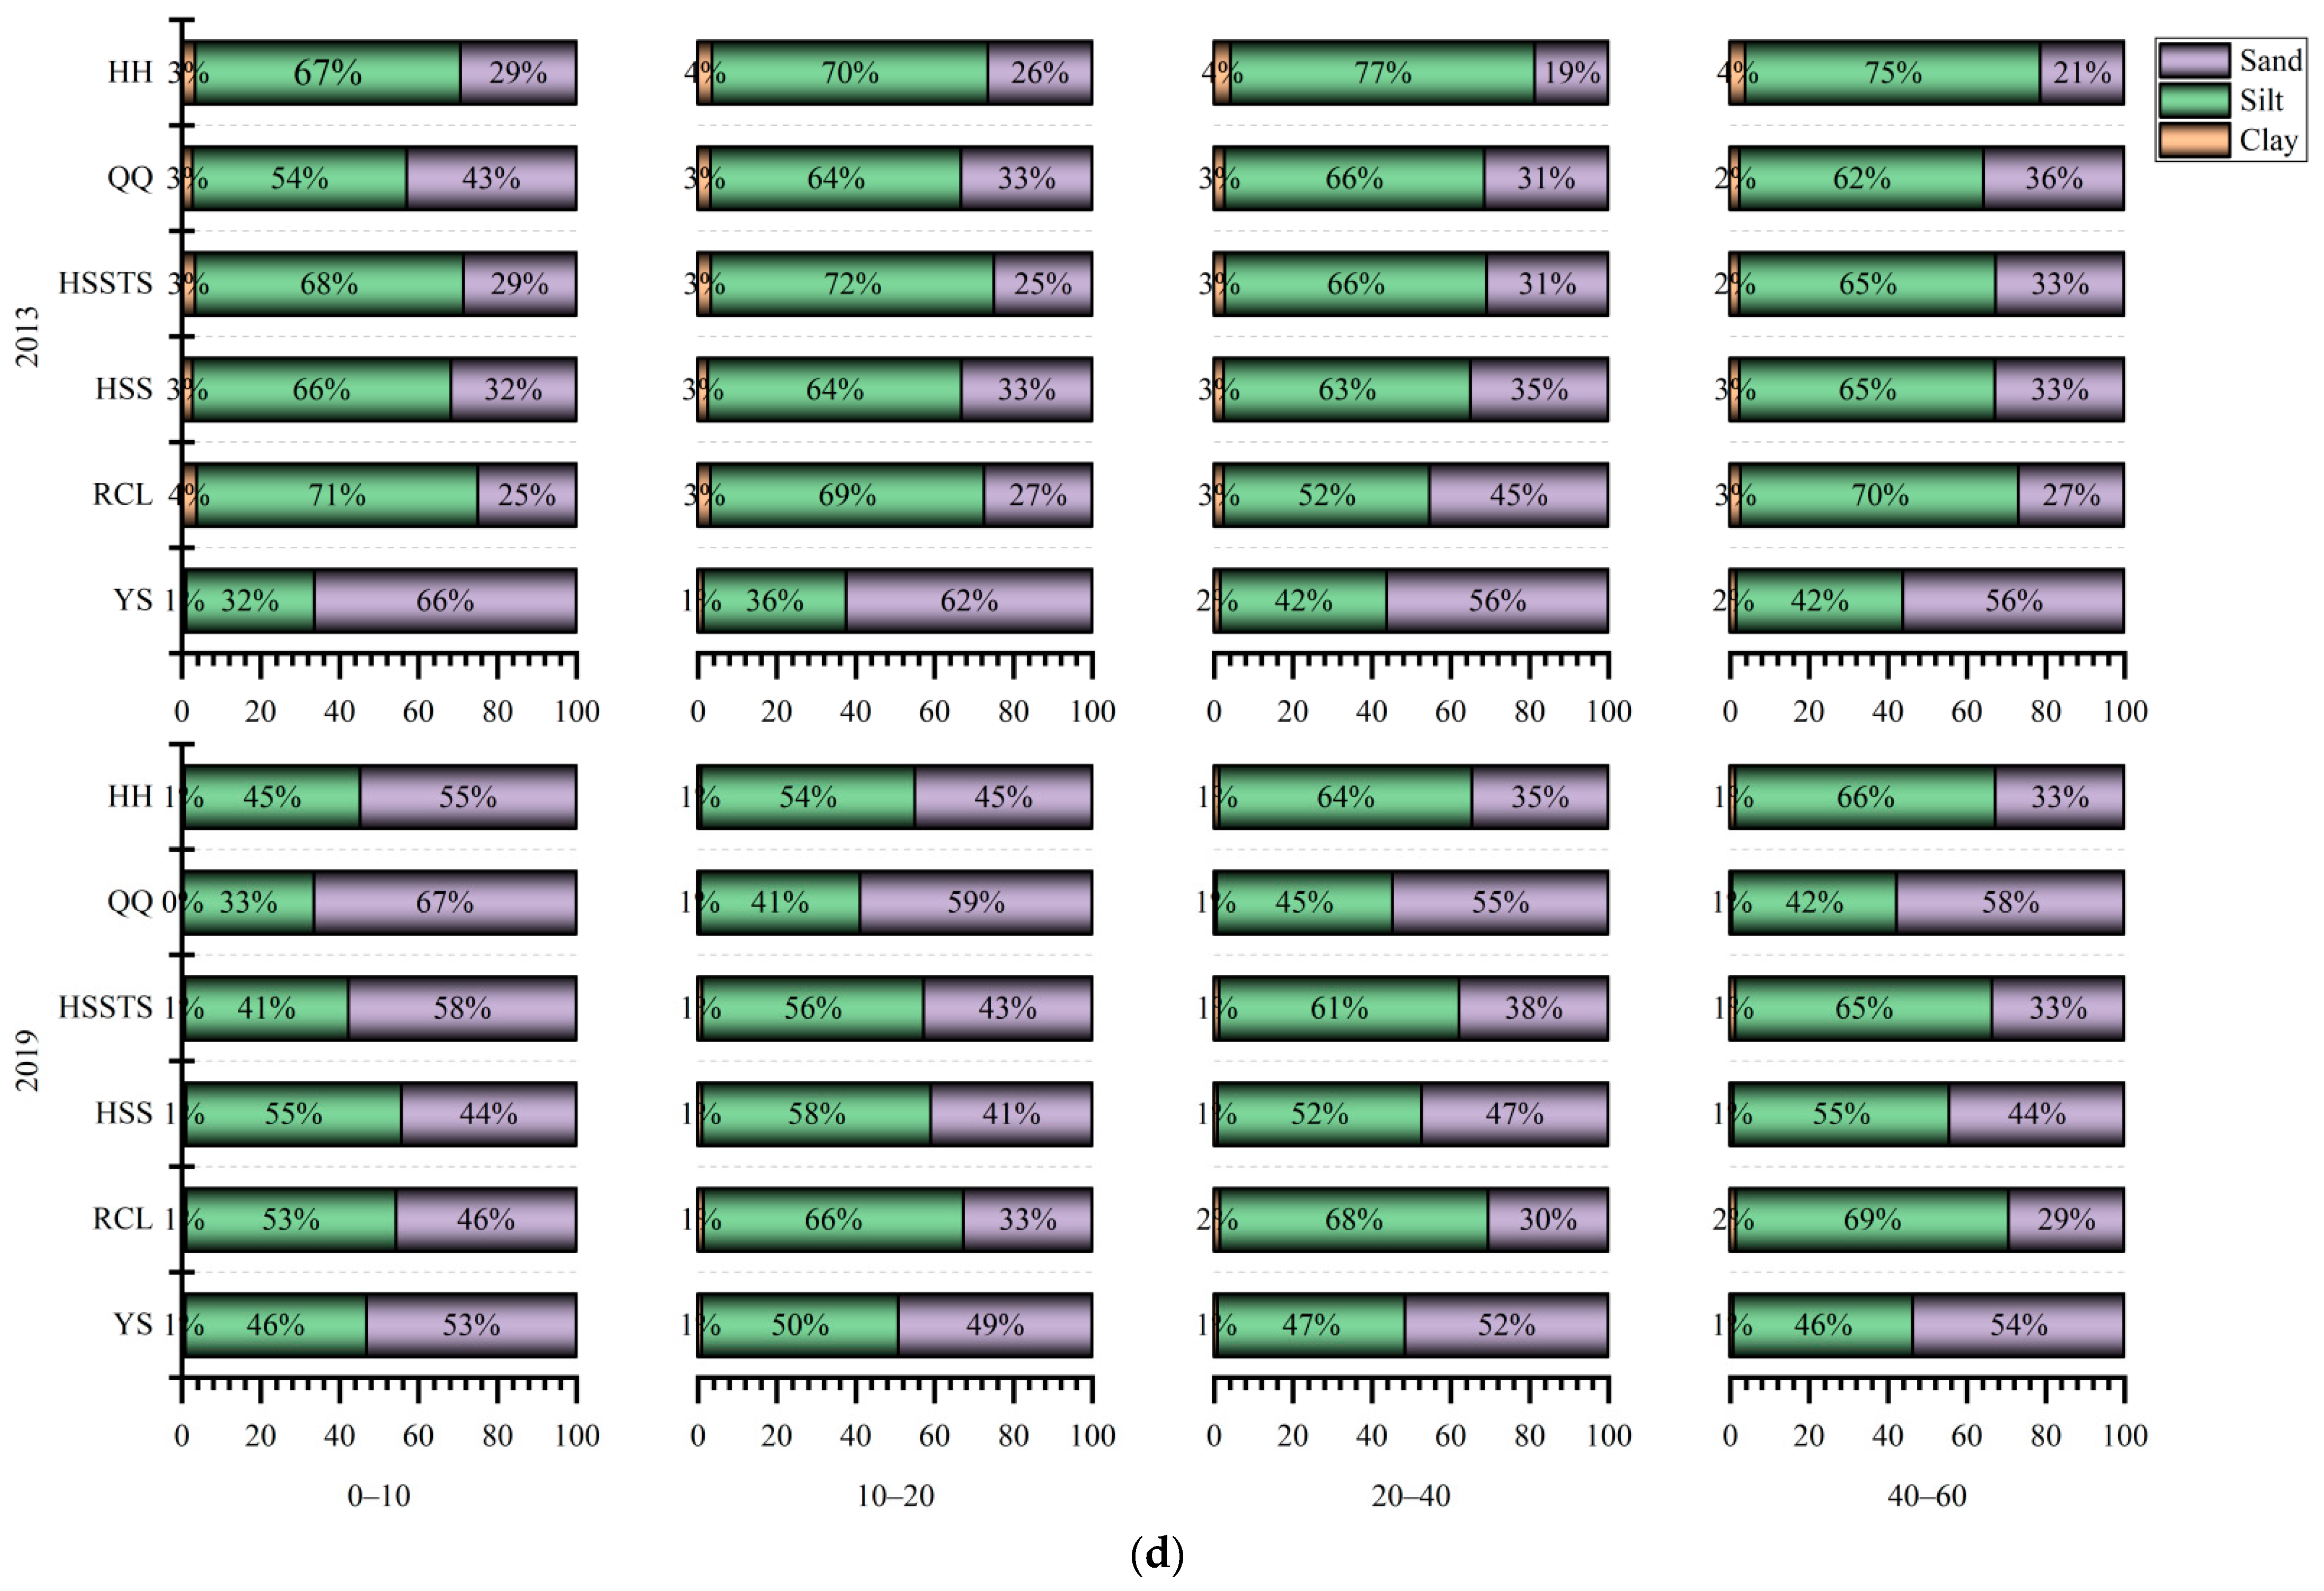
3.2. Soil Physical Properties

The physical properties of soil were significantly different among the six forest communities (p < 0.05). In general, the soil under the RCL community had strong acidity and a high SBD, which are not conducive to plant growth. The soil in the HSS community showed higher soil porosity and a lower SBD than that in other communities, and these characteristics are suitable for plant survival. These results are consistent with the regularity of the diversity index in each forest community. Soil properties also changed obviously within the same community between the two sampling years. The soil in the six forest communities was weakly acidic, with differences in pH among the communities in the two sampling years (Figure 4a). From 2013 to 2019, the soil PV decreased (Figure 4b), and the SBD increased (Figure 4c). Except for the YS forest, the other five forest communities showed a trend in which the silt content declined, the sand content increased, and the soil quality declined. The soil physical properties were also significantly discriminated among different depths. Except for the YS and HSS communities, with increasing soil depth, the SBD in the other communities gradually increased, while the soil PV decreased. Significant differences also existed in the soil mechanical composition of different soil depths (Figure 4d) (p < 0.05). The clay and silt contents increased slowly with increasing soil depth, while the sand content showed the opposite trend. The SBD was strongly negatively correlated with the soil PV. The soil silt and clay contents were negatively correlated with the SBD and positively correlated with the soil PV. With increases in the soil sand content, soil compaction became more severe (Figure 3).

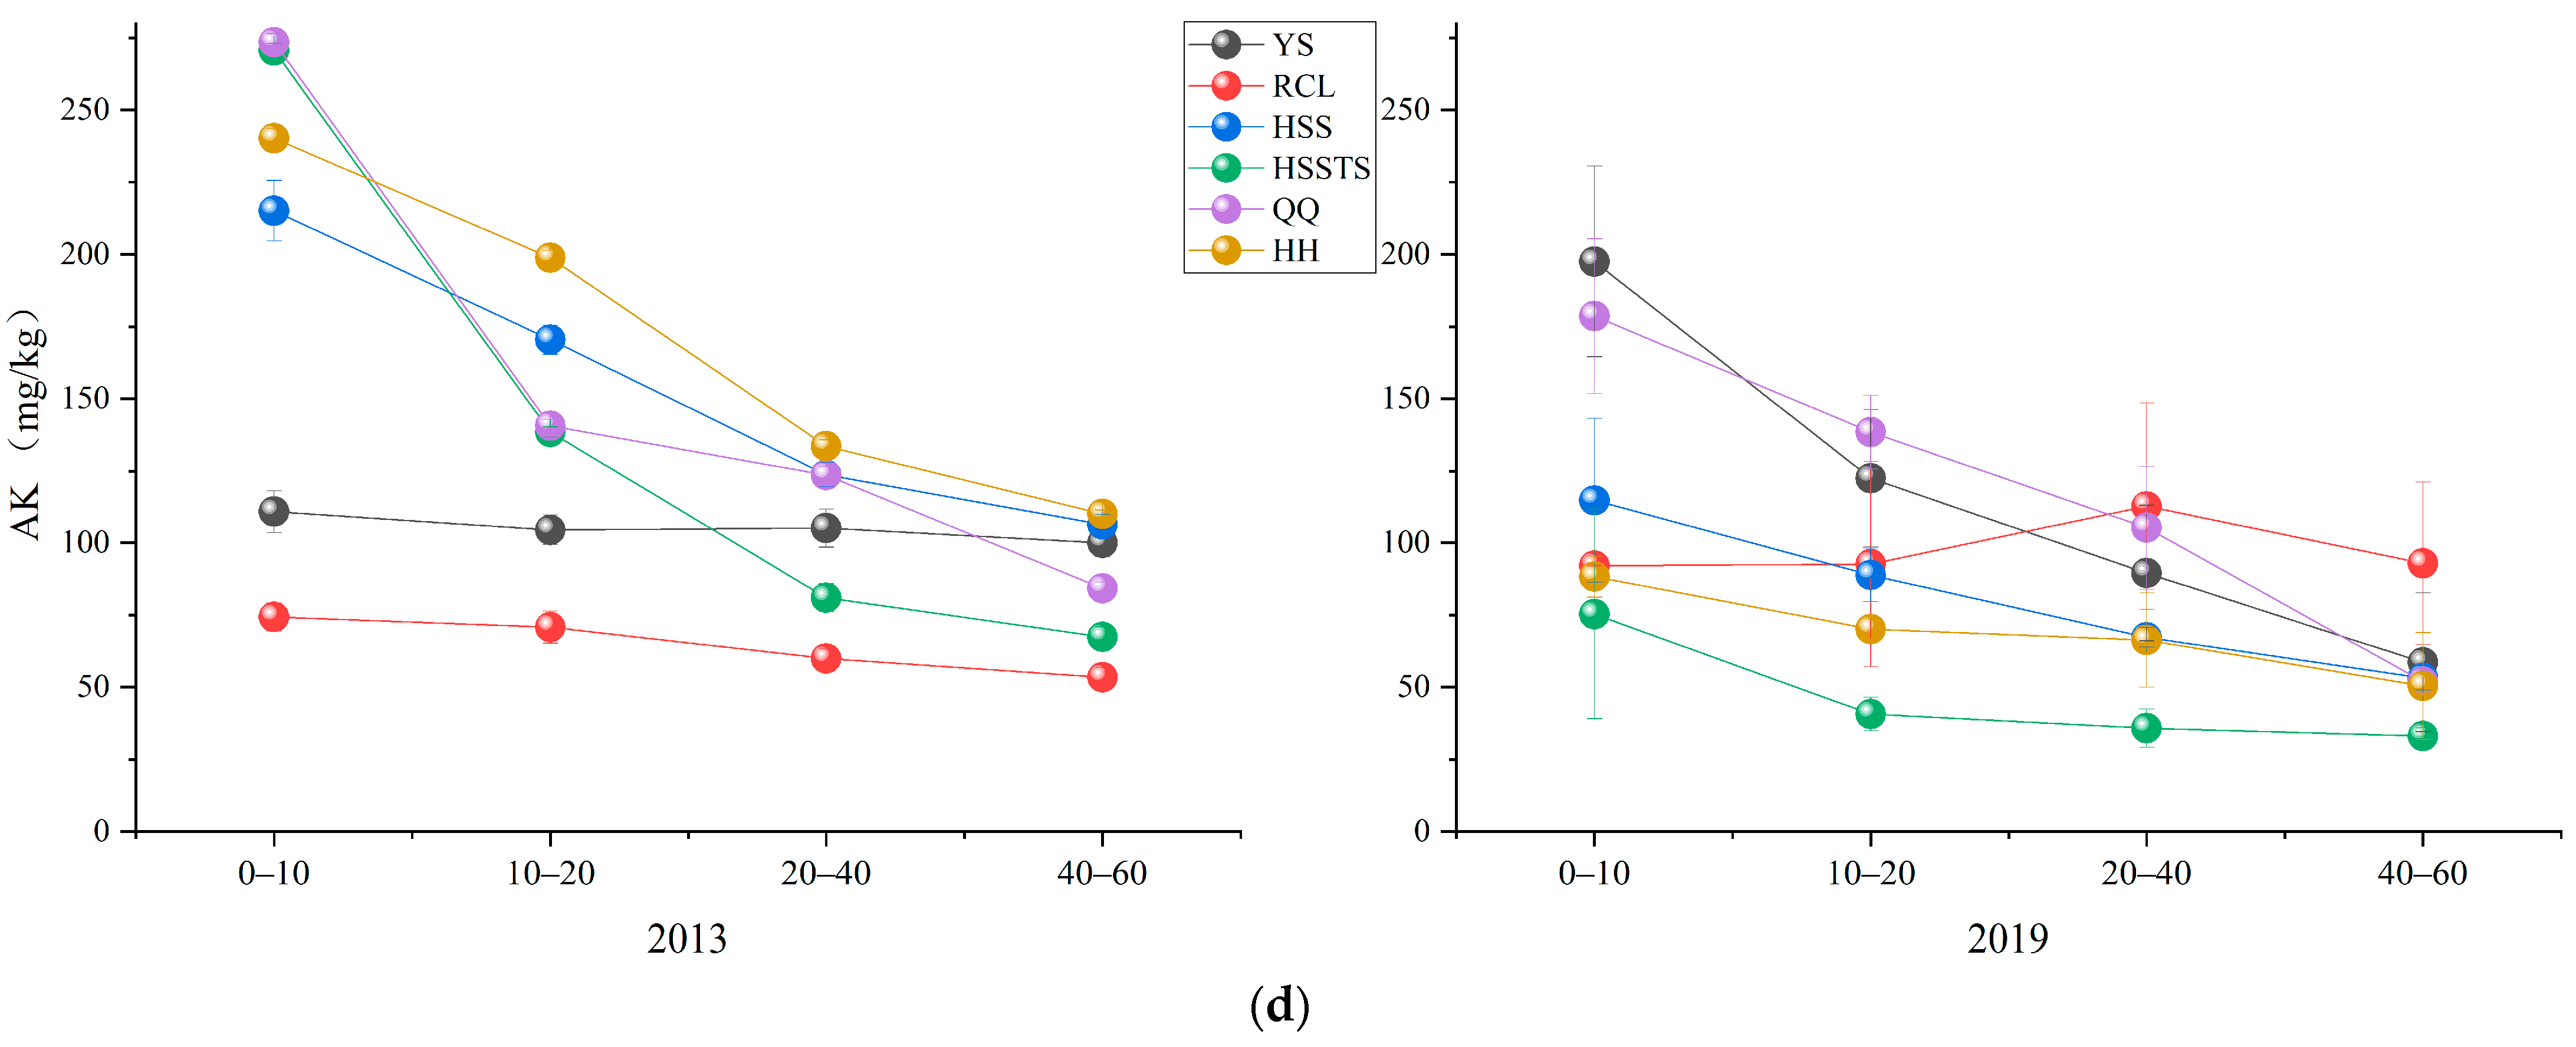
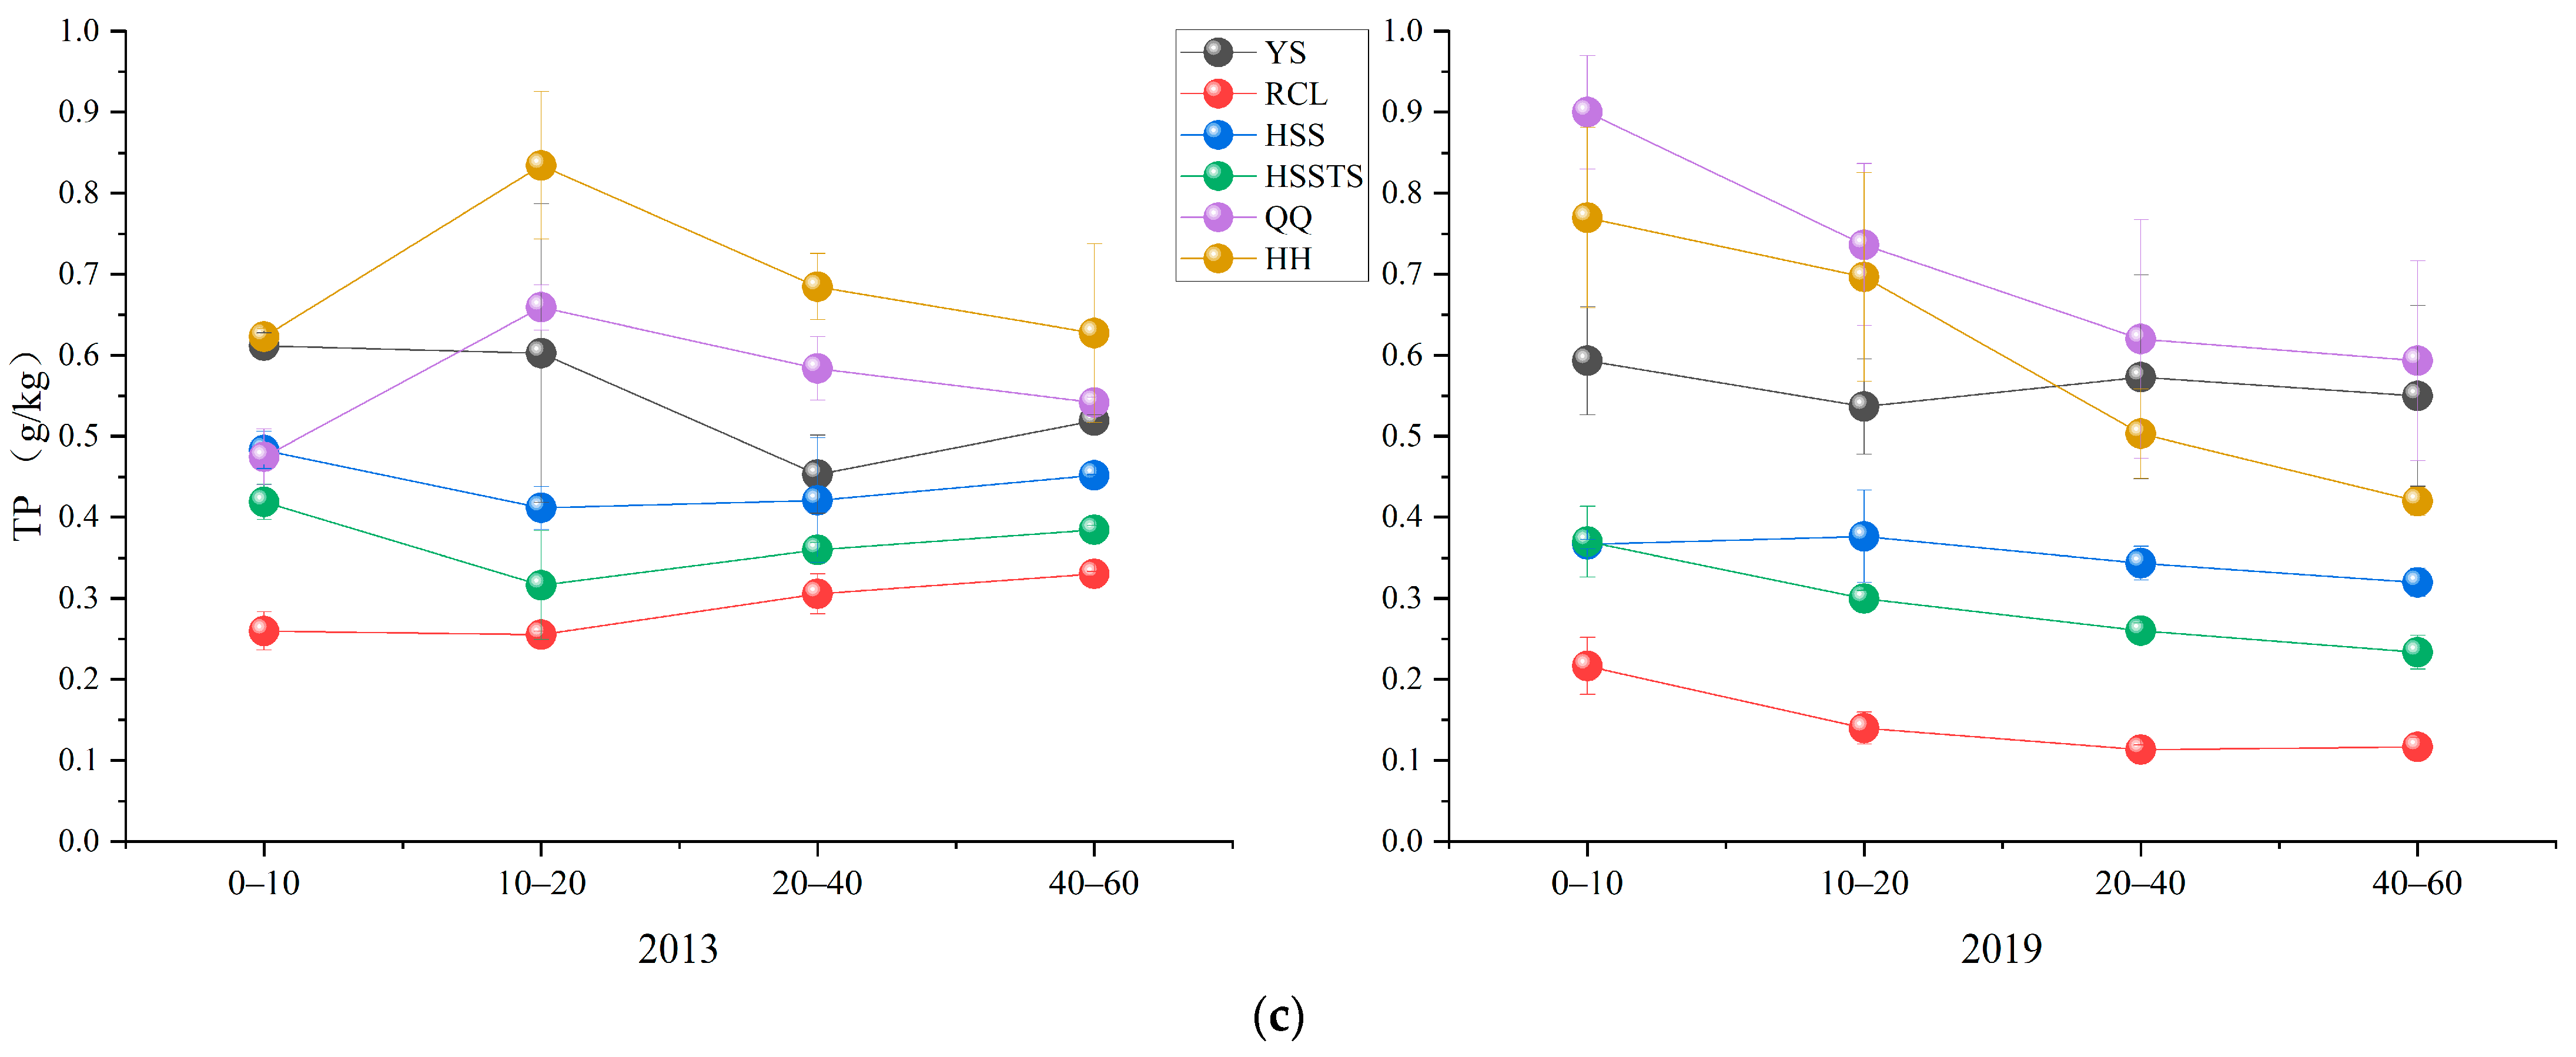
3.3. Soil Chemical Properties

The soil chemical properties were significantly different among the six forest communities (p < 0.05). The soil nutrient contents of the QQ and HH communities were higher than those of the other communities. The RCL community was the poorest in terms of soil nutrients, but the NH4-N content of its topsoil was significantly higher than those of the other communities in 2019 (Figure 5a). This could be the result of the pH increasing significantly over the six years, which greatly contributed to the accumulation of NH4-N in the soil. This may also be because the litter in this community may have a higher N content. The differences in nutrient content among the communities were similar to the regularities of plant diversity, which indicated that there was a certain correlation between plant diversity and the forest soil physicochemical properties. Significant differences existed among soil depths for other chemical properties except for TK (Figure 6a) (p < 0.05). NH4-N (Figure 5a), NO3-N (Figure 5b), AP (Figure 5c), AK (Figure 5d), TN (Figure 6b), and SOM (Figure 7) all decreased with increasing soil depth, which was consistent with the changes in the SBD. The soil nutrient content also changed obviously between the two years (p < 0.05). The NH4-N (Figure 5a), AK (Figure 5d), TP (Figure 6c), SOM (Figure 7) contents in 2019 were all lower than those in 2013, which shows that the soil nutrient content in Huoditang declined over the examined six years. A positive relationship between the pH and TN, TP, and AK was observed in the topsoil (Figure 3). With increasing soil depth, the positive correlation decreased until the deep soil showed a negative correlation. Moreover, there were certain correlations between soil physical properties and chemical properties. The soil mechanical composition was affected by the soil NH4-N, TP and AP. The clay content and silt content were directly proportional to NH4-N and inversely proportional to TP and AP.

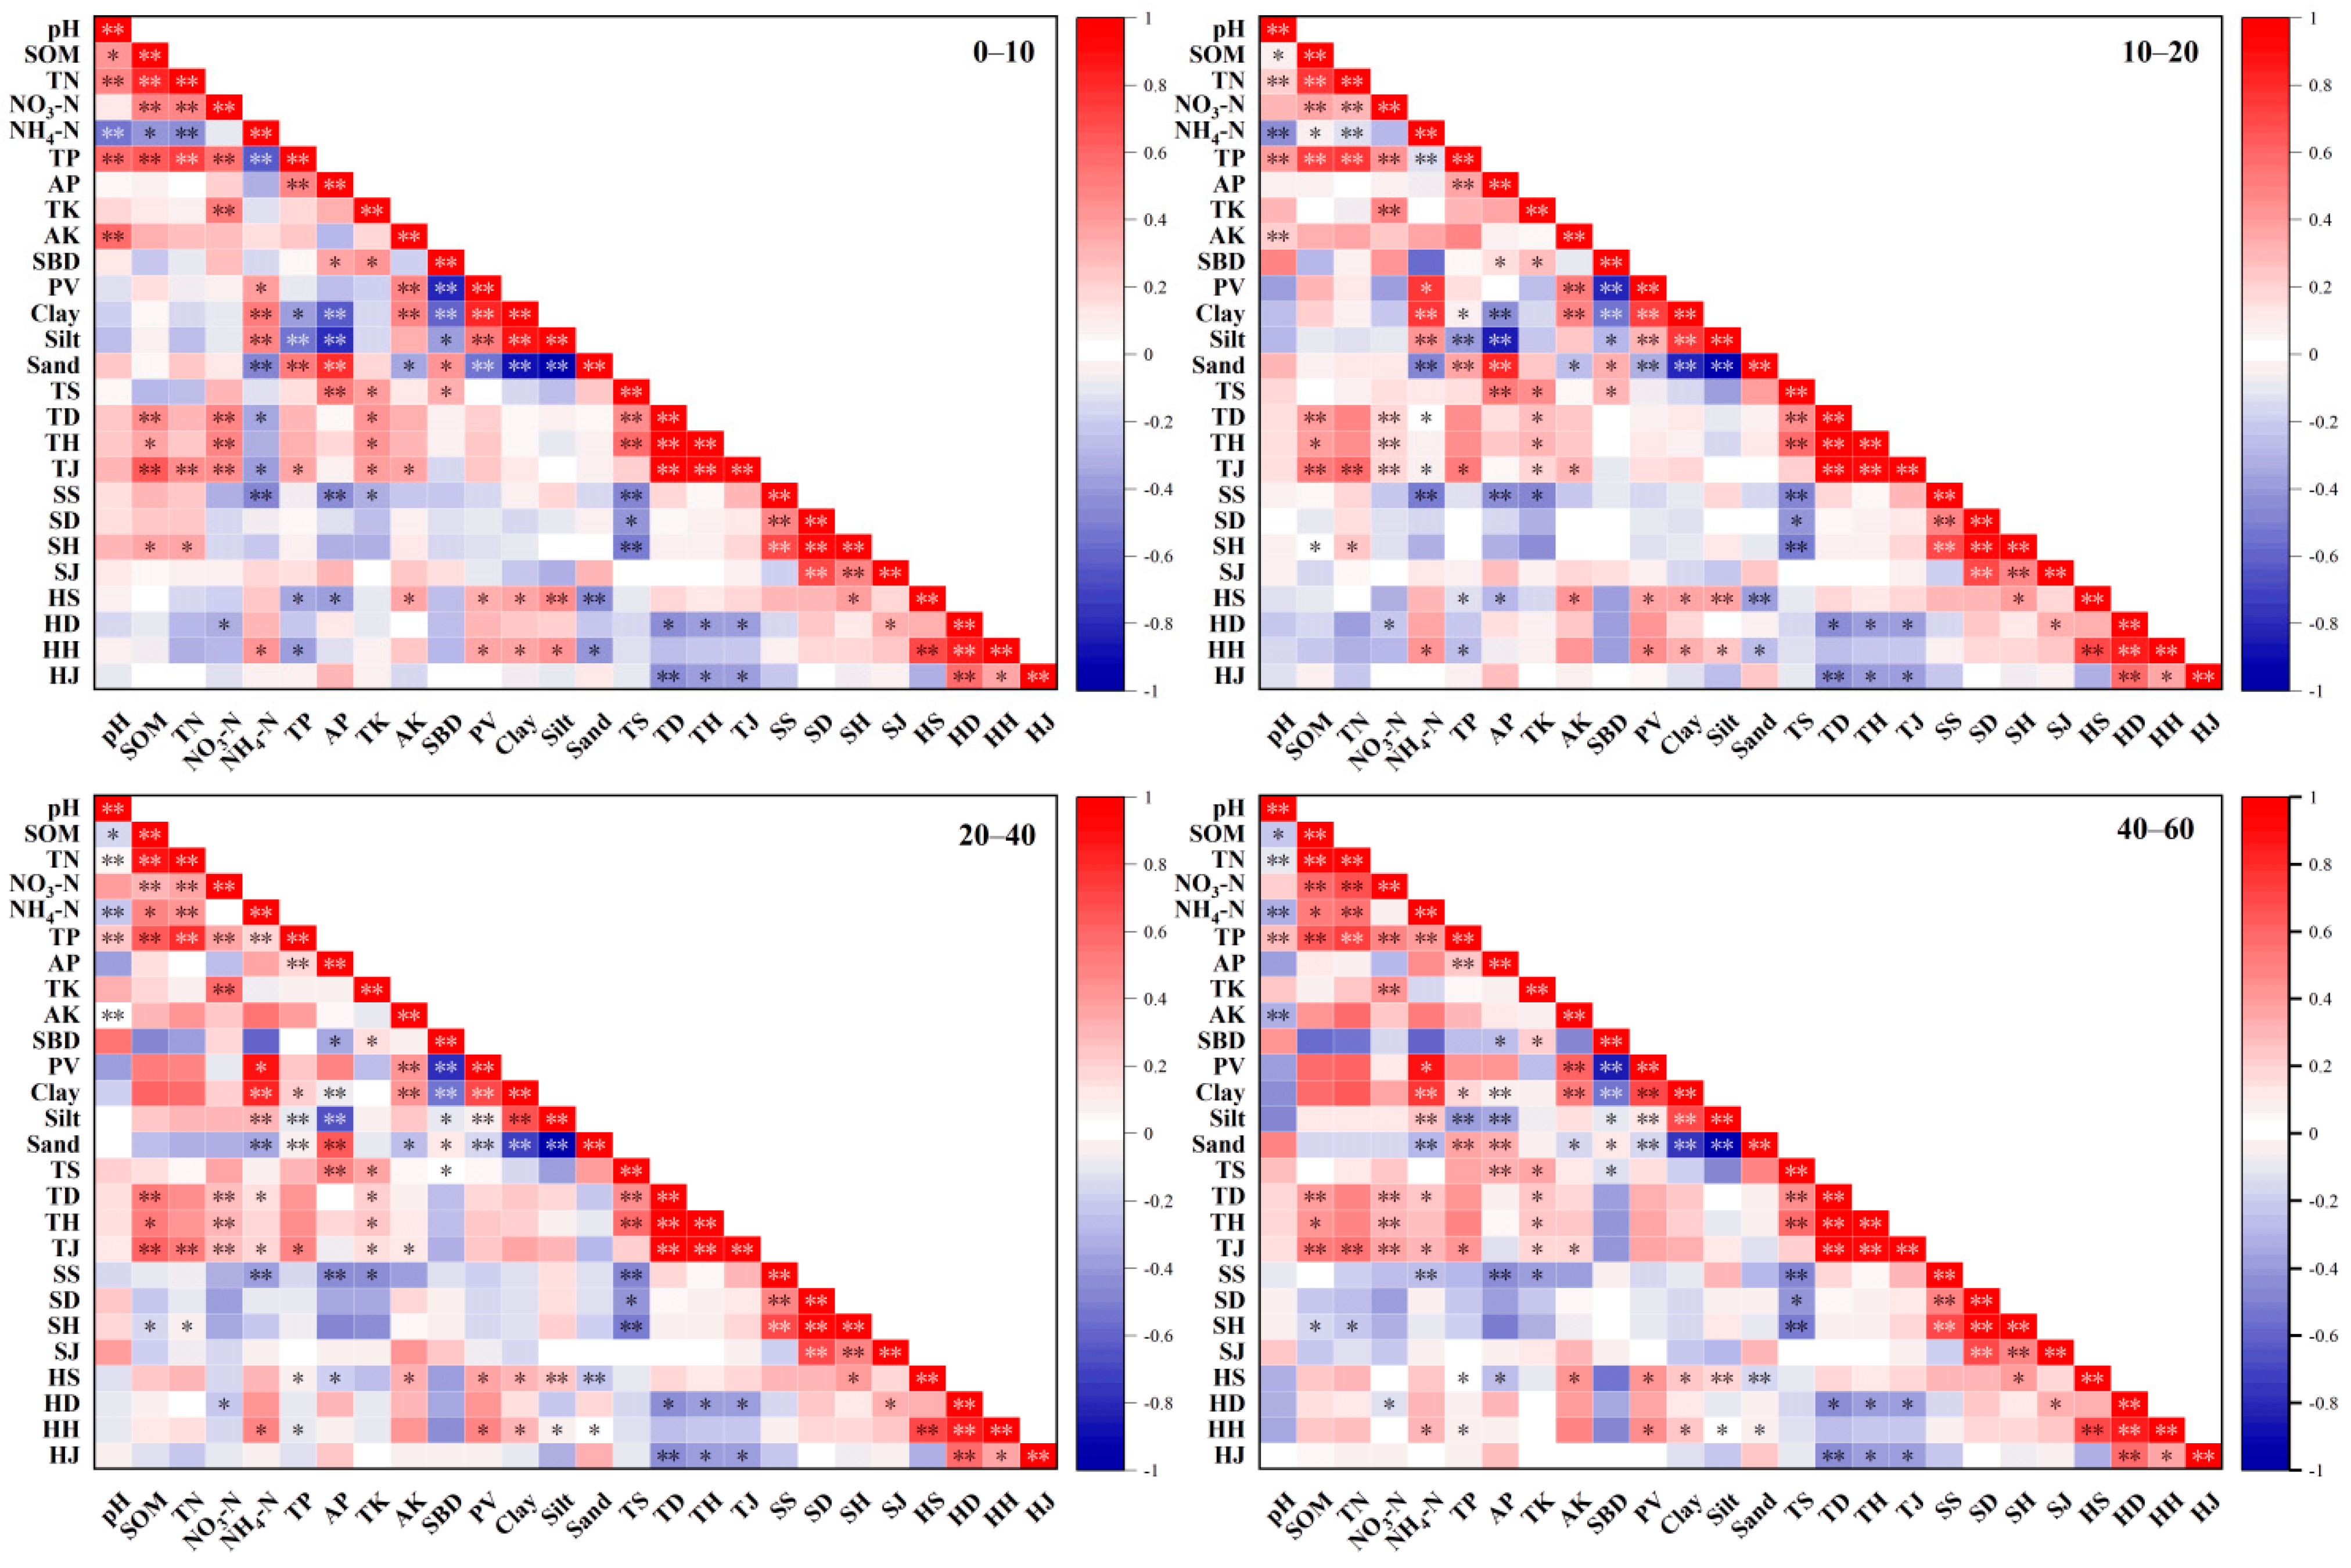
3.4. Correlation between Plant Diversity and Soil Physicochemical Properties

The correlation analysis results showed that plant diversity was related to the soil physicochemical properties in the six forest communities (Figure 3). The species diversity of trees, shrubs and herbs was affected by environmental factors in different soil layers (Figure 8). Trees and herbs were mainly affected by the physicochemical properties of the surface soil, with the explanatory degree of 80.07% and 59.92%, respectively, while shrub diversity was more affected by the middle soil layer (20–40 cm), with explanatory degrees of 72.00%. AP, NO3-N and NH4-N were the most important factors explaining plant diversity in this area. However, herb diversity was more responsive to soil physical properties, which were negatively correlated with the SBD and positively correlated with the soil PV.
The richness index was affected by the AP, NO3-N and NH4-N contents. In addition, the herb richness index was also limited by the SBD (Table 2). The Simpson index values in the tree layer and shrub layer were not significantly affected by single physicochemical properties, and this index was controlled by multiple soil factors. The herb Simpson index mainly regulated the soil PV. The influence of the Shannon–Wiener index on soil physicochemical properties was highly consistent with that of the Simpson index in the tree layer. In the shrub layer, the influence was inversely proportional to the soil NO3-N and AP contents. The herb Shannon–Wiener index was controlled by both soil physical and chemical factors, was proportional to the soil PV and AP and was inversely proportional to the sand and SOM contents. Moreover, there were no obvious relationships between the Pielou index and soil physicochemical properties.

4. Discussion and Conclusions

4.1. Changes in Soil Nutrients in Different Forest Communities

Different forest communities are affected by the decomposition and nutrient release of litter from different vegetation types, thus showing significant differences in physicochemical properties [25]. Studies have shown that under the same environmental conditions, due to the high content of organic acids produced by conifer litter during the decomposition process, soils that develop beneath conifers are more acidic than those under broad-leaved species [26]. This is inconsistent with the results of this study, which may be caused by the presence of a variety of concomitant broad-leaved tree species in YS and HSS forests. Some plant litter contains high concentrations of lignin and cellulose as well as relatively high contents of N, which has a slow decay rate and can lead to the development of thick humified layers in the soil, preventing further soil acidification [27,28]. SOM is the foundation of other soil physicochemical properties and can improve physicochemical sorption and nutrient availability [23]. Overall, the soil nutrient statuses including SOM of the broad-leaved plant community were better than those of the coniferous community. The litter decomposition of broad-leaved tree species is usually stronger than that of coniferous species, and this attribute is more conducive to soil nutrient accumulation. Therefore, in the process of vegetation restoration, the coniferous community is suitable for a certain number of broad-leaved species. The low nutrient content of the RCL community may be related to the fact that the soil is too acidic [29]. For example, P easily forms insoluble compounds with Fe ions and Al ions, resulting in a decrease in the soil P content [30].
In this study, the soil nutrient content decreased with increasing soil depth, which has also commonly been found in other studies [25], and may be closely mirrored by changes in the total microbial and fungal biomasses [31]. Several studies have reported a decrease in soil enzyme activities with increasing depth in forest soils [32]. Furthermore, deep soil receives limited feedback from litter decomposition, making it easier for nutrients to accumulate in the upper soil layer. The soil nutrient content declined within the region during the six years from 2013 to 2019. This may be due to the succession stages in which vegetation restoration occurs. The examined period coincided with the peak of forest density growth, and excessive absorption resulted in the decline of soil nutrient contents [33]. In addition, human disturbance and natural disasters, such as strong winds and rainstorms, were also factors that affected this phenomenon.

4.2. Plant Diversity in Different Communities

The species richness in the tree layer in the YS community was significantly higher than that in the other stands, which might be due to the great difference in tree height between YS and other companion trees, which reduced the competition for factors such as sunlight and growing space. In addition, the dominant position of tall trees in the YS community was not fully established in the early stage of succession; therefore, the species richness in the tree layer was high, but the community stability was insufficient. Similarly, the species diversity in the tree layer was significantly negatively correlated with that in the shrub layer because a lush canopy structure in the tree layer would block the shrub and herb layers, thereby hindering the growth of shrubs and herbs [34]. In addition to soil characteristics, competition between species for other resources (such as sunlight and growing space) in the environment is also an essential factor affecting forest plant diversity [35]. Appropriate tending and management are beneficial to the positive succession of forest communities. Some research has also identified another important stand attribute, the stand composition, which mainly influences herb species rather than woody species [36,37]. Therefore, species diversity is comprehensively affected by various factors and the restoration process of forest ecosystems should consider many aspects. Huoditang forest is a natural secondary forest formed after comprehensive forest logging. After decades of natural recovery, the species diversity of the shrub layer in each forest community was generally higher than that of the tree and herb layers, which reflected the succession stage of vegetation restoration in this forest to a certain extent. This has major implications for predicting the impact of species loss and global change on forest ecosystems [38].

4.3. Relationship between Plant Diversity and Soil Physicochemical Properties

A few studies have indicated that N, P, and K are the most crucial nutrients that determine tree species distributions in many areas [39]. However, even within the same region, different plant communities are subject to different nutrient limitations [40]. In this study, the correlation trends between the plant diversity index in each layer and soil physicochemical factors at different depths were distinct. In general, tree diversity was the most closely related to soil quality, and the relationship between plant diversity in shallow soil was stronger than that in deep soil. The main reason is that the decomposition of litter and nutrient return in the tree layer contributed the main proportion; and the activity of plant roots effectively improved the soil properties of shallow soil, while the changes in deep soil were limited [41,42].
In this study, soil physicochemical properties also significantly affected plant diversity. Tree diversity was associated with increases in soil NO3-N, NH4-N and AP concentrations, which is consistent with the results of previous studies [43,44]. Shrub diversity was also affected by these factors but in a manner opposite to tree diversity. We believe that this is because lush trees hinder shrub diversity increases rather than high soil nutrients inhibit shrub growth. However, herbs have weak roots and a poor competitive ability, and the SBD and soil PV are the main factors that limit their growth. AP can promote the formation and growth of herbs roots and improve their resilience [45]. In many study areas, P is usually considered a limiting factor of plant growth [21,46]. SOM was positively correlated with tree diversity, which is consistent with previous studies [47]. An increase in plant species diversity enhances soil ecosystem functions, including mineralization and decomposition [48]. Other studies have shown that SOM, TN and TP are negatively correlated with plant diversity [49], which may be the reason why high soil nutrient levels resulting in increased plant pathogen attack, negatively impacting plant survival and reducing plant diversity [50]. Only suitable soil nutrient statuses positively affect plant diversity. In many studies, plant diversity often declines with decreasing soil pH values [29,51,52], which is consistent with our findings. However, the loss of diversity due to soil acidification can be offset by nutrient enrichment resulting from atmospheric N deposition [53]. In addition, although soil acidification may hinder tree growth, it also creates more space for plants growth, which balances the loss of species diversity. This suggests that the interaction of other resources required for plant growth may obscure the importance of soil factors on plant diversity [54]. Plant abundance is obviously regulated by soil nutrient content, but the mechanism of its distribution uniformity is not clear and may be disturbed by nutrient heterogeneity or other factors.
At present, the world is facing the crisis of forest ecosystem degradation. To curb this situation, China has adopted a series of measures with a particular focus on forest reconstruction and vegetation restoration after severe deforestation and damage. The Qinling Huoditang forest was severely damaged during the last century, and after decades of natural restoration, a forest ecosystem of a certain scale was formed. However, the results of this study show that from 2013 to 2019, the species diversity in each community did not improve significantly, while the soil nutrient status decreased obviously, which may indicate that the management measures adopted in this forest area need to be improved. Appropriate tending, especially regarding the adjustment of soil nutrients, may be more conducive to the restoration of vegetation and the improvement of service functions in forest ecosystems.

Author Contributions

Conceptualization, J.Y.; Data curation, M.Z., L.Q., C.Z., W.Z., Y.Z. (Yanjun Zhang) and W.W.; Investigation, Y.Z. (Yan Zhao), M.Z., L.Q., C.Z., W.Z., Y.Z. (Yanjun Zhang) and W.W.; Methodology, Y.Z. (Yan Zhao), M.Z. and L.Q.; Project administration, J.Y.; Software, W.Z.; Writing—original draft, Y.Z. (Yan Zhao); Writing—review & editing, J.Y. All authors have read and agreed to the published version of the manuscript.

Funding

This research was funded by the projects “Respiration flux of downed log and its influence mechanism in the Qinling Mountains” (31800372) from the National Natural Science Foundation of China, “Microbial community characteristics of fallen trees during decomposition process at Huoditang forest region in the Qinling Mountains” (2019JQ-641) from the Natural Science Basic Research Plan in Shaanxi Province of China, and “Microbial community characteristics of logs during decomposition process” (2452018076) from the Fundamental Research Funds for the Central Universities of China.

Informed Consent Statement

Informed consent was obtained from all subjects involved in the study.

Data Availability Statement

Data sharing not applicable.

Acknowledgments

We are grateful to the Qinling National Forest Ecosystem Research Station for providing some data and the experimental equipment.

Conflicts of Interest

The authors declare no conflict of interest.

References

  1. Mureva, A.; Ward, D. Soil microbial biomass and functional diversity in shrub-encroached grasslands along a precipitation gradient. Pedobiologia 2017, 63, 37–45. [Google Scholar] [CrossRef]
  2. Ma, T.; Deng, X.; Chen, L.; Xiang, W. The soil properties and their effects on plant diversity in different degrees of rocky desertification. Sci. Total Environ. 2020, 736, 139667. [Google Scholar] [CrossRef] [PubMed]
  3. Wu, S.-H.; Huang, B.-H.; Huang, C.-L.; Li, G.; Liao, P.-C. The Aboveground Vegetation Type and Underground Soil Property Mediate the Divergence of Soil Microbiomes and the Biological Interactions. Microb. Ecol. 2018, 75, 434–446. [Google Scholar] [CrossRef] [PubMed]
  4. Lange, M.; Eisenhauer, N.; Sierra, C.A.; Bessler, H.; Engels, C.; Griffiths, R.; Mellado-Vázquez, P.G.; Malik, A.A.; Roy, J.; Scheu, S.; et al. Plant diversity increases soil microbial activity and soil carbon storage. Nat. Commun. 2015, 6, 6707. [Google Scholar] [CrossRef] [PubMed]
  5. Wu, H.; Xiang, W.; Ouyang, S.; Forrester, D.I.; Zhou, B.; Chen, L.; Ge, T.; Lei, P.; Chen, L.; Zeng, Y.; et al. Linkage between tree species richness and soil microbial diversity improves phosphorus bioavailability. Funct. Ecol. 2019, 33, 1549–1560. [Google Scholar] [CrossRef]
  6. Hou, L.; Zhang, Y.; Li, Z.; Shao, G.; Song, L.; Sun, Q. Comparison of Soil Properties, Understory Vegetation Species Diversities and Soil Microbial Diversities between Chinese Fir Plantation and Close-to-Natural Forest. Forests 2021, 12, 632. [Google Scholar] [CrossRef]
  7. Liu, X.; Tan, N.; Zhou, G.; Zhang, D.; Zhang, Q.; Liu, S.; Chu, G.; Liu, J. Plant diversity and species turnover co-regulate soil nitrogen and phosphorus availability in Dinghushan forests, southern China. Plant Soil 2021, 464, 257–272. [Google Scholar] [CrossRef]
  8. Teste, F.P.; Kardol, P.; Turner, B.L.; Wardle, D.A.; Zemunik, G.; Renton, M.; Laliberté, E. Plant-soil feedback and the mainte-nance of diversity in Mediterranean-climate shrublands. Science 2017, 355, 173–176. [Google Scholar] [CrossRef] [Green Version]
  9. Van Nuland, M.E.; Ware, I.M.; Bailey, J.K.; Schweitzer, J.A. Ecosystem feedbacks contribute to geographic variation in plant–soil eco-evolutionary dynamics across a fertility gradient. Funct. Ecol. 2019, 33, 95–106. [Google Scholar] [CrossRef] [Green Version]
  10. da Silva, A.P.; Babujia, L.C.; Franchini, J.C.; Ralisch, R.; Hungria, M.; Guimarães, M.D.F. Soil structure and its influence on microbial biomass in different soil and crop management systems. Soil Tillage Res. 2014, 142, 42–53. [Google Scholar] [CrossRef]
  11. Gong, Y.; Ling, H.; Lv, G.; Chen, Y.; Guo, Z.; Cao, J. Disentangling the influence of aridity and salinity on community functional and phylogenetic diversity in local dryland vegetation. Sci. Total Environ. 2019, 653, 409–422. [Google Scholar] [CrossRef] [PubMed]
  12. Levine, J.M.; HilleRisLambers, J. The importance of niches for the maintenance of species diversity. Nature 2009, 461, 254–257. [Google Scholar] [CrossRef] [PubMed]
  13. Yan, N.; Marschner, P.; Cao, W.; Zuo, C.; Qin, W. Influence of salinity and water content on soil microorganisms. Int. Soil Water Conserv. Res. 2015, 3, 316–323. [Google Scholar] [CrossRef] [Green Version]
  14. Damgaard, C.; Ejrnaes, R.; Stevens, C.J. Intra-specific spatial aggregation in acidic grasslands: Effects of acidification and nitrogen deposition on spatial patterns of plant communities. J. Veg. Sci. 2013, 24, 25–32. [Google Scholar] [CrossRef]
  15. Cambrollé, J.; Muñoz-Vallés, S.; Mancilla-Leytón, J.M.; Andrades-Moreno, L.; Luque, T.; Figueroa, M.E. Effects of soil physicochemical properties on plant performance of Glaucium flavum Crantz. Plant Soil 2014, 386, 185–193. [Google Scholar] [CrossRef]
  16. Yang, X.; Long, Y.; Sarkar, B.; Li, Y.; Lü, G.; Ali, A.; Yang, J.; Cao, Y.-E. Influence of soil microorganisms and physicochemical properties on plant diversity in an arid desert of Western China. J. For. Res. 2021, 32, 2645–2659. [Google Scholar] [CrossRef]
  17. Price, J.; Tamme, R.; Gazol, A.; De Bello, F.; Takkis, K.; Uria-Diez, J.; Kasari, L.; Pärtel, M. Within-community environmental variability drives trait variability in species-rich grasslands. J. Veg. Sci. 2017, 28, 303–312. [Google Scholar] [CrossRef] [Green Version]
  18. Williams, B.M.; Houseman, G.R. Experimental evidence that soil heterogeneity enhances plant diversity during community assembly. J. Plant Ecol. 2014, 7, 461–469. [Google Scholar] [CrossRef]
  19. Lü, X.; Hu, Y.; Wolf, A.A.; Han, X. Species richness mediates within-species nutrient resorption: Implications for the biodiversity–productivity relationship. J. Ecol. 2019, 107, 2346–2352. [Google Scholar] [CrossRef]
  20. Ge, X.M.; Scholl, J.P.; Basinger, U.; Huxman, T.E.; Venable, D.L. Functional trait trade-off and species abundance: Insights from a multi-decadal study. Ecol. Lett. 2019, 22, 583–592. [Google Scholar] [CrossRef]
  21. Turner, B.; Brenes-Arguedas, T.; Condit, R. Pervasive phosphorus limitation of tree species but not communities in tropical forests. Nature 2018, 555, 367–370. [Google Scholar] [CrossRef]
  22. Chen, L.; Xiang, W.; Wu, H.; Ouyang, S.; Zhou, B.; Zeng, Y.; Chen, Y.; Kuzyakov, Y. Tree species identity surpasses richness in affecting soil microbial richness and community composition in subtropical forests. Soil Biol. Biochem. 2019, 130, 113–121. [Google Scholar] [CrossRef]
  23. Bakker, M.R.; Brunner, I.; Ashwood, F.; Bjarnadóttir, B.; Bolger, T.; Børja, I.; Carnol, M.; Cudlin, P.; Dalsgaard, L.; Erktan, A.; et al. Belowground Biodiversity Relates Positively to Ecosystem Services of European Forests. Front. For. Glob. Chang. 2019, 2, 6. [Google Scholar] [CrossRef] [Green Version]
  24. Xu, Q.; Zhang, F.; Xu, Z.Q.; Jia, Y.L.; You, J.M. Some characteristics of Simpson index and the Shannon-Wiener index and their dilution effect. Pratacult. Sci. 2011, 28, 527–531. [Google Scholar]
  25. Danise, T.; Innangi, M.; Curcio, E.; Fioretto, A. Covariation between plant biodiversity and soil systems in a European beech forest and a black pine plantation: The case of Mount Faito, (Campania, Southern Italy). J. For. Res. 2021, 33, 239–252. [Google Scholar] [CrossRef]
  26. Antisari, L.V.; Marinari, S.; Dell’Abate, M.; Baffi, C.; Vianello, G. Plant cover and epipedon SOM stability as factors affecting brown soil profile development and microbial activity. Geoderma 2011, 161, 212–224. [Google Scholar] [CrossRef]
  27. Danise, T.; Innangi, M.; Curcio, E.; Fioretto, A.; Guggenberger, G. Fast Spectrophotometric Method as Alternative for CuO Oxidation to Assess Lignin in Soils with Different Tree Cover. Forests 2020, 11, 1262. [Google Scholar] [CrossRef]
  28. Innangi, M.; Menta, C.; Pinto, S.; Danise, T.; D’Alessandro, F.; Fioretto, A. Integrating chemical, biological and soil fauna variables during beech leaf litter decay: A partial least squares approach for a comprehensive view of the decomposition process. Appl. Soil Ecol. 2018, 130, 69–78. [Google Scholar] [CrossRef]
  29. Zarfos, M.R.; Dovciak, M.; Lawrence, G.B.; McDonnell, T.; Sullivan, T.J. Plant richness and composition in hardwood forest understories vary along an acidic deposition and soil-chemical gradient in the northeastern United States. Plant Soil 2019, 438, 461–477. [Google Scholar] [CrossRef] [Green Version]
  30. Fan, Y.; Zhong, X.; Lin, F.; Liu, C.; Yang, L.; Wang, M.; Chen, G.; Chen, Y.; Yang, Y. Responses of soil phosphorus fractions after nitrogen addition in a subtropical forest ecosystem: Insights from decreased Fe and Al oxides and increased plant roots. Geoderma 2019, 337, 246–255. [Google Scholar] [CrossRef]
  31. Chen, F.; Kissel, D.E.; West, L.T.; Rickman, D.; Luvall, J.C.; Adkins, W. Mapping surface soil organic carbon for crop fields with remote sensing. J. Soil Water Conserv. 2005, 60, 51–57. [Google Scholar]
  32. Fioretto, A.; Innangi, M.; De Marco, A.; Menta, C.; Papa, S.; Pellegrino, A.; De Santo, A.V. Discriminating between Seasonal and Chemical Variation in Extracellular Enzyme Activities within Two Italian Beech Forests by Means of Multilevel Models. Forests 2018, 9, 219. [Google Scholar] [CrossRef] [Green Version]
  33. Yan, B.S.; Sun, L.P.; Li, J.J.; Gao, L.Q.; Qiao, Z.G.; Gao, X.W.; Wu, C.X.; Wang, G.L. Changes of soil enzyme activity and their stoichiometric characteristics during secondary succession of Quercus liaotungensis forests. Chin. J. Ecol. 2022, 1–9. [Google Scholar] [CrossRef]
  34. Wei, L.; Archaux, F.; Hulin, F.; Bilger, I.; Gosselin, F. Stand attributes or soil micro-environment exert greater influence than management type on understory plant diversity in even-aged oak high forests. For. Ecol. Manag. 2020, 460, 117897. [Google Scholar] [CrossRef]
  35. Harpole, W.S.; Tilman, D. Grassland species loss resulting from reduced niche dimension. Nature 2007, 446, 791–793. [Google Scholar] [CrossRef]
  36. Zilliox, C.; Gosselin, F. Tree species diversity and abundance as indicators of understory diversity in French mountain forests: Variations of the relationship in geographical and ecological space. For. Ecol. Manag. 2014, 321, 105–116. [Google Scholar] [CrossRef] [Green Version]
  37. Wei, L.; Chevalier, R.; Archaux, F.; Gosselin, F. Influence of stand attributes and skid trail area on stand-scale ground flora diversity. Can. J. For. Res. 2015, 45, 1816–1826. [Google Scholar] [CrossRef] [Green Version]
  38. Yaseen, M.; Fan, G.; Zhou, X.; Long, W.; Feng, G. Plant Diversity and Soil Nutrients in a Tropical Coastal Secondary Forest: Association Ordination and Sampling Year Differences. Forests 2022, 13, 376. [Google Scholar] [CrossRef]
  39. Wang, L.; Wang, P.; Sheng, M.; Tian, J. Ecological stoichiometry and environmental influencing factors of soil nutrients in the karst rocky desertification ecosystem, southwest China. Glob. Ecol. Conserv. 2018, 16, e00449. [Google Scholar] [CrossRef]
  40. Liu, C.; Liu, Y.; Guo, K.; Qiao, X.; Zhao, H.; Wang, S.; Zhang, L.; Cai, X. Effects of nitrogen, phosphorus and potassium addition on the productivity of a karst grassland: Plant functional group and community perspectives. Ecol. Eng. 2018, 117, 84–95. [Google Scholar] [CrossRef]
  41. Córdova, S.C.; Olk, D.C.; Dietzel, R.N.; Mueller, K.E.; Archontouilis, S.V.; Castellano, M.J. Plant litter quality affects the accumulation rate, composition, and stability of mineral-associated soil organic matter. Soil Biol. Biochem. 2018, 125, 115–124. [Google Scholar] [CrossRef] [Green Version]
  42. Tipping, E.; Rowe, E.; Evans, C.; Mills, R.; Emmett, B.; Chaplow, J.; Hall, J. N14C: A plant–soil nitrogen and carbon cycling model to simulate terrestrial ecosystem responses to atmospheric nitrogen deposition. Ecol. Model. 2012, 247, 11–26. [Google Scholar] [CrossRef] [Green Version]
  43. De Groote, S.R.E.; Vanhellemont, M.; Baeten, L.; De Schrijver, A.; Martel, A.; Bonte, D.; Lens, L.; Verheyen, K. Tree species diversity indirectly affects nutrient cycling through the shrub layer and its high-quality litter. Plant Soil 2018, 427, 335–350. [Google Scholar] [CrossRef]
  44. Zhou, X.; Wu, W.; Niu, K.; Du, G. Realistic loss of plant species diversity decreases soil quality in a Tibetan alpine meadow. Agric. Ecosyst. Environ. 2019, 279, 25–32. [Google Scholar] [CrossRef]
  45. Liu, J.; Gou, Q.Q.; Wang, G.H.; Zhao, F.X.; Tang, X.J. Changes of vegetation community and soil characteristics of 50 years old artificial caragana korshinskii in sandy-hilly region of northwest shanxi province. J. Soil Water Conserv. 2022, 36, 219–230. [Google Scholar]
  46. Zemunik, G.; Turner, B.; Lambers, H.; Laliberté, E. Increasing plant species diversity and extreme species turnover accompany declining soil fertility along a long-term chronosequence in a biodiversity hotspot. J. Ecol. 2016, 104, 792–805. [Google Scholar] [CrossRef] [Green Version]
  47. Gamfeldt, L.; Snall, T.; Bagchi, R.; Jonsson, M.; Gustafsson, L.; Kjellander, P.; Ruiz-Jaen, M.C.; Froberg, M.; Stendahl, J.; Philipson, C.D.; et al. Higher levels of multiple ecosystem services are found in forests with more tree species. Nat. Commun. 2013, 4, 1340. [Google Scholar] [CrossRef]
  48. Morin, X.; Fahse, L.; Scherer-Lorenzen, M.; Bugmann, H. Tree species richness promotes productivity in temperate forests through strong complementarity between species. Ecol. Lett. 2011, 14, 1211–1219. [Google Scholar] [CrossRef]
  49. Hagen-Thorn, A.; Callesen, I.; Armolaitis, K.; Nihlgård, B. The impact of six European tree species on the chemistry of mineral topsoil in forest plantations on former agricultural land. For. Ecol. Manag. 2004, 195, 373–384. [Google Scholar] [CrossRef]
  50. Liu, Y.; Yu, S.; Xie, Z.-P.; Staehelin, C. Analysis of a negative plant-soil feedback in a subtropical monsoon forest. J. Ecol. 2012, 100, 1019–1028. [Google Scholar] [CrossRef]
  51. Xu, H.; Liu, Q.; Wang, S.; Yang, G.; Xue, S. A global meta-analysis of the impacts of exotic plant species invasion on plant diversity and soil properties. Sci. Total Environ. 2021, 810, 152286. [Google Scholar] [CrossRef] [PubMed]
  52. Xue, W.; Bezemer, T.M.; Berendse, F. Soil heterogeneity and plant species diversity in experimental grassland communities: Contrasting effects of soil nutrients and pH at different spatial scales. Plant Soil 2019, 442, 497–509. [Google Scholar] [CrossRef] [Green Version]
  53. Simkin, S.M.; Allen, E.B.; Bowman, W.D.; Clark, C.M.; Belnap, J.; Brooks, M.L.; Cade, B.S.; Collins, S.L.; Geiser, L.H.; Gilliam, F.S.; et al. Conditional vulnerability of plant diversity to atmospheric nitrogen deposition across the United States. Proc. Natl. Acad. Sci. USA 2016, 113, 4086–4091. [Google Scholar] [CrossRef] [PubMed] [Green Version]
  54. Härdtle, W.; von Oheimb, G.; Westphal, C. The effects of light and soil conditions on the species richness of the ground vegetation of deciduous forests in northern Germany (Schleswig-Holstein). For. Ecol. Manag. 2003, 182, 327–338. [Google Scholar] [CrossRef]
Figure 1. Plot distribution map. Different colors represent different forest communities, and the red-marked points are the locations of the sample plots. HSS indicates Pinus armandii forest, YS indicates Pinus tabulaeformis forest, HSSTS indicates mixed P. armandii and Tsuga chinensis forest, RCL indicates Quercus aliena var. acuteserrata forest, HH indicates Betula albosinensis Burkill forest, QQ indicates Picea wilsonii forest, YSRCL indicates mixed P. tabulaeformis and Q. aliena var. acuteserrata forest, HSSHH indicates mixed P. armandii and B. albosinensis Burkill forest, TS indicates T. chinensis forest, LYS indicates Larix principis-rupprechtii forest, LYSRCL indicates mixed L. principis-rupprechtii and Q. aliena var. acuteserrata forest.
Forests 13 00648 g001
Figure 2. Diversity indices of different forest communities and different forest layers in both 2013 and 2019; (S) Richness index, (D) Simpson index, (H) Shannon–Wiener index and (J) Pielou index.
Forests 13 00648 g002
Figure 3. Correlation analysis between soil physicochemical properties and plant diversity indexes. * p < 0.05, ** p < 0.01. (TS) tree richness index, (TD) tree Simpson index, (TH) tree Shannon–Wiener index, (TJ) tree Pielou index, (SS) Shrub richness index, (SD) Shrub Simpson index, (SH) shrub Shannon–Wiener index, (SJ) shrub Pielou index, (HS) herb richness index, (HD) herb Simpson index, (HH) herb Shannon–Wiener index, (HJ) herb Pielou index.
Forests 13 00648 g003
Figure 4. Physical properties of different forest communities at four soil depths in both 2013 and 2019; (a) soil pH, (b) soil porosity, (c) soil bulk density, (d) soil mechanical composition.
Forests 13 00648 g004aForests 13 00648 g004b
Figure 5. Soil available nutrient content of different forest communities at four soil depths in both 2013 and 2019; (a) soil ammonium nitrogen, (b) soil nitrate nitrogen, (c) soil available phosphorus, (d) soil available potassium.
Forests 13 00648 g005aForests 13 00648 g005b
Figure 6. Total available nutrient content of different forest communities at four soil depths in both 2013 and 2019; (a) soil total potassium, (b) soil total nitrogen, (c) soil total phosphorus.
Forests 13 00648 g006aForests 13 00648 g006b
Figure 7. Soil organic matter (SOM) content of different forest communities at four soil depths in both 2013 and 2019.
Forests 13 00648 g007
Figure 8. Redundancy analysis of soil physicochemical properties and diversity indexes of trees, shrubs and herbs. Each vertical row depicts the same plant layer, and each horizontal row depicts the same soil layer.
Forests 13 00648 g008
Table 1. Plot characteristics. Ⅰ, Ⅱ and Ⅲ represent the three plots in each forest community, and the density is the number of trees per hectare.
TypeAltitude (m)Slope (°)Aspect (°)Age (a)Stand Density (Trees·ha−1)
IIIIIIIIIIIIIIIIIIIIIIIIIIIIII
YS149715481690212520318291310555055154816851576
RCL159716401758182023247263255505550158914861575
HSS146015321760182427133147155656060128613581395
HSSTS18471863189730403710910587606555145812811588
QQ1980200320201012152032101957568729861058978
HH203220512131142025348325335454248164517851652
Table 2. Stepwise regression analysis of soil physicochemical properties and four diversity indexes of trees, shrubs and herbs.
LayerDiversity
Index
Stepwise Regress ModelMultiple
Correlation
Integration FSignificance
0–10TSTS = 1.075AP + 5.9990.25411.5720.002
10–20TS = 1.539AP + 5.7370.27212.7020.001
20–40TS = 1.906AP + 1.673NO3-N + 0.650.46714.4470
40–60TS = 0.407TK − 0.17Silt + 11.1180.3418.5530.001
0–10TDTD = 0.03NO3-N − 0.013NH4-N + 0.5670.3077.3060.002
10–20TD = 0.18TN + 0.019TK − 0.0730.3278.0260.001
20–40TD = 0.011SOM + 0.2820.27813.1030.001
40–60TD = 0.187TN + 0.3790.2139.2170.005
0–10THTH = 0.069NO3-N − 0.026NH4-N + 1.1890.3067.2590.002
10–20TH = 1.033TP − 0.7680.219.0530.005
20–40TH = 0.024SOM + 0.6150.27512.8790.001
40–60TH = 0.422TN + 0.8220.2199.530.004
0–10TJTJ = 0.018TK + 0.012SOM − 0.3830.4915.8520
10–20TJ = 0.186TN + 0.30.34417.8230
20–40TJ = 0.011SOM + 0.2850.37320.1970
40–60TJ = 0.2TN + 0.3810.30114.6440.001
0–10SSSS = −1.337AP − 0.472NH4-N + 20.3710.62427.3790
10–20SS = −1.323AP − 0.495NH4-N + 18.2550.48115.2840
20–40SS = −1.681AP − 1.461NO3-N + 17.3960.41111.5180
40–60SS = −1.172AP − 0.503TK + 22.2980.3739.8020
20–40SDSD = −0.051NO3-N − 0.048AP + 0.9820.3448.6660.001
40–60SD = −0.068NO3-N − 0.044AP + 1.000.39710.8410
0–10SHSH = 0.278TN − 0.054NO3-N + 1.4810.2856.5750.004
10–20SH = 0.134TN − 0.048TK + 2.4490.2425.2790.01
20–40SH = −0.196AP − 0.163NO3-N + 2.5790.49516.1710
40–60SH = −0.188NO3-N − 0.171AP + 2.5410.4815.2140
0–10SJSJ = 00.026AP + 0.001AK + 0.6270.24.1160.025
20–40SJ = 0.115pH + 0.002AK − 0.060.3267.9790.001
0–10HSHS = 0.11Silt + 1.7750.2048.7250.006
10–20HS = 0.039AK − 0.745NO3-N + 6.1530.3769.9570
20–40HS = −8.158SBD − 0.977AP + 19.4450.2766.2810.005
40–60HS = −8.609SBD − 0.892AP + 20.9110.42912.3910
10–20HDHD = 0.003PV − 0.072TN + 0.650.3639.3990.001
20–40HD = 0.004PV − 0.004SOM + 0.5910.2796.3780.005
0–10HHHH = 0.094AP − 0.010Sand + 2.0070.2716.1250.005
10–20HH = 0.012PV − 0.013SOM + 1.2990.3549.0380.001
20–40HH = 0.01PV + 0.9270.2239.7840.004
40–60HH = 0.006AK + 0.930.24911.260.002
Publisher’s Note: MDPI stays neutral with regard to jurisdictional claims in published maps and institutional affiliations.

