Article

Beta Diversity Patterns Unlock the Community Assembly of Woody Plant Communities in the Riparian Zone

1
Key Laboratory of Ecology of Rare and Endangered Species and Environmental Protection, Guangxi Normal University, Ministry of Education, Guilin 541006, China
2
College of Forestry, Guangxi University, Nanning 530004, China
*
Author to whom correspondence should be addressed.
These authors contributed equally to this work.
Forests 2022, 13(5), 673; https://doi.org/10.3390/f13050673
Submission received: 1 March 2022 / Revised: 23 April 2022 / Accepted: 25 April 2022 / Published: 27 April 2022
(This article belongs to the Special Issue Maintenance of Forest Biodiversity)

Abstract

:
Beta diversity refers to changes in community composition across time and space, including species richness and replacement. Few studies have examined beta diversity patterns of riparian vegetation communities in terms of taxonomic, phylogenetic and functional attributes. In this study, we conducted a field survey of woody plant communities in the riparian zone of the Lijiang River Basin in China. We analyze variations in taxonomic, phylogenetic and functional beta diversity, the relative contributions of species richness and replacement to beta diversity and the relationships between beta diversity and environmental distance and geographical distance. The results show that: (1) replacement was the dominant component of taxonomic beta diversity and richness was the dominant component of functional and phylogenetic beta diversity; and (2) dispersal limitation and habitat filtering jointly drive the community assembly of woody plant communities in the riparian zone of the Lijiang River Basin. Therefore, when formulating conservation strategies for woody plants along the Lijiang River riparian zone, improving ecological communities and enhancing species dispersal between communities should be given equal attention. From a taxonomic perspective, it is more suitable to establish several small nature reserves, whereas from phylogenetic and functional perspectives, protection should focus on larger nature reserves.

1. Introduction

Understanding the mechanisms driving the formation, maintenance and loss of biodiversity represents the focus of community ecology and contributes to sustainable development and the effective protection of biodiversity [1,2]. Beta diversity, as an important part of biodiversity, reflects turnover in species composition between communities along a predefined spatial, temporal or environmental gradient [3]. Studies have found that the loss of beta diversity could lead to biological homogenization and even reduce ecosystem functions [4]. Thus, analyzing ecological community construction processes that drive patterns of beta diversity has become a hot topic in recent years [5,6].
Beta diversity has decomposed two processes: replacement and richness [7,8]. The replacement component of beta diversity represents species replacement between locations. Mechanisms contributing to species replacement (or turnover) include habitat filtering, competition and geographic barriers [9,10]. For example, natural selection along environmental gradients can contribute to different species appearing in habitats suitable for survival [11]. Geographical isolation caused by the uplift of mountains can fragment populations and promote allopatric speciation [12]. The richness component of beta diversity represents the difference in species composition between communities caused by the loss or increase of species along the sampling axis or throughout the study area. Mechanisms that can influence richness include diversity of niches available and species thinning causing nestedness or other ecological processes (e.g., historical processes: extinction and colonization) [13,14]. Disentangling the relative roles of replacement and richness in contributing to beta diversity is necessary to understand the processes driving beta diversity and to design protected area networks.
As traditionally conceived, beta diversity quantifies the diversity of communities based on the taxonomy and abundance of species—the change in species between ecological communities [15,16]. However, communities may contain species that have redundant evolutionary relationships and functional attributes. Changes in species often lack a one-to-one relationship with phylogenetic and functional attributes. Phylogenetic beta diversity can partially remedy this gap by reflecting differences in evolutionary relatedness between communities; it also reflects the impact of historical processes on community construction [17]. Functional beta diversity refers to the value and range of functional traits in ecosystems or communities, taking into account the redundancy and complementarity of coexisting species and reflecting differences in the functional attributes of species between communities [18]. Therefore, understanding beta diversity from the perspectives of taxonomy, phylogeny and functional traits is necessary to accurately grasp the ecological processes and mechanisms driving beta diversity.
The riparian zone of the Lijiang is heterogeneous along its 168-km length. It is an important ecological transition zone for material, energy and information exchange between river ecosystems and terrestrial ecosystems [19]. It provides an excellent natural experimental platform for exploring beta diversity distribution patterns and drivers [20]. In recent years, tourism and excessive development in China’s Lijiang River Basin have seriously damaged vegetation in the basin’s riparian zone, and the ecology of the basin has changed significantly [21]. Riparian vegetation, particularly woody plants, contributes to most riparian ecosystem functions. Therefore, research into the restoration and protection of woody plants diversity, including beta diversity, is crucial.
Here, we investigated the taxonomic, phylogenetic and functional beta diversity patterns of woody plant communities in the riparian zone of the Lijiang River basin in China. We aim to understand and compare the processes responsible for shaping the beta diversity patterns from these three perspectives. We addressed the following questions: (1) Is the formation of the distribution of woody plant communities in the riparian zone of the Lijiang River Basin driven by replacement or richness? (2) Considering community assembly in terms of taxonomic, phylogenetic and functional beta diversity, what is the importance of environmental filtering and dispersal limitation? The answers to these questions will provide scientific guidance for the conservation of woody plant biodiversity in the region, including the selection of priority conservation sites and the formulation of conservation plans (e.g., improving the community environment or enhancing species dispersal between communities).

2. Materials and Methods

2.1. Study Area

Our study area is located in the Lijiang River Basin in the northeast of Guangxi Zhuang Autonomous Region, China. It is in the upper reaches of the Guijiang River, covering a length of approximately 164 km, with an average elevation of 158 m, as a primary tributary of the Xijiang River in the Pearl River Basin. The geographic coordinates are 24°18′–25°41′ N, 109°45′–110°40′ E. It has been listed as a World Natural Heritage Site since 2014 and is a popular tourist destination deriving from its unique karstic landscape. The karst landform is a rare geomorphological type with fragile ecosystems that are slow to recover after disturbance [22]. In recent years, excessive tourism-related development and other anthropogenic disturbances have interacted to influence the highly variable and complex Lijiang River Basin system. The area is in the humid monsoon climate zone within the mid-subtropical zone, with a mild climate and four distinct seasons. Annual rainfall is abundant but extremely uneven during the year. The flood season occurs from March to August, and the dry season occurs from September to February. The annual average temperature is 18–19 °C, the coldest January average temperature is about 8–9 °C and the hottest August average temperature is about 28 °C. Rainfall is concentrated in the warm season. The annual rainfall is 1814–1941 mm, the annual evaporation is 1377–1857 mm and the annual average relative humidity is 73%–79%. The year-round sunshine is sufficient, and the annual average sunshine time is 1670 h. Soil type is dominated by red loam and has the features of high coarse texture, gravel-type substrates, shallow soil layer and unevenly distributed soil layer thickness [19,21] for years of continuous erosion and deposition by river water. Common woody plant in the riparian zone of the Lijiang River Basin includes Pterocarya stenoptera C. DC., Triadica sebifera (L.) Small, Celtis sinensis Pers., Cinnamomum burmannii (Nees & T. Nees) Blume, Cinnamomum camphora (L.) J. Presl, Ficus abeli Miq., Vitex negundo var. cannabifolia (Sieb.et Zucc.) Hand.-Mazz., Flueggea virosa (Roxb. ex Willd.) Royle, Rauvolfia verticillat (Lour.) Baill., Adina rubella Hance and so on.

2.2. Data Collection

2.2.1. Field Survey

This study is based on a field survey of woody plant communities. A total of 12 different sites were randomly selected and they were distributed in geographically separated regions, spanning a wide spatial range, ranging from 110°19′ to 110°34′ E in longitude and from 24°44′ to 25°54′ N in latitude (Figure 1). Each site was set up with 4–8 20 m × 20 m plots—a total of 65 plots. Community surveys of all plots were performed according to the standard ForestGeo protocol (https://forestgeo.si.edu/node/145665/, accessed on 7 May 2018). The census of 65 plots was completed in 2018, recording 15,100 free-standing individuals and belonging to 78 species, representing 64 genera and 32 families. The plots covered various community types. They can be divided into nine associations on the basis of the species importance values calculation, including ASS. P. stenoptera-F. abelii, ASS. C. sinensis-B. formosana + F. abelii, ASS. P. stenoptera-A. chinense, ASS. C. sinensis-F. abelii, ASS. C. burmannii-R. verticillate, ASS. R. verticillate, ASS. T. sebiferum-A. rubella, ASS. C.sinensis-V. negundo var. cannabifolia and ASS. T. sebiferum-B. formosana (please see Table A1 in Appendix A).

2.2.2. Functional Traits Measurement

We measured 6 functional traits for the 78 species based on standardized protocols proposed by Pérez-Harguindeguy et al. [23], including leaf chlorophyll content (LCC), leaf thickness (LT), leaf area (LA), leaf dry matter content (LDMC), specific leaf area (SLA) and twig tissue density (TTD). These traits were selected as they are known to represent the different dimensions of the functional niche, such as carbon economy, nutrient acquisition, water economy in leaves and stems among woody plants. Specifically, SLA captures species strategies for acquiring, using and conserving resources, including light, nutrients and water [24]; TTD reflects twig water and nutrient transport, structure and defense [25]. All tree individuals with a diameter at breast height (DBH, 1.3 m) ≥ 1 cm and shrub and woody vine individuals with a basal diameter (BD) ≥ 1 cm were sampled to measure functional traits data during the summer season (from June to August) in 2018. For every individual, we sampled at least three newly matured leaves and three branches at different positions. Among them, LCC was estimated by measuring red/infrared absorbance with a SPAD-502 chlorophyll meter (Spectrum Technologies, Plainfield, IL, USA). SPAD measurements were converted into chlorophyll concentrations using the homographic calibration model from Coste et al. [26]. LT was measured with a caliper (precision: 0.05 mm). LA was measured using a YMJ-C scanner with a corresponding self-developed measurement software system (Shandong, China). The leaves were put on the instrument and took real-time photos to process the data information. The leaves were then oven-dried at 70 °C for 48 h and weighed to calculate the SLA and LDMC. TTD was calculated as the oven-dried mass of a twig divided by its fresh volume.

2.2.3. Environmental Variables Measurement

We divided each 20 m × 20 m plot into four 10 m × 10 m subplots and then collected soil nutrients on 10 m × 10 m subplots for fine-scale analysis of environment factors. We measured environmental data in a total of 200 10 m × 10 m subplots. In each 10 m × 10 m subplot, a soil sampler was used to collect soil samples at five random points. At each sampling point, after removing the possible organic layer, a soil sample with a depth of 10–20 cm was collected. The soil samples at five points in each subplot were mixed as a test sample. We analyzed the physical and chemical properties of each test sample using methods that have been described by Bao Shidan [27], including soil pH (pH), water content (SWC), organic matter (SOM), total nitrogen (TN), available nitrogen (AN), total phosphorus (TP), available phosphorus (AP), total potassium (TK) and available potassium (AK). Among them, pH was determined in a 1:2.5 soil-to-water suspension ratio. SWC was measured as the fresh soil weight minus oven-dried weight divided by the fresh weight. SOM was determined by wet oxidation with KCr2O7 + H2SO4 and titrated with FeSO4. TN was determined using automatic Kjeldahl analysis (KJELTECTM 8400, FOSS Quality Assurance Co., Ltd., Hillerød, Denmark). AN was quantified using the alkaline hydrolysis diffusion method. TP was examined by acid digestion with a H2SO4 + HClO4 solution. AP was extracted with 0.5 M Na2CO3, and it was measured using the molybdenum blue colorimetric method. TK was digested by the HF-HClO4-HNO3 acid mixture and determined by the flame photometric method. AK was determined by flame photometry after extraction with ammonium acetate. The elevation data were recorded with a handheld GPS. Finally, we averaged the four 10 m × 10 m subplots as the environment factors of each of the 20 m × 20 m plots for subsequent analyses.

2.3. Statistical Analyses

2.3.1. Spatial Variables

We recorded latitude and longitude of each plot by GPS. Then, we calculated the spatial distance based on the distm function in the “geosphere” package of R software to transform the coordinates to distance [28].

2.3.2. Phylogenetic Tree Construction

For subsequent phylogenetic beta diversity analyses, we created a phylogenetic supertree that included all of our species (a data set of 78 total species sampled across 12 sites (65 20 m × 20 m)) using scenario 1 in the “V. Phylomaker” R package (see Appendix B for more details) [29].

2.3.3. Beta Diversity Calculation

Taxonomic, phylogenetic and functional beta diversity and their components were all calculated by applying pairwise-site and multiple-site dissimilarity methods [30]. Based on the taxonomic data (abundance of species at each site), phylogenetic data (phylogenetic tree across all of the sites) and functional attribute data (six traits’ Euclidean distances), we calculated the Jaccard dissimilarity index to calculate taxonomic (Tβ), phylogenetic (Pβ) and functional (Fβ) beta diversity indexes. We further decomposed total beta diversity (βtotal) into the sum of replacement (βrepl) and richness (βrich) [17]. βrepl refers to the differences between the communities caused by one-to-one replacement of species composition or system evolution (functional attributes). βrich emphasizes differences between communities due to differences in species composition or system evolution (functional attributes) in richness. The calculation formula is as follows:
β total = β repl + β rich
β total = b + c a + b + c
β rich = | b   -   c | a + b + c
β repl = 2   ×   min ( b , c ) a + b + c
where a represents the number of species or phylogenetic (functional attribute) branch length shared by the two communities, and b and c respectively represent the number of species or phylogenetic (functional attribute) branch length unique to the two communities.
We then sought to better understand the relative contribution of environmental filtering and dispersal limitation on the three dimensions of beta diversity. First, we computed spearman correlations between variables to assess the collinearity of environmental variables, where elevations were excluded for spearman ρ2 > 0.5. Then, we calculated the Euclidean distance between filtered environmental variables to the obtained environmental distance matrix. On this basis, we applied ln(x + 1) transformations on the geographic and environmental distance matrix to meet the assumptions of normality and homogeneity of variance [31,32]. We also performed a partial Mantel correlation analysis between geographic distance or environmental distance and the replacement components to test the relative importance of environmental filtering and dispersal limitation. If environmental distance was significantly correlated with beta diversity, we took a further step to test which environmental variables were more important in determining taxonomic, phylogenetic and functional beta diversity by conducting permutational MANOVA analyses [33].
All statistical analyses were conducted using R version 4.1.0 [34]. Among them, the taxonomic, phylogenetic and functional beta diversity calculations were based on the “BAT” package [35], the partial Mantel analysis was based on the “ecodist” package [36] and the Euclidean distances and permutational MANOVA analysis was performed using the package “vegan” [37].

3. Results

3.1. Patterns of Taxonomic, Functional and Phylogenetic Beta Diversity with Their Two Components

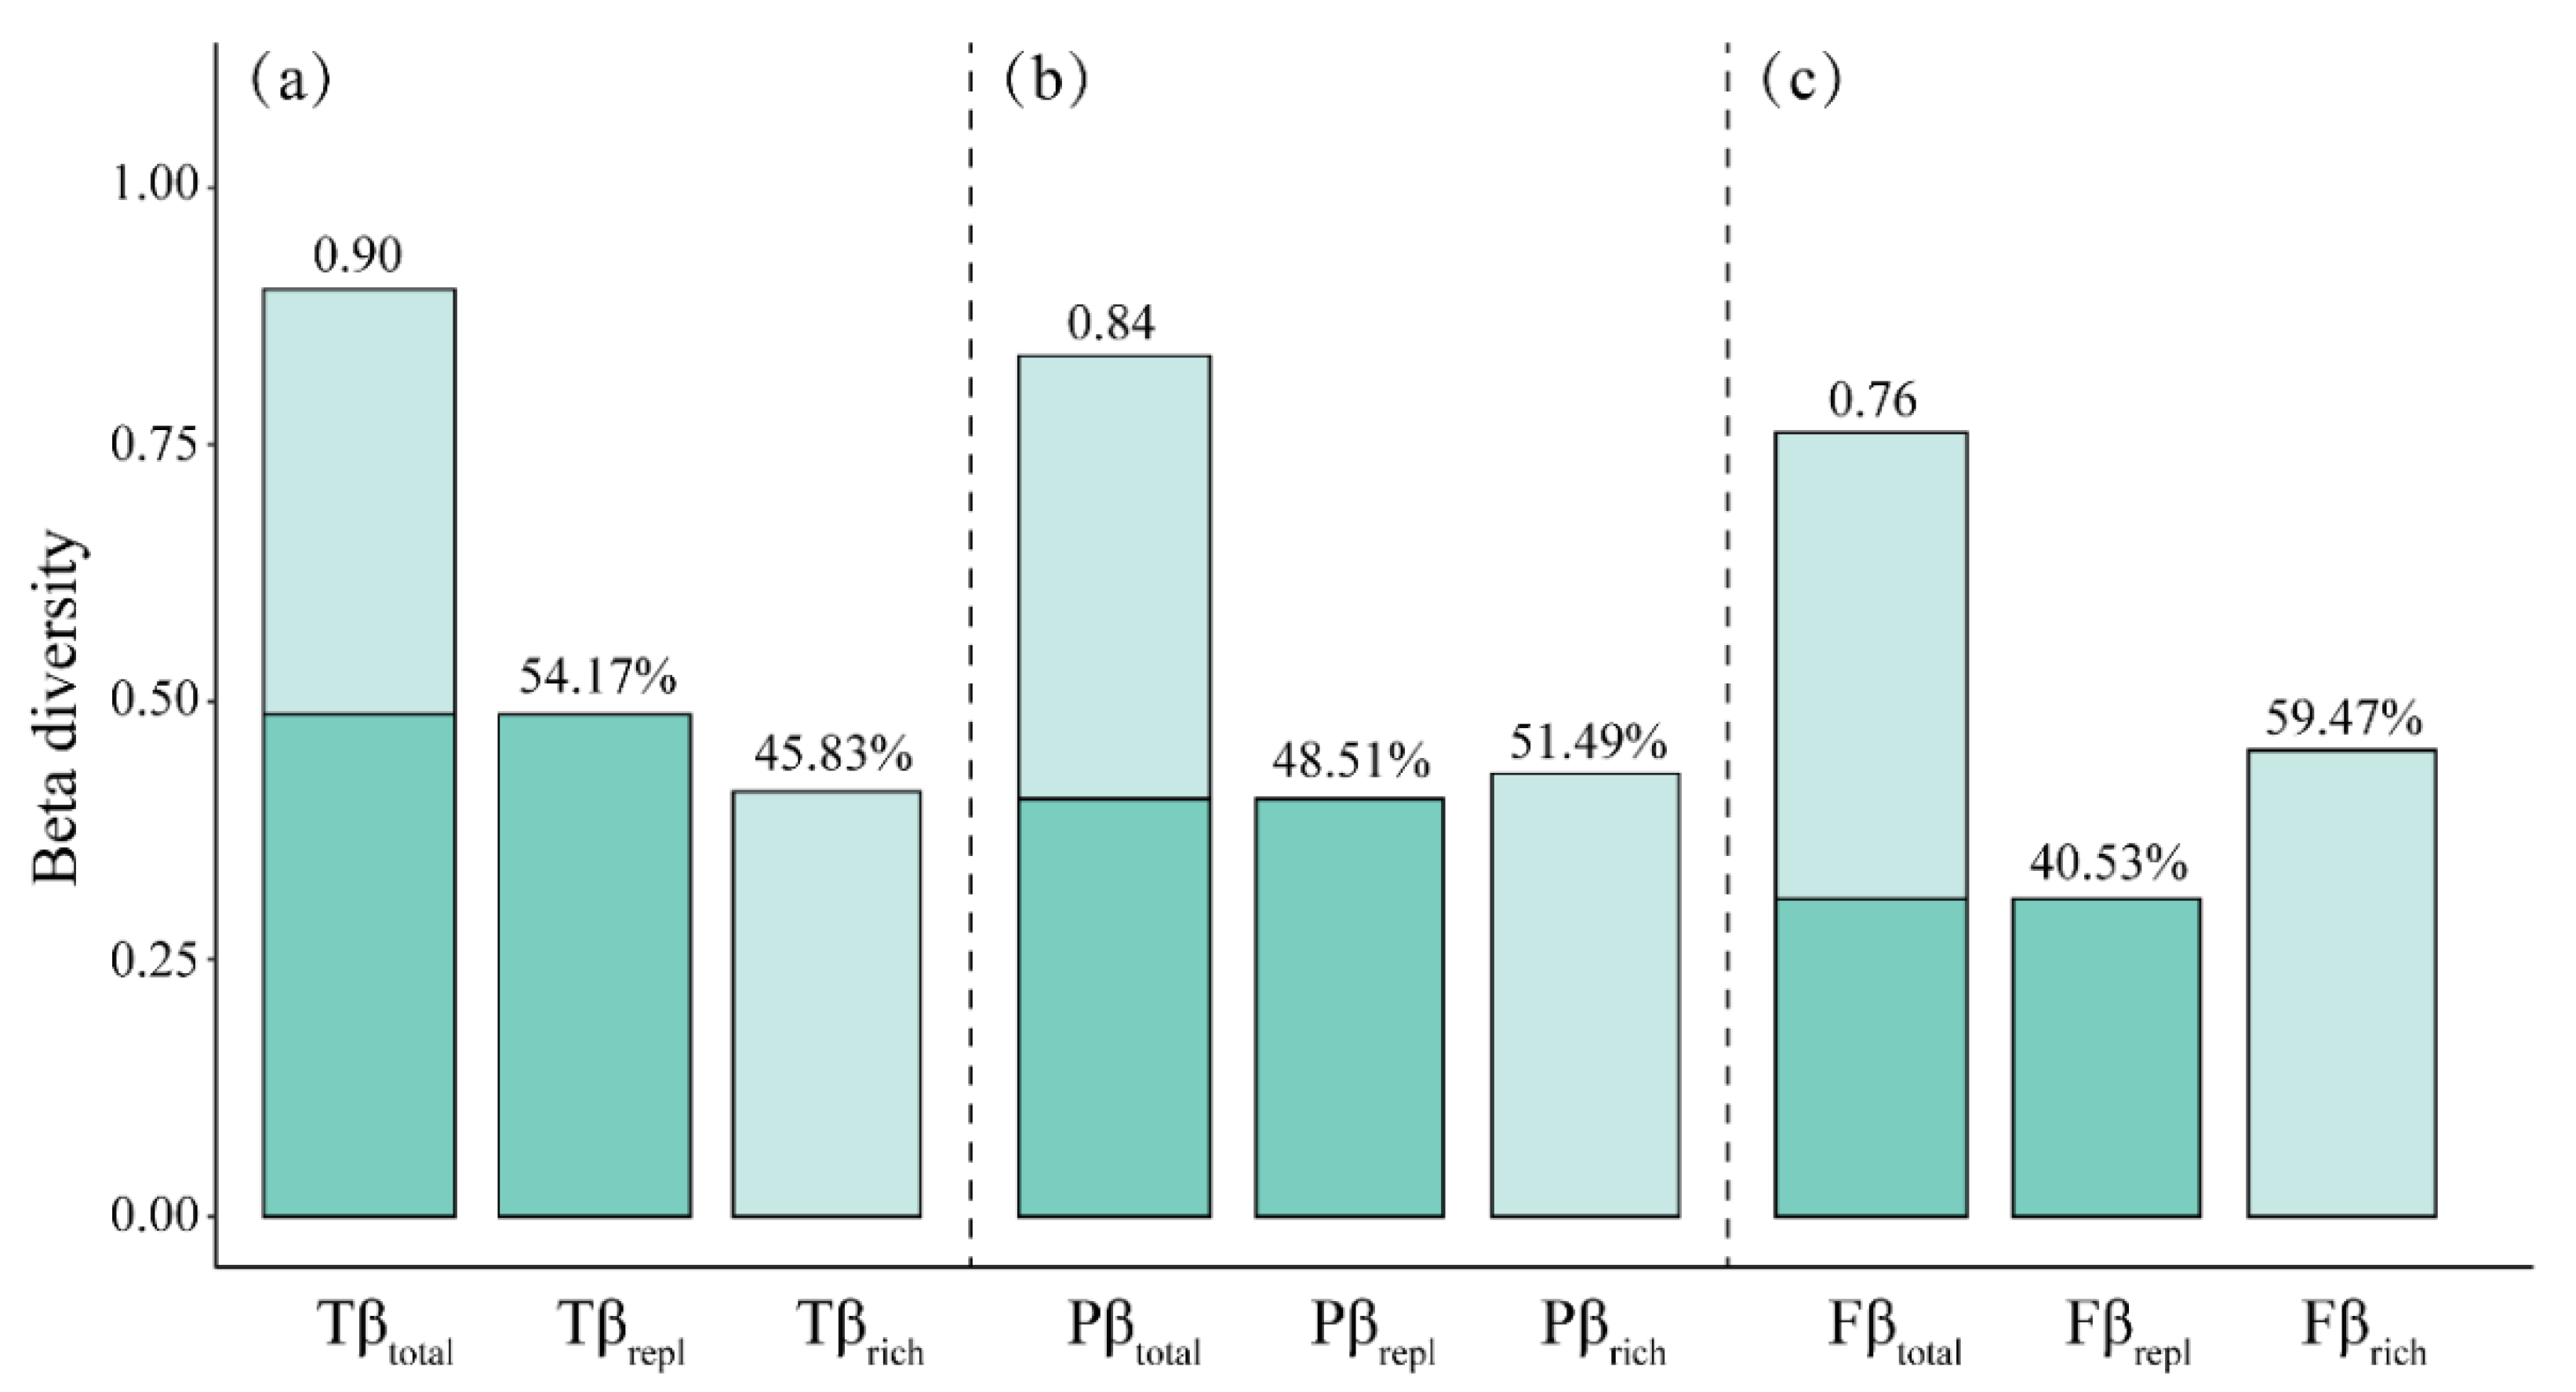
The mean values of taxonomic, functional and phylogenetic beta diversity were 0.90, 0.84 and 0.76, respectively. The relative proportions of replacement and richness components on taxonomic beta diversity were 54.17% and 45.83%, 48.51% and 51.49% on functional beta diversity and 40.53% and 59.47% on phylogenetic beta diversity. All in all, replacement was the dominant component of taxonomic beta diversity and richness was the dominant component of functional and phylogenetic beta diversity along the riparian zone of the Lijiang (Figure 2).

3.2. The Influence of Environmental Filtering and Dispersal Limitation on Beta Diversity Patterns

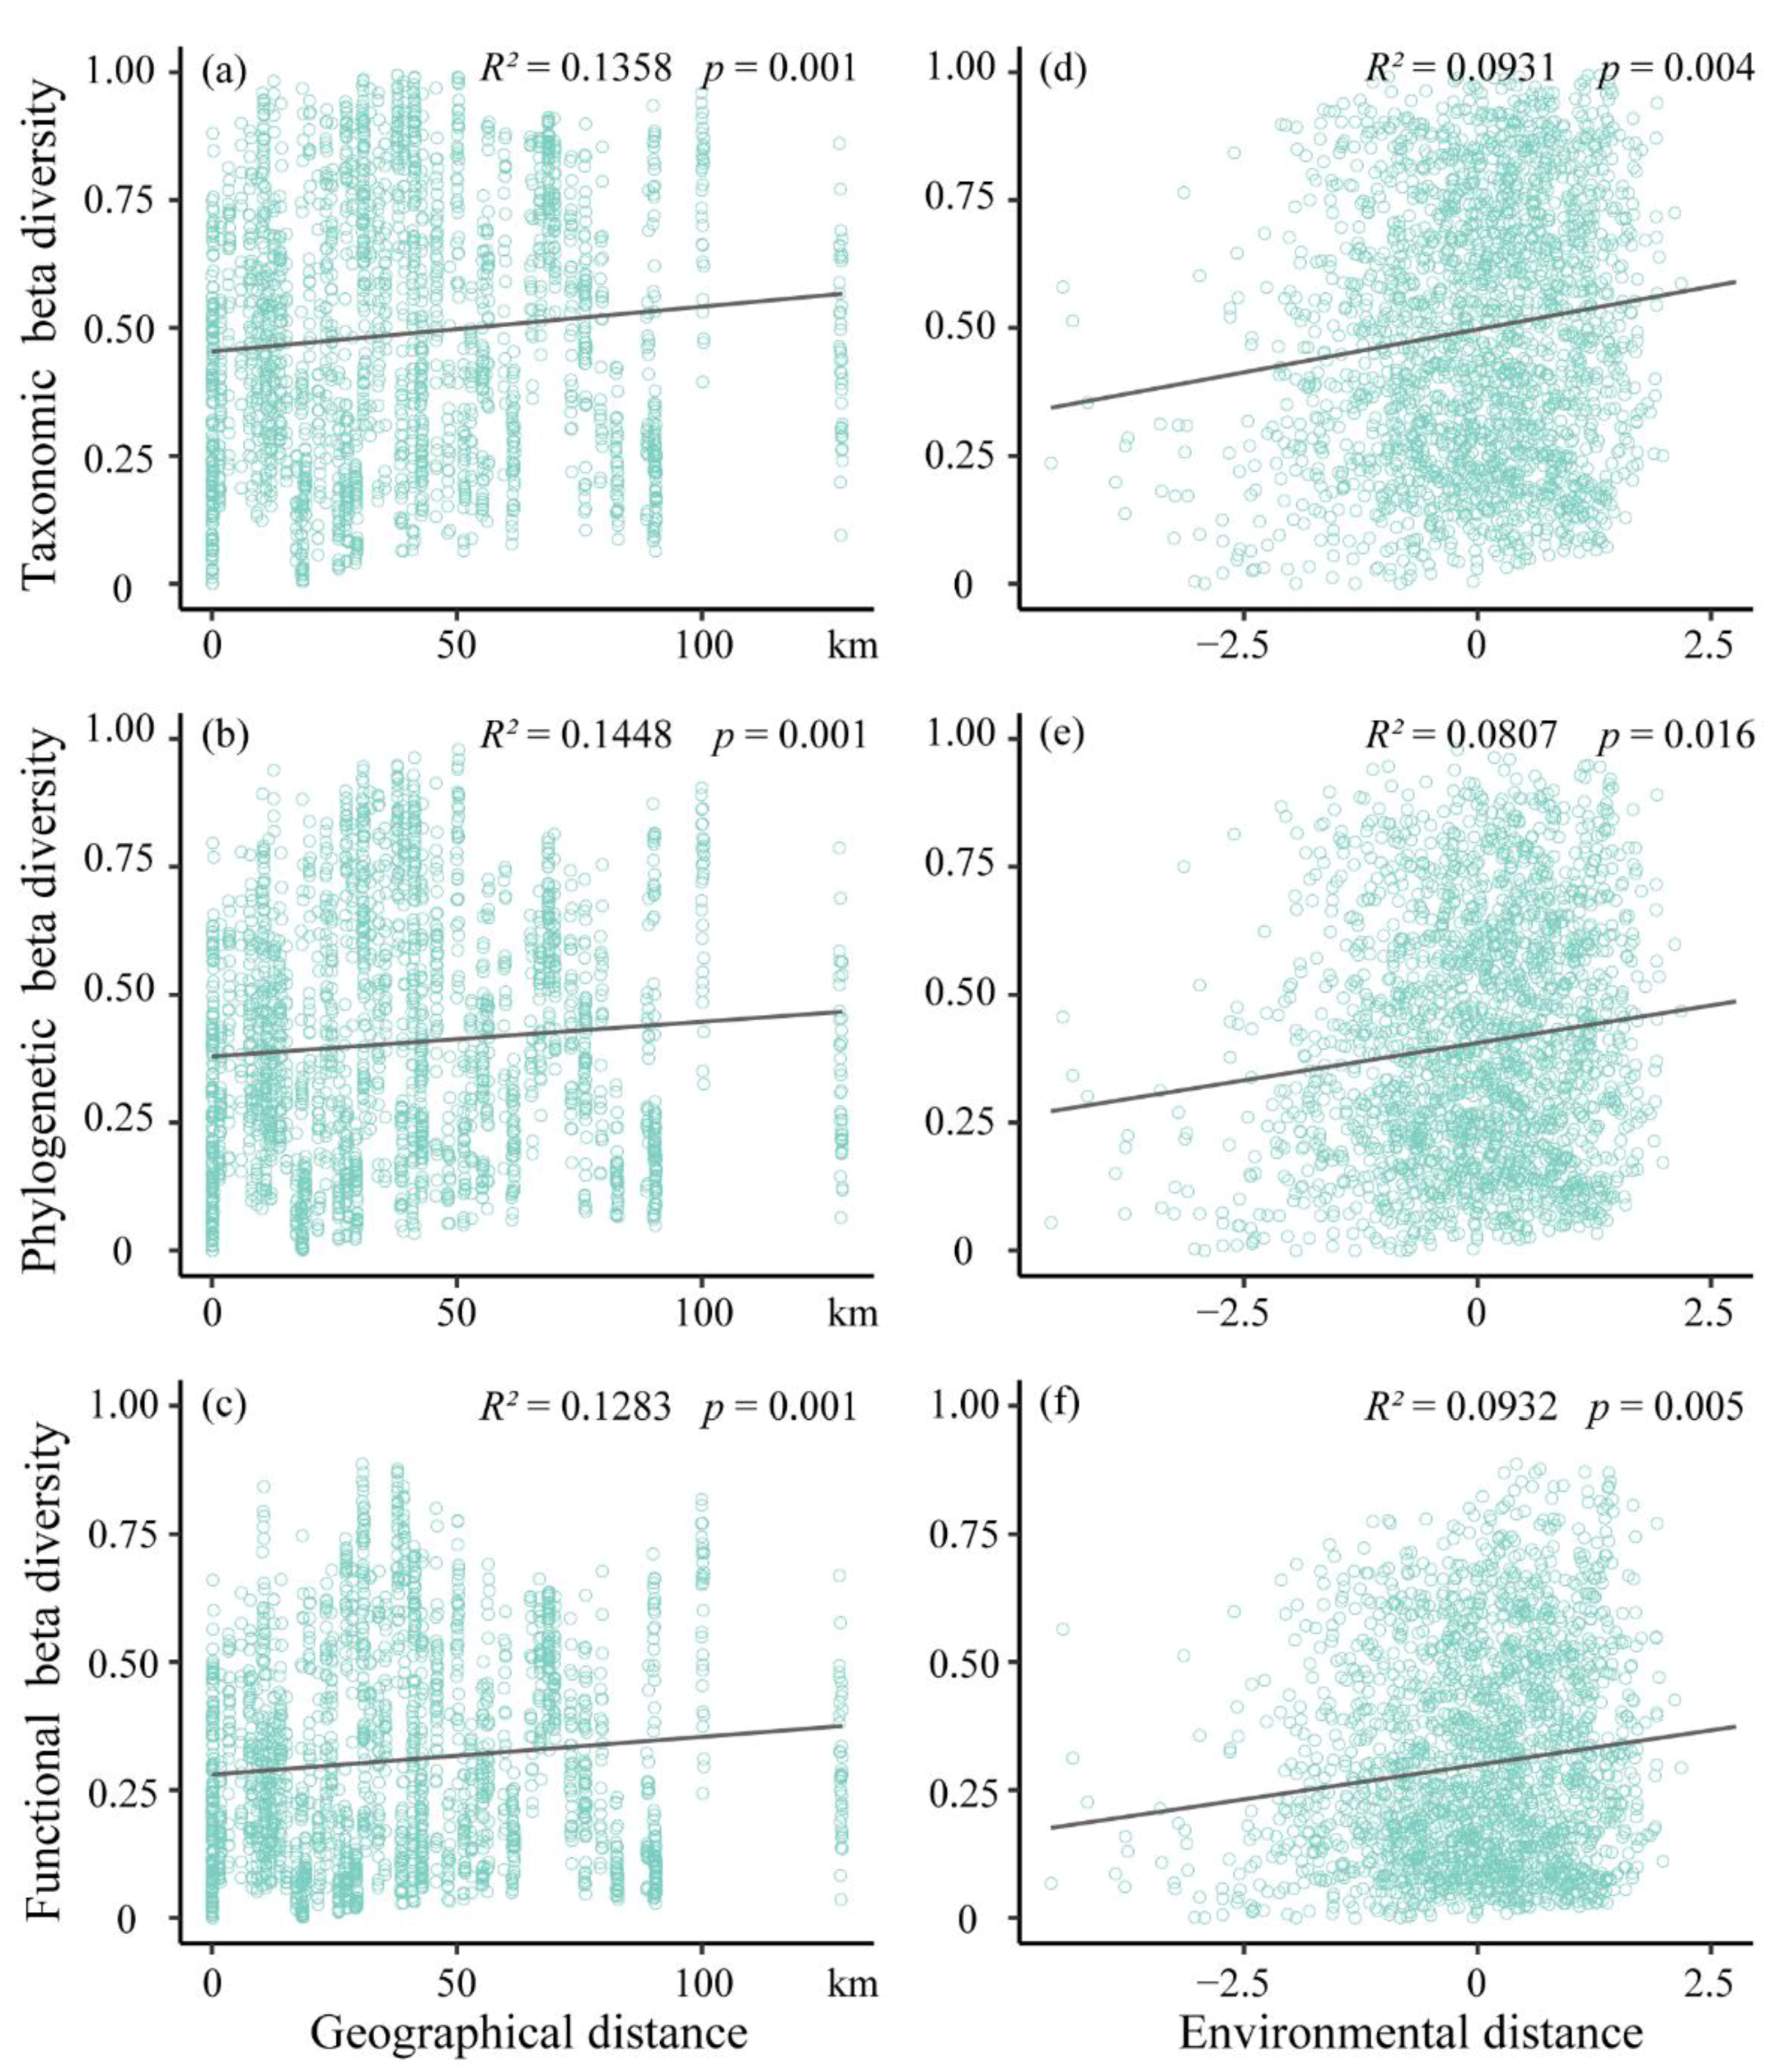
With the increases in environmental distance and geographic distance, the replacement components of beta diversity (taxonomic, phylogenetic and functional) of the riparian plant communities in the Lijiang River Basin increased significantly (Figure 3). Partial Mantel correlation analysis revealed that the replacement components of beta diversity are subject to a combination of diffusional limitations and environmental filtering. Specifically, for taxonomic beta diversity, dispersal limitation alone explained 13.58% of the variation, and environmental filtering alone explained 9.31% of the variation. For phylogenetic diversity, dispersal limitation alone explained 14.48% of the variation, and environmental filtering alone explained 8.07% of the variation. For functional beta diversity, dispersal limitation alone explained 12.83% of the variation, and environmental filtering alone explained 9.32% of the variation.

3.3. The Influence of Environmental Factors on Beta Diversity

According to the results of permutational MANOVA analysis of variance (Table 1), soil pH, SOM, TN, AN, TP, AP, TK and AK had significant effects on taxonomic and phylogenetic diversity, except SWC had no significant effect. For functional beta diversity, soil pH, SOM, TN, AN, TP, AP, TK and AK had significant effects, while SWC and SOM had no significant effects. Overall, environmental factors explained a considerable portion of the variation, accounting for 50.3%–59.4%.

4. Discussion

4.1. The Composition of Taxonomic, Functional and Phylogenetic Beta Diversity with Their Two Components

Historically, taxonomic-based analyses of community assembly have been the most common approach used to characterize regional biodiversity and biogeographical processes [38]. However, recent efforts to incorporate functional and phylogenetic dimensions into the community assembly framework have provided further insights [6,39]. The findings showed the same results as those from previous studies: taxonomic > phylogenetic > functional beta diversity. One possible explanation for this pattern is that there exist redundant species tending to share the similar phylogenetic relations and functional traits in our study sites [40,41]. For example, if two different species within a community have very different functional traits, turnover in those species will increase the value of phylogenetic beta diversity and functional beta diversity. In contrast, if the similar species with redundant traits turnover, the value of phylogenetic beta diversity and functional beta diversity will often be smaller than taxonomic beta diversity. Consistent with a growing body of studies, we found that replacement was the dominant component of taxonomic beta diversity [42,43,44]. That suggests that the difference in taxonomic composition among sites was mainly caused by high species substitution. A recent broad study in a nearby Atlantic forest found that replacement patterns are associated with environmental heterogeneity and variability in species attributes [45]. The Lijiang River Basin, which stretches more than 160 km from the upstream to downstream, shows different environmental heterogeneity and geographic spatial gradient [46]. Many seeds of riparian species can drift along the river, but most appeared to colonize in nearby areas. It might be that habitat conditions vary with geographical distance, hindering the spread of the seeds along the riverbank so that sites further away are not suited for poorly dispersed species, leading to high species change in species composition [47]. Another result showed that richness was the dominant component of functional and phylogenetic beta diversity. Dobrovolski et al. [48] found that the nestedness component had a more important role in generating beta diversity patterns in high latitude areas affected by glaciation. However, the Lijiang River Basin without high latitude was not covered by an ice-sheet during the Last Glacial Maximum; the glaciation hypothesis proposed by previous authors may not explain the pattern of dominant nestedness component of functional and phylogenetic beta diversity. The only acceptable explanation for this general pattern is under special karst environmental stress; many of the surviving species at fine scale share large elements of their evolutionary history, which results in species convergent functional traits and phylogenetic clustering across sites [16].

4.2. The Relative Importance of Dispersal Limitation and Environmental Filtering

We found that dispersal limitation and environmental filtering jointly shaped beta diversity in taxonomic, functional and phylogenetic dimensions, and dispersal limitation effects are slightly higher than environmental filtering effects in community assembly. Some researchers theorize high-diversity forests (e.g., tropical forests, subtropical forests) reflect strong spatial correlations with the diversity, indicating the important role of dispersal limitation [49]. Our findings support this general hypothesis; many species have not reached places with favorable conditions because of dispersal limitation. A possible explanation is as follows: (1) the unique geological characteristics and hydrological structure resulting in special Lijiang River Basin karst landforms act as a geographical barrier to hinder the spread of the seeds along the riverbank; (2) excessive tourism-related development on the Lijiang River Basin midstream section act as an anthropogenic barrier to affect the species surviving rate successfully; (3) species dispersal capacity. Generally, species with larger propagules were more strongly affected by dispersal limitation than species with smaller species propagules [50]. Compared with some other factors, complex topographical features, anthropogenic disturbance and species dispersal capacity are likely to be more important drivers of the beta diversity distribution.
Additionally, we found that environmental filtering also had a significant impact on beta diversity distribution. In further testing of environmental variables, we found that environmental factors, such as soil pH, TN, AN, TP, AP, TK and AK, were significantly correlated with the three measures of beta diversities (Table 1). It is well known that nitrogen, phosphorus and potassium in soil play important roles in maintaining forest productivity [51], and soil pH may modify the nutrient availability of P and K by controlling their chemical forms [52]. These results imply that soil nutrients are important factors driving woody plant community assembly in the riparian zone of the Lijiang River Basin. Taken together, the driving mechanisms of taxonomic, phylogenetic and functional beta diversity are generally consistent in the Lijiang River riparian woody plant community, dominated by dispersal limitation and environmental filtering, but with slightly different emphases in each dimension. For example, for environmental filtering processes, taxonomic and functional beta diversity have higher convergent roles due to the complex and harsh karst habitats. However, it is also possible that this is due to the fact that we measure a limited number of local environment variables. Previous studies have shown that phylogenetic diversity was influenced by the combined effect of paleoclimate and modern climate [53], so it is necessary to incorporate more environmental variables, such as climatic factors, into the environmental analysis in future research.

5. Conclusions

Examining multiple facets and components of beta diversity is becoming an important topic in biodiversity research because it can provide information about the mechanisms driving community assembly [54,55]. In the present study, we found that (1) taxonomic beta diversity is dominated by replacement components, while phylogenetic and functional beta diversity are dominated by richness components. To conserve riparian biodiversity in the Lijiang River Basin from a taxonomic perspective, it is more suitable to establish several small nature reserves, whereas from phylogenetic and functional perspectives, the protection focus should be put on larger nature reserves. (2) Dispersal limitation and environmental filtering jointly drive the composition of woody plant communities in the riparian zone of the Lijiang River Basin. Thus, when formulating conservation strategies for woody plants along the Lijiang River riparian zone, both improving ecological community environmental conditions and enhancing species dispersal between communities should be given equal attention. Given the complexity of community assembly mechanisms, we recommend that future studies should integrate other components of biodiversity such as the intraspecific variation in functional and phylogenetic diversity [56]. These can bring further insights into species coexistence, resource use, niche overlap, plasticity and local adaptations, as well as the development of tools to assess the scales and biodiversity components for which a given management measure is the most cost-efficient (prioritization).

Author Contributions

Conceptualization, Y.J. and S.L.; methodology, Y.J.; validation, Y.J., S.L. and Y.H.; formal analysis, Y.H.; investigation, R.L.; resources, S.L.; data curation, R.L.; writing—original draft preparation, Y.H. and S.L.; writing—review and editing, R.L. and Y.J.; visualization, Y.H.; funding acquisition, Y.J. All authors have read and agreed to the published version of the manuscript.

Funding

This research was funded by the National Natural Science Foundation of China (31860124), Guangxi Natural Science Foundation (2022GXNSFAA035600), Innovation Project of Guangxi Graduate Education (JGY2021024), Key Laboratory of Ecology of Rare and Endangered Species and Environmental Protection (Guangxi Normal University), Ministry of Education, China (ERESEP2021Z08) and Guangxi Normal University Scientific Research and Education Special Project (Natural Science) (RZ2100000150).

Institutional Review Board Statement

Not applicable.

Informed Consent Statement

Not applicable.

Data Availability Statement

The data presented in this study are available on request from the corresponding author.

Acknowledgments

We are grateful to numerous students from the Chinese Guangxi Normal University for their support in conducting the tough fieldwork.

Conflicts of Interest

The authors declare no conflict of interest.

Appendix A

Table A1. Site information.
SitePlotLongitudeLatitudeCommunity Type
Caiyuan1–7110°27′41.00″ E25°33′41.37″ NASS. P. stenoptera-F. abelii
Zhuzhi8–12110°24′20.68″ E25°28′47.21″ NASS. C. sinensis-B. formosana + F. abelii
Yangjia13–17110°22′30.08″ E25°24′48.87″ NASS. P. stenoptera-F. abelii
Nanchang18–22110°22′33.14″ E25°24′46.64″ NASS. P. stenoptera-A. chinense
Nanzhou23–26110°19′49.48″ E25°20′23.83″ NASS. C. sinensis-F. abelii
Dahe27–32110°19′22.99″ E25°19′31.87″ NASS. C. sinensis-F. abelii
Biyan33–37110°25′09.45″ E25°06′30.65″ NASS. C. burmannii-R. verticillate
Duchuan38–41110°25′29.78″ E25°05′47.63″ NASS. R. verticillate
Longmen42–46110°20′58.79″ E25°12′12.54″ NASS. T. sebiferum-A. rubella
Yueguang47–52110°27′17.94″ E25°00′12.81″ NASS. C. sinensis-V. negundo var. cannabifolia
Luoshi53–57110°30′05.50″ E24°54′22.97″ NASS. T. sebiferum-B. formosana
Sanhe58–65110°34′49.15″ E24°44′58.25″ NASS. T. sebiferum-B. formosana

Appendix B

Phylogenetic Tree Construction
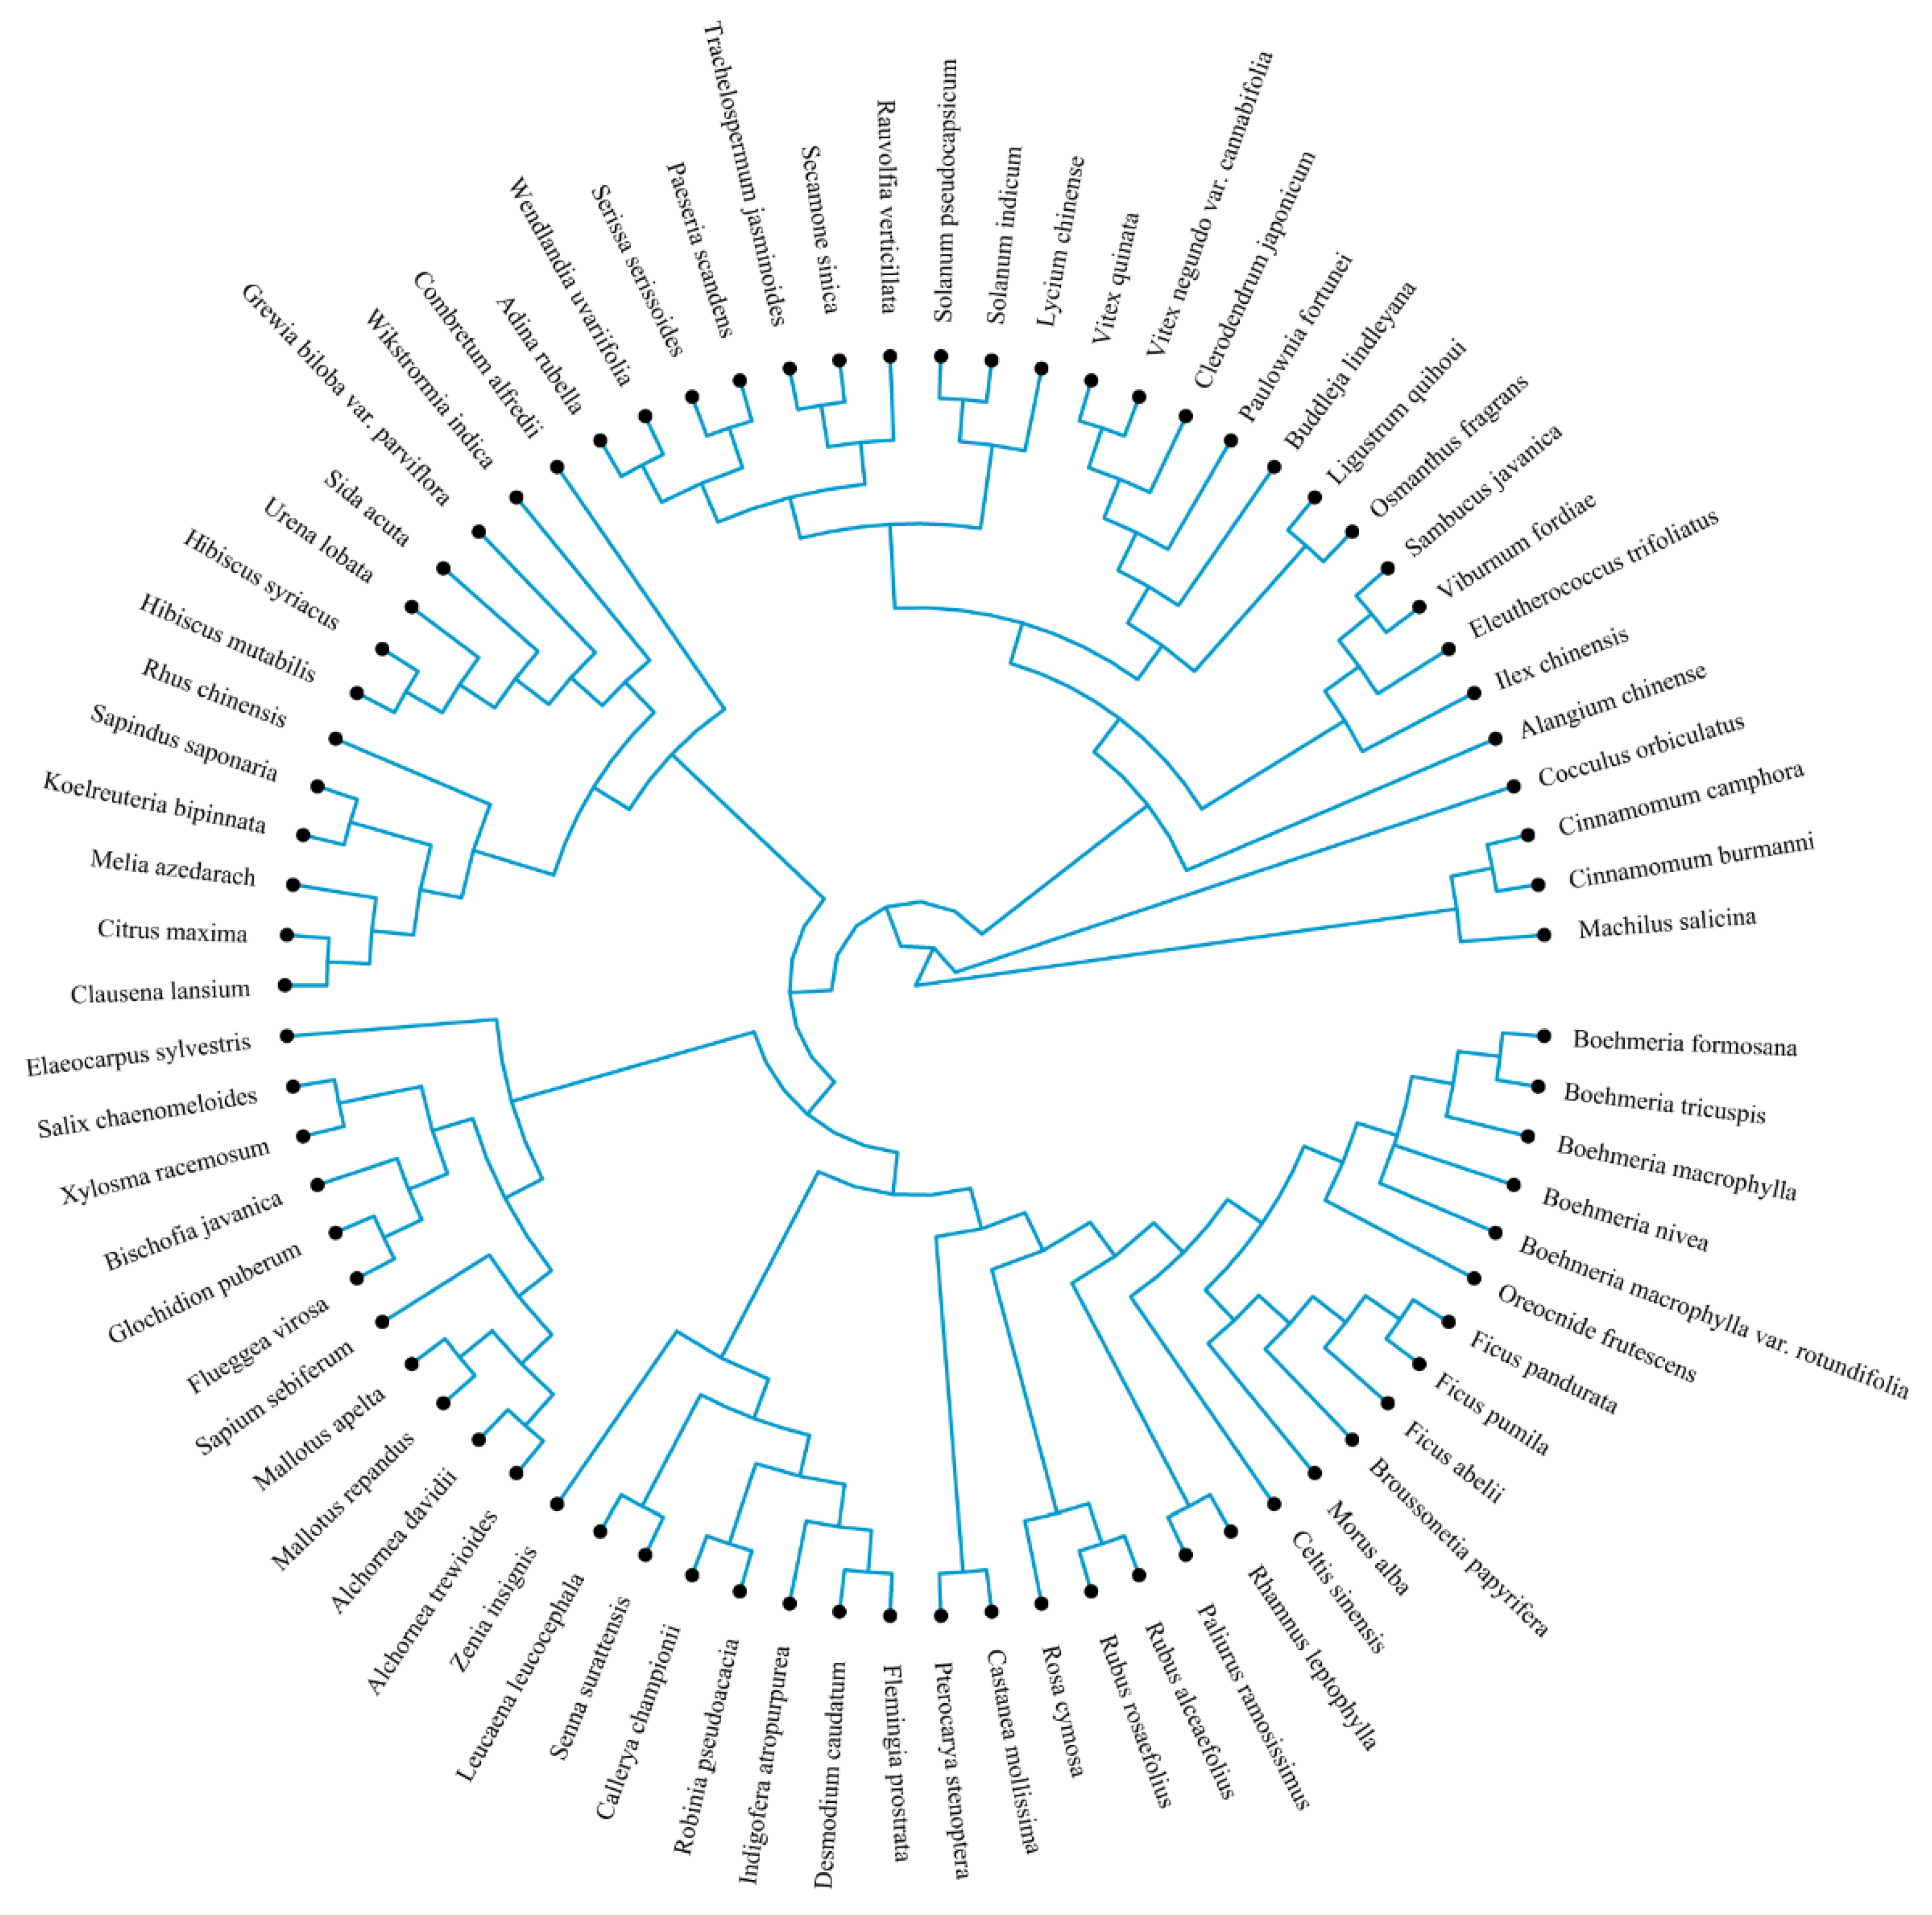
We constructed a phylogenetic tree that was divided into three steps. First, we assembled a species list that included all of our species sampled (a data set of 78 total species) in this study. Second, all names in the present species list were proofread through the TPL website (http://www.theplantlist.org/, accessed on 12 October 2021). Our present species list was included in the TPL. Third, a phylogenetic tree was generated based on the accepted 78 species list using the mega-tree function (scenario 1) in the R package “V. PhyloMaker″ [29].
Figure A1. A super-tree representing the 78 species in the Lijiang River Basin in the northeast of Guangxi Zhuang Autonomous Region, China.
Forests 13 00673 g0a1

References

  1. Münkemüller, T.; De, B.F.; Meynard, C.N.; Gravel, D.; Lavergne, S.; Mouillot, D.; Mouquet, N.; Thuiller, W. From diversity indices to community assembly processes: A test with simulated data. Ecography 2012, 35, 468–480. [Google Scholar] [CrossRef]
  2. Jiang, L.M.; Lv, G.H.; Gong, Y.M.; Li, Y.; Wang, H.F.; Wu, D.Y. Characteristics and driving mechanisms of species beta diversity in desert plant communities. PLoS ONE 2021, 16, e0245249. [Google Scholar] [CrossRef]
  3. Whittaker, R.H. Vegetation of the Siskiyou Mountains, Oregon and California. Ecol. Monogr. 1960, 30, 279–338. [Google Scholar] [CrossRef]
  4. Socolar, J.B.; Gilroy, Z.J.J.; Kunin, W.E.; Edwards, D.P. How Should Beta-diversity Inform Biodiversity Conservation? Trends Ecol. Evol. 2016, 31, 67–80. [Google Scholar] [CrossRef] [Green Version]
  5. Hu, D.; Jiang, L.M.; Hou, Z.F.; Zhang, J.; Wang, H.F.; Lv, G.H. Environmental filtration and dispersal limitation explain different aspects of beta diversity in desert plant communities. Glob. Ecol. Conserv. 2022, 33, e01956. [Google Scholar] [CrossRef]
  6. García-Giróna, J.; Fernández-Aláeza, C.; Fernández-Aláeza, M.; Lahuhta, J.A. Untangling the assembly of macrophyte metacommunities by means of taxonomic, functional and phylogenetic beta diversity patterns. Sci. Total Environ. 2019, 693, 133616. [Google Scholar] [CrossRef] [PubMed]
  7. Baselga, A. Partitioning the turnover and nestedness components of beta diversity. Glob. Ecol. Biogeogr. 2010, 19, 134–143. [Google Scholar] [CrossRef]
  8. Baselga, A. Partitioning abundance-based multiple-site dissimilarity into components: Balanced variation in abundance and abundance gradients. Methods Ecol. Evol. 2017, 8, 799–808. [Google Scholar] [CrossRef] [Green Version]
  9. Angeler, D.G. Revealing a conservation challenge through partitioned long-term beta diversity: Increasing turnover and decreasing nestedness of boreal lake metacommunities. Divers. Distrib. 2013, 19, 772–781. [Google Scholar] [CrossRef]
  10. Legendre, P. Interpreting the replacement and richness difference components of beta diversity. Glob. Ecol. Biogeogr. 2014, 23, 1324–1334. [Google Scholar] [CrossRef]
  11. Gutiérrez-Cánovas, C.; Millán, A.; Velasco, J.; Vaughan, I.P.; Ormerod, S.J. Contrasting Effects of Natural and Anthropogenic Stressors on Beta Diversity in River Organisms. Glob. Ecol. Biogeogr. 2013, 22, 796–805. [Google Scholar] [CrossRef]
  12. Leprieur, F.; Tedesco, P.A.; Hugueny, B.; Beauchard, O.; Dürr, H.H.; Brosse, S.; Oberdorff, T. Partitioning global patterns of freshwater fish beta diversity reveals contrasting signatures of past climate changes. Ecol. Lett. 2011, 14, 325–334. [Google Scholar] [CrossRef] [PubMed]
  13. Bergamin, R.S.; Bastazini, V.A.G.; Velez-Martin, E.; Debastiani, V.; Zanini, K.J.; Loyola, R.; Muller, S.C. Linking beta diversity patterns to protected areas: Lessons from the Brazilian Atlantic Rainforest. Biodivers. Conserv. 2017, 26, 1557–1568. [Google Scholar] [CrossRef]
  14. Fu, H.; Yuan, G.; Jeppesen, E.; Ge, D.; Li, W.; Zou, D.; Huang, Z.; Wu, A.; Liu, Q. Local and regional drivers of turnover and nestedness components of species and functional beta diversity in lake macrophyte communities in China. Sci. Total Environ. 2019, 687, 206–217. [Google Scholar] [CrossRef] [PubMed]
  15. Garcia-Giron, J.; Heino, J.; Baastrup-Spohr, L.; Bove, C.P.; Clayton, J.; de Winton, M.; Feldmann, T.; Fernandez-Alaez, M.; Ecke, F.; Grillas, P.; et al. Global patterns and determinants of lake macrophyte taxonomic, functional and phylogenetic beta diversity. Sci. Total Environ. 2020, 723, 138021. [Google Scholar] [CrossRef]
  16. Li, F.S.; Yan, Y.Z.; Zhang, J.N.; Zhang, Q.; Niu, J.M. Taxonomic, functional, and phylogenetic beta diversity in the Inner Mongolia grassland. Glob. Ecol. Conserv. 2021, 28, e01634. [Google Scholar] [CrossRef]
  17. Cardoso, P.; Rigal, F.; Carvalho, J.C.; Fortelius, M.; Borges, P.A.V.; Podani, J.; Schmera, D. Partitioning taxon, phylogenetic and functional beta diversity into replacement and richness difference components. J. Biogeogr. 2014, 41, 749–761. [Google Scholar] [CrossRef] [Green Version]
  18. Siefert, A.; Ravenscroft, C.; Weiser, M.D.; Swenson, N.G. Functional beta-diversity patterns reveal deterministic community assembly processes in eastern North American trees. Glob. Ecol. Biogeogr. 2012, 22, 682–691. [Google Scholar] [CrossRef]
  19. Jia, Z.Q.; Liu, X.J.; Cai, X.F.; Xing, L.X. Quantitative Remote Sensing Analysis of the Geomorphological Development of the Lijiang River Basin, Southern China. J. Indian Soc. Remote Sens. 2019, 47, 737–747. [Google Scholar] [CrossRef]
  20. Zhang, Q.; Buyantuev, A.; Fang, X.N.; Han, P.; Li, A.; Li, F.Y.; Liang, C.Z.; Liu, Q.F.; Ma, Q.; Niu, J.M.; et al. Ecology and sustainability of the Inner Mongolian Grassland: Looking back and moving forward. Landsc. Ecol. 2020, 35, 2413–2432. [Google Scholar] [CrossRef]
  21. Liu, G.; Jin, Q.W.; Li, J.Y.; Li, L.; He, C.X.; Huang, Y.Q.; Yao, Y.F. Policy factors impact analysis based on remote sensing data and the CLUE-S model in the Lijiang River Basin, China. CATENA 2017, 158, 286–297. [Google Scholar] [CrossRef]
  22. Huang, W.; Chak, H.; Peng, Y.; Li, L. Qualitative risk assessment of soil erosion for karst landforms in Chahe town, Southwest China: A hazard index approach. CATENA 2016, 144, 184–193. [Google Scholar] [CrossRef]
  23. Perez-Harguindeguy, N.; Diaz, S.; Garnier, E.; Lavorel, S.; Poorter, H.; Jaureguiberry, P.; Bret-Harte, M.S.; Cornwell, W.K.; Craine, J.M.; Gurvich, D.E.; et al. New Handbook for Standardised Measurement of Plant Functional Traits Worldwide. Aust. J. Bot. 2013, 61, 167–234. [Google Scholar] [CrossRef]
  24. Wright, I.; Reich, P.; Westoby, M.; Ackerly, D.D.; Baruch, Z.; Bongers, F.; Cavender-Bares, J.; Chapin, T.; Cornelissen, J.H.C.; Diemer, M.; et al. The worldwide leaf economics spectrum. Nature 2004, 428, 821–827. [Google Scholar] [CrossRef]
  25. Kang, M.; Chang, S.C.; Yan, E.R.; Wang, X.H. Trait variability differs between leaf and wood tissues across ecological scales in subtropical forests. J. Veg. Sci. 2014, 25, 703–714. [Google Scholar] [CrossRef]
  26. Coste, S.; Baraloto, C.; Leroy, C.; Marcon, E.; Renaud, A.; Richardson, A.D.; Roggy, J.C.; Schimann, H.; Uddling, J.; Hérault, B. Assessing foliar chlorophyll contents with the SPAD-502 chlorophyll meter: A calibration test with thirteen tree species of tropical rainforest in French Guiana. Ann. For. Sci. 2010, 67, 607. [Google Scholar] [CrossRef] [Green Version]
  27. Bao, S.D. Soil Agrochemical Analysis; China Agriculture Press: China, Beijing, 2000. (In Chinese) [Google Scholar]
  28. Hijmans, R.J. Geosphere: Spherical Trigonometry. R Package Version 1.5-14. 2021. Available online: https://CRAN.R-project.org/package=geosphere (accessed on 12 October 2021).
  29. Jin, Y.; Qian, H.V. PhyloMaker: An R package that can generate very large phylogenies for vascular plants. Ecography 2019, 42, 1353–1359. [Google Scholar] [CrossRef] [Green Version]
  30. Baselga, A. Separating the two components of abundance-based dissimilarity: Balanced changes in abundance vs. abundance gradients. Methods Ecol. Evol. 2013, 4, 552–557. [Google Scholar] [CrossRef]
  31. Talbot, J.M.; Bruns, T.D.; Taylor, J.W.; Smith, D.P.; Branco, S.; Glassman, S.E.S.; Vilgalys, R.; Liao, H.L.; Smith, M.E.; Peay, K.G. Endemism and functional convergence across the North American soil mycobiome. Proc. Natl. Acad. Sci. USA 2014, 111, 6341–6346. [Google Scholar] [CrossRef] [Green Version]
  32. Wang, X.; Lu, X.; Yao, J.; Wang, Z.W.; Deng, Y.; Cheng, W.X.; Zhou, J.Z.; Han, X.G. Habitat-specific patterns and drivers of bacterial β-diversity in China’s drylands. ISME J. 2017, 11, 1345–1358. [Google Scholar] [CrossRef]
  33. Anderson, M.J. A new method for non-parametric multivariate analysis of variance. Austral Ecol. 2001, 26, 32–46. [Google Scholar] [CrossRef]
  34. R Core Team. R: A Language and Environment for Statistical Computing; R Foundation for Statistical Computing: Vienna, Austria, 2021; Available online: https://www.R-project.org/ (accessed on 10 October 2021).
  35. Cardoso, P.; Mammola, S.; Rigal, F.; Carvalho, J. BAT: Biodiversity Assessment Tools. R Package Version 2.7.0. 2021. Available online: https://CRAN.R-project.org/package=BAT (accessed on 12 October 2021).
  36. Goslee, S.C.; Urban, D.L. The ecodist package for dissimilarity-based analysis of ecological data. J. Stat. Softw. 2007, 22, 1–19. [Google Scholar] [CrossRef]
  37. Oksanen, J.; Blanchet, F.G.; Friendly, M.; Kindt, R.; Legendre, P.; McGlinn, D.; Minchin, P.R.; O’Hara, R.B.; Simpson, G.L.; Solymos, P.; et al. Vegan: Community Ecology Package. R Package Version 2.5-7. 2020. Available online: https://CRAN.R-project.org/package=vegan (accessed on 12 October 2021).
  38. Heino, J.; Melo, A.S.; Siqueira, T.; Soininen, J.; Valanko, S.; Bini, L.M. Metacommunity organisation, spatial extent and dispersal in aquatic systems: Patterns, processes and prospects. Freshw. Biol. 2015, 60, 845–869. [Google Scholar] [CrossRef]
  39. Gianuca, A.T.; Engelen, J.; Brans, K.I.; Hanashiro, F.T.T.; Vanhamel, M.; van den Berg, E.M.; Caroline, S.; De Meester, L. Taxonomic, functional and phylogenetic metacommunity ecology of cladoceran zooplankton along urbanization gradients. Ecography 2018, 41, 183–194. [Google Scholar] [CrossRef] [Green Version]
  40. De Paula, L.F.A.; Colmenares-Trejos, S.L.; Negreiros, D.; Rosado, B.H.P.; De Mattos, E.A.; De Bello, F.; Porembski, S.; Silveira, F.A.O. High plant taxonomic beta diversity and functional and phylogenetic convergence between two Neotropical inselbergs. Plant Ecol. Divers. 2020, 13, 61–73. [Google Scholar] [CrossRef]
  41. González-Trujillo, J.D.; Saito, V.S.; Petsch, D.K.; Muñoz, I.; Sabater, S. Historical legacies and contemporary processes shape beta diversity in Neotropical montane streams. J. Biogeogr. 2021, 48, 101–177. [Google Scholar] [CrossRef]
  42. Soininen, J.; Heino, J.; Wang, J. A meta-analysis of nestedness and turnover components of beta diversity across organisms and ecosystems. Glob. Ecol. Biogeogr. 2018, 27, 96–109. [Google Scholar] [CrossRef] [Green Version]
  43. Viana, D.S.; Figuerola, J.; Schwenk, K.; Manca, M.; Hobaek, A.; Mjelde, M.; Preston, C.D.; Gornall, R.J.; Croft, J.M.; King, R.A.; et al. Assembly mechanisms determining high species turnover in aquatic communities over regional and continental scales. Ecography 2016, 39, 281–288. [Google Scholar] [CrossRef]
  44. Wang, X.; Wiegand, T.; Anderson-Teixeira, K.J.; Bourg, N.A.; Hao, Z.; Howe, R.; Jin, G.; Orwig, D.A.; Spasojevic, M.J.; Wang, S.; et al. Ecological drivers of spatial community dissimilarity, species replacement and species nestedness across temperate forests. Glob. Ecol. Biogeogr. 2018, 27, 581–592. [Google Scholar] [CrossRef] [Green Version]
  45. Batista, B.C.; De Lima, I.P.; Lima, M.R. Beta diversity patterns of bats in the Atlantic Forest: How does the scale of analysis affect the importance of spatial and environmental factors? J. Biogeogr. 2020, 48, 1–10. [Google Scholar] [CrossRef]
  46. Zhu, H.Y.; Li, Y.S.; Wu, L.J.; Yu, S.; Xin, C.L.; Sun, P.G.; Xiao, Q.; Zhao, H.J.; Zhang, Y.; Qin, T. Impact of the atmospheric deposition of major acid rain components, especially NH4, on carbonate weathering during recharge in typical karst areas of the Lijiang River basin, southwest China. Appl. Geochem. 2020, 114, 104518. [Google Scholar] [CrossRef]
  47. Zhang, M.M.; Qin, H.; Wang, Y.; Zhang, F. Beta diversity of wetland vegetation in the middle and upper reaches of the Fenhe River watershed. Acta Ecol. Sin. 2016, 36, 3292–3299. [Google Scholar] [CrossRef]
  48. Dobrovolski, R.R.; Melo, A.S.; Cassemiro, F.A.S.; Diniz-Filho, J.A.F. Climatic history and dispersal ability explain the relative importance of turnover and nestedness components of beta diversity. Glob. Ecol. Biogeogr. 2012, 21, 191–197. [Google Scholar] [CrossRef]
  49. Shi, W.; Wang, Y.Q.; Xiang, W.S.; Li, X.K.; Cao, K.F. Environmental filtering and dispersal limitation jointly shaped the taxonomic and phylogenetic beta diversity of natural forests in southern China. Ecol. Evol. 2021, 11, 8783–8794. [Google Scholar] [CrossRef]
  50. Qian, H.; Guo, Q. Linking biotic homogenization to habitat type, invasiveness, and growth form of naturalized alien plants in North America. Divers. Distrib. 2010, 16, 119–125. [Google Scholar] [CrossRef]
  51. Kong, J.J.; Yang, J.; Bai, E. Long-term effects of wildfire on available soil nutrient composition and stoichiometry in a Chinese boreal forest. Sci. Total Environ. 2018, 642, 1353–1361. [Google Scholar] [CrossRef]
  52. John, R.; Dalling, J.W.; Harms, K.E.; Yavitt, J.B.; Stallard, R.F.; Mirabello, M.; Foster, R.B. Soil nutrients influence spatial distributions of tropical tree species. Proc. Natl. Acad. Sci. USA 2007, 104, 864–869. [Google Scholar] [CrossRef] [Green Version]
  53. Zheng, Y.; Dong, L.; Li, Z.; Zhang, J.; Li, Z.; Miao, B.; Jia, C.; Liang, C.; Wang, L.; Li, F.Y. Phylogenetic structure and formation mechanism of shrub communities in arid and semiarid areas of the Mongolian Plateau. Ecol. Evol. 2019, 9, 13320–13331. [Google Scholar] [CrossRef]
  54. Sobral, F.L.; Lees, A.C.; Cianciaruso, M.V. Introductions do not compensate for functional and phylogenetic losses following extinctions in insular bird assemblages. Ecol. Lett. 2016, 19, 1091–1100. [Google Scholar] [CrossRef]
  55. Jiang, X.M.; Pan, B.Z.; Jiang, W.X.; Hou, Y.M.; Yang, H.Q.; Zhu, P.H.; Heino, J. The role of environmental conditions, climatic factors and spatial processes in driving multiple facets of stream macroinvertebrate beta diversity in a climatically heterogeneous mountain region. Ecol. Indic. 2021, 124, 107407. [Google Scholar] [CrossRef]
  56. Fournier, B.; Mouly, A.; Moretti, M.; Gillet, F. Contrasting processes drive alpha and beta taxonomic, functional and phylogenetic diversity of orthopteran communities in grasslands. Agric. Ecosyst. Environ. 2017, 242, 43–52. [Google Scholar] [CrossRef]
Figure 1. The distribution map of the 12 studied plots in the Lijiang River Basin. The colored background represents the elevation distribution. CY is for Caiyuan, ZZ is for Zhuzhi, YJ is for Yangjia, NC is for Nanchang, NZ is for Nanzhou, DH is for Dahe, LM is for Longmen, BY is for Biyan, DC is for Duchuan, YG is for Yueguang, LS is for Luoshi, SH is for Sanhe.
Forests 13 00673 g001
Figure 2. Beta diversity with its two components along the riparian zone of the Lijiang. (a) Mean taxonomic beta diversity, (b) mean phylogenetic beta diversity, (c) mean functional beta diversity. The percentages in the figure represent relative proportion of replacement and richness components, respectively. Tβtotal represents total taxonomic beta diversity; Tβrepel represents the sum of replacement components on taxonomic beta diversity; Tβrich represents the sum of richness components on taxonomic beta diversity. Pβtotal represents total phylogenetic beta diversity; Pβrepel represents the sum of replacement components on phylogenetic beta diversity; Pβrich represents the sum of richness components on phylogenetic beta diversity. Fβtotal represents total functional beta diversity; Fβrepel represents the sum of replacement components on functional beta diversity; Fβrich represents the sum of richness components on functional beta diversity.
Forests 13 00673 g002
Figure 3. Variance in beta diversity along the geographic distance and environmental distances. (a) Variance in taxonomic beta diversity along the geographic distance, (b) variance in phylogenetic beta diversity along the geographic distance, (c) variance in functional beta diversity along the geographic distance, (d) variance in taxonomic beta diversity along the environmental distances, (e) variance in phylogenetic beta diversity along the environmental distances, (f) variance in functional beta diversity along the environmental distances. R2—13.58% of variability is explained by geographic distance of taxonomic diversity, 9.31% of variability is explained by environmental distance of taxonomic diversity, 14.48% of variability is explained by geographic distance of phylogenetic diversity, 8.07% of variability is explained by environmental distance of phylogenetic diversity, 12.83% of variability is explained by geographic distance of functional diversity, 9.32% of variability is explained by environmental distance of functional diversity. p-values represent the significance of the statistical results.
Forests 13 00673 g003
Table 1. Results of permutational MANOVA (adonis).
Explanatory VariablesTaxonomic Beta DiversityPhylogenetic Beta DiversityFunctional Beta Diversity
R2Pr (>F)R2Pr (>F)R2Pr (>F)
Soil pH0.075***0.063***0.070***
Soil water content0.001ns0.001ns0.001ns
Soil organic matter0.028*0.027*0.015ns
Total nitrogen0.057***0.057***0.047**
Available nitrogen0.040**0.030*0.064***
Total phosphorus0.082***0.082***0.074***
Available phosphorus0.056***0.062**0.083***
Total potassium0.091***0.134***0.120***
Available potassium0.073***0.091***0.120***
Residuals0.497-0.453-0.406-
Note: * p < 0.05, ** p < 0.01, *** p < 0.001.
Publisher’s Note: MDPI stays neutral with regard to jurisdictional claims in published maps and institutional affiliations.