Abstract
Traditional methods to deal with thinning shreds (twigs, bark, etc.) include using them as fuelwood (artificially taken out of the forest) and stacking in situ natural decompositions (slow decomposition and nutrient return to the field). These methods will cause the loss of nutrients in the forest, and composting with additives can effectively promote nutrient circulation effectively. The purpose of our study was to explore the effects of composts of forest thinning shreds with different additives on soil and tree growth in semimature Pinus tabuliformis Carr. We selected four composts of forest thinning shreds (T1 adjustment of C/N and C/P + 0.2% priming; T2: adjustment of C/N and C/P + 0.2% common compost; T3: adjustment of C/N and C/P only; T4: raw material grinding of thinning shreds) and applied them in the volume of 900 g·m−2, which were made in the early stage. The soil nutrient content, microbial characteristics, and growing volume of Pinus tabuliformis were measured at 0.5, 1, and 1.5 years after fertilization. The soil became acid after one year of fertilization, having a great impact on the 0–20 cm soil layer. At 0.5 years of fertilization, the total nitrogen (TN) content of the soil with priming compost (T1) was 1.5 times higher than that of the control group (T5); the soil organic matter (SOM) was increased by 4.93–6.41 mg·kg−1. After one year of fertilization, the difference in the soil microbial carbon and nitrogen (MBC and MBN) content of each treatment decreased gradually. Soil sucrase activity was the highest after fertilization, and different composts had the greatest impact on urease activity in the 0–20 cm layer; the alkaline phosphatase (AKPase) activity of soil with common compost (T2) changed the most, and after 0.5 years of fertilization, the acid phosphatase (APase) activity of T1 in the two layers increased by 0.31 mg·g−1 and 0.1 mg·g−1, and the increase in of T2 was slightly lower than that of T1. There were significant differences in the number of bacteria, fungi, and actinomycetes compared to T1 and T2 with other treatments. T1 promoted the height growth (H) of trees three times higher than T5 and T2 promoted the growth of diameter at breast height (DBH) by 2.5 cm. The results showed that T1 and T2 had obvious effects on promoting soil nutrient content, microbial biomass accumulation, and forest growth, and the application of compost had no significant effect on promoting understory regeneration. The findings of this study show that using compost with priming can effectively increase the soil nutrient content, microbial activity, and quantity of Pinus tabuliformis effectively in terms of promoting the growth of trees and reducing the nutrient loss caused by thinning.
1. Introduction
As an important forest management measure, thinning and fertilization can effectively improve forest soil fertility, forest quality, and ecological benefits [1]. Pinus tabuliformis Carr. has the characteristics of barren resistance and wind resistance. It is widely planted at an altitude of 100–2600 m in China and is an important afforestation tree species in northern China. Pinus tabuliformis needs appropriate fertilization in the container seedling and seedling stage to improve the survival rate and seedling quality [2]. After reaching the semimature stage, it requires tending and thinning to improve the stand volume and ecological benefits [3,4]. Thinning refers to the regular and repeated cutting of some trees in the immature forests (usually including twigs, non-trunks, leaves, and skins within the scope of the thinning plan, as well as shrubs and herbs under the forest) to create good environmental conditions for the retained trees and promote their growth and development. However, coniferous tree species such as Pinus tabuliformis and Platycladus orientalis (L.) Franco have low moisture and a high macromolecular content such as oil and lignocellulose [5,6], which are flammable and difficult to decompose; a large amount of organic waste produced after thinning is stacked in the forests, which can not only easily cause forest fires and pests, but is also very slow in natural decomposition; the nutrients cannot return to the soil in a short time and participate in the nutrient absorption and circulation of soil forests and result in soil nutrient loss [7], thus affecting the quality of the forest. Therefore, it is necessary to properly fertilize the semimature Pinus tabuliformis plantation after thinning in order to supplement the nutrients in the forest and deal with the thinning shreds effectively and harmlessly.
At present, the research on forest fertilization mainly focuses on container seedling and seedling fertilization [8,9,10], and only a few scholars have studied the fertilization of semimature plantations. The results of a study in the southeastern plain of the United States showed that the semimature loblolly pine plantation had an obvious response to the combination of nitrogen and phosphorus fertilizer [11]. Since the 1960s, China has systematically studied the amount, proportion, time, and mode of fertilization suitable for Pinus tabuliformis systematically, as well as discussing the effects of different fertilization combinations on the growth of Pinus tabuliformis [12,13]. The data showed that the aboveground growth and nitrogen load of Pinus tabuliformis seedlings increased with the increase in fertilization [14]; under a high fertilizer level, the seedling height, ground diameter, and single plant biomass of annual Pinus tabuliformis seedlings reached 1.4, 1.2, and 1.7 times the low fertilizer level, respectively [15]; an eight-year-old Pinus tabuliformis plantation with urea and compound fertilizer grew significantly in the first year, while Pinus tabuliformis with chicken manure (i.e., organic fertilizer) grew significantly in the second year [16]. However, there are few reports on the response of the semimature Pinus tabuliformis forest to fertilization after thinning, which needs to be studied and supplemented.
Referring to the reuse of green waste, vegetable, and crop organic waste [17,18], composting is considered to be an effective way to treat organic waste, that is, organic waste is transformed into stable, harmless, and nutritious organic fertilizer by microbial fermentation through the artificial control of water, C/N ratio, ventilation, and other conditions [19]. The results showed that the application of compost had a significant effect on improving soil nutrient content and increasing crop yield: after the application of pig manure compost in a wheat field, the indexes of soil total carbon (TC) and total nitrogen (TN) were significantly higher than those in the control treatment (p < 0.05) [20]; the compost made from green waste was widely used as the substrate for grass and flower planting [21]; and after applying compost made from wheat and rice waste, the biomass of pepper and tomato increased by approximately 25% and the yield increased by approximately 75% [22]. In contrast, the application of compost in forestry mostly focuses on improving the matrix formula of container seedlings [23] and the fertilization of forest seedlings [24]. Some scholars used Vitex trifolia and cow dung as raw materials to make compost, finding that it promoted the leaf area growth of young Pinus tabuliformis needles [25], improved the quality of Pinus tabuliformis and Platycladus orientalis seedlings, and improved the content of soil nutrients [26]. At present, there are no reports on the application of compost made from forest thinning shreds applied to the semimature Pinus tabuliformis artificial forest after thinning.
In this paper, different types of compost were made in the forest with the semimature Pinus tabuliformis and Platycladus orientalis thinned shreds as raw materials, and then the compost was applied back to the forest. In the 1.5-year growth cycle of Pinus tabuliformis, the fertilizer effects of different types of forest thinning compost in the semimature Pinus tabuliformis plantation was discussed from the perspectives of soil nutrients, soil microorganisms, tree growth, and understory regeneration. This paper aims to reduce the nutrient loss in the forest after thinning and effectively deal with a large amount of organic waste by thinning in order to promote the nutrient cycle in the forest.
2. Materials and Methods
2.1. Study Site Description
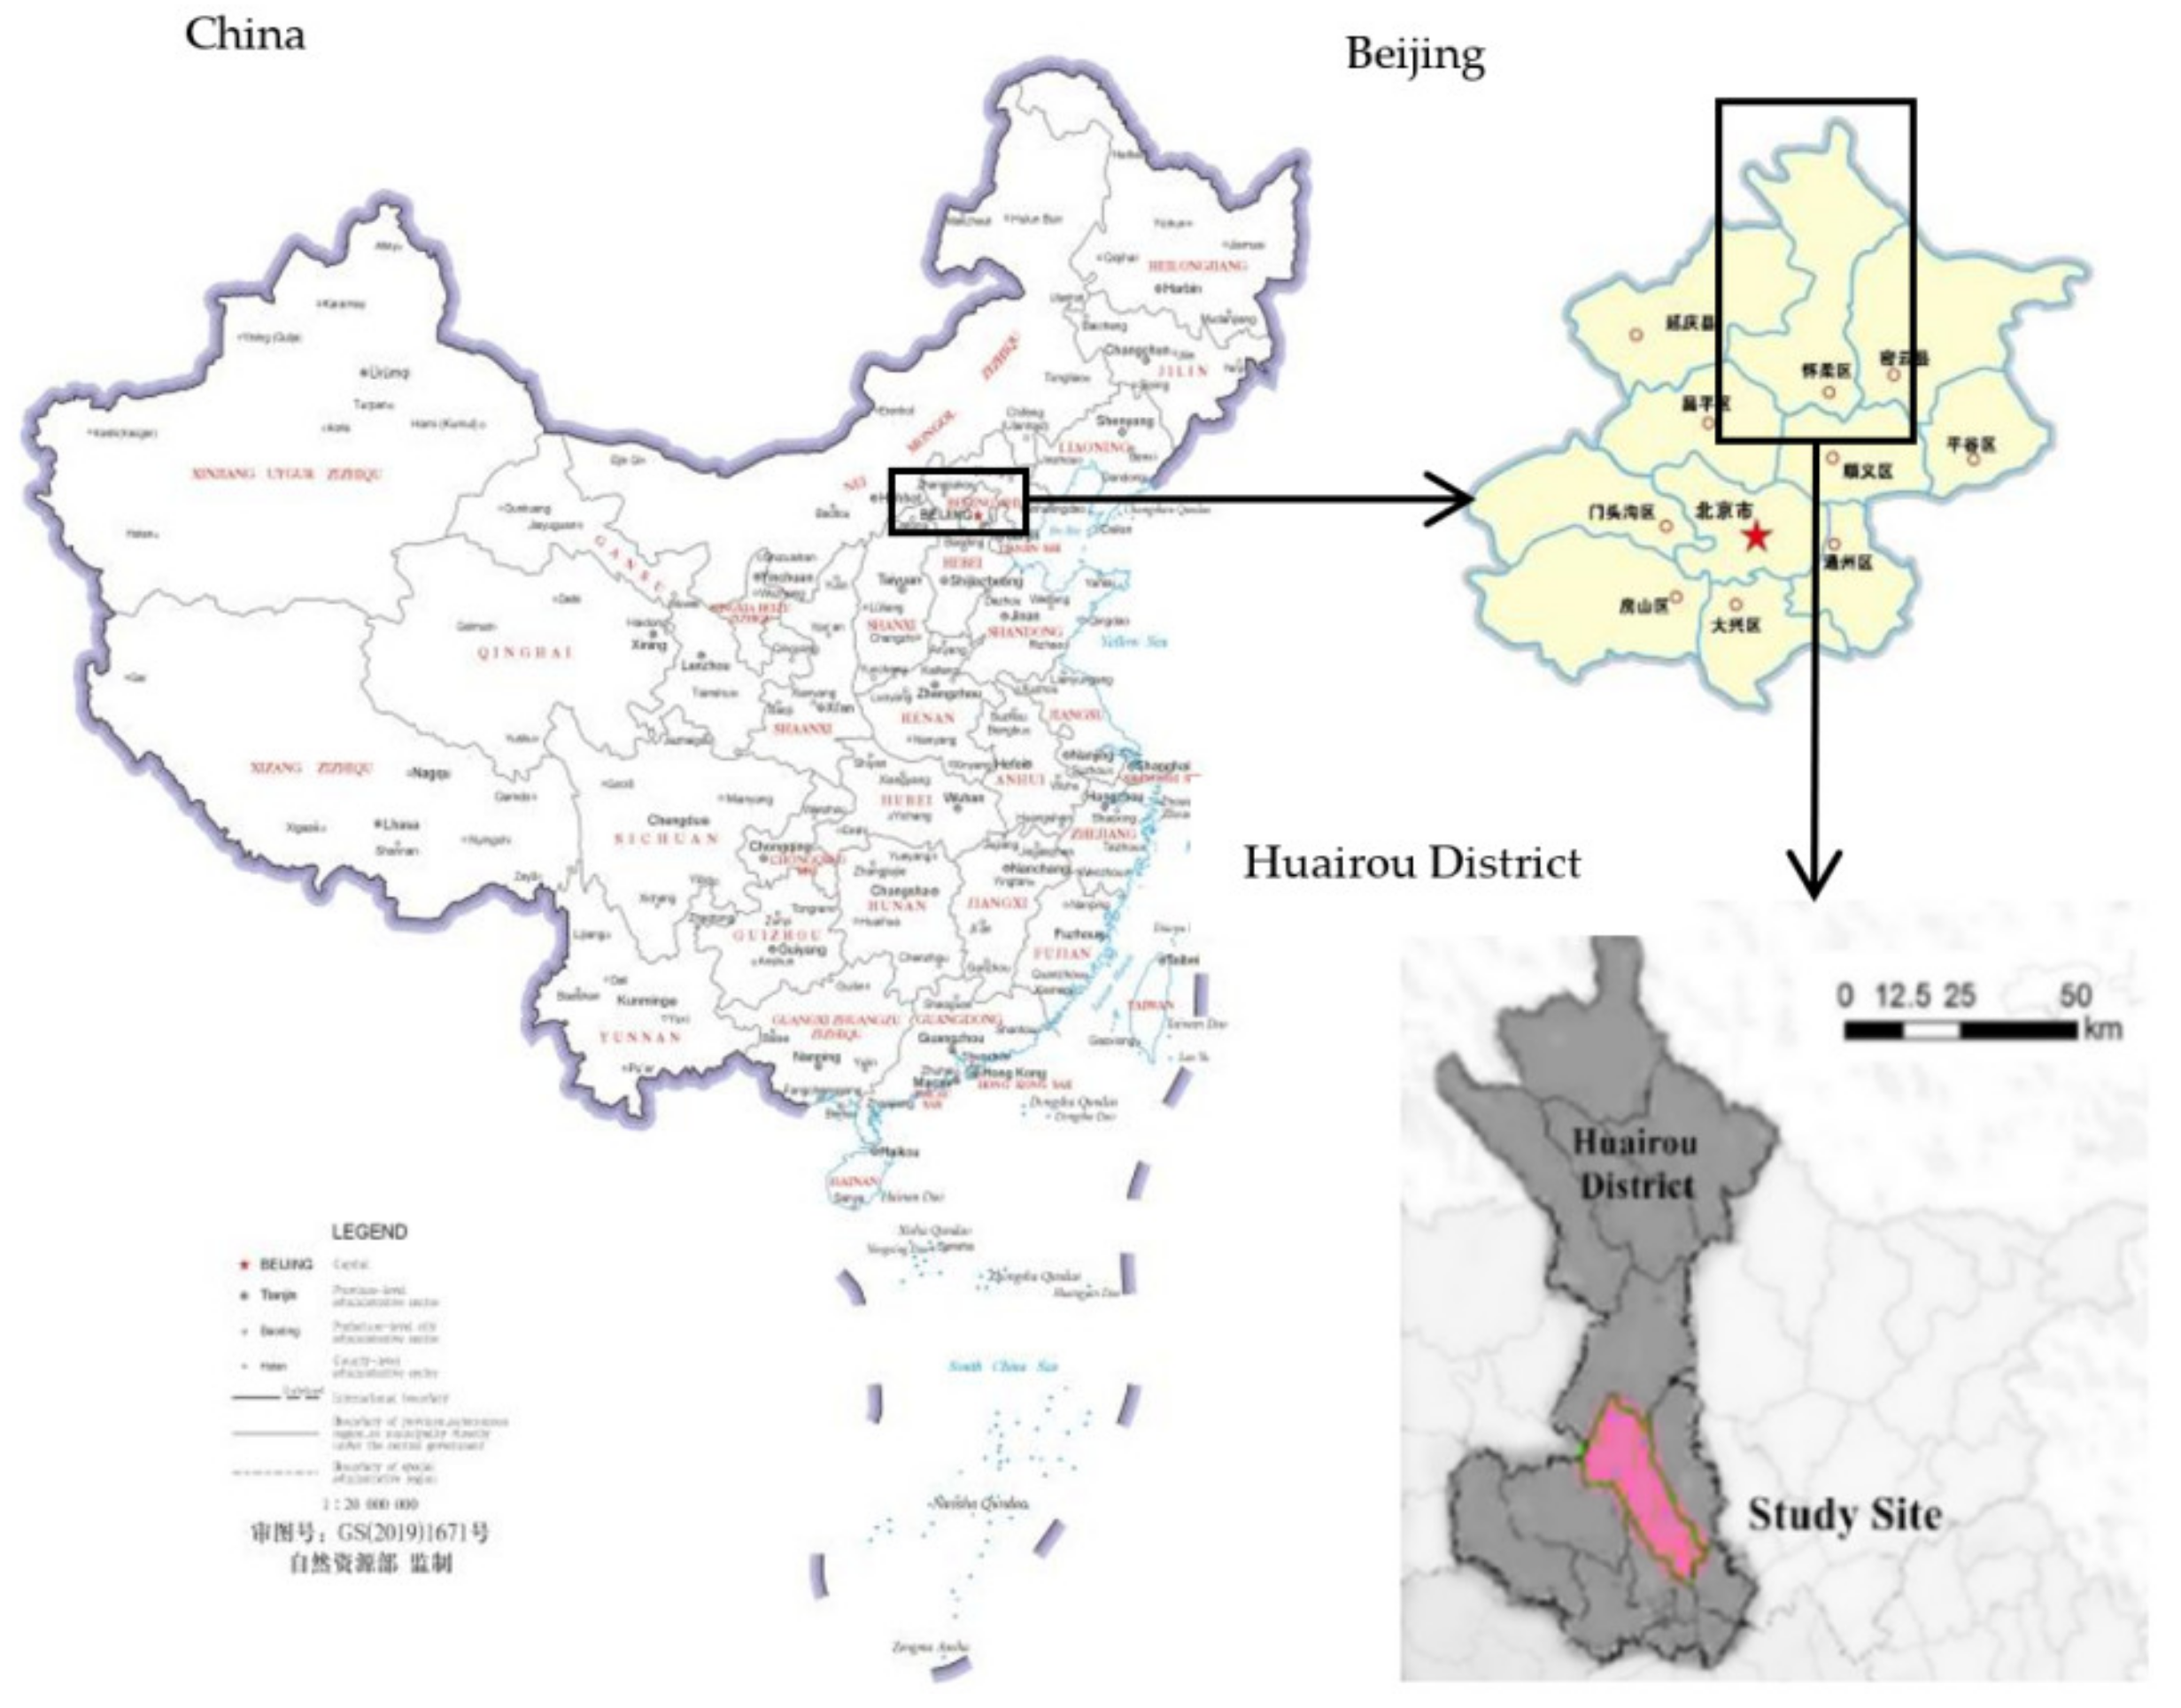
Our study was conducted at the Beitaishang state forest farm, Huairou District, Beijing, China (Figure 1) (116°70′ E, 40°39′ N), where the mean elevation is 91 m a.s.l. This area is a typical warm temperate humid monsoon climate, with hot and rainy summers, cold and dry winters, and short spring and autumn seasons. The average temperature of a year ranges from 7 °C to 19 °C, and the mean precipitation of a year is 600 to 700 mm; the frost-free period of the whole year is 180 to 200 days, and 80% of the annual precipitation is concentrated in June to August in the summer. The soil types are brown forest soil loamy and sandy soil, with a soil thickness of 30 cm. The dominant tree species are the evergreen conifer Pinus tabuliformis with an age from 20 to 30 years and semimature Platycladus orientalis, which are both widely distributed in north China. The associated tree species are a few Ailanthus altissima (Mill.) Swingle, and Vitex negundo Linn. var. heterophylla (Franch.) Rehd is the main shrub species. From April to October 2014, thinning measures were implemented for 806,000 m3 of forest in the Beitaishang state forest farm, with a thinning intensity of 15–18%, resulting in thinning shreds of approximately 45 t.
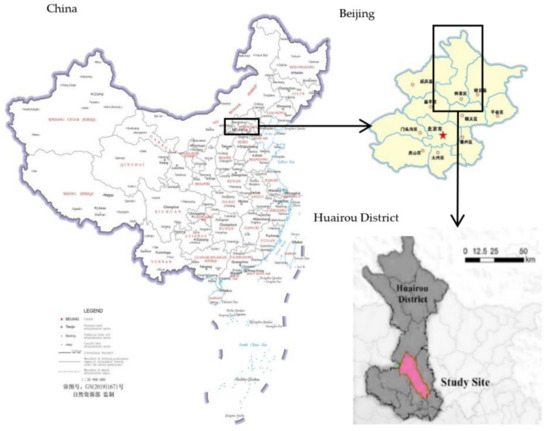
Figure 1.
Location of Beitaishang state forest farm, Huairou District, Beijing, China.
2.2. Experimental and Fertilization
From April to September 2015, the thinning shreds of Pinus tabuliformis and Platycladus orientalis were used as raw materials and crushed into 6 cm (grinder with BC 600XL, VERMEER, Pella, IA, USA). The moisture of compost raw materials was adjusted to 70%, and urea (Shanghai chaoxuan Chemical Technology Co., Ltd., Shanghai, China) and diamine (64% Total nutrient, 18% N, 20% P, Shanghai Chaoxuan Chemical Technology Co., Ltd., Shanghai, China) were added to adjust the C/N to 40 and C/P to 100 (Table 1). According to whether the raw materials were adjusted by C, N, or P, and the additives used, four fertilizers were composted in situ as four different fertilization types in this study (Table 2); together with the control group (CK), 5 types of fertilization were formed:
- T1: The compost materials C/N and C/P were adjusted, and 0.2% priming was added. The priming (Bioferment) was provided by Beijing Goldenway Bio-tech Co., Ltd. Beijing, China.
- T2: The compost materials C/N and C/P were adjusted, and 0.2% common compost was added. The common compost was made of Vitex negundo and cow dung using the traditional composting method.
- T3: Only the raw materials C/N and C/P, were adjusted, without any additives.
- T4: Raw material grinding of thinning shreds, without any adjustments and additives.
- T5: (CK, short for control check): control group, no fertilization.

Table 1.
Characteristics of thinning shreds.
Table 1.
Characteristics of thinning shreds.
| Thinning Shreds | Moisture (%) | C/N | C/P | Total Nutrient (TN 2 + K2O + P2O5, %) |
|---|---|---|---|---|
| After adjustment 1 | 70 | 40:1 | 100:1 | 3.5 |
Note: 1 The after adjustment represents the data changes in compost raw materials, C/N, and C/P, after being crushed and adjusted for moisture; 2 TN represents total nitrogen.
Table 2.
Characteristics of different composts.
Table 2.
Characteristics of different composts.
| Composts 1 | Moisture Content (%) | pH | Organic Matter (%) | Total Nutrient (TN 2 + K2O + P2O5, %) | C/N | GI3 (%) |
|---|---|---|---|---|---|---|
| T1 | 6 ± 0.78 | 7.5 ± 0.07 | 52 ± 0.98 | 5.8 ± 0.27 | 23 ± 0.16 | 69 ± 1.93 |
| T2 | 8 ± 0.24 | 7.4 ± 0.06 | 44 ± 0.13 | 5.4 ± 0.08 | 25 ± 0.21 | 81 ± 2.33 |
| T3 | 7 ± 0.49 | 6.7 ± 0.06 | 40 ± 0.98 | 4.7 ± 0.16 | 22 ± 0.68 | 65 ± 6.82 |
| T4 | 5 ± 0.15 | 5.9 ± 0.25 | 30 ± 0.55 | 3.1 ± 0.22 | 37 ± 1.82 | 77 ± 7.93 |
Note: 1 T1 adjustment of C/N and C/P + 0.2% priming; T2: adjustment of C/N and C/P + 0.2% common compost; T3: adjustment of C/N and C/P; T4: raw material grinding of thinning shreds; 2 TN represents total nitrogen; 3 GI represents Germination Index. Data are means ± standard error, n = 12.
One 24 m × 25 m study plot was established in September 2015, which took place in latitude 40°23′3″ N, longitude 116°39′9″ E, elevation 92 m a.s.l., and azimuth 88° east by south. The study area was 600 m2 and divided into 15 blocks of the same size (Figure 2). There were 54 Pinus tabuliformis in total, with the mean H (average height) of 9.2 m, the mean DBH (average diameter at breast height) of 15.4 cm, and the mean CD (average crown diameter) of 3.1 m × 3.2 m.
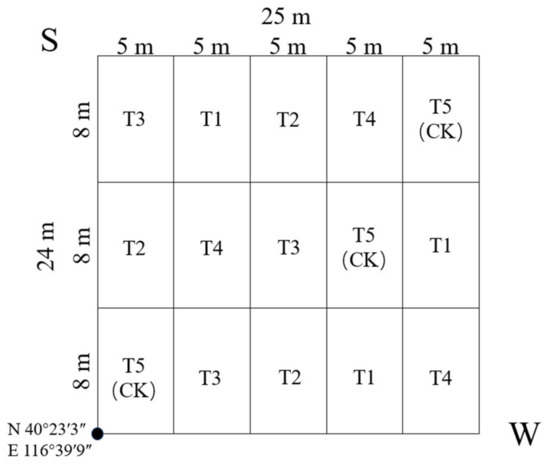
Figure 2.
Sample plots showing setting and fertilization type distribution. T1: adjustment of C/N and C/P + 0.2% priming; T2: adjustment of C/N and C/P + 0.2% common compost; T3: adjustment of C/N and C/P; T4: raw material grinding of thinning shreds; T5: no fertilization. The volume of fertilizer applied was 900 g·m−2.
T1–T5 was distributed in the 15 blocks randomly, and each treatment was repeated 3 times in the plot (Figure 2). From September, fertilizer was applied to the soil surface in the plot. The volume of the fertilization was 900 g·m−2, and the fertilization method was circular application (within 0.5 m of trunk radius), except for T5 (CK) without any fertilization.
2.3. Data Collection
According to the 1.5-year growth cycle, soil samples were collected in October 2015, April 2016, October 2016, and April 2017. Soil samples were collected from 0–20 cm and 20–40 cm soil layers for the mix. One was dried and screened to determine the soil nutrient content and enzyme activity. The other was stored at 4 °C to determine the number of microorganisms in the soil. Tree growth data were collected in four time periods in the forest. In addition, the regeneration of small trees and shrubs under the forest was investigated in October 2016 and April 2017.
2.4. Measurements of Soil Nutrients
The soil pH value, total nitrogen (TN), available phosphorus (AP), available potassium (AK), and organic matter (SOM) were selected for soil nutrient analysis. The pH value was measured using a pH meter (FE28, METTLER TOLEDO, Zurich, Switzerland), and organic matter was measured using H2SO4-K2CrO4 with external heating [27]. H2SO4-H2O2 digestion was applied to TN, AP, and AK, and then they were measured using a Kjeldahl nitrogen meter (KDN04A, DECCA, Shenzhen, China), spectrophotometry (UV-5600, FUP, Shanghai, China), and a flame photometric method (TT5D, FUP, Shanghai, China) [27].
2.5. Measurements of Soil Microorganisms
Soil microbial biomass carbon (MBC) and nitrogen (MBN); urease; invertase; acid–base phosphatase (AKPase and APase) activities; and the number of fungi, bacteria, and actinomycetes were selected. MBC and MBN were measured using a chloroform fumigation extraction (CFE) method with 0.5 mol·L−1 K2SO4 as an extractant [28,29]; after thawing and filtering the extract, it was directly measured using the TOC analyzer (Multi N/C 3000, Jena, Germany). Microbial biomass carbon (MBC) = EC/KC, and EC represents the difference between the leached organic carbon of non-fumigated and fumigated control soil; KC is the conversion coefficient, and the value is 0.38. Microbial biomass nitrogen (MBN) = EN/KN, and EN is the difference between fumigated and non-fumigated control soil mineral nitrogen; KN is the conversion coefficient, with a value of 0.45.
Soil urease activity was measured using C6H5ONa-NaClO colorimetry, invertase activity was measured using 3,5-dinitrosalicylic acid (DNS) colorimetry, and the activities of AKPase and APase were measured using p-nitrophenyl phosphate (pNPP) colorimetry [30,31]. Goshi No.1 agar medium, Martin’s medium, and beef extract peptone agar were selected as the culture media for actinomycetes, fungi, and bacteria, respectively. The number of soil microorganisms was measured using the gradient dilution method [32]. Three repeats were set for each sample.
2.6. Measurements of Tree Growth
The height (H), diameter at breast height (DBH), and crown width of each Pinus tabuliformis in plots were measured in four periods. The individual volume (1) and unit area volume (2) of Pinus tabuliformis were calculated according to the standard “LY1353–1999” issued by the Ministry of Agriculture of the People’s Republic of China. The name, number, height, base diameter, and coverage of new trees and shrubs in the Pinus tabuliformis the forest were recorded in two periods, and typical regeneration plants were selected for photo preservation.
Individual volume (m3) = 0.00066492455 × D1.8655617 × H0.93768879
Unit area volume (m3·hm−2) = Individual volume × Number of plants × Plot area
2.7. Data Analysis
All data means and standard deviations of variables per plot were calculated in Microsoft Excel (2016 version, Microsoft Corporation, Redmond, WA, USA). Three one-way ANOVAs were used to determine in SPSS 20.0 (SPSS 20.0, Shanghai, China) for the analysis, and differences between means were assessed at the level of 0.05 by Duncan’s multiple comparison tests to obtain the following:
- The significant differences among the soil nutrient contents in the 0–20 cm soil layer in four periods under five fertilization types;
- The significant differences among the soil nutrient contents in the 20–40 cm soil layer in four periods under five fertilization types;
- The interaction of fertilization type and soil layer on soil nutrient content;
- The significant differences among soil microbial contents in the 0–20 cm soil layer in four periods under five fertilization types;
- The significant differences among soil microbial contents in the 20–40 cm soil layer in four periods under five fertilization types;
- The interaction between fertilization type and soil layer in soil microbial content;
- The significant differences in tree growth and volume in four periods under five fertilization types.
3. Results
3.1. Differences in Soil Nutrient Contents
3.1.1. Soil pH, AP, and AK
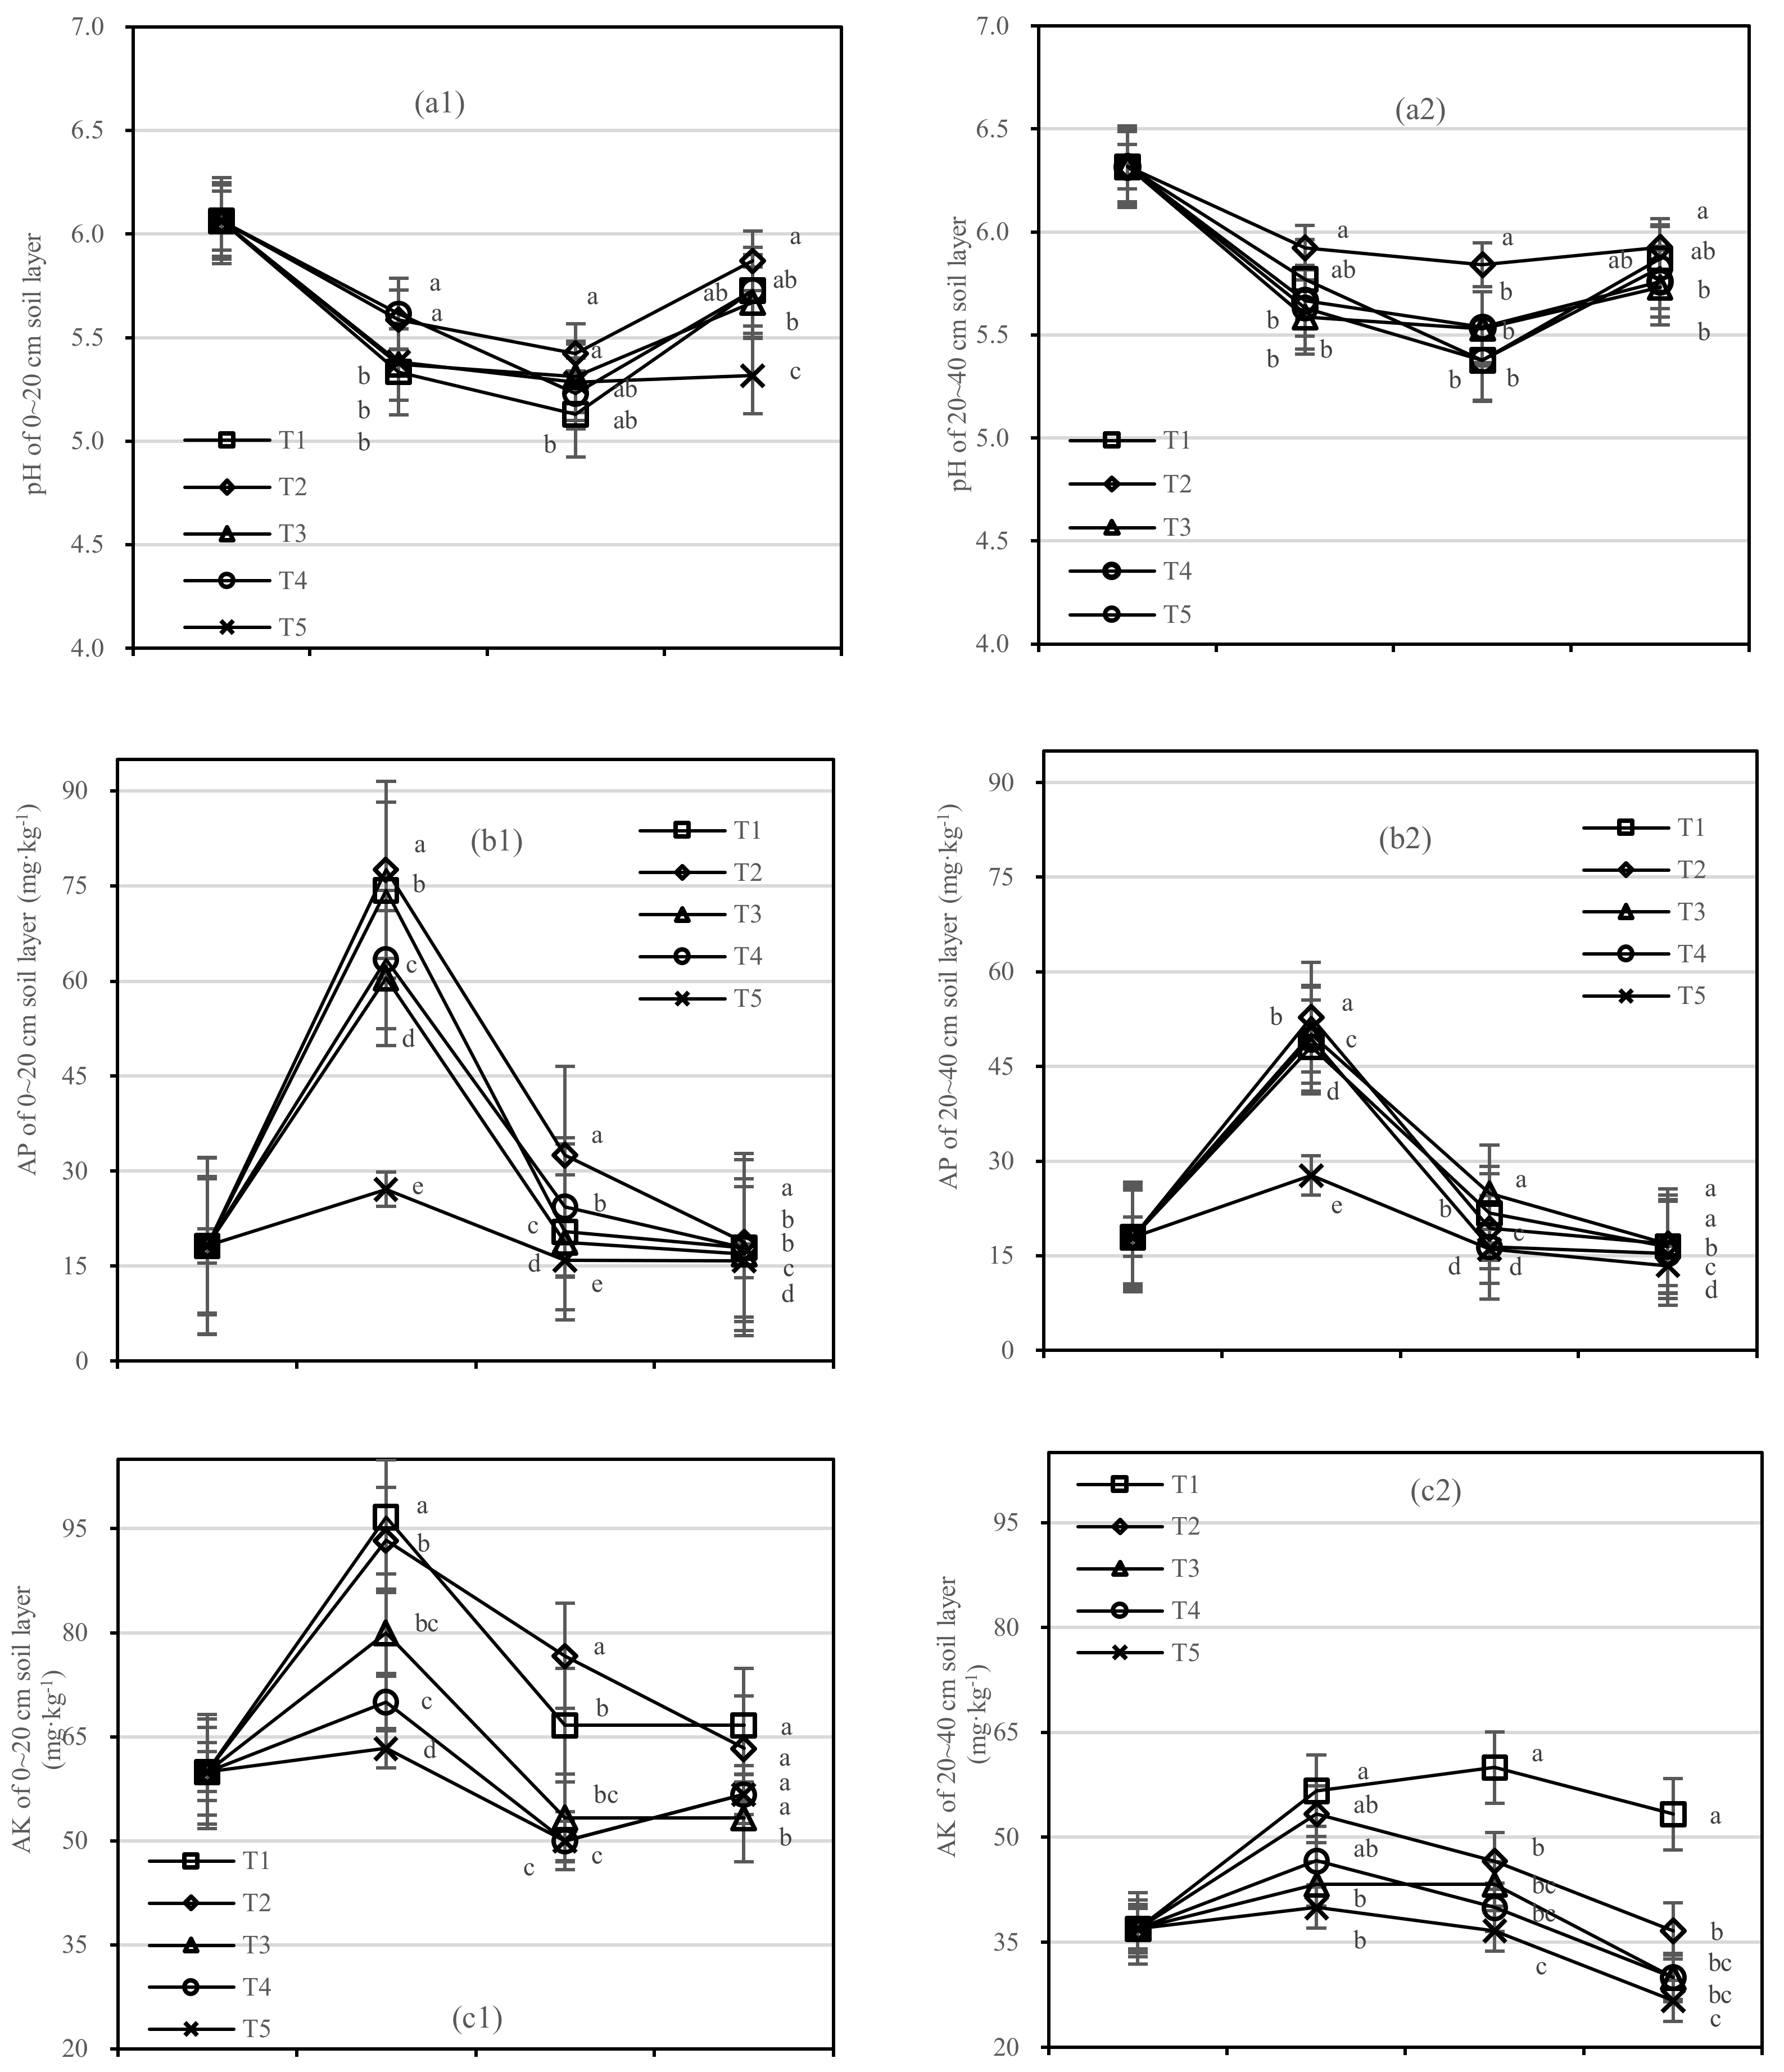
The pH value of the two soil layers experienced a process from acid to weak acid (Figure 3a) within the ranges of the two layers, 0.28–0.55 and 0.20–0.46, respectively. T1 had a higher pH than other treatments, and the lowest pH value (5.13 and 5.38) was found one year after fertilization both at 0–20 cm and 20–40 cm.
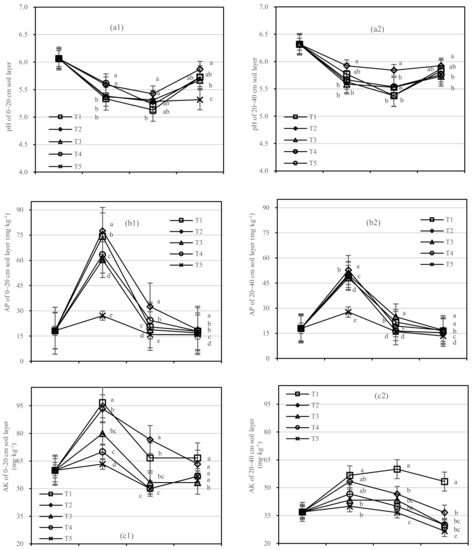
Figure 3.
Soil pH, AP, and AK in four periods under five fertilization types. Data are the mean content ± standard deviation. Letters represent differences (α = 0.05). T1: adjustment of C/N and C/P + 0.2% priming; T2: adjustment of C/N and C/P + 0.2% common compost; T3: adjustment of C/N and C/P; T4: raw material grinding of thinning shreds; T5: no fertilization. Additionally, (a1,a2), (b1,b2) and (c1,c2) describe the contents of soil pH value, available phosphorus (AP), and available potassium (AK) at 0–20 cm and 20–40 cm, respectively.
The AP content in different soil layers of each treatment was found to be significant at the 0.05 level. Compared with T5, the AP content of T1 increased by 47.2 mg·kg−1 after half a year of fertilization, and T2 by 50.4 mg·kg−1 in the 0–20 cm soil layer (Figure 3(b1)). In the 20–40 cm layer, T1 and T2 increased by 20.4 mg·kg−1 and 25.1 mg·kg−1 compared with T5, respectively (Figure 3(b2)).
There was no significant difference in AK content between T2 and T3, or T4 and T5 (Figure 3c). In the 0–20 cm soil layer, the AK value of T2 had a small amplitude and high content in the whole period, while T1 was stable in the 20–40 cm layer. After 1.5 years of fertilization, the AK content in the 0–20 cm soil layer from high to low was T1 > T2 > T4 > T5 > T3.
On the basis of our model, the soil pH, AP, and AK were significantly affected by fertilizer. The best result was found for the fertilizer T2, the soil layer showed the role with the largest increase in soil AP, and there was an interaction between the soil layer and fertilizer.
3.1.2. Soil TN and SOM
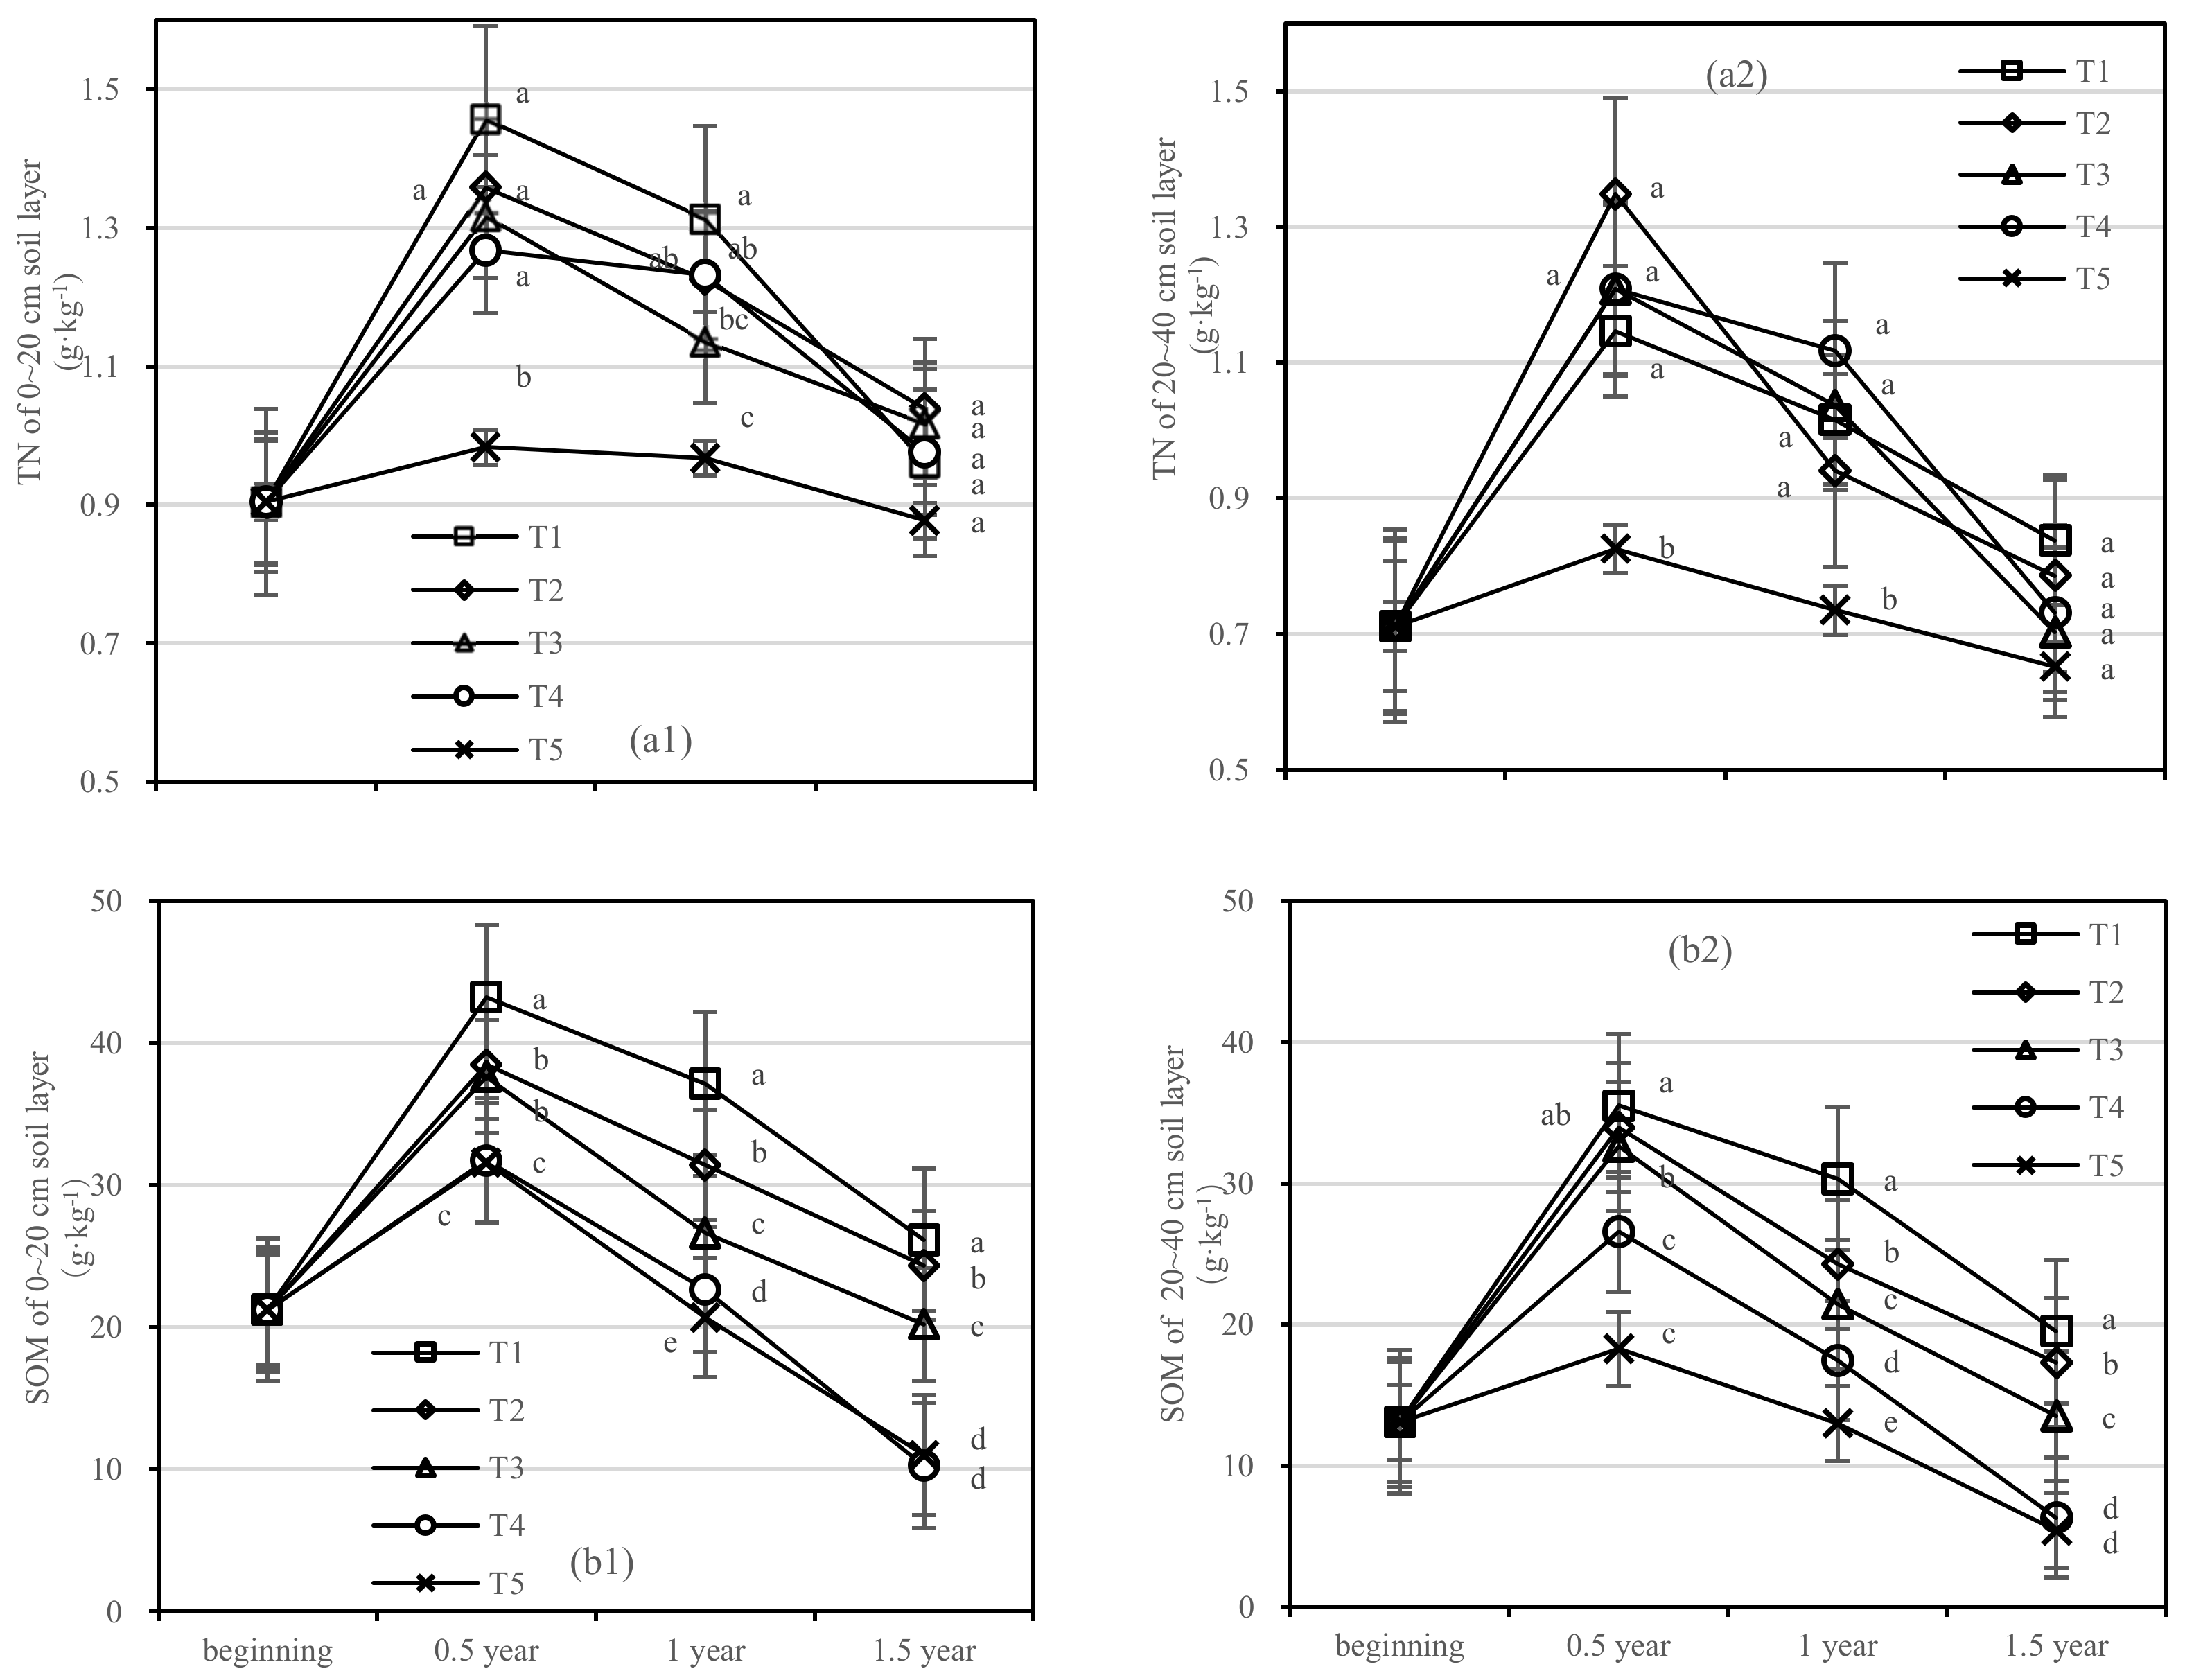
After half a year of fertilization, the TN content in the 0–20 cm soil layer of T1 was 1.5 times higher than that of T5, and that of the 20–40 cm soil layer was 1.4 times higher than that of T5 (Figure 4a). After 1.5 years of fertilization, the difference in the soil TN content in different soil layers gradually decreased, and there was no significant difference.

Figure 4.
Soil TN and SOM in four periods under five fertilization types. Data are the mean content ± standard deviation. Letters represent differences (α = 0.05). T1: adjustment of C/N and C/P + 0.2% priming; T2: adjustment of C/N and C/P + 0.2% common compost; T3: adjustment of C/N and C/P; T4: raw material grinding of thinning shreds; T5: no fertilization. Additionally, (a1,a2) and (b1,b2) describe the contents of soil total nitrogen (TN) and organic matter (SOM) in the 0–20 cm and 20–40 cm soil layers, respectively.
The changing trend of SOM content in all treatments was similar, and the content of SOM in T1 was the highest (Figure 4b). SOM content in the 20–40 cm soil layer of T1 and T2 was not significant after half a year of fertilization (Figure 4(b2)). Compared with the initial value, SOM values of the 0–20 cm layer of T1 and T2 increased by 4.93 g·kg−1 and 3.13 g·kg−1 after 1.5 years of fertilization, respectively (Figure 4(b1)). At the same time, the soil SOM of T3–T5 decreased to lower than the initial value. In the 20–40 cm layer, T1–T3 increased by 6.41 g·kg−1, 4.22 g·kg−1, and 0.41 g·kg−1 after 1.5 years, respectively, while T4 and T5 increased negatively.
On the basis of our model, the soil TN and SOM were significantly affected by fertilizer. The best result was found for the fertilizer T1, where the soil layer showed the role with the largest increase in SOM and there was an interaction between the soil layer and fertilizer.
3.1.3. Interaction of Fertilization Type and Soil Layer on Soil Nutrient Content
The interaction of different fertilization types and different soil layers on soil pH was not significant within 1 year of fertilization and reached a very significant level (0.01) at 1.5 years of fertilization; the interaction between them showed no significant difference in the accumulation of soil TN in the whole fertilization cycle (Table 3). The interaction between the fertilization type and soil layer showed a significant difference in soil AP content (0.01), while the difference in the soil AK content was only significant after one year of fertilization (0.05). At 0.5 years of fertilization, the accumulation of SOM content reached a highly significant level under the interaction of fertilization type and soil layer.
Table 3.
Interaction of five fertilization types and two soil layers in soil nutrient content of Pinus tabuliformis.
3.2. Differences in Soil Microbial Activity and Contents
3.2.1. Soil Microbial Biomass Carbon and Nitrogen
The soil MBC of T1 and T2 decreased rapidly after one-year fertilization, while T3–T5 had a small amplitude. After half a year of fertilization, the MBC content of T1 was 1.4 times higher than that of T5 in the 0–20 cm soil layer, and the MBC content of T2 was only 275.88 mg·kg−1 (Figure 5(a1)). After 1.5 years of fertilization, the MBC content of T1 was two times higher than that of T5, and T2 was 2.7 times higher than that of T4 in the 20–40 cm layer (Figure 5(a2)).
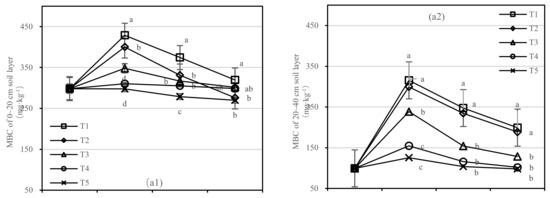
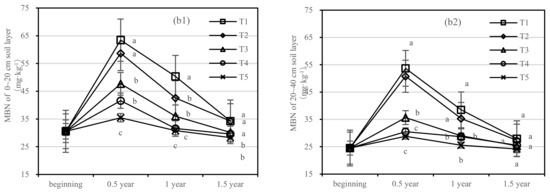
Figure 5.
Soil microbial biomass carbon (MBC) and nitrogen (MBN) in four periods under five fertilization types. Data are the mean content ± standard deviation. Letters represent differences (α = 0.05). T1: adjustment of C/N and C/P + 0.2% priming; T2: adjustment of C/N and C/P + 0.2% common compost; T3: adjustment of C/N and C/P; T4: raw material grinding of thinning shreds; T5: no fertilization. Additionally, (a1,a2) and (b1,b2) describe the soil microbial biomass carbon (MBC) and nitrogen (MBN) in the 0–20 cm and 20–40 cm soil layers, respectively.
There was no significant difference in soil MBN content between T3 and T5. The content of MBN in T1 was higher than that in T2 in the 0–20 cm layer and similar in the 20–40 cm layer (Figure 5b). After 1.5 years of fertilization, there was no significant difference in T1–T5, and the order of treatments was T1 > T2 > T3 > T4 > T5.
On the basis of our model, the soil MBC and MBN were significantly affected by fertilizer. The best result was found for fertilizer T1, where the soil layer showed the largest increase in soil MBC, and there was an interaction between the soil layer and fertilizer.
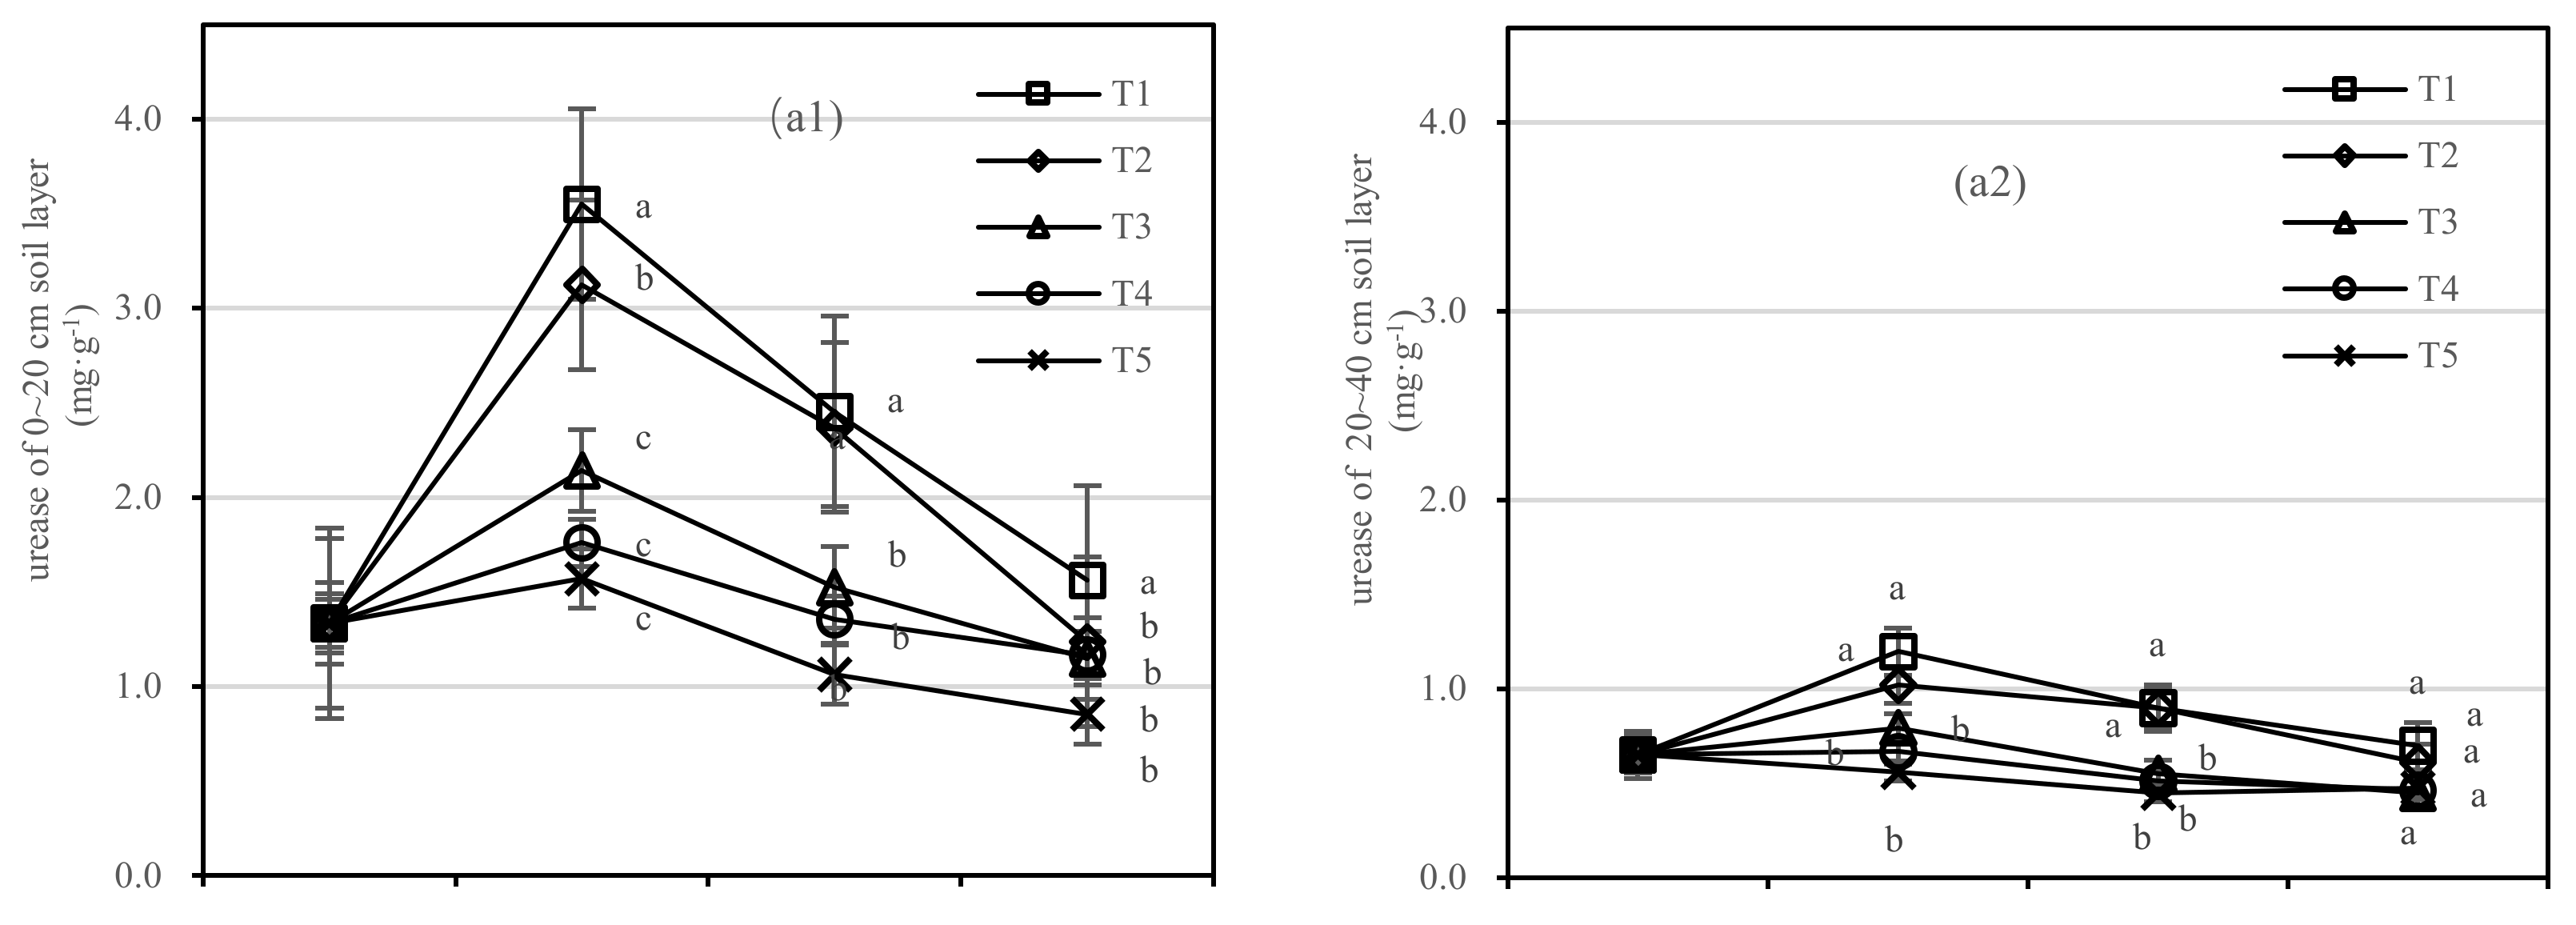
3.2.2. Soil Urease and Invertase Activities
Soil urease was negatively correlated with composts in the 0–20 cm layer; however, the application of compost had no response to soil urease activity in the 20–40 cm layer. The difference range of T1 and T5 in urease was 0.71–1.98 mg·kg−1, and that of T2 and T5 was 0.39–1.55 mg·kg−1 (Figure 6(a1)). The coefficient of correlation was not found to be significant between T1 and T2 in the 20–40 cm layer.

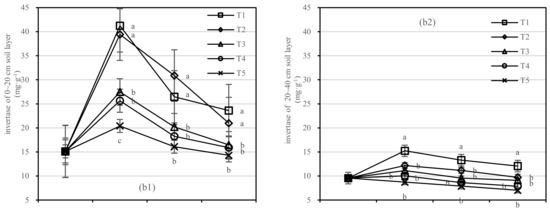
Figure 6.
Soil urease and invertase activities in four periods under five fertilization types. Data are the mean content ± standard deviation. Letters represent differences (α = 0.05). T1: adjustment of C/N and C/P + 0.2% priming; T2: adjustment of C/N and C/P + 0.2% common compost; T3: adjustment of C/N and C/P; T4: raw material grinding of thinning shreds; T5: no fertilization. Additionally, (a1,a2) and (b1,b2) describe the contents of soil urease and invertase in the 0–20 cm and 20–40 cm soil layers, respectively.
In the 0–20 cm soil layer (Figure 6(b1)), the soil invertase activity of T2 was more stable than that of T1. There was no significant difference in T3–T5. In the 20–40 cm soil layer (Figure 6(b2)), the difference between T2 to T5 was not significant. The invertase activity of T1 was the highest after 1.5 years of fertilization, and the order of treatments was T1 > T2 > T4 > T3 > T5 (Figure 6(b1)).
On the basis of our model, the soil urease and invertase were significantly affected by fertilizer, with the best result for the fertilizer T1.
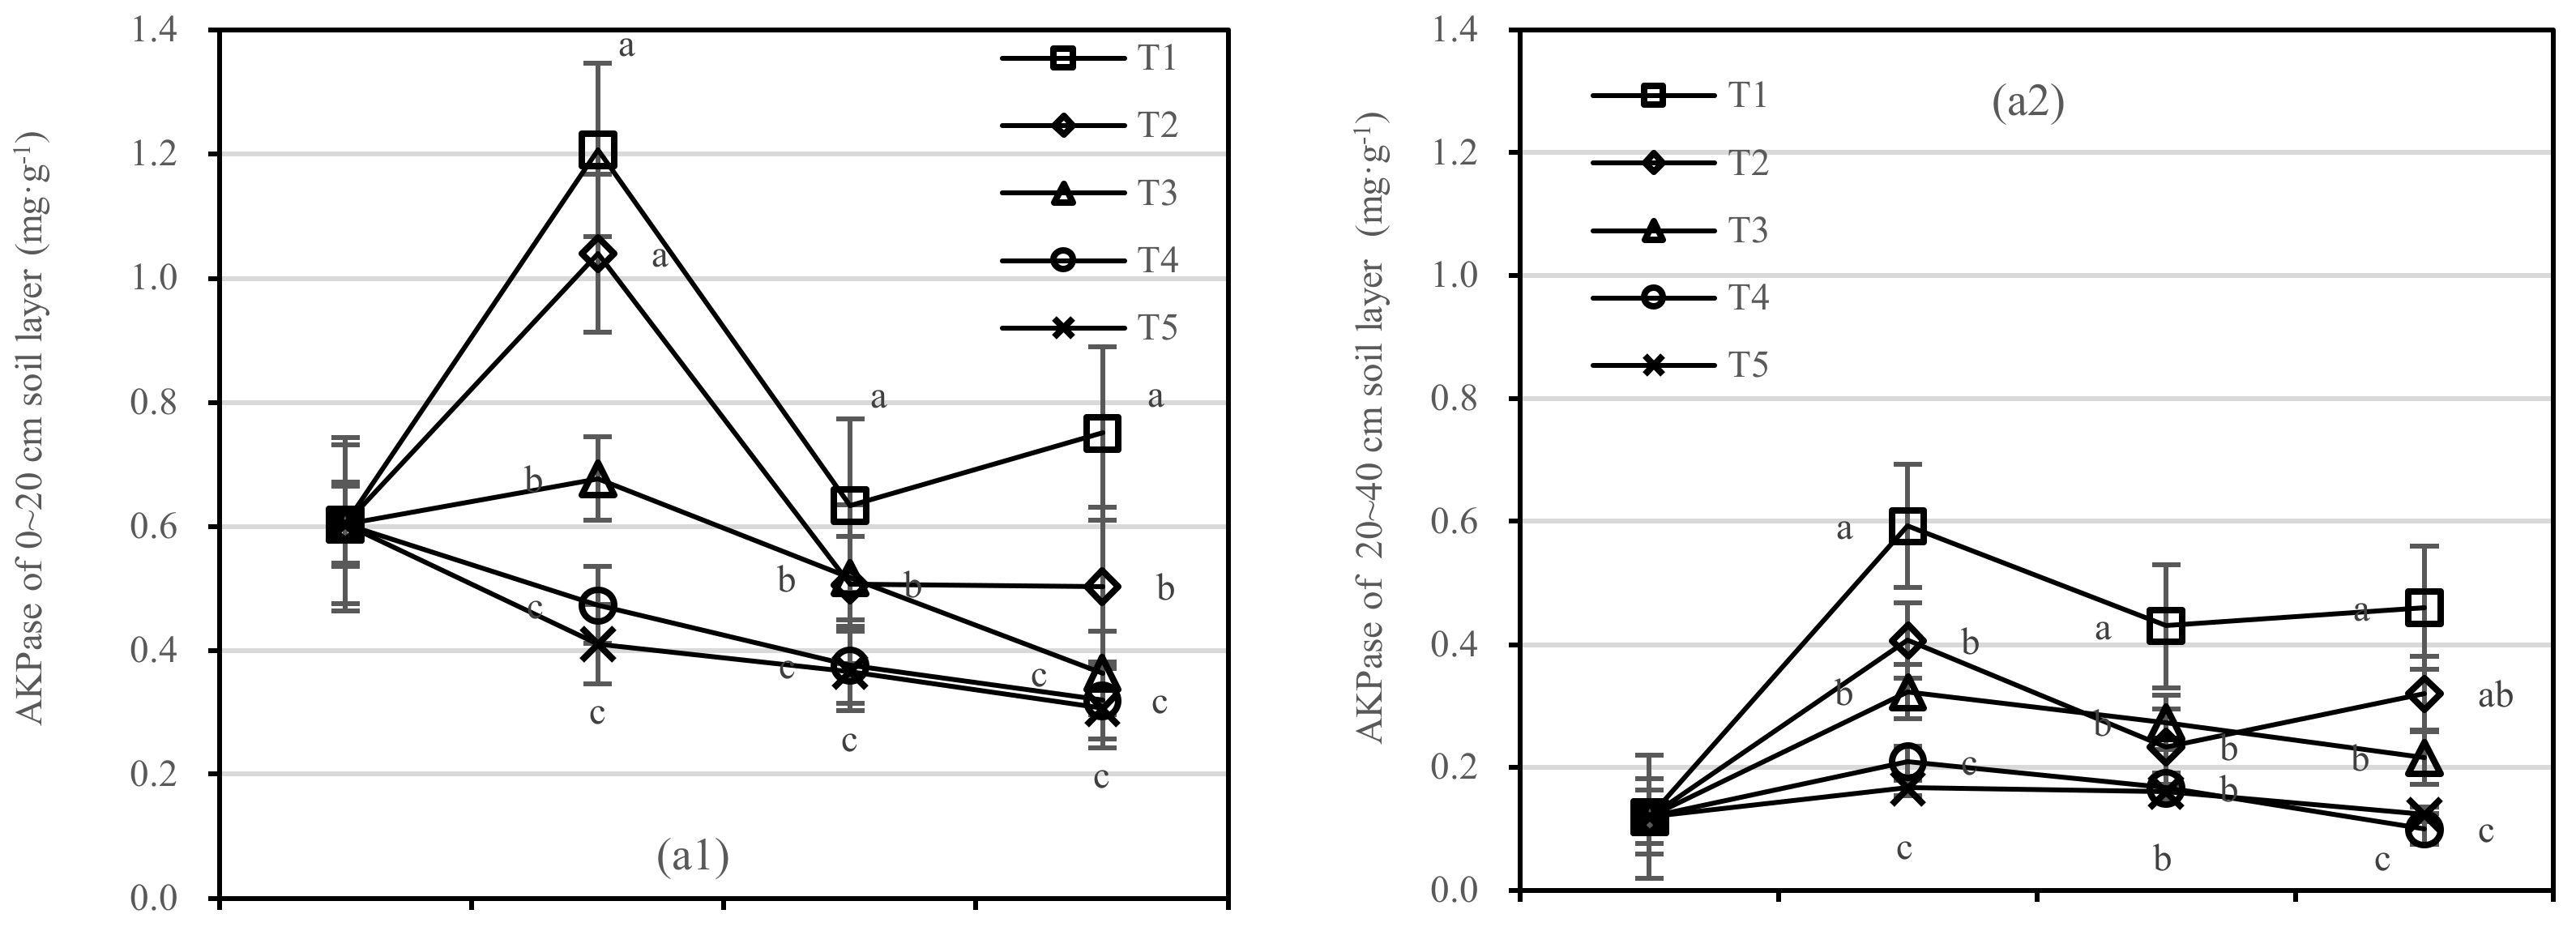
3.2.3. Soil Phosphatase Activities
The changing trend of AKPase activity of T1–T5 in the 0–20 cm and 20–40 cm soil layers was similar. Compared with 1 year after fertilization (Figure 7a), the AKPase activity of T1 and T2 increased slightly after 1.5 years of fertilization, and T2 showed the largest change. There was no significant difference between T4 and T5, and the changing trend of T3 was stable relatively.
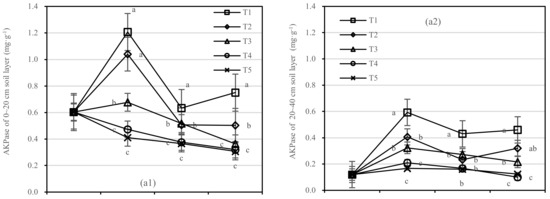
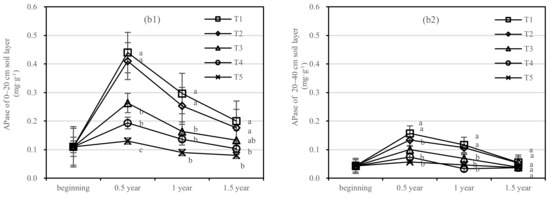
Figure 7.
Soil AKPase and APase activities in four periods under five fertilization types. Data are the mean content ± standard deviation. Letters represent differences (α = 0.05). T1: adjustment of C/N and C/P + 0.2% priming; T2: adjustment of C/N and C/P + 0.2% common compost; T3: adjustment of C/N and C/P; T4: raw material grinding of thinning shreds; T5: no fertilization. Additionally, (a1,a2) and (b1,b2) describe the contents of soil AKPase and APase activities in the 0–20 cm and 20–40 cm soil layers, respectively.
After half a year of fertilization, the APase activity of T1 in the 0–20 cm soil layer was increased by 0.31 mg·kg−1, in the 20–40 cm layer by 0.1 mg·kg−1, and T2 in two soil layers was increased by 0.28 mg·kg−1 and 0.07 mg·kg−1, respectively (Figure 7b). There was no significant difference in APase activity between T3 and T5.
On the basis of our model, the soil AKPase and APase were significantly affected by fertilizer. The best result was found for fertilizer T1, where the soil layer showed the largest increase in soil APase, and there was an interaction between the soil layer and fertilizer.
3.2.4. Quantity of Soil Microorganisms
The T1 had a higher quantity of fungi than other treatments (Figure 8a). With the increase in application time, the number of fungi in T3 decreased in the 0–20 cm soil layer rapidly and varied from 1.222 to 2.445 (104, CFU·g−1) in the 20–40 cm layer. After 1.5 years of fertilization, the number of fungi in T1 was 2.2 times higher than that in T3 in the 0–20 cm soil layer and was 2.8 times higher than that of T5 in the 20–40 cm layer (Figure 8a). The number of fungi in T3–T5 was lower than that before fertilization.
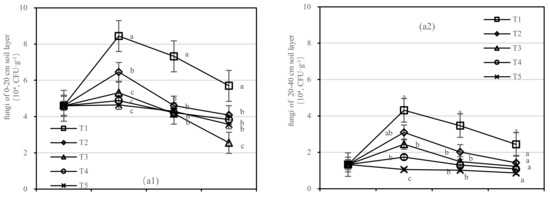
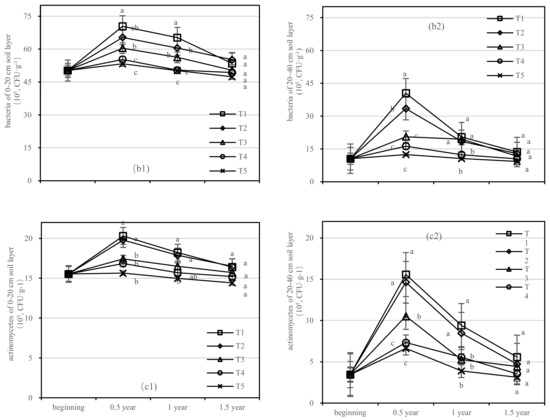
Figure 8.
Quantity of soil fungi, bacteria, and actinomycetes in four periods under five fertilization types. Data are the mean content ± standard deviation. Letters represent differences (α = 0.05). T1: adjustment of C/N and C/P + 0.2% priming; T2: adjustment of C/N and C/P + 0.2% common compost; T3: adjustment of C/N and C/P; T4: raw material grinding of thinning shreds; T5: no fertilization. Additionally, (a1,a2), (b1,b2) and (c1,c2) describe the soil fungi, bacteria, and actinomycetes in the 0–20 cm and 20–40 cm soil layers, respectively.
The number of bacteria in the soil after composting was the highest, and the change in the bacteria number was obvious in the 20–40 cm soil layer (Figure 8b). After 1.5 years of fertilization, the soil bacterial content of T1–T5 was close to that before fertilization, among which the T1 content was the highest, with the quantity of 50.261 (105, CFU·g−1), 70.435 (105, CFU·g−1), 65.208 (105, CFU·g−1), and 53.461 (105, CFU·g−1), respectively, in the 0–20 cm soil layer.
In the 0–20 cm soil layer (Figure 8(c1)), T1–T4 had the longest quantity of actinomycetes, and the maximum values were 4.773 (105, CFU·g−1), 4.251 (105, CFU·g−1), 1.9 (105, CFU·g−1), and 1.3 (105, CFU·g−1), respectively, and the order of treatments was T2 > T1 > T4 > T5 > T3 (Figure 8(c1)). In the 20–40 cm layer (Figure 8(c2)), the number of actinomycetes in T1 varied between 3.453 (105, CFU·g−1) and 15.578 (105, CFU·g−1), and T3 decreased most rapidly.
On the basis of our model, the soil fungi, bacteria, and actinomycetes were significantly affected by fertilizer. The best result was found for fertilizer T1, where the soil layer showed the largest increase in soil bacteria and there was an interaction between the soil layer and fertilizer.
3.2.5. Interaction between Fertilization Type and Soil Layer on Soil Microbial Content
In the 1.5-year fertilization cycle, the interaction of different fertilization types and different soil layers had a significant effect on the accumulation of soil microbial biomass (Table 4). There was always a very significant difference in the amount of soil MBC, urease, sucrase, acid phosphatase, and bacteria (0.01). The difference of their interaction in the accumulation of soil MBN, alkaline phosphatase, and actinomycetes decreased with the increase in fertilization time, from 0.5 years of fertilization (0.01) to 1.5 years of fertilization; the difference in the accumulation of soil fungi gradually increased, reached a very significant difference at the time of fertilization for 1 year, and then remained until 1.5 years.
Table 4.
Interaction of five fertilization types and two soil layers in soil microbial content of Pinus tabuliformis.
3.3. Differences in Growth of Pinus tabuliformis
3.3.1. High Growth of Trees
After 1.5 years of fertilization, the difference in the means of tree height growth gradually became significant (Table 5). The difference between T1 and T5 was found to be significant at the 0.01 level, and the difference between T2 and T5 was found to be significant at the 0.05 level. The increment in T1–T4 in the mean tree height was 3 times, 2.5 times, 1.5 times, and 1.5 times higher than that of T5 after 1.5 years of fertilization, respectively. The mean DBH increments in T1–T5 was 1.7 cm, 2.5 cm, 1.0 cm, 1.5 cm, and 1.5 cm, respectively (Table 5). At 0.5 years of fertilization, composts had the greatest impact on the mean growth of tree crowns, and there were obvious differences between the two directions.
Table 5.
Differences in height, diameter at breast height, and crown width of Pinus tabuliformis.
3.3.2. Volume of Pinus tabuliformis
The growth of the individual volume of T1 was significantly higher than that of other treatments. After 1.5 years of fertilization, the increment in the individual volume of T1 was five times higher than that of T5; that of T2–T4 was 4.6 times, 2.5 times, and 3.5 times higher than that of T5, respectively, and the order of treatments was T1 > T2 > T3 > T4 > T5 (Figure 9a). The volume per unit area of T2 increased faster than in other treatments. In terms of the volume growth per unit area, T1 increased by 3.6 m3·hm−2; T2 increased by 5.0 m3·hm−2; T3 and T4 increased by 3.2 m3·hm−2, and 1.8 m3·hm−2, respectively; and the order of treatments was T3 > T2 > T1 > T5 > T4 (Figure 9b).
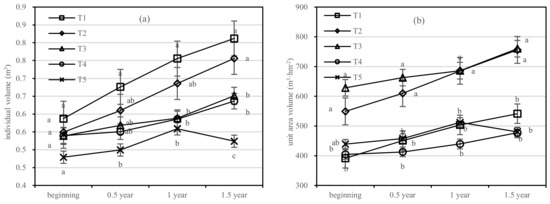
Figure 9.
Individual volume and unit area volume of Pinus tabuliformis in four periods under five fertilization types. Data are the mean content ± standard deviation. Letters represent differences (α = 0.05). T1: adjustment of C/N and C/P + 0.2% priming; T2: adjustment of C/N and C/P + 0.2% common compost; T3: adjustment of C/N and C/P; T4: raw material grinding of thinning shreds; T5: no fertilization. Additionally, (a,b) describe the individual volume and unit area volume, respectively.
3.3.3. Regeneration of Pinus tabuliformis
After one year of fertilization, the regeneration in T1–T5 was dominated by broad-leaved trees such as Quercus mongolica and Ailanthus altissima (Table 6). After 1.5 years of fertilization, the species and quantity of regeneration plants under Platycladus orientalis in T1–T4 increased significantly and was mainly composed of Quercus mongolica and Vitex negundo; 102 Vitex negundo were newly born in total. The base diameter and coverage increased steadily in T1–T5.
Table 6.
Regeneration of Pinus tabuliformis.
4. Discussion
4.1. Effects of Four Composts of Forest Thinning Shreds on Soil Nutrients
Soil fertility directly affects the growth and development of trees, thus affecting the quality of forests. In the 1.5-year fertilization cycle, with time, the soil pH showed a trend of first decreasing and then increasing, which is consistent with the previous research results [33]. Within one year of fertilization, the soil of each fertilization treatment was continuously acidified and gradually became weak acid in 1–1.5 years. This may be because, in the early stage of fertilization, thinning shreds compost continues to release nitrogen into the soil, resulting in soil acidification; in the late stage of fertilization, with the release of base ions in thinning shreds compost, soil base saturation changes and the pH increases [34]. In the 0–20 cm soil layer, the acidification degree of thinning shreds compost (T1 and T2) containing two additives was less than that of other composted soils; in the 20–40 cm soil layer, the pH of the soil treated with thinning shreds compost with priming (T1) was the weakest. This is because the ability of additive compost to release nutrients is more stable and sustainable, and T1 and T2 had little effect on soil pH after reverse application to forest land.
Within one year after fertilization, TN and SOM in the 0–20 cm soil layer and 20–40 cm soil layers of T1, T2, and T3 were higher than the national average level (1.06 and 19.17 g·kg−1) [35]; even in 1.5 years of fertilization, the SOM of T1 and T2 in the two soil layers was still higher than the national average. Fertilization can increase SOM by promoting the formation of aggregates larger than 2 mm in the soil [34] and can also cause an “excitation effect” to change the turnover rate of nutrients in the soil and increase the storage of soil nutrients in the Pinus tabuliformis plantation after thinning. Exogenous nutrients (natural decomposition of litter, artificial fertilization, etc.) and the weathering of rocks are the main sources of available nutrients in soil [36]. Nutrients released from thinning shreds of compost can quickly supplement phosphorus and potassium in the soil, and the contents of AP and AK are mainly affected by the decomposition rate of compost. The compost with two additives decomposes rapidly under the action of microorganisms, and the slow-release capacity can be maintained for at least 1.5 years, which greatly alleviates the nutrient loss caused by thinning.
With the increase in the soil layer, the contents of TN, AP, AK, and SOM in the soil of the Pinus tabuliformis plantation decreased, which was consistent with other research results [37]. Within 0.5 years of fertilization, the soil nutrient content of T1–T4 accumulated rapidly and reached its peak; from 0.5 years, the soil nutrients of each treatment decreased gradually, and the decreases in T1 and T2 were the smallest, indicating that the nutrient release ability of the thinning shreds compost with additives was better than that of other composts, and the composting effect with priming agent was the best. Within 1.5 years of fertilization, most of the soil nutrient contents of T1, T2, and T3 were higher than that of T5. Thinning shreds of compost enhanced the soil fertility retention ability of the Pinus tabuliformis plantation after thinning. Comparing the two soil layers, the nutrient content of the 0–20 cm soil layer was higher than that of the 20–40 cm soil layer. This is because there is less litter in the Pinus tabuliformis forest and the forest surface cover is thin, so the soil surface temperature is high, the water content is low [38], and the micro-living activities of the lower soil are weakened. In addition, C and N are apparent [39], the adsorption of P by soil is strong, the mineralization of deep soil is blocked, and the downward migration of various components in the soil is reduced.
On the basis of our model, the soil nutrient content was significantly affected by fertilizer. The best result was found for fertilizers T1 and T2, where the soil layer showed the largest increase in soil AP and SOM, and there was an interaction between the soil layer and fertilizer.
4.2. Effects of Four Composts of Forest Thinning Shreds on Soil Microbial Biomass Accumulation
Soil microbial biomass carbon (MBC) accounts for only 1~3% of soil organic carbon, but it is a key link in the material cycle and energy flow of the forest ecosystem [40]. Within 0.5 years after fertilization, MBC and MBN in the two soil layers of each fertilization treatment continued to increase, and the contents of T1 and T2 were significantly better than those of T3–T5 in 0.5 years. It can be seen that compost provides sufficient nutrition and energy for the survival and reproduction of forest soil microorganisms in order to increase the soil microbial biomass [41]. Among them, the effect of priming catalyzing the transformation of steady-state nutrients into available nutrients in thinning shreds compost is significantly better than that of other composts. From 0.5 to 1.5 years of fertilization, MBN content decreased rapidly. There was no significant difference in MBN content between the two soil layers after 1.5 years of fertilization, which was mainly due to the high mineralization rate and leaching of forest soil nitrogen [42].
Soil enzymes are involved in catalyzing a series of biochemical reactions in the soil and transforming organic matter into nutrients available to plants [43]. After thinning, the soil nutrient content and enzyme activity will decline to a certain extent, and the forest soil will show a declining trend [33]. In this study, the number of main soil enzymes increased significantly when the composts of different kinds of thinning shreds were applied to the thinning Pinus tabuliformis soil, especially the composts with two additives. Soil microbial activity and biomass accumulation were affected by soil temperature. The soil temperature decreases with the deepening of the soil layer [44]. On the whole, compared with the topsoil, the enzyme activity of the 20–40 cm soil layer barely changed after fertilization, and only the thinning shreds compost with priming showed significant differences in different enzyme activities. This shows that soil enzyme activity has the same surface aggregation effect as soil nutrients, and urease activity in shallow soil is higher, which is consistent with previous studies [45,46]. Studies have shown that urease activity may be affected by organic matter content [47], and soil sucrase is closely related to soil organic matter metabolism and nitrogen and phosphorus content [48]. The activities of urease and sucrase decreased gradually from 0.5 years after the thinning compost was applied to the soil of the thinning Pinus tabuliformis plantation. This was due to the natural loss of nutrients in thinning shreds of compost absorbed by trees, coupled with the slow natural decomposition rate of thinning compost and the reduction in carbon sources in soil. In this study, the phosphatase activity of T1 and T2 treatments fluctuated in a small range in the late stage of fertilization, with a rising trend. This may be because the additives promote the growth and reproduction of soil microorganisms, increase the demand for phosphorus, and are more suitable for the growth of phosphatase activity with the increase in soil pH.
The number of culturable microorganisms in soil can directly reflect the microecological effect of soil [49]. The results show that with the increase in soil depth, the number of bacteria, actinomycetes, and fungi decreases, which is consistent with the research results of scholars [50]. However, some studies have shown that the number of bacteria and actinomycetes increases with the deepening of the soil layer, while the number of fungi decreases [51]. The reason for this difference may be that the types and quantities of exogenous nutrients (litter, fertilizer, etc.) are different, and the nutrients and environment that can be provided for microorganisms are also different. In general, the number of bacteria in the thinning Pinus tabuliformis plantation increased the most after applying thinning shreds compost; the increment in soil microbial biomass in T1 was the largest among the composts of different thinning shreds. This may have been because in several different types of compost, the priming, as an additive, provides the most nutrients for composting; at the same time, the T1 treatment has a high moisture content and low toxicity (Table 2), which provides a relatively suitable environment for soil microorganisms. Some scholars have proven that additives can change the symbiotic mode of the bacterial community, and the key bacterial groups with a strong ability to degrade carbon sources are related to the increase in cellulase and urease activities [52]. The specific differences in the environment provided by the composting of different thinning shreds for soil microorganisms and the changes in different soil layers need to be further studied.
On the basis of our model, the soil microbial biomass accumulation was significantly affected by fertilizer. The best result was found for fertilizer T1; the soil layer showed the largest increase in soil MBC, APase, and bacteria; and there was an interaction between the soil layer and fertilizer.
4.3. Effects of Four Composts of Forest Thinning Shreds in the Growth of Pinus tabuliformis
The DBH, height, and volume of the tree layer are important indexes to evaluate the environmental benefits of the stand. In this study, after applying different types of thinning shreds compost, the growth indexes such as tree height, DBH, and crown width of the semimature Pinus tabuliformis plantation after thinning had no significant difference within 0.5 years. At this time, the thinning shreds compost is still slowly decomposing and releasing nutrients, and the absorption and utilization of nutrients in thinning shreds compost by Pinus tabuliformis is still very limited. Some scholars have found that the medium nitrogen level (10 nmol·L−1) is the most favorable for the height growth of Pinus tabuliformis, and the high nitrogen level (20 nmol·L−1) is the most favorable for the thickening of basal diameter [10]. From 0.5 years after fertilization, the crown width first showed differences in the growth cycle, and the tree height and DBH gradually showed significant differences after 1 year of fertilization. The results showed that in the early stage of fertilization, due to the top advantage, the crown width grew first, while the carbon and nitrogen released by thinning shreds compost as a carbon source and nitrogen sources were not enough; with the continuous decomposition of thinning shreds compost in the soil, the microbial activity increased, the accumulated nitrogen in the soil increased, and the tree height growth and stem growth began to respond. In this study, compared with other nutrient contents, the content of soil SOM and TN decreased less within 0.5–1.5 years after fertilization, which can also be used as evidence.
Stand volume is a comprehensive reflection of stand average DBH and average tree height [53]. After fertilization, the volume per plant and stand volume of the thinning Pinus tabuliformis plantation showed a continuous growth trend, and the volume per plant gradually showed a difference between T1–T4 and T5 from the first 0.5 years. This shows that on the basis of the better growth environment of the Pinus tabuliformis forest brought about by the initial thinning measures, the thinning shreds compost continuously and slowly release nutrients, which continues the forest growth caused by external stimulation to a certain extent. Witnin 1.5 years of fertilization, there was a significant difference between the thinning compost with two additives and no fertilization. It can be seen that the compost with additives has a continuously positive impact on the single plant volume and stand volume of Pinus tabuliformis forest for at least 1.5 years. Reasonable forest thinning can not only improve the average DBH, tree height, and single tree volume of the stand but also promote regeneration under the forest [54]. This is beneficial for soil fertility and enzyme activity to rely on natural regeneration after the clear-cutting of the Pinus tabuliformis plantation [33]. In this study, by comparing the vegetation renewal status in the sample plot when fertilizing for 1 year and 1.5 years, it was found that there was no significant difference in the number, species, average height, average base diameter, and coverage of the regenerated vegetation under the Pinus tabuliformis forest upon applying different kinds of thinning shreds compost (T1–T4), and the renewal situation of the treatment without fertilization (T5) was better than that of fertilization within 1.5 years. This may have been because the amount of fertilizer used in this study was too large for understory shrubs, grasses, and seedlings, and the nutrient concentration released by thinning compost during the fertilizer effect period will inhibit understory regeneration.
On the basis of our model, the growth of Pinus tabuliformis was significantly affected by fertilizer, with the best result for the fertilizers T1 and T2. Among them, T1 can significantly promote the growth of tree height, and T2 can promote the growth of tree DBH.
5. Conclusions
In this study, forest thinning shreds were used as raw materials to make different types of thinning shreds compost in the forest, and then they were applied to the thinning semimature Pinus tabuliformis plantation in the same amount; in the growth cycle of 1.5 years, from the depths of 0–20 cm and 20–40 cm, the differences in soil nutrient content, soil microbial biomass carbon and nitrogen content, soil enzyme activity, soil microbial quantity, forest growth, single plant volume, and stand volume, as well as understory regeneration were discussed in order to verify the fertilizer effect of compost of different forest thinning shreds.
The main conclusions are as follows: (1) The change trends of soil nutrient content, soil enzyme activity, and soil microbial biomass were similar after the reverse application of thinning shreds compost to Pinus tabuliformis forest land. It increased rapidly within 0.5 years after fertilization, and gradually decreased from 0.5 years, and the trend of soil pH was the opposite. (2) All indexes of the 0–20 cm soil layer of the Pinus tabuliformis the forest were greater than those of the 20–40 cm soil layer. (3) The compost of each thinning shreds first promoted the growth of the Pinus tabuliformis canopy after the reverse application of forest land and significantly promoted the growth of tree height and DBH in the later stage. (4) The effect of thinning shreds compost on the stand volume of Pinus tabuliformis was greater than that on single tree volume. (5) It was not found that thinning shreds compost had a positive effect on the understory regeneration of the thinning semimature Pinus tabuliformis plantation. In general, the fertilizer effect of thinning shreds compost with priming was the best for the thinning semimature Pinus tabuliformis plantation.
Author Contributions
L.N. and X.L. conceived and designed the experiments; X.L., J.Z. (Jiwei Zhang) and J.H. participated in the discussion of the design and visited the study site; F.M. provided human support at Beitaishang state forest farm; H.B. and J.Z. (Jialei Zhu) performed the experiments; X.L. collected samples and analyzed the data; X.L. wrote the paper. All authors have read and agreed to the published version of the manuscript.
Funding
2015BAD07B00 (2015BAD07B02), the Key Technologies R&D Program of China.
Institutional Review Board Statement
Not applicable.
Informed Consent Statement
Not applicable.
Data Availability Statement
Not applicable.
Acknowledgments
This work was supported by the Key Technologies R&D Program of China, 2015BAD07B00 (2015BAD07B02). Additional support was provided by the Beitaishang state forest farm and Gardening and Greening Bureau, Beijing.
Conflicts of Interest
The authors declare no conflict of interest.
References
- Chen, X.A. Utilization and development of forest tending shreds. J. Green Sci. Technol. 2013, 6, 33–34. [Google Scholar]
- Wang, L.P. Effect of nitrogen application level on the growth of new seedlings of Pinus tabuliformis. Anhui Agric. Sci. Bull. 2020, 26, 64–158. [Google Scholar] [CrossRef]
- Yang, Y.L. Effects of Different thinning Methods on the Ecological Benefits of Pinus tabuliformis Plantation. J. Prot. Forest Sci. Technol. 2021, 2, 20–22, 28. [Google Scholar] [CrossRef]
- Zhao, Q.H.; Liang, C.W.; Li, X.H. Monitoring and comparative analysis of thinning effect of middle-aged Pinus tabuliformis Plantation. J. China Hi-Tech 2021, 3, 125–140. [Google Scholar]
- Qiu, C.; Qin, Q.Q.; Zheng, D.T.; Liu, Y.H. Litter Decomposition and Hydrological Effects of Pinus tabuliformis Plantation After Severe Burning. J. Soil Water Conserv. 2022, 36, 196–204. [Google Scholar] [CrossRef]
- Wu, X.S.; Li, Z.X.; Huang, Y.L.; Ma, J.; Han, X.B.; Zhang, F. Screening, Identification and Its Composting Application of High-temperature Strain for Degrading Lignocellulose. Anhui Agric. Sci. 2021, 49, 68–71. [Google Scholar]
- Feng, H.Y.; Du, M.Y.; Xin, X.B.; Gao, X.; Zhang, L.J.; Kong, Q.Y.; Fa, L.; Wu, D. Seasonal variation in C, N, and P stoichiometry of Platycladus orientalis plantation in the rocky mountainous areas of North China. Acta Ecol. Sin. 2019, 39, 1572–1582. [Google Scholar]
- Hao, L.F.; Li, X.Y.; Wu, X.Q.; Liu, T.Y.; Wang, X.F. Responses of the Root System Architecture of One-Year-Old Pinus tabuliformis Seedlings to Fertilization and Ectomycorrhizal Fungus Inoculation. J. Northwest For. Univ. 2021, 36, 168–174. [Google Scholar]
- Zhao, Y. Short-term Effects of Nitrogen Fertilizer Simulated Nitrogen Deposition on Undergrowth Soil Properties in Natural Secondary Forest of Pinus tabuliformis. J. Prot. Forest Sci. Technol. 2020, 12, 18–20. [Google Scholar] [CrossRef]
- Zhang, X.W. Effects of Different Nitrogen Fertilization Rates on Growth and Biomass of Pinus tabuliformis Seedlings. J. Hubei For. Sci. Technol. 2020, 49, 32–33, 41. [Google Scholar]
- Fisher, R.F.; Garbett, W.S. Response of Semimature Slash and Loblolly Pine Plantations to Fertilization with Nitrogen and Phosphorus 1. Soil Sci. Soc. Am. J. 1980, 44, 850–854. [Google Scholar] [CrossRef]
- Shen, Z.; Sun, S.X. A review of nursery fertilization research. J. World For. Res. 1992, 3, 22–29. [Google Scholar] [CrossRef]
- Zuo, Y.Z. Study on fertilization effect of Pinus tabuliformis seedlings. J. For. Sci. Technol. Commun. 1985, 6, 8–13. [Google Scholar] [CrossRef]
- Shi, W.H.; Grossnickle, S.C.; Li, G.L.; Su, S.C.; Liu, Y. Fertilization and irrigation regimes influence on seedling attributes and field performance of Pinus tabuliformis. J. For. Int. J. For. Res. 2019, 92, 97–107. [Google Scholar] [CrossRef]
- Wei, N. How to See Quality and Field Performance of Pinus tabuliformis, Quercus Mongolia Respond to Fertilizer Treatments. Master’s Thesis, Beijing Forestry University, Beijing, China, 2020. [Google Scholar] [CrossRef]
- Hu, W.Z.; Gu, X.X.; Si, J.H.; Gong, X.Q. Effects of Different Fertilization Methods on Growth of Pinus tabuliformis Plantation in Xining City. Modern Agric. Sci. Technol. 2019, 24, 103–105, 107. [Google Scholar]
- Lirikum, L.N.K.; Thyug, L.; Mozhui, L. Vermicomposting: An eco-friendly approach for waste management and nutrient enhancement. J. Trop. Ecol. 2022, in press. [Google Scholar] [CrossRef]
- Luo, Y.J.; Van, V.H.; Pieter, J.; Chen, S.Y.; Sechi, V.; Ter, H.A.; Veeken, A.; Buisman, C.J.N.; Bezemer, T.M. Effects of sterilization and maturity of compost on soil bacterial and fungal communities and wheat growth. J. Geoderma 2022, 409, 115598. [Google Scholar] [CrossRef]
- Han, H.G.; Du, K.; Ding, J.Y.; Cai, L.F. Research Progress on Compost Application and Technologies of Garden Waste. J. Shanxi Agric. Sci. 2018, 46, 2111–2114. [Google Scholar]
- Zou, W.X.; Luo, H.; Zhao, J.Q.; Yue, Z.H.; Liu, S.Y.; Liang, A.Z.; Wang, X.J.; Shu, C.L.; Han, L.L.; Shen, J.P. Effects of swine manure and its vermicompost on the wheat seedling growth and soil bacterial community. J. Agric. Resour. Environ. 2022, 1–11. [Google Scholar] [CrossRef]
- Wang, W. Advances in garden waste compost used as herbaceous flowers substrate. J. Hubei Agric. Sci. 2021, 60, 11–15. [Google Scholar] [CrossRef]
- Imran, A.; Sardar, F.; Khaliq, Z.; Nawaz, M.S.; Shehzad, A.; Ahmad, M.; Yasmin, S.; Hakim, S.; Mirza, B.S.; Mubeen, F.; et al. Tailored Bioactive Compost from Agri-Waste Improves the Growth and Yield of Chili Pepper and Tomato. Front. Bioeng. Biotechnol. 2022, 9, 787764. [Google Scholar] [CrossRef] [PubMed]
- Hu, J.W.; Liu, Y.; Wang, Y.; Lou, J.S.; Li, G.L. Effects of Mushroom Residue Compost on Growth and Nutrient Uptake of Pinus tabuliformis Container Seedlings. Sci. Silvae Sin. 2017, 53, 129–137. [Google Scholar]
- Wang, L.F. Effects of garden waste composting on container seedling growth of Pinus tabuliformis. J. Shanxi For. 2016, 4, 43–44. [Google Scholar] [CrossRef]
- Zhu, J.L.; Li, X.; Bo, H.J.; Nie, L.S.; Li, J.H.; Hu, J.; Wang, S.Q.; Li, Z. Research on Seasonal Dynamic Changes of Pine Needles and Characters of Carbon- nitrogen-phosphorus by Fertilization. C. Part II. In Proceedings of the 13th Academic Conference of the Chinese Society of Cross-Strait Fertilization and Fertilizer Science, Xi’an, China, 19 September 2016; pp. 191–201. [Google Scholar]
- Jin, X. Effect of Thinning Residue Compost on Seedings of Platyladus Orientalis and Pinus tabuliformis. Master’s Thesis, Beijing Forestry University, Beijing, China, 2016. [Google Scholar]
- Bao, S.D. Soil Agro-Chemistrical Analysis; China Agriculture Press: Beijing, China, 2007. [Google Scholar]
- Lu, R.K. Soil Agrochemical Analysis Method; Agricultural Science and Technology Press: Beijing, China, 2000. [Google Scholar]
- Bertozzi, J.; Andrade, D.S.; Oliveira, C.C.; Bala, A.; Caviglione, J.H. Microwave-assisted biocidal extraction is an alternative method to measure microbial biomass of carbon from cultivated and non-cultivated soils. Braz. J. Microbiol. 2020, 51, 255–263. [Google Scholar] [CrossRef]
- Guan, S.J. Study on the application effect of soil urease inhibitor. J. Soil Bull. 1985, 5, 232–234. [Google Scholar] [CrossRef]
- Zhu, L.X.; Cao, M.M.; Sang, C.C.; Chen, R.B.; Xu, S.W.; Li, L.L.; Liu, T.X. Effects of Bio-Fertilizer Partially Substituting Chemical Fertilizer on Soil Fertility and Enzyme Activity in Maize Field. J. Sichuan Agric. Univ. 2022, 1–12. Available online: http://kns.cnki.net/kcms/detail/51.1281.S.20220114.1841.002.html (accessed on 1 February 2022).
- Zhang, J.E.; Liu, W.G.; Hu, G. The relationship between quantity index of soil microorganisms and soil fertility of different land-use systems. J. Soil Environ. Sci. 2002, 2, 140–143. [Google Scholar]
- Sun, Q.Y.; Tan, H.Y.; Chi, M.F.; Wu, D.N.; Zhang, X.W.; Jia, X.; Zhang, L.Y.; Jia, Z.K. Effects of natural regeneration on soil fertility and soil enzyme activities in Pinus tabuliformis plantations after clearcutting. J. Beijing For. Univ. 2019, 41, 24–34. [Google Scholar] [CrossRef]
- Chen, P.; Zhao, B.; Yang, L.; Zhao, X.H.; Zhang, C.Y.; Yan, Z.C. Effects of earthworm and litter application on soil nutrients and soil microbial biomass and activities in Pinus tabuliformis plantation. J. Beijing For. Univ. 2018, 40, 63–71. [Google Scholar] [CrossRef]
- Tian, H.Q.; Chen, G.S.; Zhang, C.; Melillo, J.M.; Hall, C.A.S. Pattern and variation of C: N:P ratios in China’s soils: A synthesis of observational data. Biogeochemistry 2010, 98, 139–151. [Google Scholar] [CrossRef]
- Zheng, Y.L.; Wang, H.Y.; Xie, Y.L.; Li, X.; Qin, Q.Q.; Yang, D.D. Effect of tree species on soil fertility quality in plain afforestation area, Beijing. J. Sci. Soil Water Conserv. 2018, 16, 89–98. [Google Scholar] [CrossRef]
- Wang, K.; Qi, Y.T.; Liu, J.H.; Jiao, X.L.; Liu, H.B. Carbon, nitrogen and phosphorus stoichiometric characteristics of plants, leaf litter and soils in Pinus tabuliformis and Ulmus pumila plantations. Chin. J. Ecol. 2022, 1–9. [Google Scholar] [CrossRef]
- Chen, G.S.; Zeng, D.H.; Chen, F.S. Concentrations of foliar and surface soil in nutrients Pinus spp. plantations in relation to species and stand age in Zhanggutai sandy land, northeast China. J. For. Res. 2004, 15, 11–18. [Google Scholar]
- Wang, K.; Zhang, R.S.; Song, L.N.; Yan, T.; Na, E. Comparison of C:N:P stoichiometry in the plant-litter-oil system between poplar and elm plantations in the Horqin Sandy Land, China. Front. Plant Sci. 2021, 12, 655517. [Google Scholar] [CrossRef]
- Taylor, L.A.; Arthur, M.A.; Yanai, R.D. Forest floor microbial biomass across a northern hardwood successional sequence. Soil Biol. Biochem. 1998, 31, 431–439. [Google Scholar] [CrossRef]
- Fan, Y.Y.; Li, Y.; Li, Q.D. Microbe, Enzymatic Activity and Nutrient Contents in Different Stand Ages of Pinus tabuliformis. J. Soil Water Conserv. Res. 2019, 26, 58–64. [Google Scholar] [CrossRef]
- Le, T.H. Impact of Chinese Pine Plantation on Soil Enzyme Activities and Microorganism in the Loess Plateau. Master’s Thesis, Northwest University of Agriculture and Forestry Science and Technology, Shaanxi, China, 2017. [Google Scholar]
- Bueis, T.; Turrión, M.B.; Bravo, F.; Pando, V.; Muscolo, A. Factors determining enzyme activities in soils under Pinus halepensis and Pinus sylvestris plantations in Spain: A basis for establishing sustainable forest management strategies. Ann. For. Sci. 2018, 75, 34. [Google Scholar] [CrossRef] [Green Version]
- Wieser, G.; Grams, T.E.E.; Matyssek, R.; Oberhuber, W.; Gruber, A. Soil warming increased whole-tree water use of Pinus cembra at the treeline in the Central Tyrolean Alps. Tree Physiol. 2015, 35, 279–288. [Google Scholar] [CrossRef] [Green Version]
- Cheng, R.M.; Xiao, W.F.; Wang, X.R.; Feng, X.H.; Wang, R.L. Soil nutrient characteristics in different vegetation successional stages of Three Gorges Reservoir area. Sci. Silvae Sin. 2010, 46, 1–6. [Google Scholar]
- Geng, Y.Q.; Yu, X.X.; Yue, Y.J.; Niu, L.L. Variation of forest soil nutrient content in mountainous areas, Beijing. Sci. Silvae Sin. 2010, 46, 169–175. [Google Scholar]
- Sheng, S.W.; Zhang, D.D.; Wang, M.G.; Wang, X.D. Effects of combined application of wood vinegar acidified biochar and nitrogen on active nitrogen and ammonia volatilization in saline Soil. J. Environ. Sci. 2022, 43, 5. [Google Scholar] [CrossRef]
- Yuan, F.; Li, K.Y.; Yang, H.; Deng, C.J.; Liang, H.; Song, L.H. Effects of Biochar Application on Yellow Soil Nutrients and Enzyme Activities. J. Environ. Sci. 2022, 1–11. [Google Scholar] [CrossRef]
- Wang, M.Q.; Liu, Y.S.; Huang, Y.L.; Zhao, Y.Y.; Li, Z.X.; Han, Y.H. Research progress on effects of straw incorporation on soil micro-ecological environment. J. Microbiol. China 2022, 1–10. [Google Scholar] [CrossRef]
- Wang, F.J.; Qin, S.L.; Zhang, H.Y.; Liu, N. Characteristics of Soil Enzyme Activity and Microbial Quantity of Different Forest Types. Shaanxi J. Agric. Sci. 2021, 67, 75–80, 111. [Google Scholar]
- Sun, X.S.; Feng, H.S.; Wan, S.B.; Zuo, X.Q. Changes of Main Microbial Strains and Enzymes Activities in Peanut Continuous Cropping Soil and Their Interactions. Acta Agron. Sin. 2001, 5, 617–621. [Google Scholar]
- Yin, Y.N.; Yang, C.; Tang, J.G.; Gu, J.; Li, H.C.; Duan, M.L.; Wang, X.C.; Chen, R. Bamboo charcoal enhances cellulase and urease activities during chicken manure composting: Roles of the bacterial community and metabolic functions. J. Environ. Sci. 2021, 108, 84–95. [Google Scholar] [CrossRef]
- Li, H.L.; Zhou, C.L. Comprehensive evaluation of ecological benefits of six typical stand types along with the Dam Area. J. Hebei For. Sci. Technol. 2021, 2, 13–17. [Google Scholar] [CrossRef]
- Cheng, J.W. Short Term Effects of Different Management Models on Forest Stand Growth. Master’s Thesis, Inner Mongolia Agricultural University, Inner Mongolia, China, 2021. [Google Scholar] [CrossRef]


Publisher’s Note: MDPI stays neutral with regard to jurisdictional claims in published maps and institutional affiliations. |
© 2022 by the authors. Licensee MDPI, Basel, Switzerland. This article is an open access article distributed under the terms and conditions of the Creative Commons Attribution (CC BY) license (https://creativecommons.org/licenses/by/4.0/).