Article

Quality Analysis and Comprehensive Evaluation of Fruits from Different Cultivars of Pecan (Carya illinoinensis (Wangenheim) K. Koch)

1
Research Institute of Subtropical Forestry, Chinese Academy of Forestry, Fuyang, Hangzhou 311400, China
2
College of Resources and Environment, Southwest University, Beibei, Chongqing 400715, China
*
Author to whom correspondence should be addressed.
Forests 2022, 13(5), 746; https://doi.org/10.3390/f13050746
Submission received: 10 March 2022 / Revised: 6 May 2022 / Accepted: 9 May 2022 / Published: 11 May 2022
(This article belongs to the Section Genetics and Molecular Biology)

Abstract

:
A comprehensive method for evaluating kernel quality was established by estimating in detail the kernel quality of 27 pecan cultivars introduced into China and by exploring the major trait differences among the different cultivars of pecan. The contents of crude fat, crude protein, soluble sugar, and tannin; the fatty acid composition; the amino acid composition; and the mineral element composition of 27 pecan cultivars were analyzed and tested using the national standards for principal component analysis (PCA), and orthogonal partial least-squares discriminant analysis (OPLS-DA) was used to comprehensively evaluate the 34 characteristic indicators. The fatty acids in the kernel were dominated by unsaturated fats, with oleic acid having the highest content relative to linoleic acid; the amino acid composition was dominated by medicinal amino acids; and potassium, magnesium, and calcium were the predominant mineral elements. Systematic cluster analysis revealed that the 27 pecan cultivars could be classified into three categories (relatively optimal, general, and poorest kernel quality) and 21 indexes, including oleic, linoleic, linolenic, crude fat, soluble sugars, aspartic acid, and threonine, served as indexes of the differences among the 27 tested cultivars. Combined with principal component analysis and stepwise regression analysis, a kernel quality evaluation model was established and verified, and reliable evaluation results were obtained. In addition, Nos. 9, 65, 66, 72, 8, and 21, which had the best quality, were further ranked using the probability ranking method within the third category of optimal quality cultivars. There were obvious differences in kernel characteristics among the different cultivars of pecan. Six cultivars with potential to be developed into excellent cultivars were preliminarily screened out. It was found that the organic combination of cluster analysis, principal component analysis, and orthogonal partial least-squares discriminant analysis can provide a reliable method for the quality evaluation of pecans.

1. Introduction

Carya illinoinensis is a large deciduous tree belonging to Carya Nutt. of the Juglandaceae family [1]. The pecan kernel tastes sweet without astringency. It is rich in 17 amino acids, including seven amino acids that are beneficial to human health. In addition, it is rich in vitamins such as B1 and B2, as well as other nutrients [2,3,4]. It is an excellent nutritional and healthy food. Pecans contain more than 65% pecan kernel oil, and unsaturated fatty acid accounts for more than 90% of pecan kernel oil, of which the content of oleic acid is as high as 68.5%–7.1% [5,6]. The oil quality is high, and pecan is a high-grade edible oil resource tree species. Pecan trees have a straight trunk, a beautiful symmetrical shape, and tough wood [7]. The pecan is a preferred tree species for fruit, wood, and landscaping. Pecan trees have strong adaptability and can be widely grown in subtropical areas below 1700 m above sea level in China [8]. The pecan was introduced into China at the end of the 19th century. In the early stages of the pecan industry, due to neglect in cultivar selection and allocation and afforestation with more seedlings, a large area of low-efficiency seedling forest remained [8]. Since the 1970s, China has successively introduced some superior cultivars of pecan from the United States, and regional experiments have been conducted in different parts of China. At present, a number of high-quality cultivars of pecan suitable for Chinese development are also being screened, with a planting area of nearly 66.667 hectares [9]. However, with the continuous improvement of consumer health awareness, higher requirements for pecan products have been put forward, along with large fruit, fresh food, and lightly processed products becoming more popular in the market. In this context, through the construction of a scientific and systematic system for the evaluation of pecan germplasm resources, the establishment of high-quality production groups by scientifically distributing superior cultivars to achieve industrial intensification development and ultimately the establishment of a regional public brand is needed to promote the sustainable development of the pecan industry in China [10].
Researchers have conducted many studies on the introduction and breeding of the pecan in China, but most of the evaluations of pecan fruit are still carried out using methods such as quantitative analysis, analysis of variance, and other basic data analysis tools [11,12,13], and the results of these analyses have great limitations. Moreover, the factors affecting the quality of pecan fruit are diverse and complex. Taking into account all the different types of quality indicators is the key to resolving fruit quality objectively and comprehensively. Chang [14] and others evaluated the amino acid composition and nutritional value of different cultivars of pecan fruits, with the help of the amino acid ratio coefficient method; however, judging fruit quality based only on the nutritional value of the protein is not comprehensive.
Principal component analysis (PCA) is an unsupervised dimensionality reduction method that can reduce the dimensionality of high-dimensional data on the premise of minimizing the loss of original data information. Currently, it is widely used in the quality classification of different pecan germplasms. According to eight shell characteristics, such as vertical and horizontal diameter, single fruit weight, and the relative contents of five fatty acids in the nuts, the quality of the shell fruit of four pecan cultivars was evaluated by Huang [15] et al. using principal component analysis. Liang [16] and others compared and evaluated the fruit quality of 16 pecan cultivars and 1 Hunan pecan cultivar using principal component cluster analysis according to seven nut traits, including kernel yield, diaphragm thickness, and the relative contents of two main nutrients and five fatty acids in the kernel. However, PCA is not sensitive to variables with small correlations and cannot completely eliminate the overlapping information associated with multiple correlations of variables. Therefore, the determination of the variable system greatly affects the accuracy of the final objective conclusion [17]. Thus, the supervised partial least-squares discriminant analysis (PLS-DA) method was introduced to effectively solve this problem. The orthogonal partial least-squares analysis (OPLS-DA) method combines the orthogonal signal and PLS-DA to screen the main indexes affecting pecan fruit quality. On the premise of predictable classification, combined with sample information, the discriminant model was established and verified [18]. This method has been widely used in Malus pumila Mill. [19], Hippophae rhamnoides L. [20], Lycium chinense Miller [21], and other cash crops
Therefore, to comprehensively evaluate the fruit difference characteristics among pecan cultivars and to screen for pecan cultivars suitable for the production of plant oil or fresh nuts, 27 pecan cultivars were selected for this experiment, and 34 characteristic indexes of those 27 cultivars were comprehensively evaluated using a combination of principal component analysis (PCA) and orthogonal partial least-squares discriminant analysis (OPLS-DA), thus providing a theoretical basis for the determination of pecan fruit quality and the establishment of a standard.

2. Materials and Methods

2.1. Plant Materials and Their Origins

The test materials were taken from a 14-year-old pecan cultivar test forest in the Dongfanghong Forest Farm, Jinhua City, Zhejiang Province. The test site is located in a hilly region with gentle sloping land, ordinary red soil, consistent site conditions, and general land fertility. A randomized block design was used in the experiment. There were three repeated plots, and five repeated plants were set for each cultivar in each plot. According to the current Chinese standard LT/T1941-2021, fruit samples were taken when 25% of the green fruit skin was cracked, 30 fruits were taken per plot for each cultivar, and all the fruits for the given cultivars were taken without repeated plots (for No. 13, all 21 fruits were collected). A total of 27 cultivars were tested, including Western, Mahan, Pawnee, No. 7, No. 8, No. 9, No. 11, Kanza, No. 13, No. 17, No. 20, No. 21, No. 22, No. 26, No. 28, No. 29, No. 30, Caddo, No. 35, No. 36, No. 42, No. 45, No. 48, No. 52, No. 65, No. 66, and No. 72.

2.2. Sample Determination

In the mature stage of the pecan fruit, 30 fruits were taken from each plot; the single fruit mass and the kernel mass of the green fruit was weighed with an electronic balance with an accuracy of 0.01, and the seed rate and kernel rate were calculated. Seed yield = single fruit mass of nut/single fruit mass of green fruit × 100%, kernel yield = kernel mass/single fruit mass of nut × 100%.

2.2.1. Crude Fat Content

Oil extraction of samples was performed according to the Soxhlet extraction method (GB 5009.6-2016). Approximately 2 g of pecan kernels was accurately weighed into the filter paper cylinder, and then the filter paper cylinder was put into the extraction cylinder of the Soxhlet extractor. The seed oil was extracted with petroleum ether (30–60 °C) in a Soxhlet for 8 h, and the solvent was removed with a rotary vacuum evaporator at 40 °C. Then, the residue was dried at 100 ± 5 °C for 1 h and cooled in the desiccator for 0.5 h before weighing. The drying procedure was repeated to achieve constant weight constant weight (the difference between the two weights was no more than 2 mg).

2.2.2. Crude Protein Content

Approximately 0.2 g (accurate to 0.0001 g) of pecan kernels was accurately weighed into the nitrogen determination tube, 10 mL sulfuric acid and 5 g copper sulfate and potassium sulfate catalyst were added, heat was set at 150–200 °C for 30–60 min, then it was raised to 400 °C and heated until the liquid was clear. The digestion solution was taken down for cooling, it was determined with the Kjeldahl nitrogen determinator (FOSS 8400, Hilleroed, Denmark), and the protein in it was accurately quantified with accurately calibrated hydrochloric acid standard solution as the titrant.

2.2.3. Soluble Sugar Content

Approximately 2 g (accurate to 0.01 g) of pecan kernels was accurately weighed into a 50-mL colorimetric tube, boiled in boiling water for 10 min, and 15% (ω = 15%) of potassium ferrocyanide and 30% (ω = 30%) 1 mL of zinc sulfate were added after cooling, respectively. These were shaken well, the volume fixed, and the filtrate filtered for standby. An appropriate amount of filtrate was put into a 25 mL colorimetric tube, 1 mL of hydrochloric acid (1 mol/L) was added, and it was boiled in a boiling water bath for 10 min. After cooling, 1–2 drops of phenolphthalein indicator was added, it was neutralized with about 0.5 mol/L of sodium hydroxide solution, and the volume was fixed. An appropriate amount of solution was taken and titrated with copper reduction iodometry. Titration process: glucose was taken as the standard sample, a standard curve of 100–500 mg/L was prepared, and 5 mL to 100 mL conical flask of standard solution was taken. An amount of5 mL of copper reagent was added, and a small funnel was covered and heated in a boiling water bath for 15 min. After taking it out, it was immediately put into cold water to cool to 25–30 °C, 2 mL of sulfuric acid + oxalic acid mixture was added, and starch was used as an indicator and titrate with a 0.1 mol/L sodium thiosulfate solution until the blue disappeared, which was the end point. The titration process of the sample solution was consistent with that of the standard sample, and the content of total soluble sugar was quantified by an external standard method.

2.2.4. Tannin Content

Approximately 0.3–0.5 g of pecan kernels was accurately weighed into a 50-mL plastic centrifuge tube, 40 mL of water was added, it was extracted in a boiling water bath for 1 h, and cooled to a constant volume of 50 mL. An appropriate amount of extract was taken and centrifuged for 10,000 revolutions, and an appropriate amount of supernatant was taken and determined by the Folin Dennis method. Colorimetric process: Gallic acid was taken as the standard sample, and the standard curve of 1–5 mg/L was prepared. An amount of 1 mL of standard sample was taken, and 5 mL of water, 1 mL of Folin Dennis reagent, and 3 mL of sodium carbonate solution (75 g/L) were added. It was placed for 2 h, and the color was compared at 765 nm (the color comparison process of the sample was consistent with that of the standard sample). The content of tannin was determined quantitatively by the external standard method.

2.2.5. Fatty Acid Compositions

Soxhlet was employed to extract pecan oil samples. Fatty acid methyl esters (FAME) from oil samples were obtained by alkaline treatment (2.0 M KOH in methanol). The FAMEs were analyzed using a 7890A gas chromatography equipped with a flame ionization detector (Agilent Technologies, Santa Clara, CA, USA). The GC analysis was carried out using an HP-INNOWAX fused silica capillary column (30 m × 0.25 mm × 0.25 µm). The detailed operation conditions were as follows: He as the carrier gas, the injector temperature at 220 °C, split ratio of 1:100, and detector temperature of 275 °C. The column was held for 1 min at 140 °C and then programmed at 4 °C/min to 250 °C. The normalization method was used to quantify the samples.

2.2.6. Composition of Amino Acids

Approximately 0.1–0.2 g of pecan kernels was accurately weighed into the hydrolysis tube. An amount of 10 mL of hydrochloric acid (6 mol/L) was added and sealed after filling it with nitrogen. Hydrolysis was at constant temperature for 24 h in a 105-°C oven. It was taken out and cooled, and all the liquid in the hydrolysis tube was washed into a 25-mL volumetric flask for constant volume. An appropriate amount of liquid from the volumetric flask for filtration and 1 mL of filtrate were taken in a 50 mL beaker. It was evaporated in a boiling water bath, 2 mL of water was added to dissolve it, and it was passed through a 0.22 water system membrane. Hitachi l-8900 amino acid automatic analyzer (Hitachi High-Tech GLOBAL, Tokyo, Japan) was used for the determination of amino acid content. Chromatographic conditions: gradient elution, separation column temperature of 57 °C, reaction column temperature of 135 °C, buffer flow rate of 0.35 mL/min, and ninhydrin flow rate of 0.35 mL/min; channel 1: detection wavelength of 570 nm, channel 2: detection wavelength of 440 nm, injection volume of 20 µL. The content of amino acids was determined quantitatively by the external standard method.

2.2.7. Metallic Elements

Approximately 0.2 g (accurate to 0.0001 g) of pecan kernels was accurately weighed into the polytetrafluoroethylene digestion tube, 3 mL of nitric acid and 2 mL of hydrogen peroxide were added, and it was placed on the acid oven. the digestion tube was sealed at 150 °C, and it was put into the microwave digester. The microwave digestion procedure is shown in Table 1. After digestion and cooling, it was washed with a small amount of purified water for many times to 25 mL, and the sample was made blank at the same time. The metal elements in the sample digestion solution were determined by an inductively coupled plasma mass spectrometer (nexion 300D, PerkinElmer Inc., Wellesley, MA, USA) and an inductively coupled plasma spectrometer (thermofisher icap7400, Onrion LLC, Bergenfield, NJ, USA), and the elements were accurately quantified by multi-element mixed standard solution.

2.3. Data Process

Excel 2019 was used to interpret the test data and to analyze the variance, and a radar map was drawn of the amino acid composition of the seed kernels. The data were made dimensionless using the (analysis/descriptive statistics/description) process in SPSS 19.0, the dimensionless data were systematically clustered using the (analysis/classification/system clustering) process, and the OPLS-DA model was stepwise regressed and verified using the (dimensionality reduction/factor) process factor analysis. OPLS-DA analysis was carried out using the SIMCA 14.0 and R software “simpls” package.

3. Results

3.1. Analysis of the Principal Components of Pecan Kernels

An examination of the main constituents of the tested pecan kernels showed that there were obvious differences in crude fat, crude protein, soluble sugars, and tannin contents among the 27 cultivars, as shown in Table 2. The crude fat content ranged from 53.78% to 69.70%, the crude protein content ranged from 6.55% to 9.57%, the soluble sugar contents ranged from 2.63% to 4.83%, and the tannin contents ranged from 3.47% to 8.38%. The coefficients of variation for the main components of the kernels ranged from 5.72% to 20.59%, with the largest variation being for the tannin content, which was 20.59%. It was found from the analysis of variability that there were some differences in fruit traits among different cultivars; as the standing conditions, management, and year of cultivation were the same in each of the tested cultivars, the diversity in trait performance among the cultivars was presumed to stem from genetic differences. The greater the magnitude of variation in a trait among cultivars, the higher the efficiency of selection against that trait.

3.1.1. Fatty Acid Composition Analysis

The contents of seven fatty acids in the kernels of 27 cultivars were examined, with the results shown in Table 3. Pecan oil contained the highest amount of oleic acid (C18:1) at 62.50% to 73.97%, followed by linoleic acid (C18:2) at 17.17% to 27.67%, palmitic acid (C16:0) at 3.73% to 6.30%, stearic acid (C18:0) at 1.93% to 2.95%, linolenic acid (C18:3) at 0.87% to 1.60%, cis-11-eicosenoic acid (C20:1) content at 0.20% to 0.30%, and arachidic acid (C20:0) at 0.05% to 0.20%. The largest variation was observed for arachidic acid with a coefficient of variation of 23.57%, followed by linolenic acid with a coefficient of variation of 16.59%; oleic acid had the smallest variation at 5.05%. Thus, it can be concluded that there are obvious differences in the contents of each fatty acid in the kernels of different cultivars.

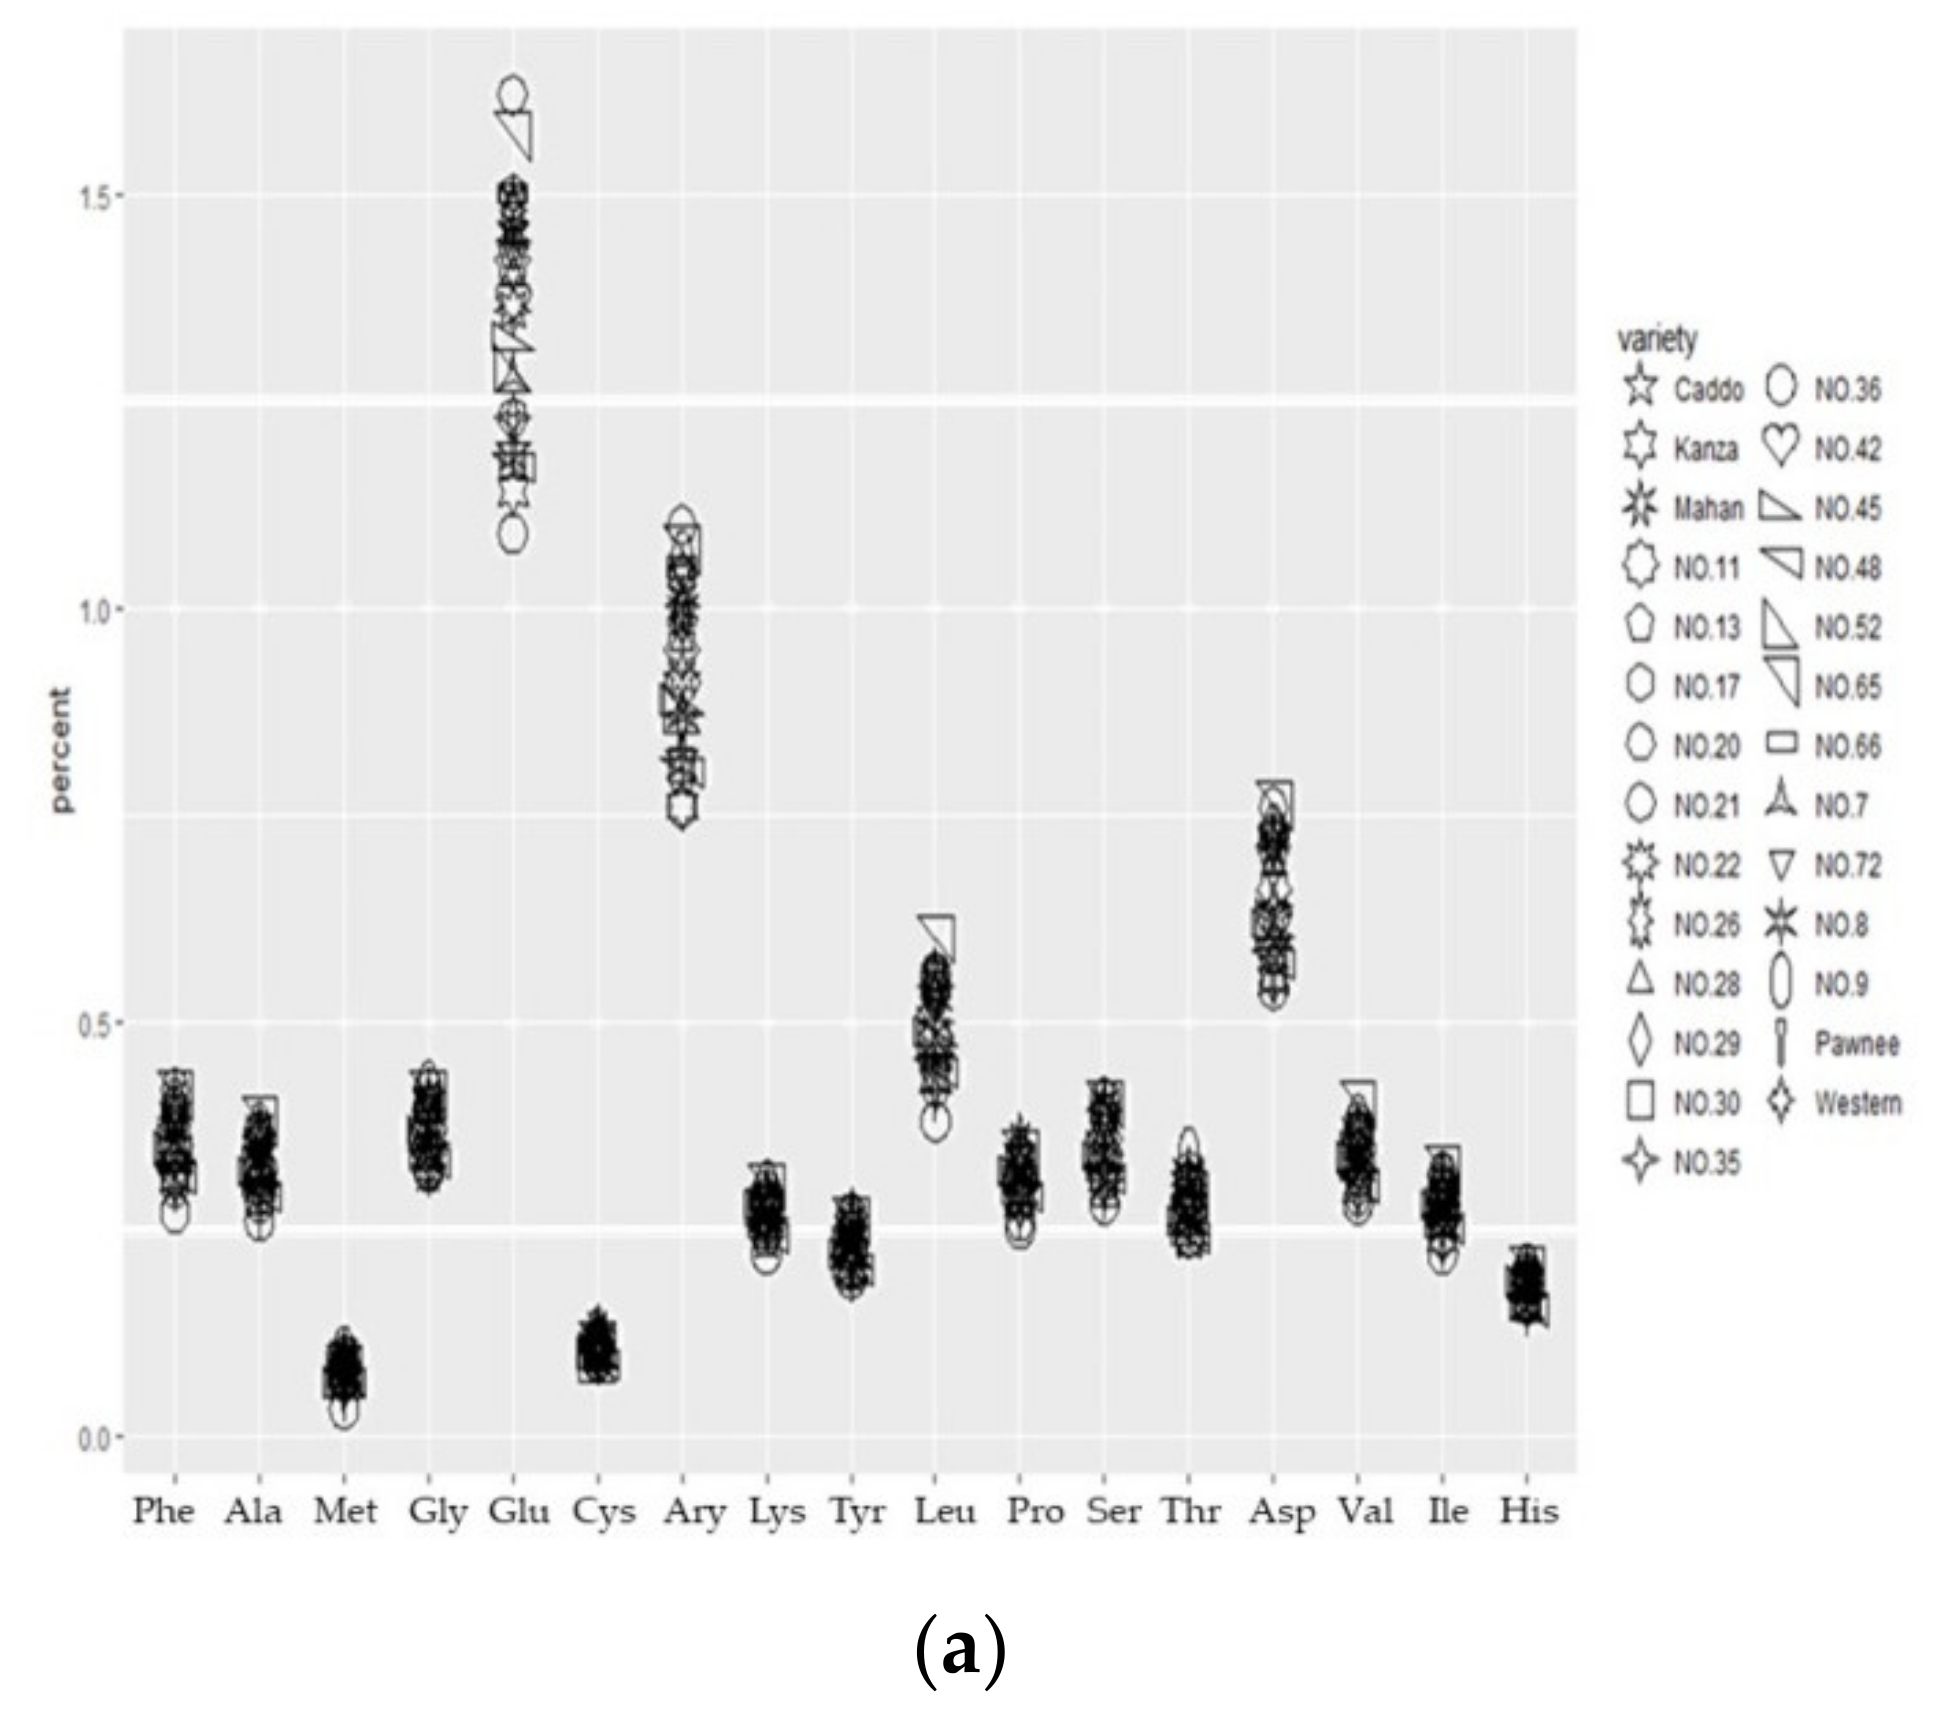
3.1.2. Amino Acid Composition Analysis

The contents of each amino acid in the kernels of various cultivars of pecan are presented in Figure 1a, and the ratios of essential amino acids (E), medicinal amino acids (M), sweet amino acids (S), umami amino acids (F), and bitter amino acids (B) to total amino acids (T) are presented in Figure 1b. Pecan kernels are rich in a cultivar of amino acids, with 17 measured amino acid components. Among the fruit kernels of the 27 cultivars tested in the present study, the highest content was of glutamic acid at 1.09~1.62%, followed by arginine content at 0.76~1.10%, aspartic acid content at 0.54~0.76%, leucine content at 0.38~0.60%, glycine content at 0.32~0.42%, phenylalanine content at 0.27~0.42%, serine content at 0.27~0.41%, valine content at 0.28~0.41%, and alanine content at 0.26~0.38%. The proline content ranged from 0.25% to 0.35%, threonine from 0.24% to 0.34%, isoleucine from 0.22% to 0.32%, lysine from 0.22% to 0.30%, tyrosine from 0.19% to 0.27%, histidine from 0.15% to 0.20%, cystine from 0.09% to 0.12%, and methionine from 0.03% to 0.10%. The coefficients of variation of the 17 amino acids in the fruit kernels of the 27 cultivars tested ranged from 7.64% to 19.32%, with methionine having the largest coefficient of variation at 19.32%, followed by leucine at 10.94%, and lysine having the smallest coefficient of variation at 7.64%, thus making it clear that the contents of the 17 amino acids in the fruit kernels of different cultivars varied significantly.
Among the 17 amino acid fractions, threonine, valine, methionine, isoleucine, leucine, phenylalanine, and lysine were essential amino acids; aspartate, glutamate, glycine, methionine, isoleucine, leucine, phenylalanine, lysine, and arginine were medicinal amino acids; threonine, serine, glycine alanine, and lysine were sweet amino acids; aspartic acid, glutamic acid, alanine, tyrosine, and phenylalanine were umami amino acids; and valine, cystine, methionine, isoleucine, leucine, histidine, arginine, and proline were bitter amino acids. A wide E/T ratio range (between the contents of the seven essential amino acids and the total amount of amino acids) was found in the fruits of the 27 pecan cultivars, ranging from 29.41% to 31.29%; the M/T ratio (between the nine medicinal amino acids and total amino acids) ranged from 68.29% to 69.91%; the S/T ratio (between the five sweet amino acids and total amino acids) ranged from 22.53% to 24.47%; the F/T ratio (between the five acidic umami amino acids and total amino acids) ranged from 41.41% to 42.95%; and the ratio between the seven bitter amino acids and total amino acids ranged from 33.85% to 34.97%.

3.1.3. Mineral Element Analysis

As shown in Table 4, eight minerals, including potassium (K), magnesium (Mg), calcium (Ca), zinc (Zn), copper (Cu), manganese (Mn), iron (Fe), and sodium (Na), were present in the kernels of the 27 pecan cultivars (according to the mean values of the contents of the mineral elements from high to low levels in the kernels of the tested cultivars), with potassium, magnesium, and calcium as the predominant elements (more than 0.1% of the dry weight of the samples). In the pecan kernels, the potassium content was 367.36~457.87 mg/100 g, the magnesium content was 69.62~98.14% mg/100 g, the calcium content was 60.06~114.83 mg/100 g, the zinc content was 37.00~47.33 mg/kg, the copper content was 4.50~10.40 mg/kg, the manganese content was 3.06~8.96 mg/100 g, the iron content was 0.76~1.44 mg/100 g, and the sodium content was 0.08~0.14 mg/100 g. The variation magnitudes of the eight mineral elements in the fruit kernels of the different cultivars were different, with the largest variation being for manganese, which had a coefficient of variation of 25.19%, followed by copper, which had a coefficient of variation of 19.88%; the least variation was observed for potassium, which had a coefficient of variation of 5.35%, indicating that there were obvious differences among the eight mineral elements in the fruit kernels of the tested cultivars.

3.2. Cluster Analysis and Differential Characteristic Index Screening of Pecan Fruit

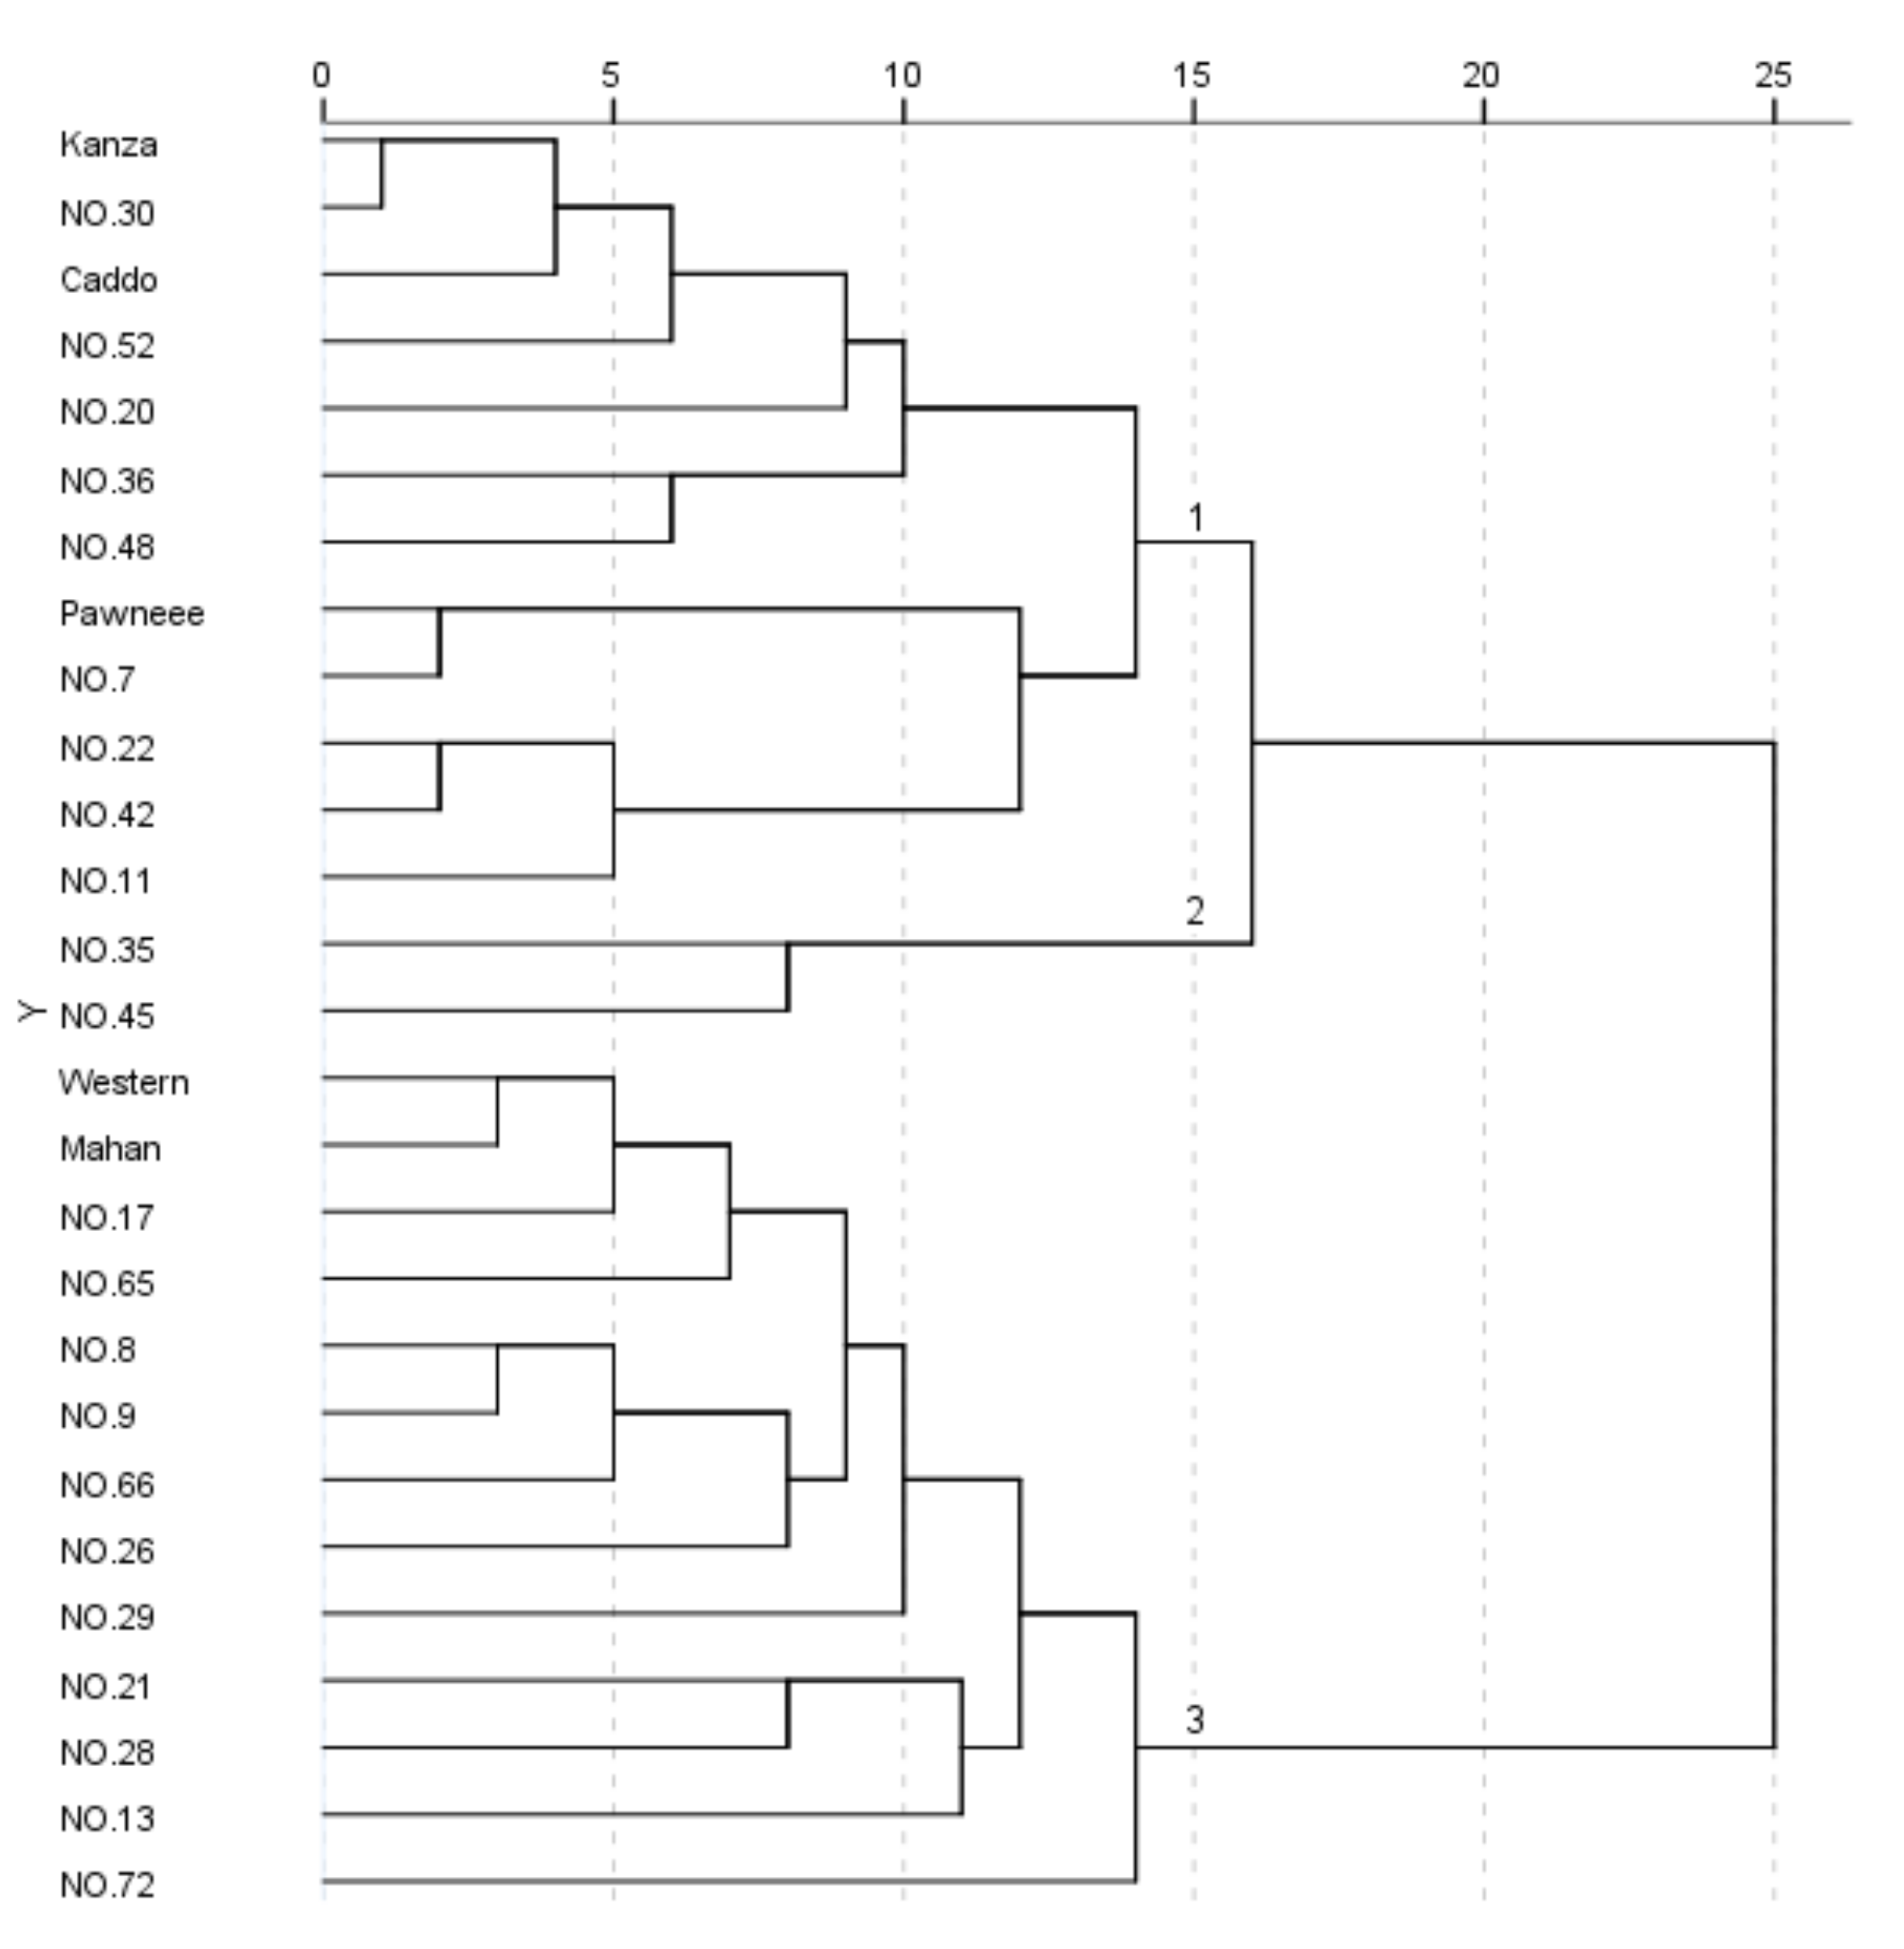
3.2.1. Cluster Analysis of Pecan Fruit

A total of 34 indexes, including five major fatty acids (relative content maxima greater than 1% in the kernels of 27 cultivars), eight mineral elements, five major components, and seventeen major amino acid components (relative content maxima greater than 0.1% in the kernels of 27 cultivars) in the fruit were selected, as well as the following categories: P1 (palmitic acid), P2 (stearic acid), P3 (oleic acid), P4 (linoleic acid), P5 (linolenic acid), P6 (potassium), P7 (calcium), P8 (sodium), P9 (magnesium), P10 (zinc), P11 (manganese), P12 (iron), P13 (copper), P14 (crude fat), P15 (crude protein), P16 (soluble sugar), P17 (tannin), P18 (aspartic acid), P19 (threonine), P20 (serine), P21 (glutamic acid), P22 (glycine), P23 (alanine), P24 (valine), P25 (cystine), P26 (methionine), P27 (isoleucine), P28 (leucine), P29 (tyrosine), P30 (phenylalanine), P31 (lysine), P32 (histidine), P33 (arginine), and P34 (proline). To remove the impact of different dimensions and orders of magnitude, the data of the 34 indexes were made dimensionless via processing using SPSS software, and an individual case analysis was performed using systematic clustering. The results, presented in Figure 2, show that when the category spacing was 15, the 27 cultivars of pecan fruits were classified into three classes: category 1 aggregated Nos. 5, 7, 11, 20, 22, 30, 34, 36, 42, 48, and 52 with a total of 12 cultivars; category 2 clustered 2 cultivars, No. 35 and No. 45; and category 3 clustered 13 cultivars with Western, Mahan, and Nos. 8, 9, 13, 17, 21, 26, 28, 29, 65, 66, and 72.

3.2.2. Screening of Differential Trait Indexes in Different Cultivars of Pecan Fruits

The tested cultivars could be clearly divided into three categories through cluster analysis. In order to further explore the different characteristic indexes of the fruits of the three groups and to screen them, a supervised pattern recognition method, orthogonal partial least-squares discriminant analysis (OPLS-DA), was introduced to extract the classification information of each group. The 34 indexes selected (listed above) were used as the x variables, and the 27 cultivars were used as the y variables for the OPLS-DA analysis. It can be seen from the scores in Figure 3a that there were no outlier sample points in the 27 pecan fruit samples and that three groups of classification could be clearly distinguished. It can also be seen that R2(x) = 0.714. The closer the value of R2(x) is to 1, the more stable the model is, while the larger R2(y) is, the stronger the interpretation ability of the model; R2(y) = 0.780, indicating that the model explained 78.0% of the original data, and Q2 = 0.525, Q2 > 0.5, indicating that the model had a strong prediction ability. Figure 3b shows the scatter diagram of the R2(y) and Q2(y) values of the actual and simulated models after random arrangement. The models R2(y) and Q2(y) showed less scatter than the real value (horizontal line), indicating that there was no overfitting phenomenon in the OPLS-DA model, which can be used for discriminant analysis of the respective categories. Figure 3c shows the two-dimensional load diagram obtained using OPLS-DA analysis, reflecting the influence of various variables on the distribution of pecan fruits of different cultivars on the score map. The farther away from the high-density area, the greater the influence of a variable on fruit classification. Figure 3d shows the score of variable importance for the project (VIP). It can be seen from the figure that the VIP values of 21 indicators were greater than 1. According to the VIP values, these were P28 (leucine), P18 (aspartic acid), P20 (serine), P23 (alanine), P29 (tyrosine), P30 (phenylalanine), P24 (valine), P33 (arginine), P22 (glycine), P27 (isoleucine), P3 (oleic acid), P4 (linoleic acid), P34 (proline), P21 (glutamate), P11 (manganese), P9 (iron), P32 (histidine), P26 (methionine), P31 (lysine), P19 (threonine), and P5 (linolenic acid).

3.3. Evaluation of Economic Traits and Model Construction for Pecan Fruits from Different Cultivars

The selected amino acids P28 (leucine), P18 (aspartic acid), P20 (serine), P23 (alanine), P29 (tyrosine), P30 (phenylalanine), P24 (valine), P33 (arginine), P22 (glycine), P27 (isoleucine), P3 (oleic acid), P4 (linoleic acid), P34 (proline), P21 (glutamic acid), P11 (manganese), P9 (iron), P32 (histidine), P26 (methionine), P31 (lysine), P19 (threonine), and P5 (linolenic acid) (a total of 21 indexes with VIP values greater than 1) were used to discriminate the gradation of pecan nuts according to traditional criteria. In addition, three indexes with high market approval were added, namely P14 (crude fat), P15 (crude protein), and P16 (soluble sugars), which together constituted a matrix of 27 × 24 with 27 cultivars. The factors were analyzed using SPSS and R. As shown in Table 5, the variance contribution ratios of the first four common factors, RC1, RC2, RC3, and RC4, were 60.88%, 17.82%, 5.84%, and 3.79%, respectively, and the cumulative contribution ratio reached 88.33%, which explained most of the original data information included in the 24 indicators.
The individual common factors selected as interpretation indexes (those for which the absolute load value in the rotating element matrix was greater than 0.8). The interpretation indexes of RC1 were P18 (aspartic acid), P19 (threonine), P20 (serine), P21 (glutamic acid), P22 (glycine), P23 (alanine), P24 (valine), P26 (methionine), P27 (isoleucine), P28 (leucine), P29 (tyrosine), P30 (phenylalanine), P31 (lysine), P32 (histidine), P33 (arginine), and P34 (proline) (a total of 16 indicators), which were called amino acid factors. The interpretation indexes of RC2 were P3 (oleic acid), P4 (linoleic acid), and P5 (linolenic acid) (a total of three indexes), which became fatty acid factors. The explanatory index for RC3 was P14 (crude fat), which became a crude adipokine. The explanatory index of RC4 was P16 (soluble sugar), which was called the soluble sugar factor. The product of the common factor score (RC1, RC2, RC3) and the corresponding contribution ratio (E1, E2, E3) was RC* = k = 1 3 R C k E k . The comprehensive evaluation model RC* = 0.6088RC1 + 0.1782RC2 + 0.0584RC3 + 0.0379RC4 was established, and the comprehensive evaluation scores (RC*) of the tested cultivars were obtained and sorted in turn, which allowed more intuitive judging of the superiority or inferiority of a certain cultivar (the results are shown in Table 6). Combined with the cluster analysis results (Figure 2), we found that category 3 (13 cultivars including Nos. 9, 65, and 66) had the highest scores and relatively optimal quality, category 2 (Nos. 45 and 35) had moderate scores and relatively median quality, while category 1 (12 cultivars including Nos. 7, 11, and 52) had lower scores and relatively poor quality.
The reliability of the above evaluation model was examined using stepwise regression analysis; the comprehensive evaluation score RC* of the reference cultivars was set as the dependent variable, and the raw data of 24 indicators, including four common factors in the model that were independent variables, resulted in a valid prediction model (R2 > 0.9) total of 11. In order to use both the prediction accuracy of the model and the easy accessibility of the indicators, the model RC** = −8.129 + 15.596 × P24 + 5.280 × P19 + 0.019 × P3 was selected, and RC**(R**) is the comprehensive score calculated from the original data.) was calculated. Combining the results of the correlation analysis, RC** was extremely significantly correlated (0.988**) with RC*, which indicated that the comprehensive evaluation of the model demonstrated its suitability to predict the economic traits of 27 different cultivars of pecan. P3 (oleic acid), P4 (linoleic acid), P5 (linolenic acid), P14 (crude fat), P16 (soluble sugar), P18 (aspartic acid), P19 (threonine), P20 (serine), P21 (glutamic acid), P22 (glycine), P23 (alanine), P24 (valine), P26 (methionine), P27 (isoleucine), P28 (leucine), P29 (tyrosine), P30 (phenylalanine), P31 (lysine), P32 (histidine), P33 (arginine), and P34 (proline) (a total of 21 indexes) could reflect the trait superiority of pecan fruits and the variation among the different cultivars.
Furthermore, the fractionated probability ( X ¯ − 1.2818S), ( X ¯ − 0.5246S), ( X ¯ + 0.5246S), ( X ¯ + 1.2818S) of these four nodes [22] and the combined factor score RC* were able to further grade the category 3 cultivars. The results in Table 7 show that one cultivar (No. 9) was ranked level 5, indicating “optimal”; five cultivars (Nos. 65, 66, 72, 8, 21) were ranked level 4, indicating “better”; four cultivars (Nos. 17, 26, 29 and Mahan) were ranked level 3, indicating “general”; one cultivar (Western) was ranked at level 2, indicating “poor”; two cultivars (No. 13 and No. 28) were ranked level 1, indicating “worst”.

4. Discussion

4.1. Differential Analysis of Nutritional Traits in Different Cultivars of Pecan Fruits

The obvious differences in the performance of the main characteristics among different cultivars are the material basis for cultivar breeding. An objective understanding of the quality differences between different cultivars of pecan is conducive to judging the impact of various characteristics on fruit quality, in order to establish a scientific and reasonable evaluation method for superior fruit. The results of the present study showed that the contents of the pecan kernel were mainly fat, protein, soluble sugar, and tannin, which accounted for 63.35%, 7.60%, 3.84%, and 0.63% of the kernel, respectively (average). According to the grading of fruit quality in China’s current pecan evaluation standard LT/T1941-2021, “super-grade” and “grade I” fruits are required to have a kernel with a crude fat content ≥65% and a protein content ≥70 mg/g. Among the 27 tested cultivars, No. 8, No. 9, Kazna, No. 13, No. 26, No. 28, No. 29, Caddo, No. 35, No. 36, and Western (a total of 11 cultivars) met these requirements, but it can be seen that an evaluation based only on the existing classification standards is not ideal.
The fatty acid composition of pecan oil is similar to that of high-grade edible oil from resource trees such as oil-tea camellia (Camellia oleifera Abel.) [23] and olive (Canarium album (Lour.) Rauesch.) [24], in which the highest component of fatty acid is oleic acid, followed by linoleic acid, consistent with previous studies [25,26]. As a monounsaturated fatty acid, oleic acid has the physiological effects of reducing low-density lipoprotein cholesterol and preventing arteriosclerosis [27]. As an essential polyunsaturated fatty acid, linoleic acid plays a prominent role in preventing cardiovascular diseases such as atherosclerosis and myocardial infarction [28]. However, there is a high content of linoleic acid in bulk edible oil; the content in general vegetable oils, such as in soybean oil [29], corn oil [30], sesame oil [31], etc., is approximately 35~55%. The human body’s demand for linoleic acid can be met through the daily diet, while an excessive intake of linoleic acid will increase blood viscosity and cause vasospasm. Therefore, reducing the content of linoleic acid is key to improving the health-related qualities of oil.
Linolenic acid is a functional polyunsaturated fatty acid. Its final metabolites, EPA and DHA, are important components of the nerve cell membrane. It has physiological effects such as improving memory and preventing cerebral thrombosis and diabetes [32,33]. At present, people’s intake of EPA and DHA mainly depends on expensive deep-sea fish oil. In this study, the linolenic acid content of pecan oil was found to be 0.87~1.60%, which is much higher than that of oil tea [34,35], and similar to that of olive oil [36]. Therefore, more attention should be paid to the pecan as a relatively cheap oil plant rich in linolenic acid. Chang [5] and others found that, in the fatty acid metabolism pathway of pecan fruit, there is a process of dehydrogenation and desaturation of oleic acid to linoleic acid. At the same time, linoleic acid is also a precursor of ω-6 long-chain polyunsaturated fatty acids, especially γ-linoleic acid. Therefore, in the future, we can try to regulate the fatty acid metabolism process of pecans by means of molecular genetics and other technical means, such as controlling the activity of desaturase, inhibiting the conversion of oleic acid to linoleic acid, or promoting the conversion of linoleic acid to linolenic acid, to improve the oil quality of the pecan.
At the same time, the amino acid composition and the content of kernel proteins in 27 pecan cultivars were investigated. The results showed that the pecan kernel contained 17 amino acids, including 7 essential amino acids, 9 medicinal amino acids, 5 sweet amino acids, 5 umami amino acids, and 7 bitter amino acids. The ratio of medicinal amino acids to total amino acids was the largest, in which the contents of glutamate and arginine were significantly higher than those of other medicinal amino acids, followed by aspartic acid. Glutamate is not an essential amino acid for the human body, but it can play a role in carbon and nitrogen processing in the body’s metabolic processes. It can also participate in brain tissue metabolism as a supplement for the nerve center and cerebral cortex, and it can accelerate the discharge of ammonia in brain tissue by promoting brain cell respiration [37,38]. Arginine is a conditionally essential amino acid that is not essential for adults. However, due to its slow synthesis in the human body, it also needs to be taken from food. Arginine has the effects of enhancing cellular immune function and improving cardiovascular diseases. Aspartic acid is also not an essential amino acid for the human body, but it plays an important role in enhancing liver function and preventing cardiovascular diseases [39]. Therefore, pecan protein is rich in a cultivar of medicinal amino acids and can be regarded as a high-quality protein resource in the development of healthy foods and a medically robust diet.
Pecan fruit contains a rich composition of mineral elements with a balanced ratio and can meet multiple intake requirements of the human body. Studies have shown that the average daily requirements for mineral elements for adults are 2000~2500 mg for potassium, 800 mg for calcium, 300~350 mg for magnesium, 10~15 mg for zinc, 3~9 mg for manganese, 10~18 mg for iron, and 2 mg for copper [40]. Based on the levels of mineral elements in the pecan fruit, adults can meet 5.40% of their daily potassium requirements, 2.95% of their daily calcium requirements, 7.44% of their daily magnesium requirements, 10.15% of their daily zinc requirements, 25.48% of their daily manganese requirements, 2.28% of their daily iron requirements, and 10.25% of their daily copper requirements by consuming 30 g of pecan kernels (about 4–5 kernels) per day; therefore, the pecan is a good food source for the human body to supplement mineral nutrition.
In summary, pecan kernels are rich in oils, proteins, and soluble sugars, as well as a cultivar of fatty acids, amino acids, and mineral elements, and they have high nutritional, health, and medicinal benefits with promising development potential. The obvious differences in nutritional traits among the different cultivars of pecan provide a wide scope for high-quality clonal breeding and thus provide a material basis for constructing high-yield and high-quality clonal stands.

4.2. Comprehensive Evaluation of Fruit Quality

After verifying the reliability of the OPLS-DA model and the absence of outliers and overfitting, the variable importance in projection (VIP) method was used to select the indicators and weight orders affecting the fruit quality of single pecan fruits, in the following order: P28 (leucine), P18 (aspartic acid), P20 (serine), P23 (alanine), P29 (tyrosine), P30 (phenylalanine), P24 (valine), P33 (arginine), P22 (glycine), P27 (isoleucine), P3 (oleic acid), P4 (linoleic acid), P34 (proline), P21 (glutamic acid), P11 (manganese), P9 (iron), P32 (histidine), P26 (methionine), P31 (lysine), P19 (threonine), and P5 (linolenic acid). From the examination data, P14 (crude fat), P15 (crude protein), and P16 (soluble sugars) were not used as differential indexes among the tested cultivars, but the utility of the variable system was improved by combination with the current grading standards of pecans in China from the perspective of a nut commodity. By applying the above 24 indicators through factor analysis, four common factors were extracted, and the cumulative variance contribution reached 88.33%, which reflected most of the original data information. The model was built according to the common factor score to the variance contribution ratio: RC* = 0.6088RC1 + 0.1782RC2 + 0.0584RC3 + 0.0379RC4, and the reliability of the model was verified using stepwise regression analysis. Combined with the previous cluster analysis results, category 3 cultivars (13 cultivars including No. 9, No. 65, and No. 66) had the highest scores and best comprehensive fruit quality. According to the comprehensive factor distribution, the amino acid factor (RC1) scores of the category 3 cultivars were all top ranked. The explanatory index of RC1 contained all the amino acids detected from the samples except cysteine. Cysteine only accounted for 1.52% (average value) of the total amino acids in the sample, so RC1 could largely reflect the total amino acids of the sample, and RC1 had the largest contribution to the variance of the combined factor in the factor analysis matrix (which was 60.88%), so the trait that contributed most positively to the combined score in this model was the total amino acids. Furthermore, quality grading of the cultivars in category 3 was carried out using the probability grading method, and a total of six cultivars in classes 5 and 4 (Nos. 9, 65, 66, 72, 8, and 21) were found to have superior relative fruit quality from among the tested accessions, with the potential to be developed into superior germplasm resources.
The complex array of traits affecting the fruit quality of pecans was evaluated via a combination of unsupervised factor analysis and supervised OPLS-DA with multivariate analysis; with the help of cluster analysis, probability grading, and other statistical analysis methods, the goal of an objective and comprehensive evaluation of the superiority and inferiority of fruit quality was achieved. This study involved the analytical evaluation of single-year fruits only and may continue on a preliminary basis for investigation of multi-year fruits using the OPLS-DA combined with factor analysis.

5. Conclusions

A comprehensive evaluation of 34 quality traits using cluster analysis, factor analysis, and OPLS-DA was applied in 27 pecan cultivars to select the main traits that determine fruit quality, and a comprehensive evaluation model for pecan fruit quality was developed and validated. There were obvious differences in crude fat, protein, soluble sugar, and tannin contents, along with fatty acid composition, amino acid composition, and mineral elements among the various pecan cultivars. Category 3 had the best fruit quality (Western, Mahan, Nos. 8, 9, 13, 17, 21, 26, 28, 29, 65, 66, and 72), category 2 had a middling fruit quality (Nos. 35 and 45), and category 1 had the poorest quality (Nos. 5, 7, 11, 20, 22, 30, 34, 36, 42, 48, and 52). Superiority ranking was further performed for category 3, and the best quality cultivars were Nos. 9, 65, 66, 72, 8, and 21, with the potential to be developed as superior cultivars. In this experiment, only one year’s fruits were evaluated and screened, and then the multi-year fruits could be selected on this basis. Guided by the market demand, the planting proportion, utilization, and development of preferred varieties can be increased.

Author Contributions

J.C.: conceptualization, methodology, investigation, writing—original draft preparation. S.W.: data curation, writing—original draft preparation. X.Y.: conceptualization, supervision, resources. K.W.: funding, investigation. H.R., S.Y.: data curation, writing—review and editing. M.H.: investigation. All authors have read and agreed to the published version of the manuscript.

Funding

This work was funded by the Fundamental Research Funds of Key R&D Plans of Zhejiang Province (2021C02038). Pecial Fund Project for Basic Scientific Research Business Expenses of Central Public Welfare Scientific Research Institutes of Chinese Academy of Forestry (CAFYBB2020SY014).

Institutional Review Board Statement

Not applicable.

Informed Consent Statement

Not applicable.

Data Availability Statement

The data underlying this article will be shared upon reasonable request to the corresponding author.

Acknowledgments

We thank Non-Timber Forest’s technical services team for establishing, maintaining, and assessing the experiment; Jun Chang and Shuiping Yang for their assistance in statistical analysis.

Conflicts of Interest

The authors declare no conflict of interest.

References

  1. Li, C.; Yao, X.H.; Wang, K.L.; Gu, X.R. A study on simplifying the indices of the clone fruit characters of Carya illinoinensis. Acta Agric. Univ. Jiangxiensis 2011, 33, 696–700. [Google Scholar]
  2. Li, C.; Yao, X.H.; Wang, K.L.; Fang, M.Y.; Gu, X.R.; Shao, W.Z. A comparative study on the fruit and nut characters of 12 pecan (Carya illinoemis) Clones and Their Yield. J. Southwest Univ. 2011, 33, 40–44. [Google Scholar]
  3. Chen, F.; Yao, X.H.; Wang, K.L.; Ren, H.D.; Chang, J. Comparative studies on fruit and nut characters of 33 pecan(Carya illinoemis) clones and their yields. J. Cent. South Univ. For. Technol. 2016, 36, 40–45. [Google Scholar]
  4. Chen, F.; Yao, X.H.; Teng, J.H.; Ren, H.D.; Wang, K.L.; Chang, J. Comparison of economic characters and quality of Carya illinoinensis clones. J. Chin. Cereals Oils Assoc. 2016, 31, 68–73. [Google Scholar]
  5. Chang, J.; Ren, H.D.; Yao, X.H.; Yang, S.P.; Wang, K.L. Analysis of dynamic changes of oil and mineral nutrients in pecan at the late stage of fruit development. For. Sci. Res. 2019, 32, 122–129. [Google Scholar]
  6. Yu, M.; Xu, H.H.; Wang, Z.j.; Si, J.P.; Zhang, A.L. Study on composition and antioxidant activity of Carya cathayensis oil. J. Chin. Cereals Oils Assoc. 2016, 31, 86–90. [Google Scholar]
  7. Zhou, W.J.; Li, J.; Liu, X. A comparative analysis of the economic characters of 30 pecan varieties in hunan province. Acta Agric. Univ. Jiangxiensis 2021, 43, 807–816. [Google Scholar]
  8. Yao, X.H.; Chang, J.; Wang, K.L. The Research Proceeding of Pecan in China. Science Press: Zhejiang, China, 2014; pp. 73–158. [Google Scholar]
  9. Chang, J.; Yao, X.H.; Shao, W.Z.; Chen, H.W.; Wang, K.L.; Chen, F. Effects of different rootstocks of Carya illinoemis on grafting survival rate and growth indexs. J. Cent. South Univ. For. Technol. 2016, 36, 56–60. [Google Scholar]
  10. Ma, C.G.; Clonal Forestry and Clonal Breeding. National Forest Genetics and breeding academic annual meeting of China forestry society one thousand nine hundred and eighty-six. 1986. Available online: http://www.cnki.com.cn/Article/CJFDTotal-HLKJ198603000.htm (accessed on 26 September 2021).
  11. Jiang, Y.; Wei, H.L.; Gao, C.H.; Wang, D.G.; Feng, N.K.; Li, R.; Liu, R.R.; Lv, F.D. Observation on flowering phenology and variety combination of Carya illinoinensis in low mountains and hills of Hunan Province. J. Nanjing For. Univ. 2021, 45, 53–62. [Google Scholar]
  12. Luo, Q.; Xi, X.L.; Zou, W.L.; Fan, Z.Y.; Xv, L.; Ye, C.; Zhang, Q.Q. Breeding of Carya illinoensis ‘barton’ variety. J. West China For. Sci. 2021, 50, 154–162. [Google Scholar]
  13. Bi, H.H.; Wang, Z.C.; Fu, S.L.; Zhang, Y.B.; Li, J. Effects of different measures on Carya illinois seedlings in South Anhui. Non-Wood For. Res. 2018, 36, 118–122. [Google Scholar]
  14. Chang, J.; Zhang, X.D.; Yao, X.H.; Yang, S.P.; Wang, K.L.; Ren, H.D. Amino acid composition and nutritional value evaluation of different varieties of Pecan (Carya illinoensis K. Koch). J. Southwest Univ. 2021, 43, 44–52. [Google Scholar]
  15. Huang, X.Y.; He, P.; Zhang, T.; Song, H.Y.; Zhen, S.F.; Qin, Z.S.; Wang, W.L. Observation and comprehensive evaluation of pecan fruit quality in Guangxi. Southern Agric. 2020, 14, 1–7. [Google Scholar]
  16. Liang, S.S.; LV, F.D.; Jiang, Y.; Li, J.A.; Wang, S.; Jiang, S.F.; Li, F.S. Principal component analysis and comprehensive evaluation of american pecan nuts. South China Fruits 2015, 44, 123–128. [Google Scholar]
  17. Guo, K.H. The limited role of PCA in overcoming multiple correlations of variables. Comput. Appl. 2007, 27, 2346–2348. [Google Scholar]
  18. Tian, T.; Wei, J.J.; Wen, J.H.; Zeng, X.L. Seasonal variability of aroma components of lingyun pekoe green tea. Food Sci. 2020, 41, 252–259. [Google Scholar]
  19. Zhou, B.B.; Zhang, Q.; Sun, J.; Li, X.L.; Wei, Q.P. Study and application of partial least squares regression on relationship between soil nutrient and fruit quality. Agric. Sci. Technol. 2016, 33, 106–112. [Google Scholar]
  20. Wu, X.Y.; Xie, Q.S.; Li, Q.Y.; Dong, P.Y.; Hai, Y.D.; Fei, Y.L.; Hui, X.L.; Chun, L. Study on quality evaluation of seabuckthorn(Hippophae rhamnoides L.)seed oil based on determination of 7 kinds of fatty acids content and chemometrics. J. Food Saf. Qual. 2021, 12, 8128–8135. [Google Scholar]
  21. Zhao, X.Q.; Guo, S.; Lu, Y.Y.; Zhang, F.; Yan, H.; Wang, H.Q.; Duan, J.A. Analysis of water-soluble nutrients in Lycium barbarum leaves and differences between different producing areas. China J. Chin. Mater. Med. 2021, 46, 2084–2093. [Google Scholar]
  22. Liu, M.J. Studies on the variations and probability gradings of major quantitative characters of Chinese jujube. Acta Hortic. Sin. 1996, 23, 105–109. [Google Scholar]
  23. Cheng, J.Y.; Li, L.; Zhou, X.H.; Luo, Z.J.; Tu, B.K. Compositions of fatty acids and its correlation among superior trees of Camellia oleifera Abel. For. Sci. Technol. Dev. 2010, 24, 41–43. [Google Scholar]
  24. Yan, H.Q.; Hou, C.J.; Ma, J.Y.; Deng, Y.; Wang, Q.; Jin, F. Phenotypic character and fatty acid composition and content of olive fruit in different varieties and maturity. China Oils Fats 2019, 44, 105–111. [Google Scholar]
  25. Venkatachalam, M.; Kshirsagar, H.H.; Seeram, N.P.; Heber, D.; Thompson, T.E.; Roux, K.H.; Sathe, S.K. Biochemical composition and immunological comparison of select pecan Carya illinoinensis (wangenh.) k. koch. cultivarsj. J. Agric. Food Chem. 2007, 55, 9899–9907. [Google Scholar] [CrossRef] [PubMed]
  26. Yu, C.L.; Wang, Z.J.; Xia, G.H.; Huang, J.Q.; Liu, L. Fat content and fatty acid composition of ten Carya illinoensis cultivars. J. Zhejiang A&F Univ. 2013, 30, 714–718. [Google Scholar]
  27. Wang, W.; Wei, L.P. Analysis of fatty acid compositions in prunus mira kernels from different growing areas in tibet. Food Sci. 2016, 37, 107–111. [Google Scholar]
  28. Zhang, C.; Zhang, H.; Liu, C.Y.; Xue, W.T.; Liu, R. Research progress of linoleic acid. J. Grain Oil 2010, 5, 18–21. [Google Scholar]
  29. Wang, J.; Li, Z.G.; Hu, W.; Qiao, H.F.; Mo, W.M.; Hu, B.X. Fatty acid analysis of soybean oil by GC—MS. J. Zhejiang Univ. Sci. Technol. 2003, 15, 16–18. [Google Scholar]
  30. Wu, M.X.; Wu, G.Y.; Han, Y.; Zhang, P.D. Comparative study on fatty acid composition of Six Edible vegetable oils and their biodiesel. China Grease 2003, 38, 65–67. [Google Scholar]
  31. Li, H.Y.; Deng, Z.Y.; Li, J.; Fan, Y.W.; Liu, R.; Xiong, H.; Xie, M.Y. Study on oxidative stability of vegetable oil with different fatty acid composition. Food Ind. Sci. Technol. 2010, 31, 173–175. [Google Scholar]
  32. Lee, J.Y.; Sohn, K.H.; Rhee, S.H.; Hwang, D. Saturated fatty acids, but not unsaturated fatty acids, induce the expression of cyclooxygenase-2 mediated through toll-like receptor 4. J. Biol. Chem. 2001, 276, 16683–16689. [Google Scholar] [CrossRef] [Green Version]
  33. Li, Z.W. Attention should be paid to the development and utilization of oil rich in linolenic acid. Mach. Cereals Oil Food Process. 2004, 9, 13–14. [Google Scholar]
  34. Xing, C.H.; Li, J.W.; Wang, X.G.; Jin, Q.Z. Determination of fatty acid composition and vitamin E concentration of Camellia oleifera seed oil by chromatography. J. Food Biotechnol. 2011, 30, 838–842. [Google Scholar]
  35. Xi, R.C.; Deng, X.M.; Gong, C.; Liu, S.; Gong, C.; Liu, S.; Ao, W.C. Studies on selecting and breeding of high linoleic acid content and high oil yield oiltea camellia clones. For Res. 2006, 19, 158. [Google Scholar]
  36. Zhu, W.Z.; Fan, J.R.; Peng, J.G.; Yang, H.B.; Yang, B.N.; He, M.B. Analysis of the oil content and its fatty acid composition of fruits for introduced olive cultivars in sichuan province. For. Sci. 2010, 46, 91–100. [Google Scholar]
  37. Zhang, T.Z. Nutrition, biological characteristics and development and utilization status of Carya cathayensis. Food Ferment. Ind. 2006, 32, 90–93. [Google Scholar]
  38. Yu, M.; Xu, H.H.; Wang, Z.J.; Si, J.P.; Zhang, A.L. Analysis of morphology and nutritional components of six Carya illinoinensis Varieties. J. Chin. Cereals Oils Assoc. 2013, 28, 74–77. [Google Scholar]
  39. Bauer, I.; Graessle, S.; Loidl, P.; Hohenstein, K.; Brosch, G. Novel insights into the functional role of three protein arginine methyltransferases in Aspergillus nidulans. Fungal Genet. Biol. 2010, 47, 551–561. [Google Scholar] [CrossRef] [PubMed]
  40. Li, X.M. Effects of mineral elements in tea on human health. China Tea 2002, 24, 30–31. [Google Scholar]
Figure 1. Percentage of each amino acid in total amino acid content (a) and different types of amino acids in total amino acid content (b) in pecan kernel (%).
Forests 13 00746 g001aForests 13 00746 g001b
Figure 2. Hierarchical cluster analysis of pecan fruits of different cultivars. The numbers 1, 2 and 3 in the figure when the squared Euclidean distance is 15, the tested pecan are divided into three categories.
Forests 13 00746 g002
Figure 3. Score chart of OPLS-DA (a), significance diagnostic diagram (b), loading diagram (c), and VIP value (d) in the pecan OPLS-DA score chart of the fruit quality components of pecans. The picture is generated by SIMCA software, “R2x[1]”, “R2x[2]” is the interpretation rate corresponding to principal components 1 and 2.
Forests 13 00746 g003
Table 1. Microwave digestion procedure.
StepTemperature (℃)Ramp Time (min) Hold Time (min)
113015 10
220010 20
Table 2. Chemical composition of the pecan kernels (dry sample).
CultivarCrude Fat (%)Crude Protein (%)Soluble Sugar (%)Tannin (×10−3 mg/kg)
Western65.50 ± 2.867.92 ± 0.853.47 ± 0.717.60 ± 0.34
Mahan61.19 ± 1.727.52 ± 0.793.46 ± 0.603.93 ± 2.12
Pawnee63.28 ± 4.327.24 ± 0.954.62 ± 0.755.57 ± 0.7
No. 761.09 ± 4.007.07 ± 0.404.83 ± 0.375.46 ± 0.54
No. 866.56 ± 1.188.13 ± 1.123.67 ± 1.307.27 ± 1.68
No. 965.54 ± 0.688.34 ± 0.943.73 ± 0.345.42 ± 3.54
No. 1162.59 ± 10.436.55 ± 1.324.57 ± 0.587.03 ± 1.21
Kanza65.56 ± 1.227.32 ± 0.594.29 ± 0.344.91 ± 0.09
No. 1760.22 ± 0.748.05 ± 0.594.16 ± 0.766.92 ± 0.32
No. 2062.48 ± 5.867.91 ± 1.693.80 ± 0.285.62 ± 0.43
No. 2162.28 ± 7.197.60 ± 1.174.11 ± 1.318.02 ± 1.26
No. 2253.78 ± 2.997.44 ± 0.804.59 ± 0.715.36 ± 0.81
No. 2669.70 ± 1.777.87 ± 0.242.63 ± 0.907.42 ± 1.61
No. 2867.33 ± 4.917.22 ± 0.743.81 ± 0.746.79 ± 1.65
No. 2965.08 ± 1.577.41 ± 1.284.42 ± 0.283.47 ± 1.68
No. 3063.99 ± 0.307.04 ± 0.363.93 ± 0.604.97 ± 0.49
Caddo68.78 ± 1.137.09 ± 0.612.90 ± 0.175.88 ± 0.47
No. 3565.12 ± 2.557.55 ± 0.222.81 ± 0.347.24 ± 0.53
No. 3665.80 ± 0.647.05 ± 0.684.07 ± 0.547.68 ± 1.16
No. 4256.08 ± 1.957.52 ± 0.943.68 ± 0.136.35 ± 0.90
No. 4562.47 ± 3.009.15 ± 1.714.09 ± 0.805.45 ± 1.02
No. 4864.23 ± 2.767.44 ± 1.084.01 ± 1.487.39 ± 1.85
No. 5261.75 ± 1.837.30 ± 0.564.11 ± 0.794.09 ± 2.01
No. 6562.80 ± 1.687.01 ± 1.383.25 ± 0.686.90 ± 0.51
No. 6660.92 ± 5.087.76 ± 0.273.17 ± 1.056.98 ± 2.30
No. 7257.99 ± 1.679.57 ± 1.333.83 ± 0.128.38 ± 0.15
No. 1368.427.093.657.59
Average63.35 ± 3.697.60 ± 0.653.84 ± 0.566.29 ± 1.32
CV%5.72 8.4014.38 20.59
Table 3. Fatty acid composition (%) of the pecan kernels.
CultivarPalmitic Acid C16:0Stearic Acid C18:0Oil Oleic Acid C18:1Linoleic Acid C18:2Linolenic Acid C18:3Arachidic Acid C20:0Cis-11-20c C20:1
Western5.65 ± 0.152.90 ± 0.1066.55 ± 0.9523.40 ± 1.101.20 ± 0.000.10 ± 0.000.20 ± 0.00
Mahan5.70 ± 0.202.95 ± 0.0566.25 ± 0.6523.40 ± 0.401.40 ± 0.100.10 ± 0.000.25 ± 0.05
Pawnee4.03 ± 2.852.23 ± 0.1265.63 ± 1.6724.27 ± 1.661.43 ± 0.120.10 ± 0.000.30 ± 0.00
No. 73.73 ± 2.642.23 ± 0.0568.57 ± 0.9022.00 ± 0.851.23 ± 0.050.10 ± 0.000.30 ± 0.00
No. 85.17 ± 0.522.53 ± 0.1273.70 ± 4.5217.17 ± 4.021.00 ± 0.220.10 ± 0.000.30 ± 0.00
No. 95.20 ± 0.202.90 ± 0.6072.75 ± 2.3517.75 ± 2.751.00 ± 0.100.10 ± 0.000.30 ± 0.00
No. 116.00 ± 0.102.25 ± 0.0562.50 ± 1.0027.25 ± 0.951.60 ± 0.200.10 ± 0.000.25 ± 0.05
Kanza5.27 ± 0.212.03 ± 0.1770.87 ± 1.9320.37 ± 1.461.10 ± 0.140.05 ± 0.050.30 ± 0.00
No. 175.45 ± 0.052.15 ± 0.0567.10 ± 1.1023.70 ± 1.001.20 ± 0.100.10 ± 0.000.30 ± 0.00
No. 205.97 ± 0.252.17 ± 0.1762.83 ± 1.9527.10 ± 1.561.57 ± 0.170.10 ± 0.000.27 ± 0.05
No. 215.97 ± 0.252.10 ± 0.1463.53 ± 2.2826.53 ± 2.151.57 ± 0.090.10 ± 0.000.27 ± 0.05
No. 225.80 ± 0.291.93 ± 0.1262.57 ± 1.4427.67 ± 1.071.60 ± 0.080.10 ± 0.000.27 ± 0.05
No. 265.20 ± 0.202.65 ± 0.0567.85 ± 2.9522.80 ± 2.601.10 ± 0.200.10 ± 0.000.30 ± 0.00
No. 286.30 ± 0.602.10 ± 0.2063.80 ± 5.5025.90 ± 4.201.55 ± 0.550.10 ± 0.000.20 ± 0.00
No. 295.70 ± 0.222.40 ± 0.0869.73 ± 1.5020.77 ± 1.251.13 ± 0.120.10 ± 0.000.27 ± 0.05
No. 305.60 ± 0.202.25 ± 0.1570.00 ± 1.9020.65 ± 1.851.05 ± 0.050.10 ± 0.000.30 ± 0.00
Caddo5.60 ± 0.002.50 ± 0.0069.80 ± 0.2020.65 ± 0.151.05 ± 0.050.10 ± 0.000.25 ± 0.05
No. 355.40 ± 0.102.50 ± 0.1073.10 ± 0.0017.55 ± 0.051.00 ± 0.000.10 ± 0.000.30 ± 0.00
No. 365.50 ± 0.102.70 ± 0.1065.70 ± 2.6024.55 ± 2.251.20 ± 0.100.10 ± 0.000.30 ± 0.00
No. 426.07 ± 0.242.17 ± 0.1765.13 ± 2.2724.83 ± 2.111.43 ± 0.050.10 ± 0.000.20 ± 0.00
No. 455.17 ± 0.172.37 ± 0.0570.90 ± 1.3520.03 ± 1.161.13 ± 0.120.10 ± 0.000.30 ± 0.00
No. 485.20 ± 0.402.65 ± 0.2571.45 ± 4.2519.00 ± 4.001.25 ± 0.150.10 ± 0.000.25 ± 0.05
No. 525.80 ± 0.302.65 ± 0.2568.50 ± 1.2021.50 ± 1.301.25 ± 0.050.05 ± 0.050.25 ± 0.05
No. 655.20 ± 0.202.50 ± 0.1069.05 ± 2.6521.60 ± 2.701.25 ± 0.050.10 ± 0.000.25 ± 0.05
No. 664.73 ± 0.312.80 ± 0.0073.97 ± 0.6217.17 ± 0.290.87 ± 0.050.10 ± 0.000.30 ± 0.00
No. 725.35 ± 0.052.75 ± 0.0566.55 ± 0.7523.70 ± 0.701.20 ± 0.100.10 ± 0.000.30 ± 0.00
No. 136.00 2.2064.9025.40 1.10 0.100.30
Average5.44 ± 0.582.43 ± 0.2967.90 ± 3.5022.47 ± 3.18 1.24 ± 0.210.10 ± 0.020.27 ± 0.03
CV%10.3911.845.0513.8816.5923.5712.12
Table 4. Mineral composition (mg/kg) of the pecan kernels.
CultivarKMgCaZn
Western3886.33 ± 83.74719.30 ± 80.07647.13 ± 33.3338.00 ± 1.41
Mahan3757.30 ± 67.07804.40 ± 59.21612.67 ± 53.6637.00 ± 3.74
Pawnee3673.63 ± 509.35754.57 ± 55.70777.23 ± 25.2042.67 ± 4.50
No. 73912.00 ± 246.91822.47 ± 58.68855.93 ± 101.6944.67 ± 5.91
No. 84280.67 ± 390.58826.17 ± 80.38787.03 ± 258.8944.33 ± 2.49
No. 94050.60 ± 375.44827.77 ± 14.60702.53 ± 115.3141.00 ± 2.16
No. 114264.60 ± 146.82789.07 ± 59.30834.37 ± 120.9746.67 ± 9.74
Kanza3869.23 ± 162.01774.30 ± 27.79893.47 ± 73.2740.33 ± 2.36
No. 173693.00 ± 375.10762.00 ± 72.90827.05 ± 45.7537.00 ± 1.00
No. 204364.73 ± 511.55698.47 ± 68.38830.07 ± 90.3544.00 ± 3.56
No. 214034.47 ± 372.85711.33 ± 39.32965.33 ± 188.6644.33 ± 8.01
No. 224218.17 ± 182.40720.13 ± 52.78866.83 ± 99.5843.67 ± 2.62
No. 264123.20 ± 281.04861.93 ± 75.561007.70 ± 55.1744.00 ± 0.82
No. 283899.90 ± 195.03807.70 ± 82.32605.27 ± 34.8245.33 ± 2.87
No. 294578.70 ± 593.47817.60 ± 84.18713.93 ± 13.5841.33 ± 4.19
No. 303832.47 ± 148.96811.23 ± 4.38815.93 ± 172.7440.00 ± 2.94
Caddo4173.07 ± 111.28742.37 ± 7.58882.03 ± 48.1337.33 ± 4.50
No. 354229.87 ± 242.66922.60 ± 210.48706.00 ± 19.0942.00 ± 6.48
No. 364196.40 ± 415.75870.97 ± 57.56673.57 ± 79.9243.00 ± 0.82
No. 424108.93 ± 321.84712.23 ± 59.74849.80 ± 36.6840.33 ± 4.50
No. 454181.43 ± 810.44910.3 ± 125.52862.23 ± 50.0246.67 ± 1.70
No. 484014.87 ± 363.02848.07 ± 90.03728.80 ± 105.9447.33 ± 4.50
No. 523711.00 ± 118.95793.47 ± 17.07708.73 ± 46.1843.33 ± 3.30
No. 653899.90 ± 577.27981.43 ± 94.57600.60 ± 82.9739.67 ± 9.39
No. 664188.20 ± 143.15923.93 ± 92.23702.90 ± 37.0343.00 ± 2.94
No. 724036.60 ± 292.10857.10 ± 13.501148.30 ± 7.8043.00 ± 3.00
No. 134125.97 696.23 661.50 41.67
Average4048.34 ± 220.85806.19 ± 75.59787.66 ± 130.2042.28 ± 2.90
CV%5.359.2016.226.74
CultivarCuMnFeNa
Western6.67 ± 2.3565.60 ± 17.5565.60 ± 17.551.00 ± 0.28
Mahan5.33 ± 1.7458.13 ± 7.0858.13 ± 7.080.93 ± 0.45
Pawnee9.00 ± 2.1242.77 ± 11.4842.77 ± 11.481.20 ± 0.45
No. 710.40 ± 2.9953.93 ± 15.7253.93 ± 15.721.30 ± 0.22
No. 87.90 ± 3.1055.00 ± 11.6355.00 ± 11.631.30 ± 0.37
No. 95.20 ± 1.5650.37 ± 5.9950.37 ± 5.991.13 ± 0.39
No. 116.83 ± 3.8137.03 ± 7.1137.03 ± 7.111.23 ± 0.46
Kanza7.23 ± 2.1545.27 ± 15.4545.27 ± 15.451.23 ± 0.24
No. 176.95 ± 0.6540.55 ± 5.7540.55 ± 5.751.15 ± 0.15
No. 205.70 ± 0.7341.43 ± 14.8841.43 ± 14.880.90 ± 0.24
No. 216.63 ± 0.4843.30 ± 4.4243.30 ± 4.421.10 ± 0.14
No. 225.97 ± 0.6343.97 ± 4.4443.97 ± 4.441.17 ± 0.05
No. 266.20 ± 2.3350.90 ± 8.6150.90 ± 8.610.87 ± 0.25
No. 286.67 ± 0.6151.53 ± 6.1851.53 ± 6.181.40 ± 0.33
No. 296.63 ± 0.1952.60 ± 11.1552.60 ± 11.150.93 ± 0.17
No. 306.23 ± 2.3053.47 ± 7.8753.47 ± 7.870.93 ± 0.31
Caddo4.97 ± 1.5756.17 ± 5.6056.17 ± 5.600.87 ± 0.37
No. 356.57 ± 3.1989.63 ± 12.3689.63 ± 12.361.03 ± 0.58
No. 366.13 ± 2.1530.57 ± 0.8330.57 ± 0.831.20 ± 0.36
No. 426.03 ± 1.2332.87 ± 8.5632.87 ± 8.561.13 ± 0.49
No. 459.00 ± 2.0666.57 ± 25.9866.57 ± 25.981.20 ± 0.28
No. 488.23 ± 0.7642.80 ± 11.0442.80 ± 11.041.20 ± 0.43
No. 525.83 ± 1.9742.10 ± 4.5842.10 ± 4.581.00 ± 0.37
No. 656.70 ± 3.2463.97 ± 17.9063.97 ± 17.900.93 ± 0.48
No. 668.30 ± 1.9975.53 ± 18.4875.53 ± 18.481.30 ± 0.29
No. 728.65 ± 2.7549.70 ± 0.9049.70 ± 0.901.05 ± 0.25
No. 134.50 40.03 7.63 0.80
Average6.83 ± 1.3850.95 ± 13.0810.65 ± 1.641.09 ± 0.16
CV%19.8825.1915.1014.42
Table 5. The matrix of each principal components in the nutrient factors.
IndexComponent
RC1RC2RC3RC4
Oleic acid P3−0.0100.983−0.0380.014
Linoleic acid P40.007−0.9770.048−0.025
Linolenic acid P5−0.037−0.8910.192−0.086
Magnesium P90.0590.6610.3170.372
Manganese P110.1980.6190.1040.503
Crude fat P14−0.0180.320−0.8290.193
Crude protein P150.3120.2940.5130.023
Soluble sugar P16−0.177−0.3090.259−0.828
Aspartic acid P180.9680.0270.0370.199
Threonine P190.8800.101−0.036−0.203
Serine P200.9830.0100.0130.132
Glutamic acid P210.959−0.1180.1430.119
Glycine P220.9770.0210.033−0.017
Alanine P230.9710.0760.0060.090
Valine P240.9440.1900.1460.131
Methionine P260.835−0.151−0.324−0.111
Isoleucine P270.9480.1650.0750.135
Leucine P280.9480.1250.0490.239
Tyrosine P290.971−0.0260.0530.112
Phenylalanine P300.9890.0460.0350.057
Lysine P310.8730.1100.223−0.084
Histidine P320.928−0.0090.227−0.023
Arginine P330.973−0.0090.0900.114
Proline P340.8490.3210.0470.197
Contribution rate (E)/%60.8817.825.843.79
Table 6. Principal component value of the mineral nutrients in pecan kernels.
CultivarsComponentComprehensive Component RC*
RC1RC2RC3RC4
No. 91.329/21.397/4−0.478/20−1.378/250.978/1
No. 651.092/30.217/120.639/61.755/20.808/2
No. 660.572/121.631/10.927/50.942/50.729/3
No. 720.894/50.038/152.340/10.254/110.697/4
No. 80.827/71.487/3−0.688/22−0.895/210.694/5
No. 211.579/1−1.407/24−0.114/15−0.315/160.692/6
No. 171.070/4−0.245/160.286/8−1.091/230.583/7
No. 260.781/90.042/14−1.135/251.737/30.483/8
No. 290.627/110.642/8−0.183/18−0.952/220.449/9
Mahan0.838/6−0.570/200.020/130.715/70.437/10
Western0.746/10−0.371/18−0.572/210.688/80.381/11
No. 130.802/8−0.718/21−2.210/27−0.331/170.219/12
No. 280.519/13−1.054/22−0.906/240.745/60.103/13
No. 45−0.377/161.175/51.904/20.071/130.094/14
No. 35−0.668/201.575/20.073/101.889/1−0.05/15
No. 7−0.276/150.360/100.320/7−1.574/27−0.145/16
No. 110.182/14−1.498/25−0.147/16−0.559/20−0.186/17
No. 52−0.407/170.079/130.091/9−0.476/19−0.247/18
No. 42−0.464/19−1.065/231.312/40.127/12−0.391/19
No. 22−0.423/18−1.699/271.431/3−0.434/18−0.493/20
Pawnee−0.815/21−0.447/190.048/11−1.249/24−0.620/21
No. 30−1.185/230.607/9−0.371/19−0.172/14−0.641/22
Kanza−1.149/220.753/6−0.818/23−1.386/26−0.666/23
No. 48−1.378/260.672/7−0.172/17−0.268/15−0.739/24
Caddo−1.238/240.318/11−1.654/261.232/4−0.747/25
No. 20−1.362/25−1.590/260.047/120.668/9−1.084/26
No. 36−2.118/27−0.330/170.009/140.260/10−1.338/27
Dates in the mean score/order.
Table 7. The hierarchical differentiation of category 3 cultivars based on comprehensive components score (five levels).
Comprehensive EvaluationComprehensive Component ScoreCultivar
Level 5>0.857No. 9
Level 40.857~0.681No. 65, No. 66, No. 72, No. 8, No. 21
Level 30.681~0.435No. 17, No. 26, No. 29, Mahan
Level 20.435~0.258Western
Level 1<0.258No. 13, No. 28
Publisher’s Note: MDPI stays neutral with regard to jurisdictional claims in published maps and institutional affiliations.

