Article

Carbon, Nitrogen and Phosphorus Stoichiometry in Natural and Plantation Forests in China

1
School of Environment Science and Engineering, Nanjing University of Information Science & Technology, Nanjing 210044, China
2
Institute of Ecology, School of Applied Meteorology, Nanjing University of Information Science & Technology, Nanjing 210044, China
3
Global Ecology Unit CREAF-CSIC-UAB, CSIC, 08193 Bellaterra, Catalonia, Spain
4
Centre de Recerca Ecològica i Aplicacions Forestals (CREAF), 08193 Cerdanyola del Vallès, Catalonia, Spain
5
South China Institute of Botany, Chinese Academy of Sciences, Guangzhou 510650, China
*
Authors to whom correspondence should be addressed.
Forests 2022, 13(5), 755; https://doi.org/10.3390/f13050755
Submission received: 15 April 2022 / Revised: 4 May 2022 / Accepted: 9 May 2022 / Published: 13 May 2022
(This article belongs to the Special Issue Soil Chemistry and Biochemistry in Forests)

Abstract

:
Ecological stoichiometry is essential for understanding the biogeochemical cycle in forest ecosystems. However, previous studies of ecological stoichiometry have rarely considered the impacts of forest origins, which could help explain why to date so much uncertainty has been reported on this subject. In this study, we tried to reduce this uncertainty by examining carbon (C), nitrogen (N) and phosphorus (P) in roots, litter and soil in both natural and plantation forests throughout China. The sampled forest sites were divided into three groups according to the identified succession stages: early (ES), middle (MS) and late (LS) stages. Our results show that soil C, N and P concentrations were significantly higher in natural (NF) than in plantation (PL) forests. As succession/growth proceeded, P concentrations significantly increased in litter, roots and soil in NF, while the opposite occurred in PL. These results indicate that NF are able to use P more efficiently than PL, especially in the LS. Furthermore, the higher root N:P ratio indicates that the growth of PL was limited by P in both MS and LS. Our results also suggest that geographical and climatic factors are not the dominant factors in the differences in P between NF and PL, and, even more clearly and importantly, that native forests with native species are more capable of conserving P than planted forests, which are frequently less diverse and dominated by fast-growing non-site native species. These results will help improve biogeochemical models and forest management throughout the world.

1. Introduction

Carbon (C) is one of the base materials that support vegetation growth [1], in which nitrogen (N) and phosphorus (P) are the two most important limiting elements [2,3]. The ratios of carbon to nitrogen (C:N), carbon to phosphorus (C:P) and nitrogen to phosphorus (N:P) can therefore be used to explore the relationships and feedback between organisms and the environment [4], as well as biogeochemical processes [2]. C, N and P in forest ecosystems are exchanged between plants, litter and soil [5]. However, the determination of stoichiometry in root–litter–soil systems still needs clarifying. The importance of roots, in particular, is often ignored, even though they play a vital role in connecting plants’ aboveground and underground structures [6]. More than 90% of the N and P nutrients in vegetation are returned to the soil through litter [7].
China possesses abundant forest resources with rich forest types spread over a climatic gradient that ranges from cold temperate to tropical [8]. These forests, either naturally regenerated (natural forests, NF) or artificially planted (plantation forests, PL), greatly differ in terms of both species composition and management. As previously reported, China’s PL provide fewer ecosystem services than NF since they are monocultures, and as a result of inappropriate management, there is excessive use of fast-growing pioneer successional species, use of non-native species such as Pinus and Eucalyptus, less biodiversity, and declining forest productivity [9,10]. Thus, there is an urgent need to explore differences in nutrient cycling between NF and PL, a process that is seldom reported but which is essential for improving forest management.
Despite intensive studies that have investigated the stoichiometric characteristics of plant tissues [11,12,13] and controlling factors at different temporal-spatial scales [3,12,14,15,16], debate continues as to the influence of climatic factors on stoichiometric ratios. For example, by compiling published data relating to global experiments conducted in natural environments, Yuan and Chen [17] found that the ratio of terrestrial plant N:P decreases with greater atmospheric concentrations of CO2, increased rainfall, and P fertilization, but increases with warming, drought, and N fertilization. By comparison, Reich and Oleksyn [3] used a global data set of 5087 observations of leaf N and P to demonstrate that leaf N and P increase from the tropics towards cooler and drier mid-latitudes, and that the N:P ratio increases with mean annual temperature (MAT) and towards the equator. Yet, Townsend [18] found no relationship between the N:P ratios and either latitude or mean annual precipitation (MAP) in the tropics. In addition to these discrepancies, the interactions between root–litter–soil are often not taken into account in studies of the stoichiometric characteristics in forests, even though they could give rise to important feedbacks between the above- and below-ground components of ecosystems [19]. As such, the internal mechanisms of C, N and P balances in different forest stands during succession/growth stages still need to be further explored.
In this study, we examined the C, N and P concentrations and stoichiometric ratios in roots, litter and soil in different forest stands in China’s forest ecosystems. We predicted that the C, N and P concentrations and their stoichiometric ratios in roots, litter and soil are likely to be closely linked. Therefore, our objectives were to (1) quantify the patterns of C, N and P concentrations and stoichiometric characteristics in roots, litter and soil during succession stages in NF and PL throughout China’s forest ecosystems; and (2) determine the factors affecting C, N and P concentrations and ecological stoichiometry in roots, litter and soil, and the differences between NF and PL.

2. Materials and Methods

2.1. Samples and Measurement

Root, litter and soil samples were collected in China during the years 2011–2015. Samplings and laboratory analyses were all conducted following a consistent standardized protocol [20,21]. We divided the country into three grid sizes (100, 400 and 900 km2) based on vegetation distribution using a 1: 1,000,000 vegetation map. A grid size of 100 km2 was designed for tropical and subtropical regions with rich species diversity, and 400 and 900 km2 were for temperate and alpine vegetation regions where species diversity is relatively poor. Then we overlaid the grid maps with administrative maps and randomly select 3% to 5% of the grid for the field surveys by considering forest origin, age and type [22]. At each site, a 1000-m2 plot was established (600 m2 in some cases in plantations), each of which consisted of 10 subplots (10 m × 10 m) for the field survey. In each plot, plant roots were collected from the commonest tree species (diameter breast height ≥ 5 cm, 1–5 species). We also set up three 1 m × 1 m quadrats in each subplot for litter sampling. After removing the litter layer, soil samples at 0–50 cm were collected in each plot with a soil auger. Fertilized sites, sites with missing measurements in any depth of 0–50 cm in the soil matrix, and missing root of tree samples were filtered, and in total of 1112 sites were retained for analysis (Figure 1). All the root and litter samples were oven-dried at 65 °C to a constant weight and ground into fine powder with a plant sample grinder. Soil samples were air dried. C and N concentrations in the root, litter and soil were analyzed using an elemental analyzer (2400 II CHNS; Perkin-Elmer, Boston, MA, USA). P concentrations were determined using the molybdate/ascorbic acid method after H2SO4-H2O2 digestion. The sampled sites were divided into two groups, natural (NF) and plantations (PL) forests. Three successional stages or growth stages were identified for each (early, middle and late stages). Details of the identification of the successional and growth stages can be found in Yu et al. [22]. Dominant species of different successional stages in different forest origins were shown in detail in Table A1.

2.2. Climate Data

Climate data (MAT and MAP) were obtained from the National Ecosystem Research Network of China (http://data.cma.cn/en, accessed on 16 January 2021).

2.3. Statistical Analyses

The mean and standard error of the investigated variables (including C, N and P contents, and C:N, C:P and N:P ratios) of root, litter and soil mixtures were calculated separately. Independent-samples T-tests were used to examine the differences between the C, N and P concentrations and ratios in the different forest types. One-way analyses of variance (ANOVA) were used to examine the differences in C, N and P concentrations and the ratios between the different succession/growth stages. Pearson’s correlation was used to analyze the association between the studied variables (C, N and P concentrations, and geographical and climatic factors). All values were considered statistically significant at p < 0.05 and the results are reported as the means ± standard errors. All statistical analyses were performed using SPSS v22.0 (IBM Crop.) (Chicago, IL, USA), and the statistical data were plotted using OriginPro 2021 (Hampton, USA).

3. Results

3.1. C, N and P Concentrations in Roots, Litter and Soil in Forests of Different Origins in China

Significantly higher root C and N concentrations were found in PL than in NF (Table 1, p < 0.05); root P concentrations were significantly lower in PL than in NF (Table 1, p < 0.05). For litter C concentrations, no differences were found between PL and NF (Table 1, p > 0.05). However, litter N concentrations were significantly higher in PL than in NF. In contrast, litter P concentrations were significantly higher in NF than PL (Table 1, p < 0.05). Soil C, N and P concentrations were significantly lower in PL than in NF (Table 1, p < 0.05).
The C:N, C:P, and N:P ratios did not significantly differ between NF and PL in soils (Table 2, p > 0.05). For roots and litter, the N:P ratios were significantly higher in PL than in NF (Table 2, p < 0.05). By comparison, the C:N and C:P ratios in NF and PL only significantly differed in roots and litter (Table 2, p < 0.05), respectively.
Although the C concentrations were not significantly different in the three succession stages, both in NF and PL and in roots and litter (Figure 2a,d, p > 0.05) soil C concentrations significantly increased with succession/growth stages in both NF and PL (Figure 2g, p < 0.05). Root N concentrations generally decreased in NF during succession (Figure 2b, p < 0.05) but did not change significantly in PL (Figure 2b, p > 0.05). However, compared to the ES and MS, soil N increased significantly in NF and decreased significantly in PL in the LS (Figure 2h, p < 0.05). P concentrations generally increased in NF during succession in roots, litter and soil but significantly decreased in PL (Figure 2c,f,i, p < 0.05).
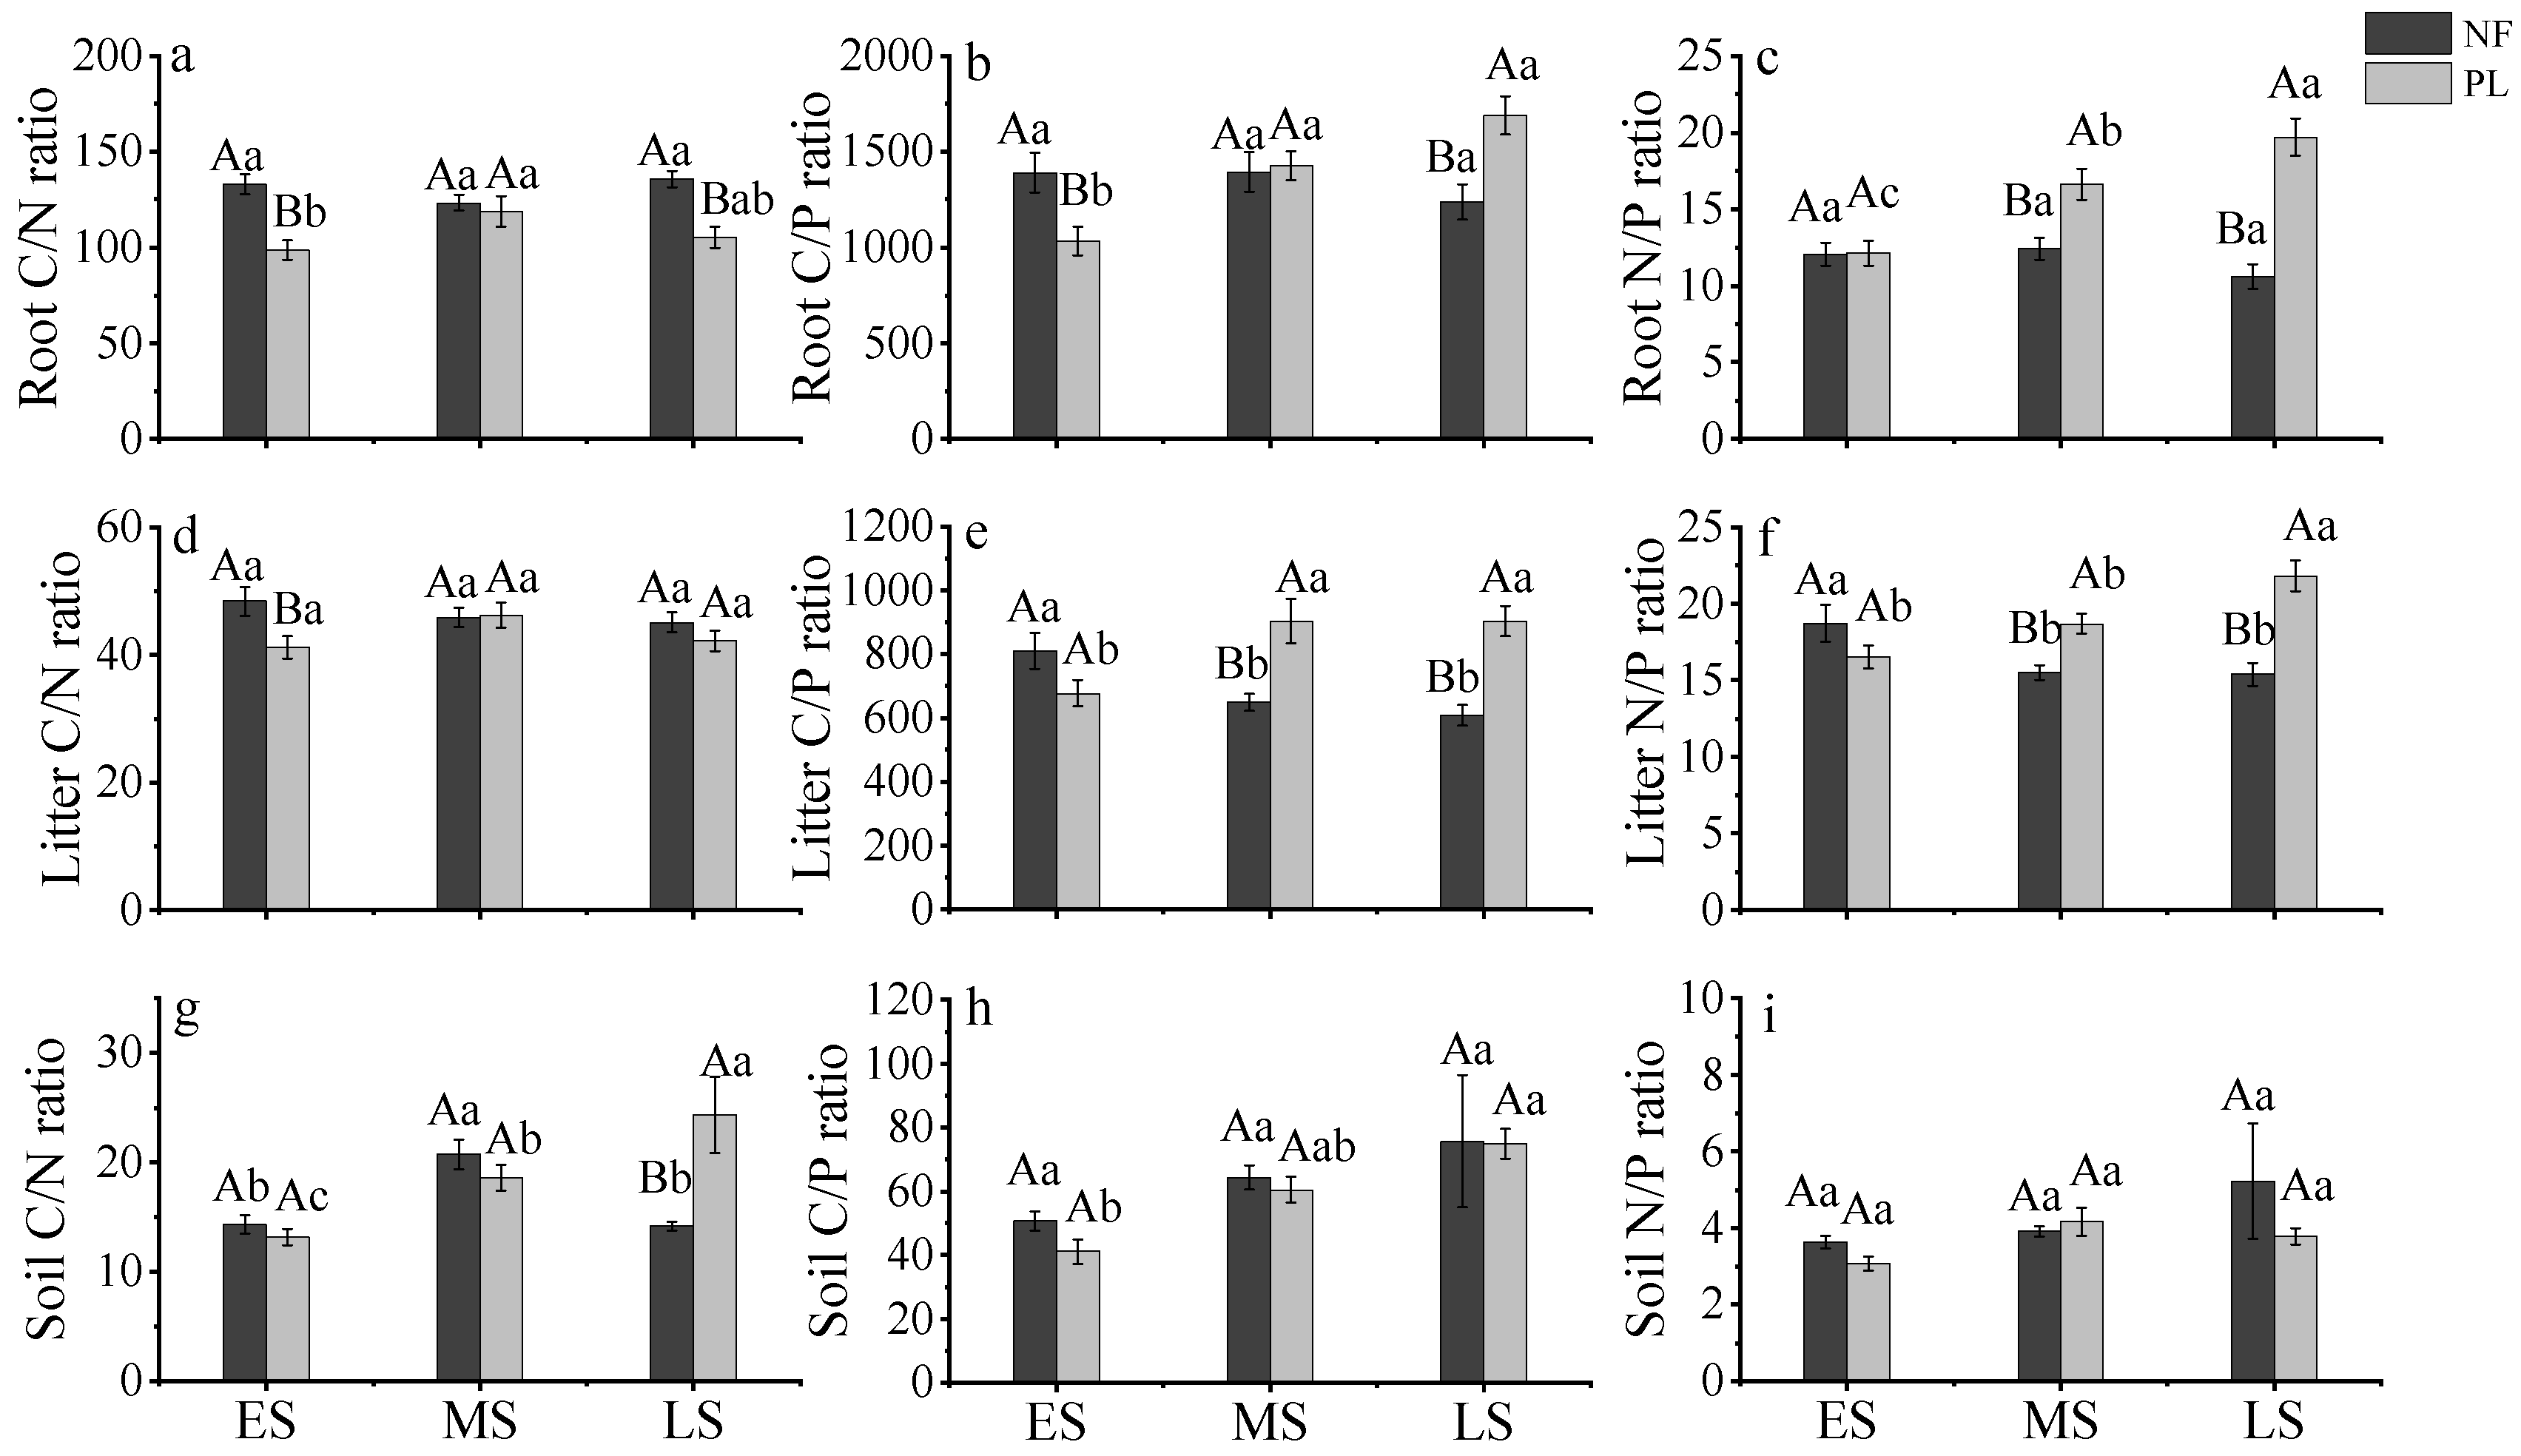
The C:N, C:P and N:P ratios did not significantly differ in NF in roots during succession (Figure 3, p > 0.05). Root C:P and N:P ratios generally increased in PL during succession (Figure 3b,c, p < 0.05). Litter C:P and N:P ratios significantly increased with age in PL but decreased in NF (Figure 3e,f, p < 0.05). Soil C:N and C:P ratios significantly increased in PL (Figure 3g,h, p < 0.05). The difference in soil N:P ratios in NF and PL during succession was not significant (Figure 3i, p < 0.05).

3.2. Relationships in C, N and P Concentrations and Ecological Stoichiometry in Roots, Litter and Soil in Different Forests

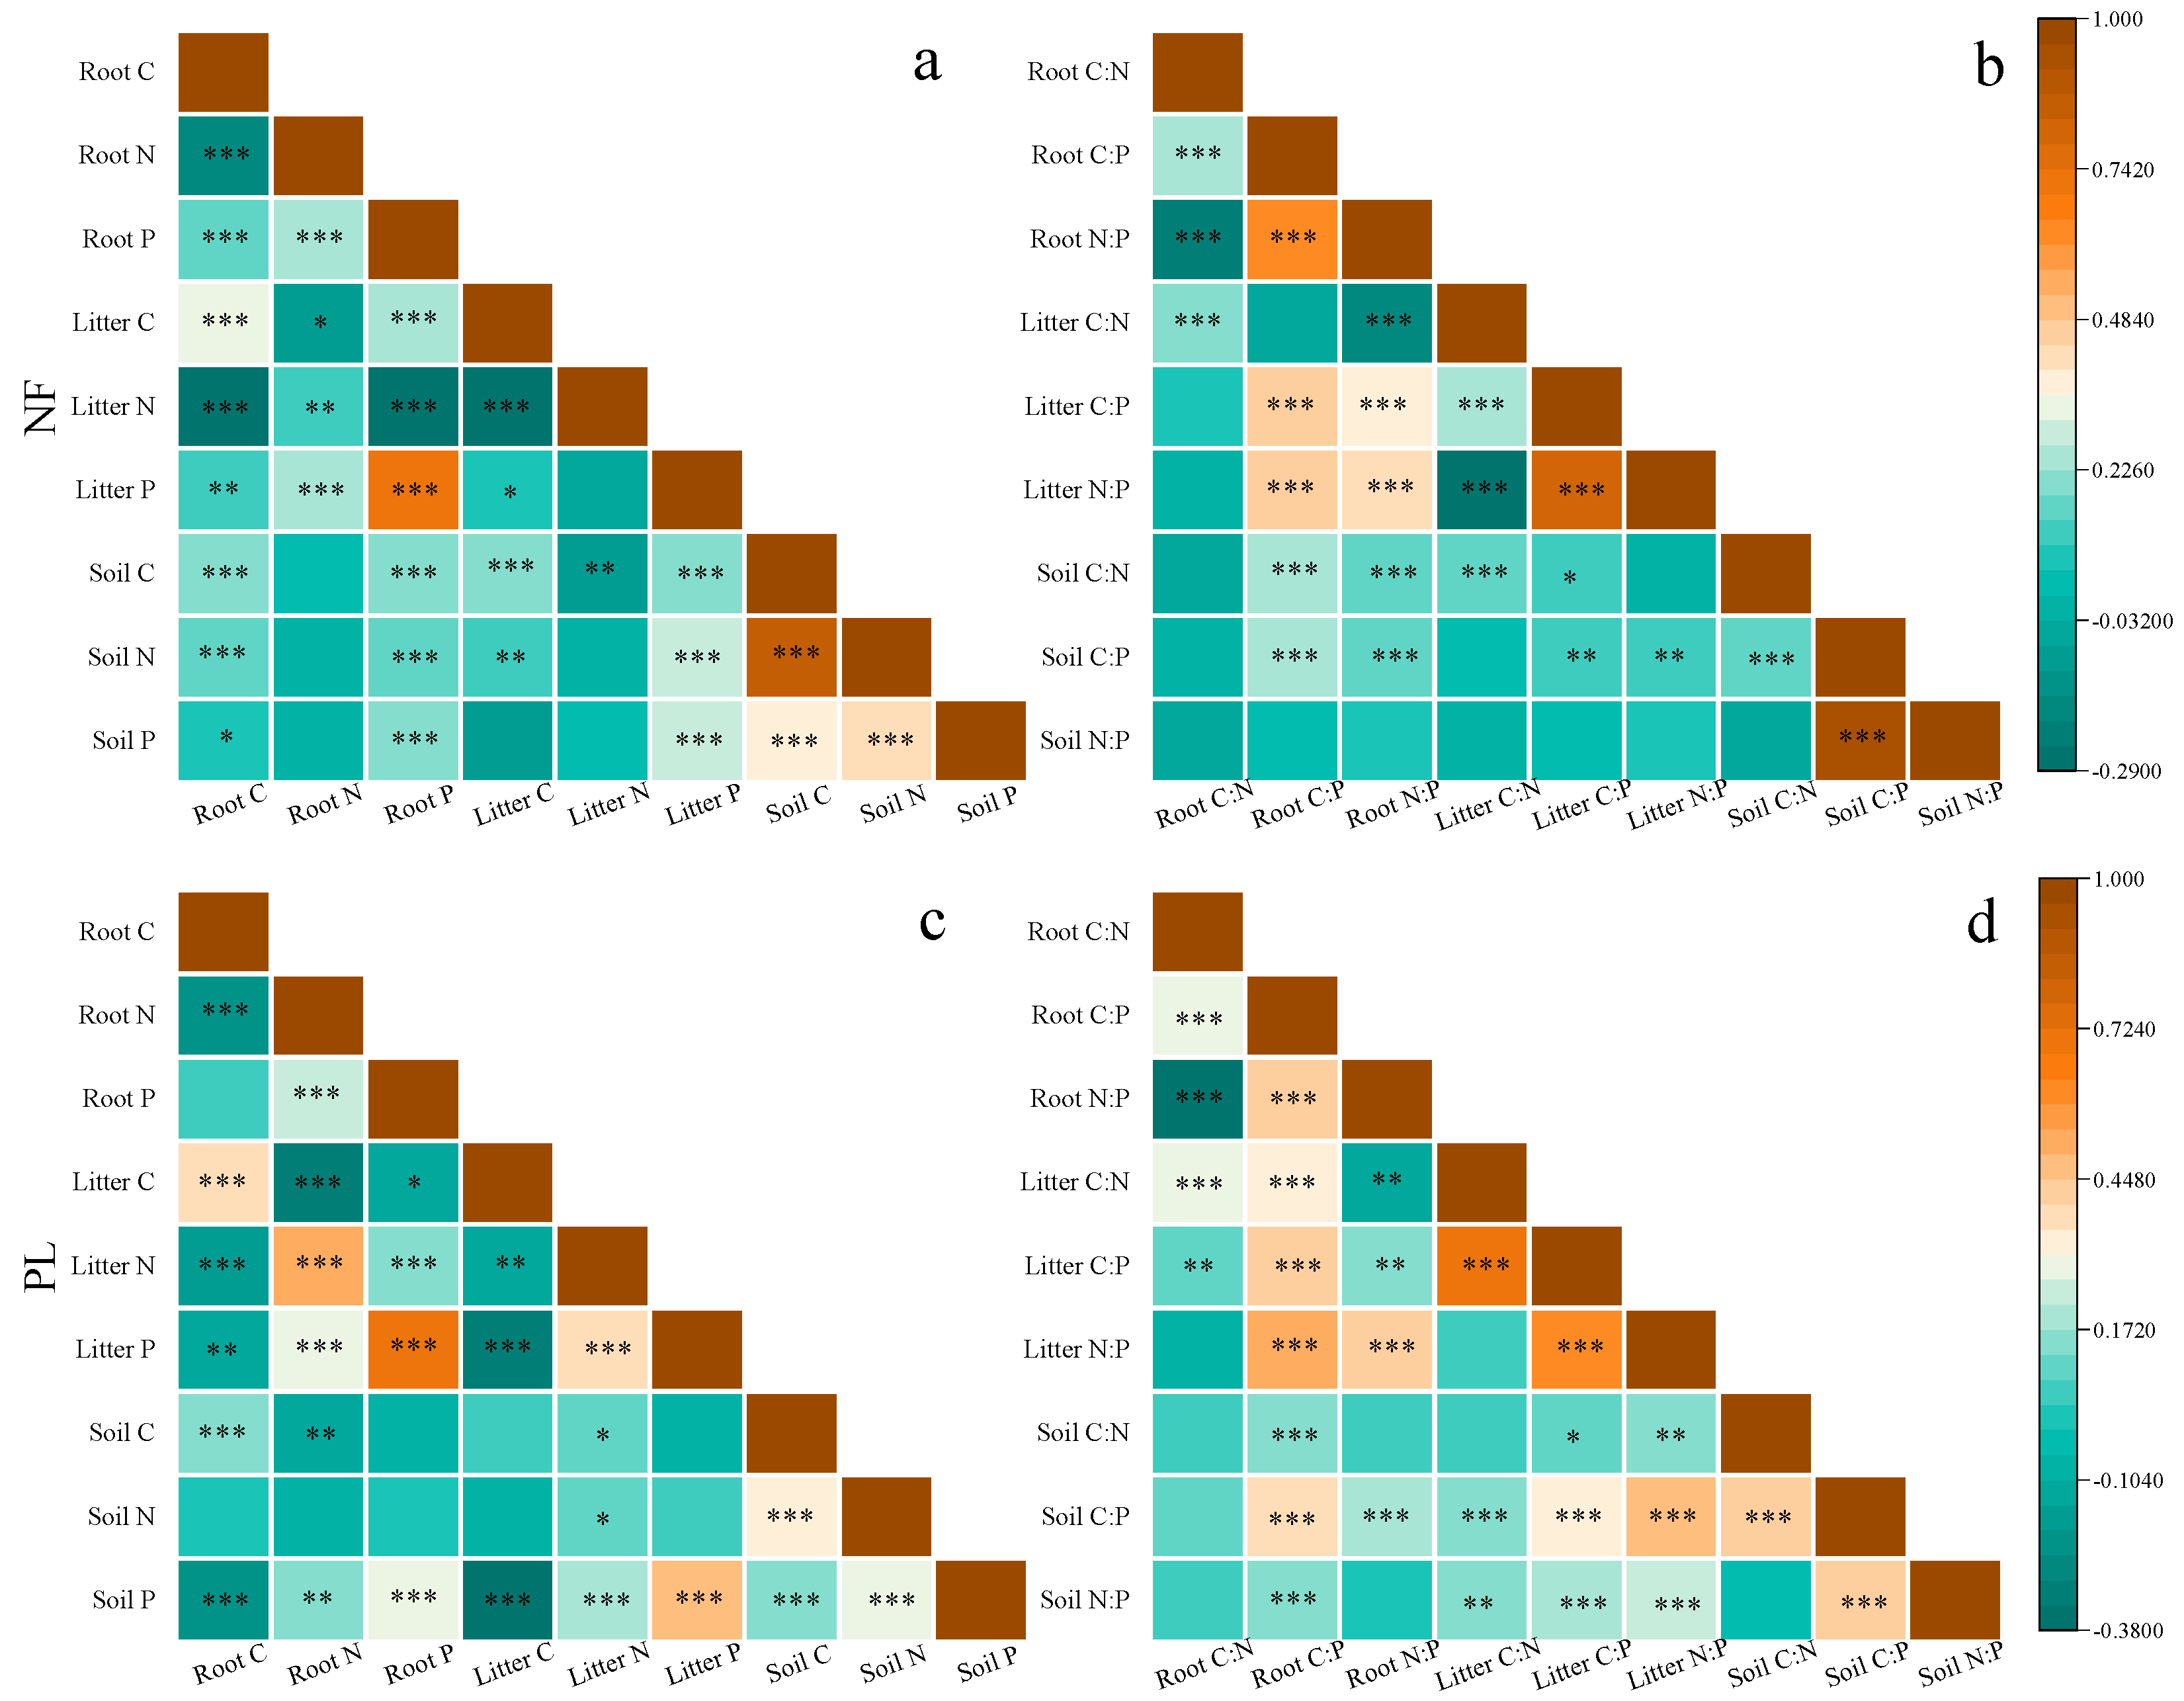
The relationships in C, N and P concentrations and in C:N, C:P and N:P ratios in root–litter–soil in NF and PL are shown in Figure 4. In NF, roots, litter and soil C concentrations were significantly positively correlated. P concentrations were significantly correlated positively in roots, litter and soil but had a strong negative influence on root N and litter N concentrations. Moreover, no clear relationship was observed between the soil N concentrations and root and litter N concentrations (Figure 4a). Roots, litter and soil C:P ratios were very positively correlated (Figure 4b). Soil C:N and N:P ratios were significantly positively correlated with soil C: P. Similar patterns were also observed in roots, litter and soil P concentrations in both PL and NF. (Figure 4c). The C:N, C:P and N:P ratios in roots and litter were significantly positively correlated. The significant positive correlations between litter and soil were linked by their C:P and N:P ratios (Figure 4d).

3.3. Relationships in Determinants and C, N and P Concentrations and Ecological Stoichiometry in Roots, Litter and Soil between NF and PL

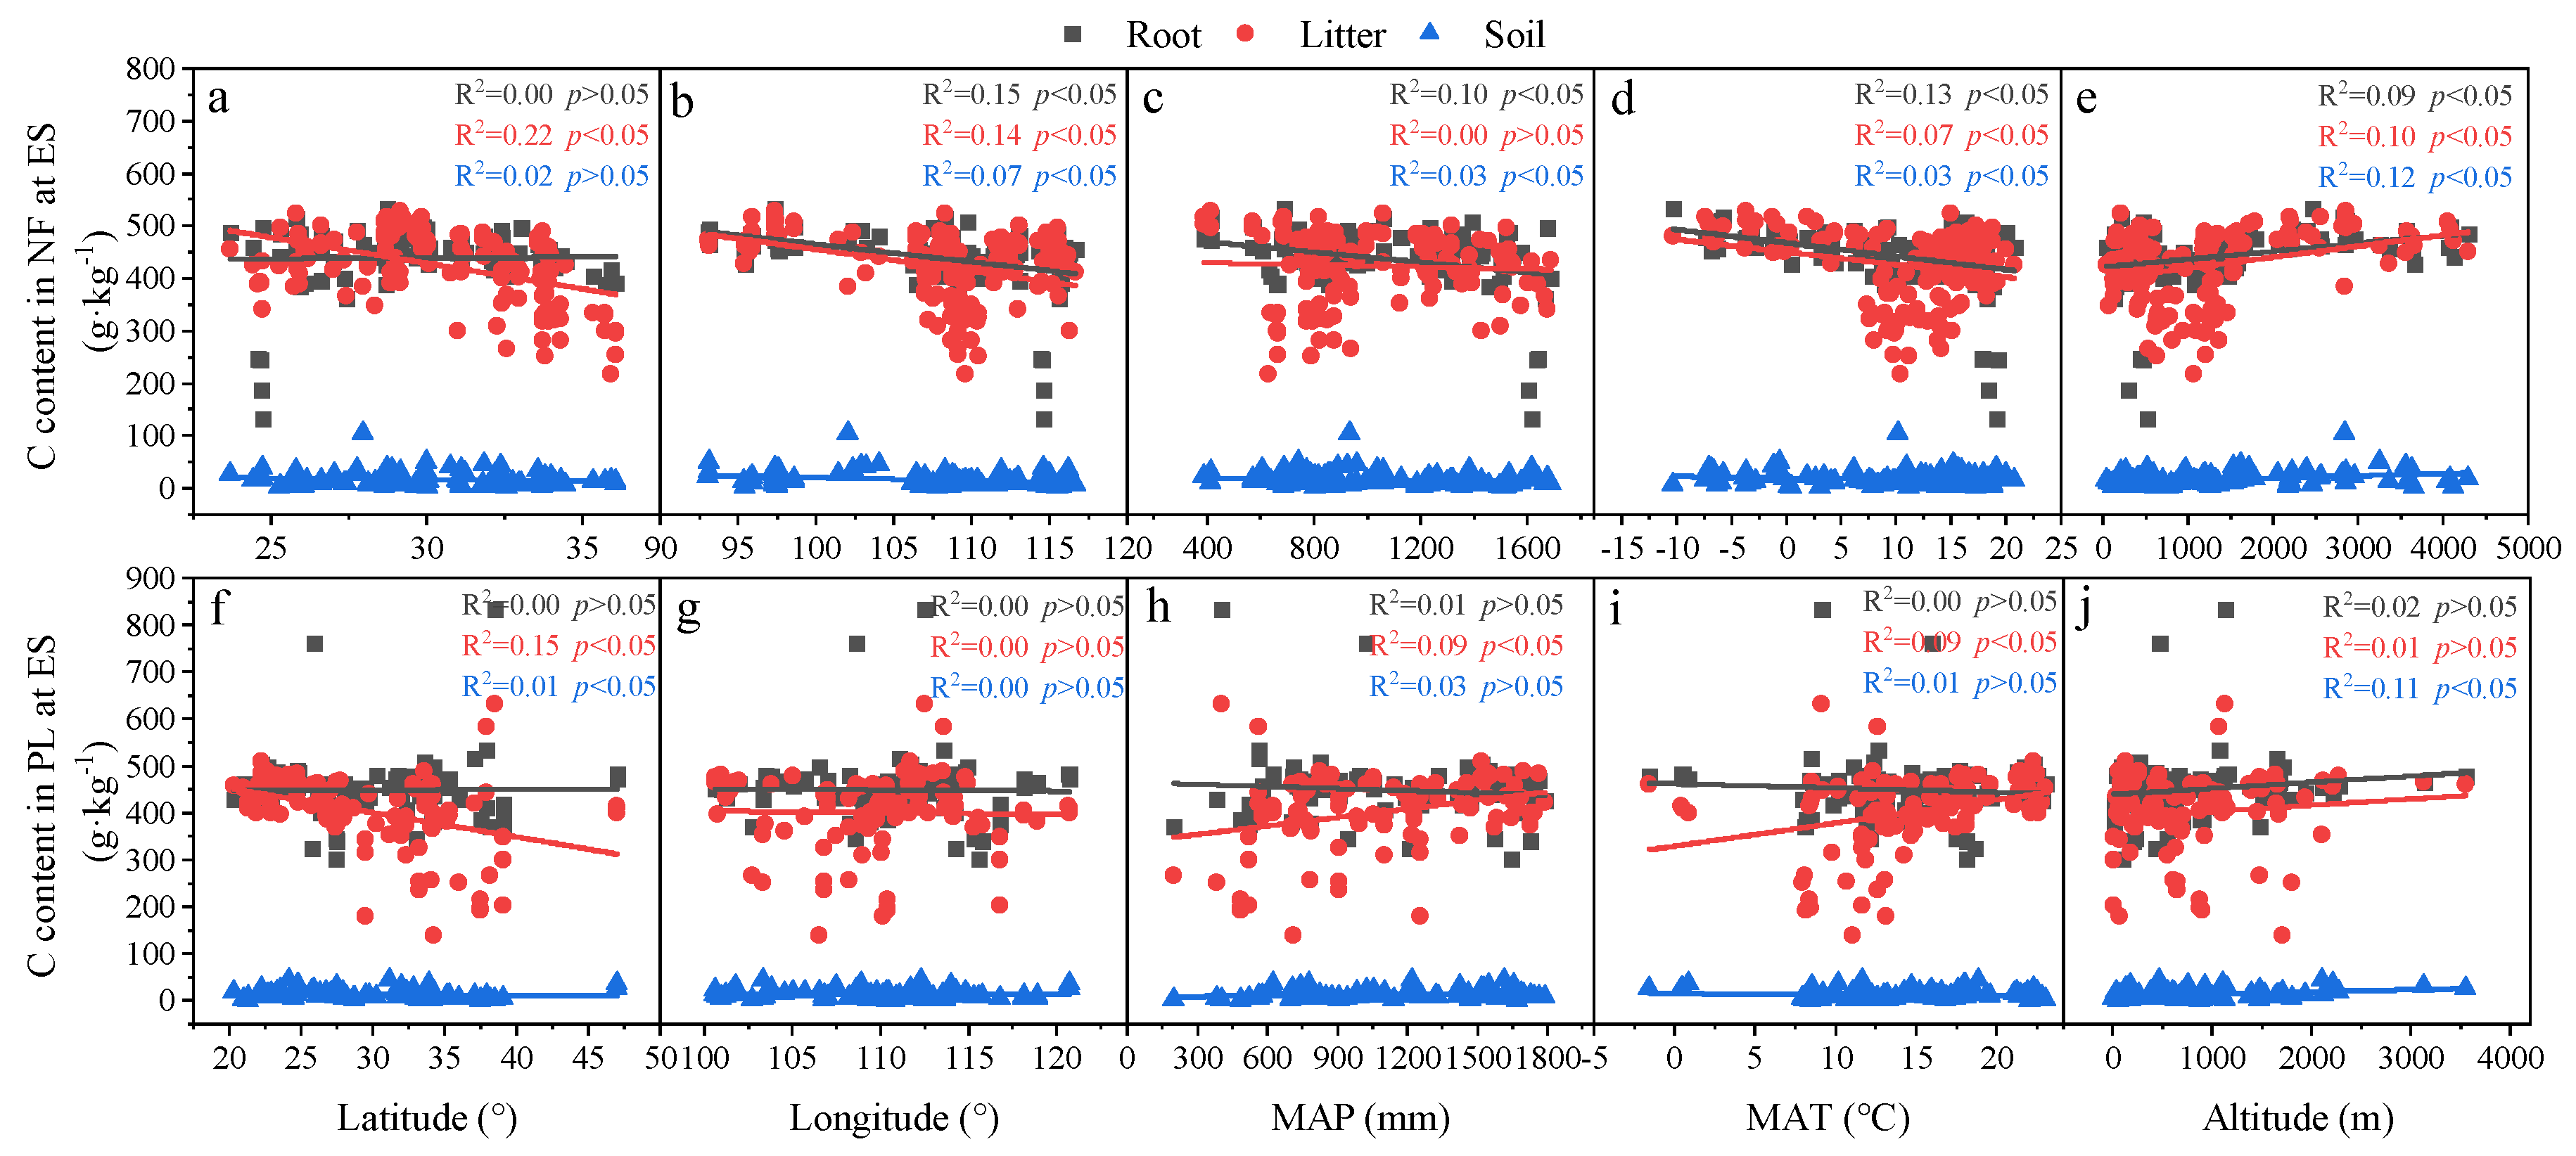
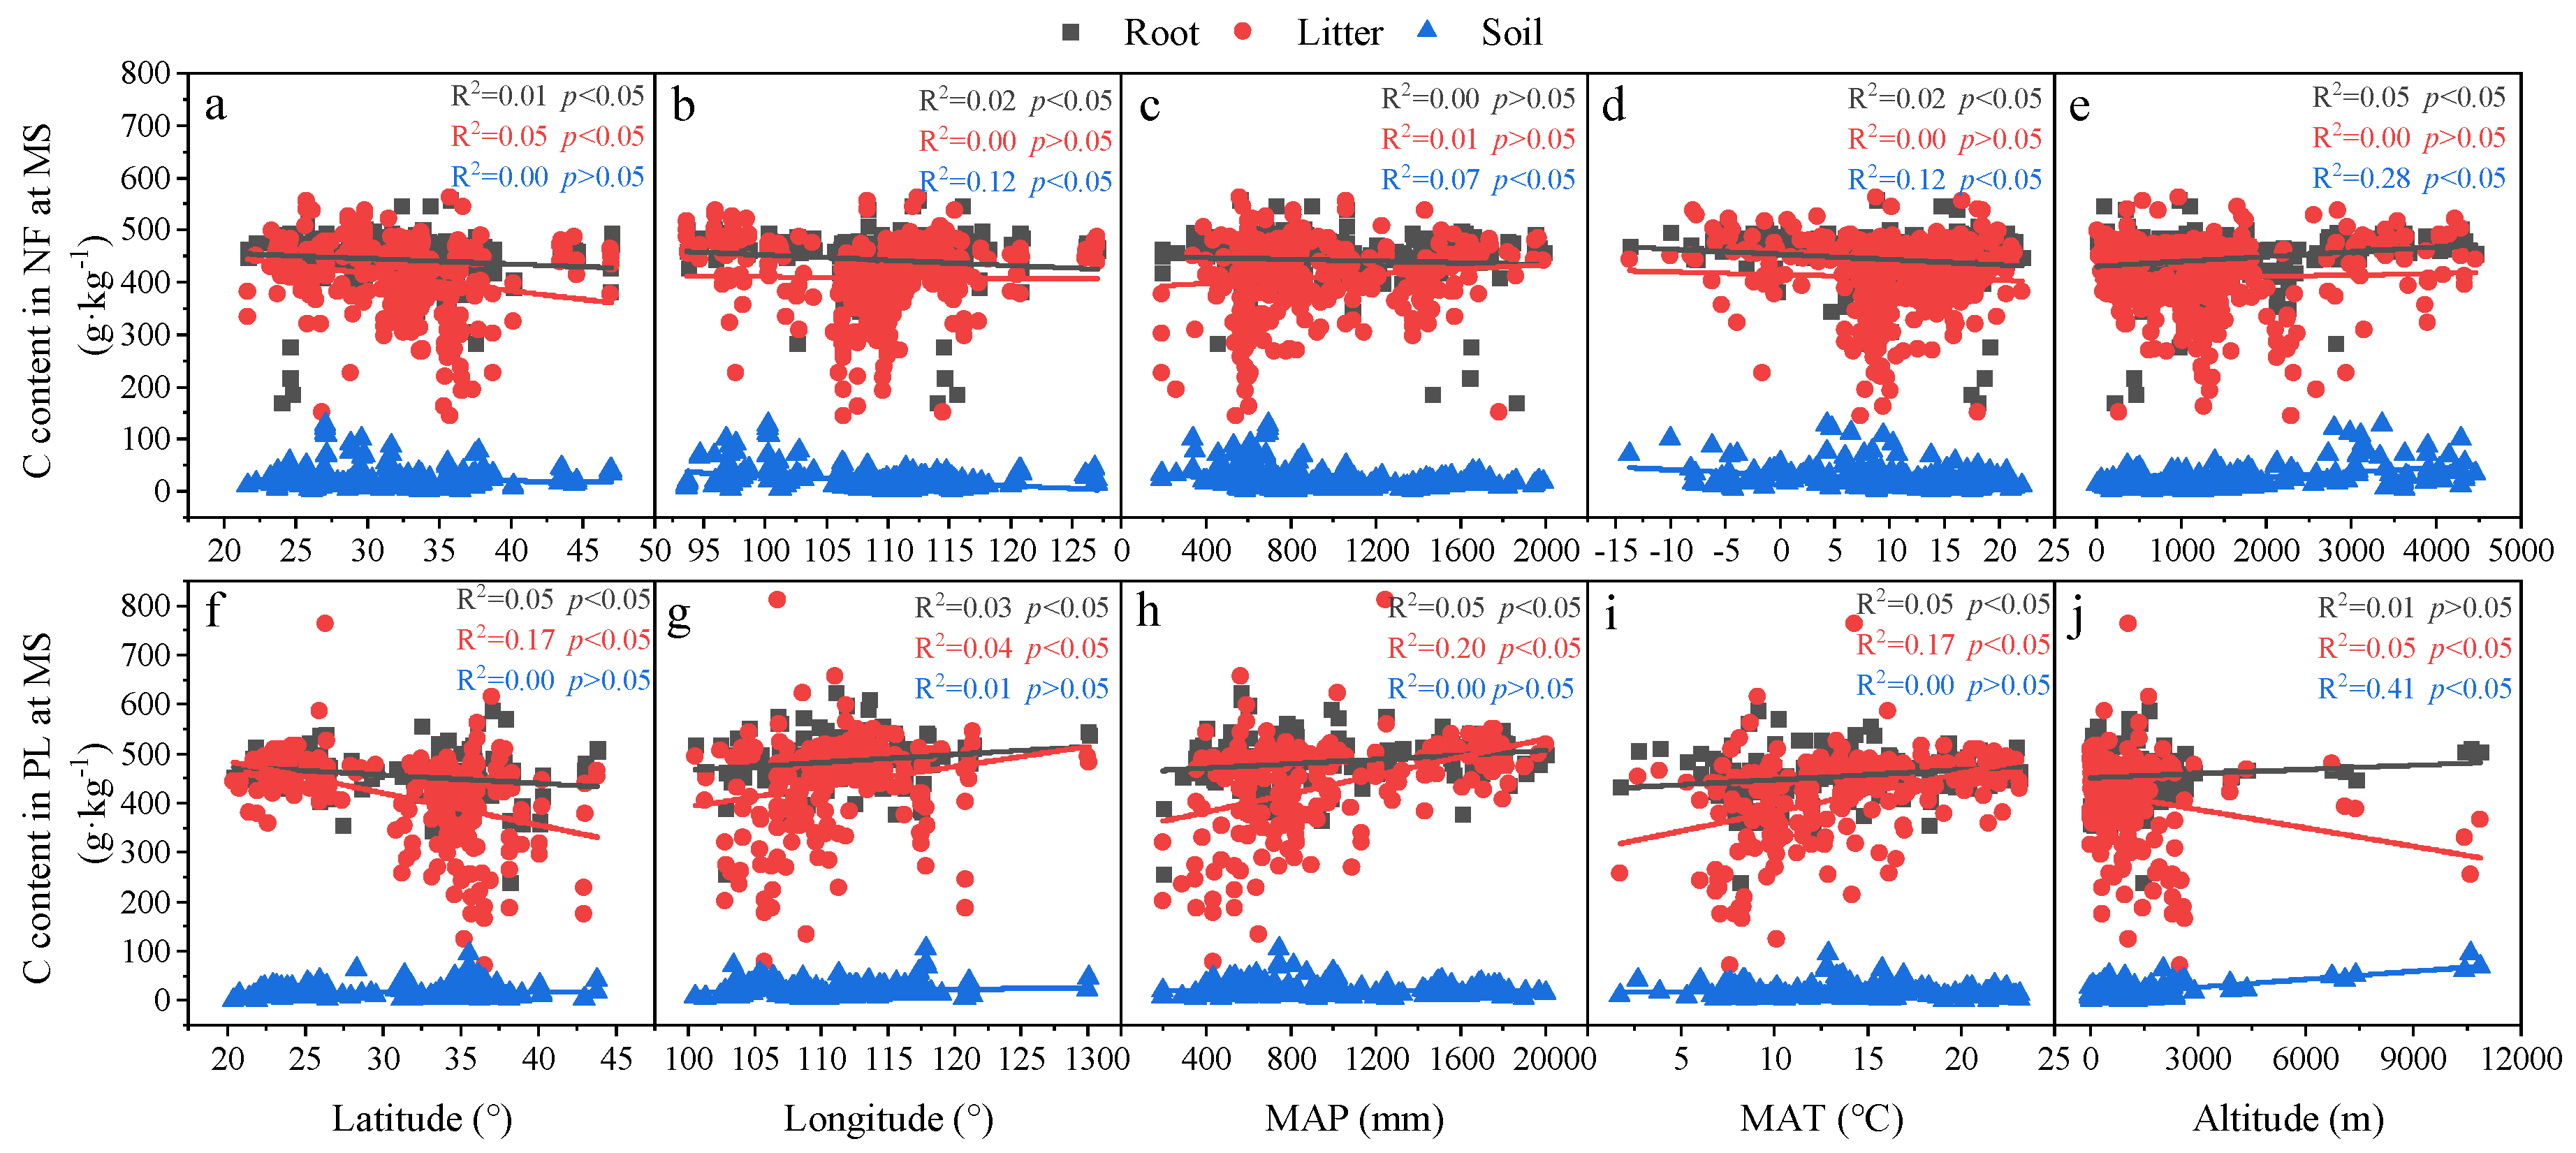
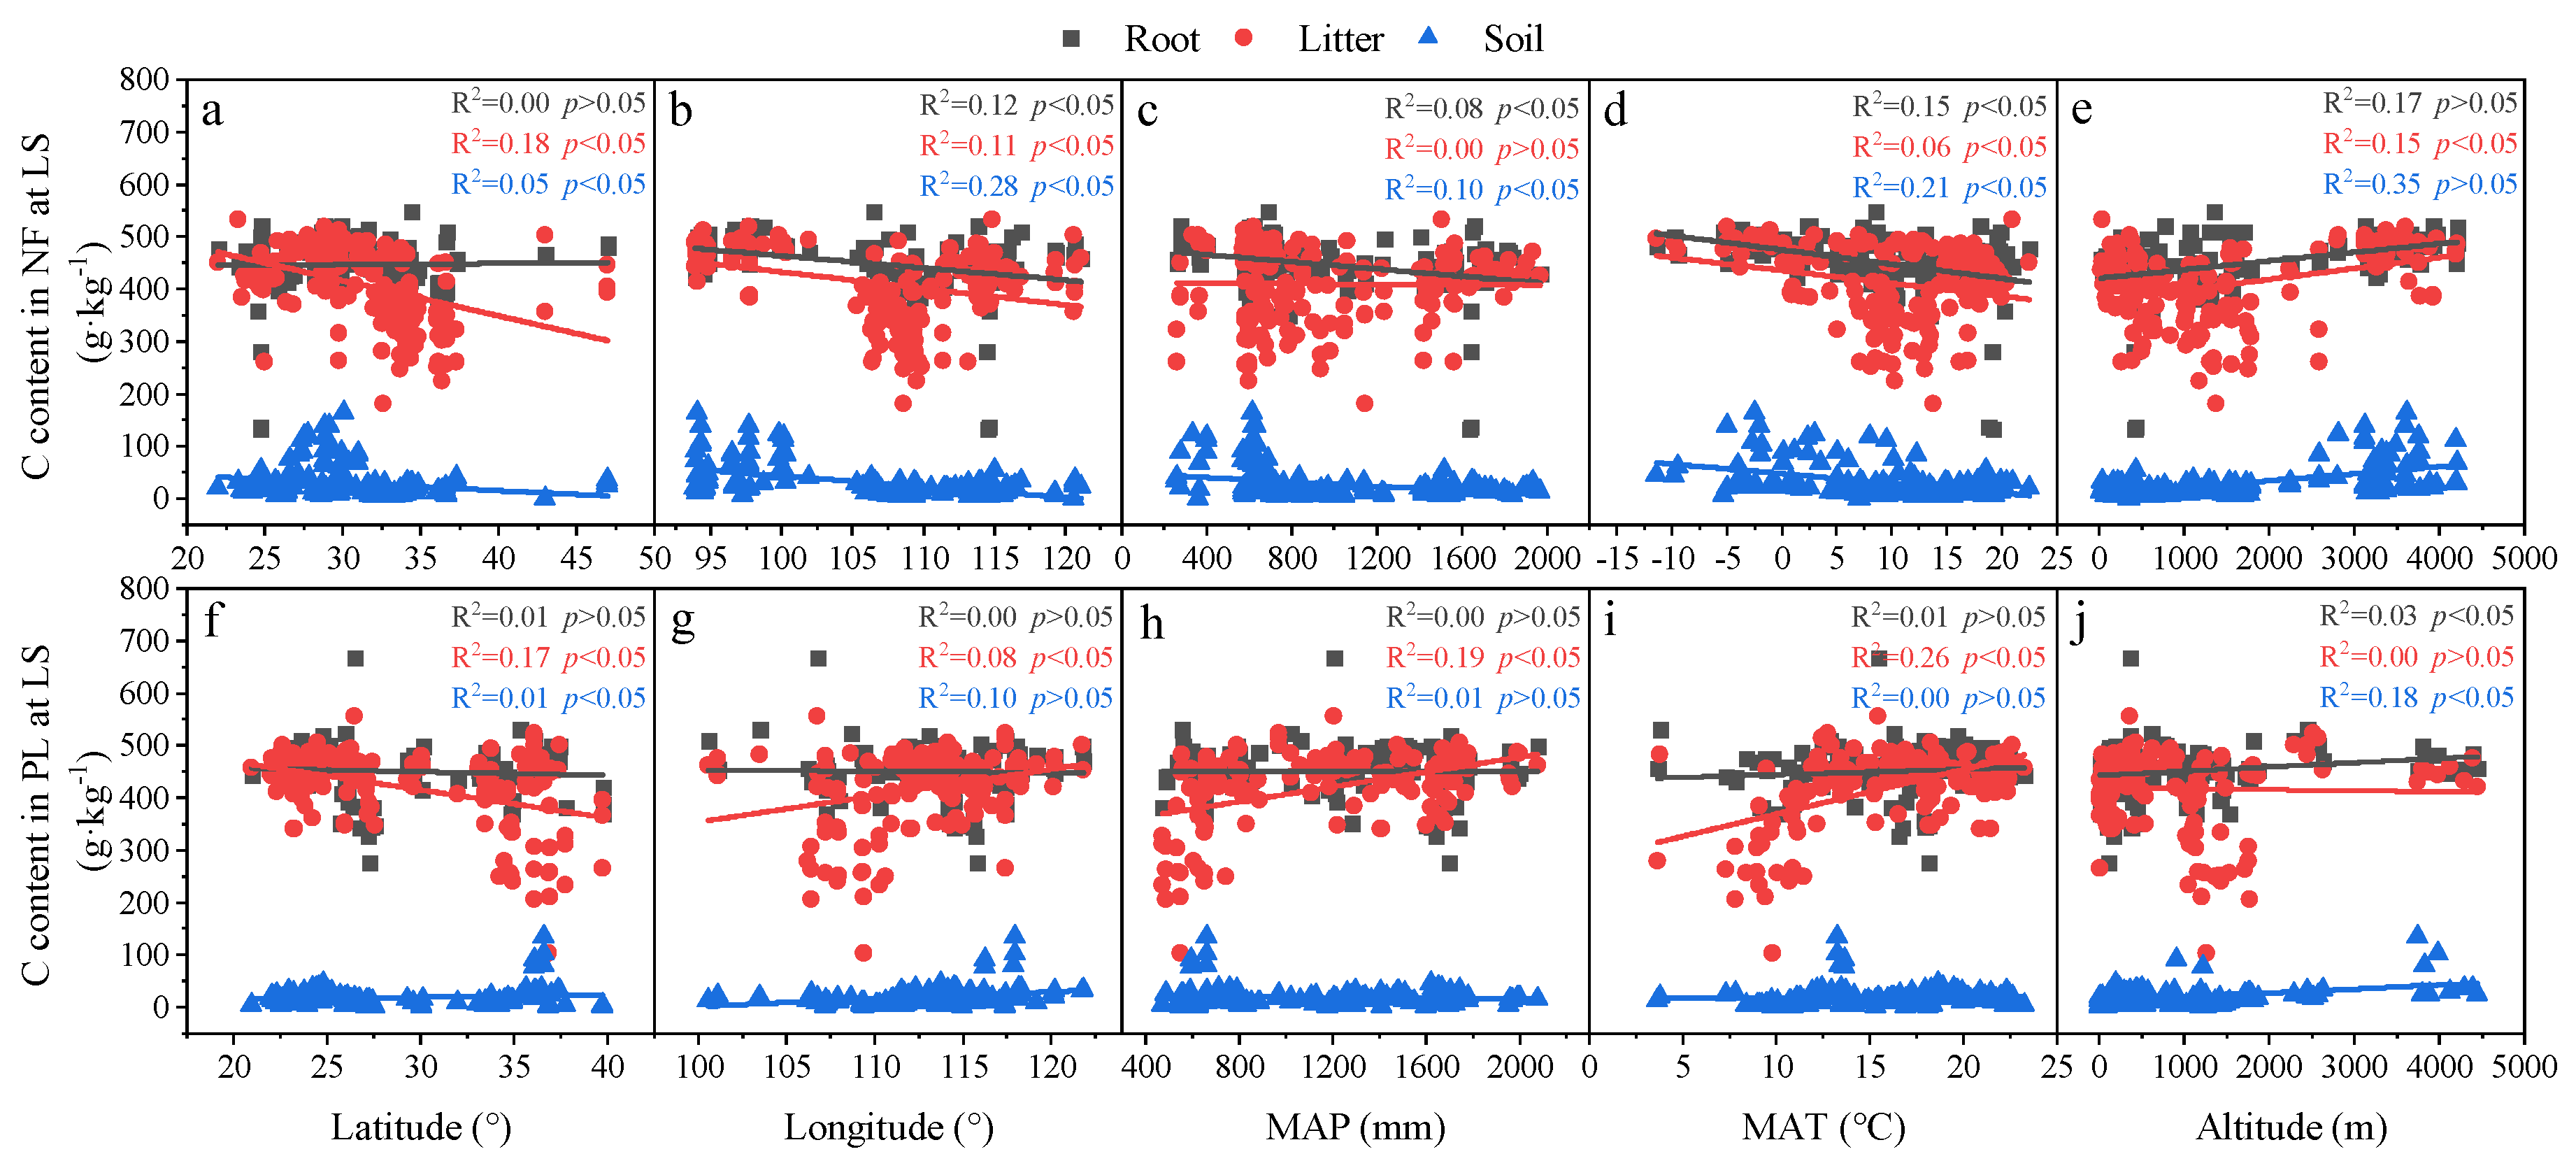
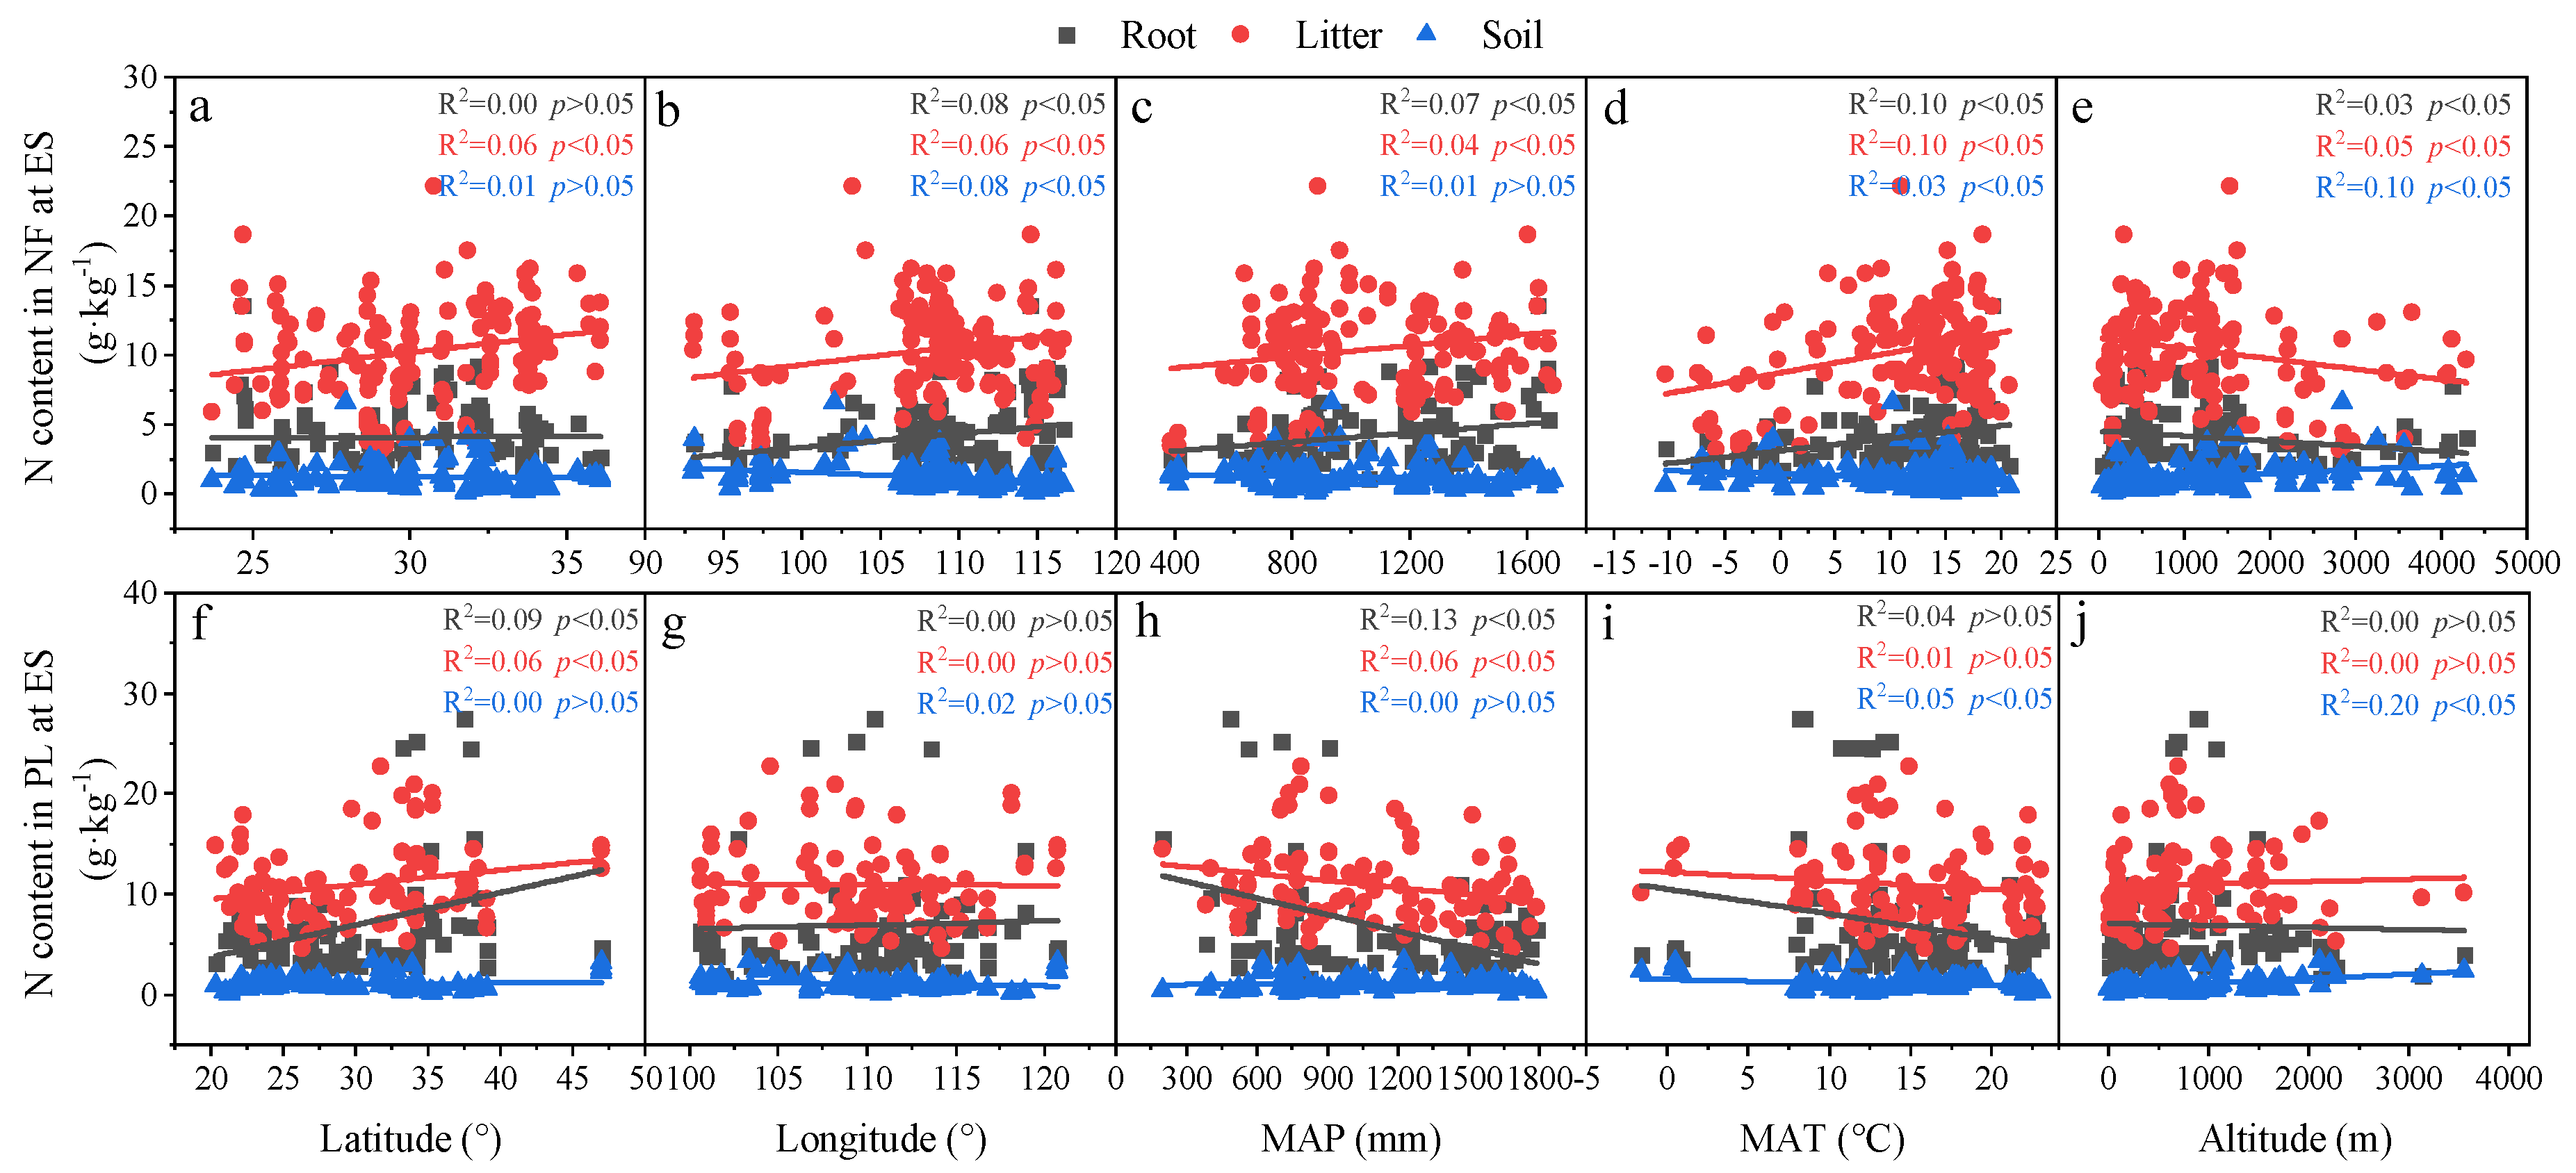
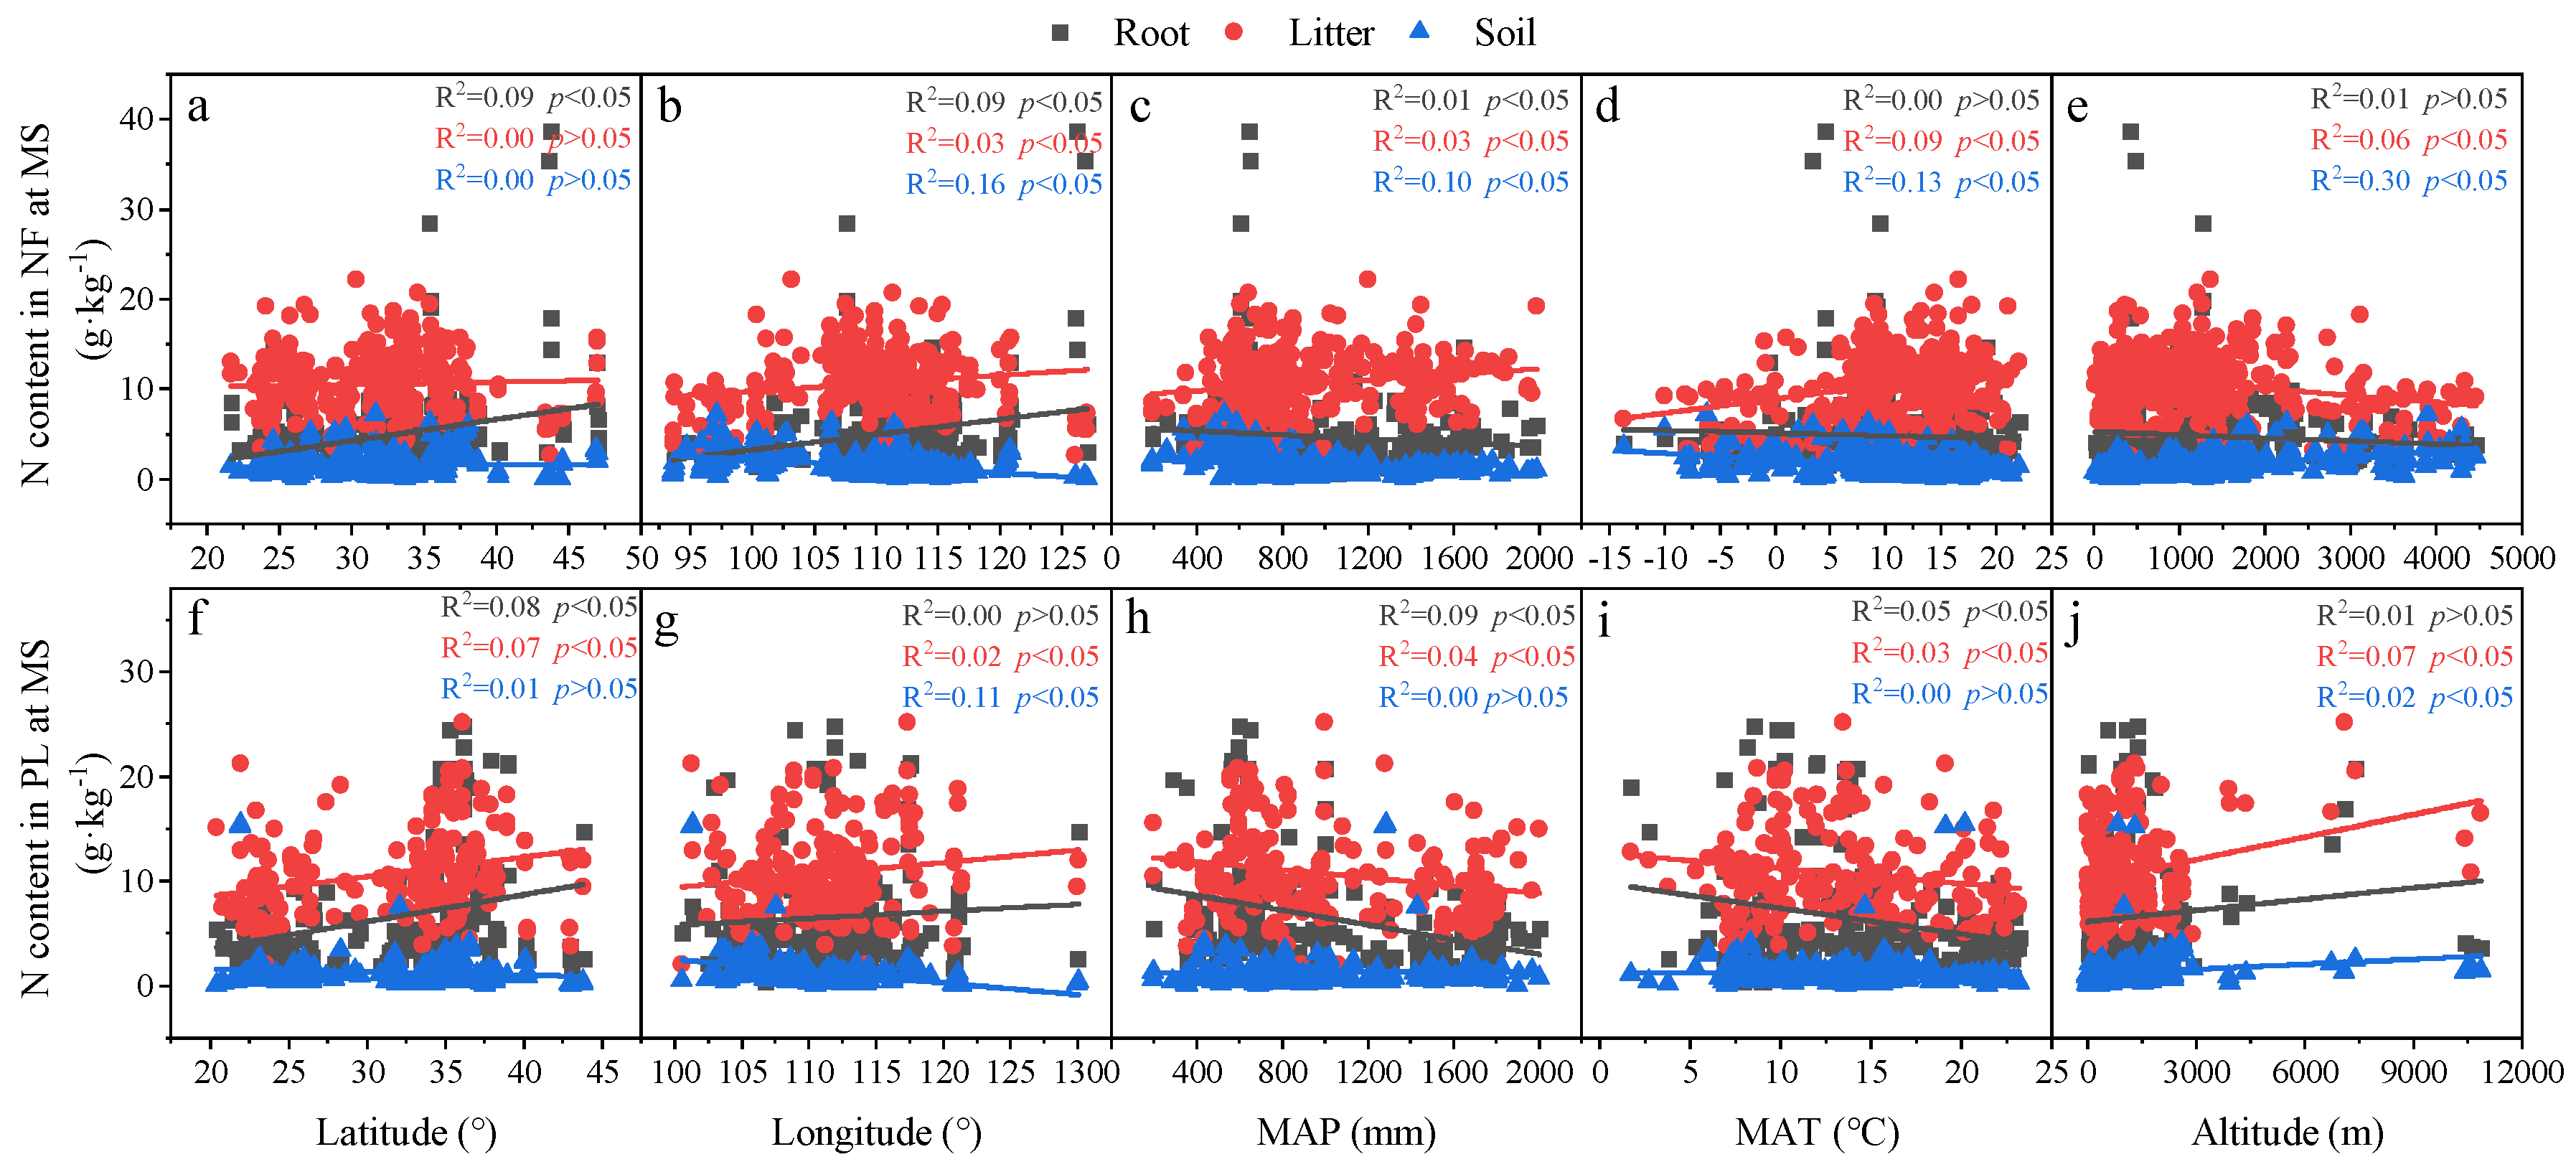
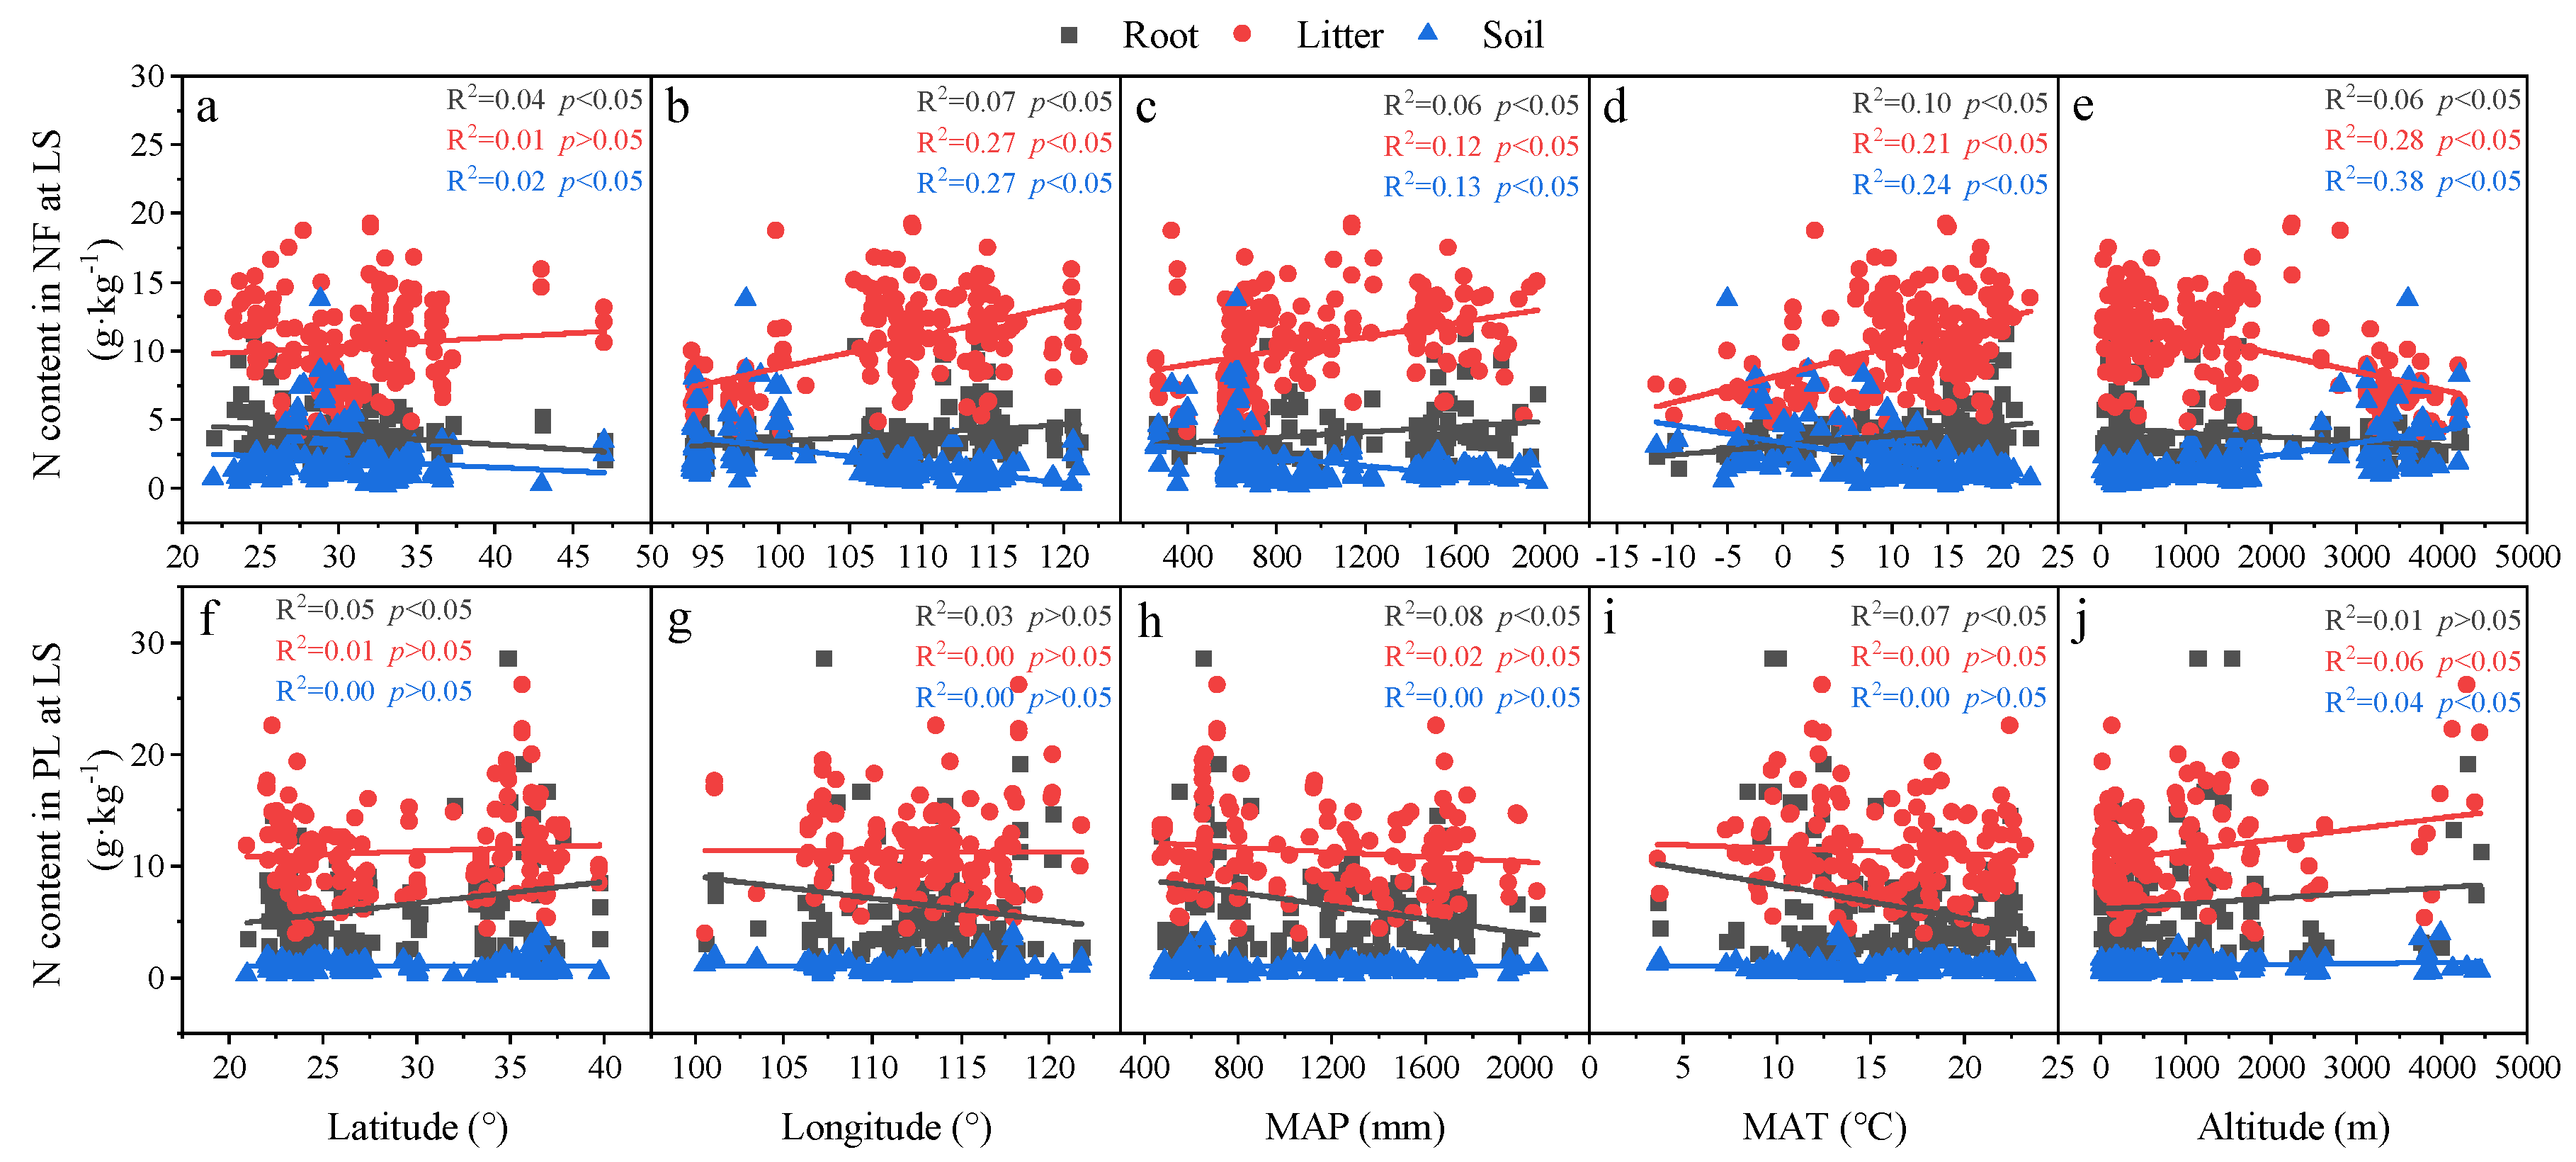
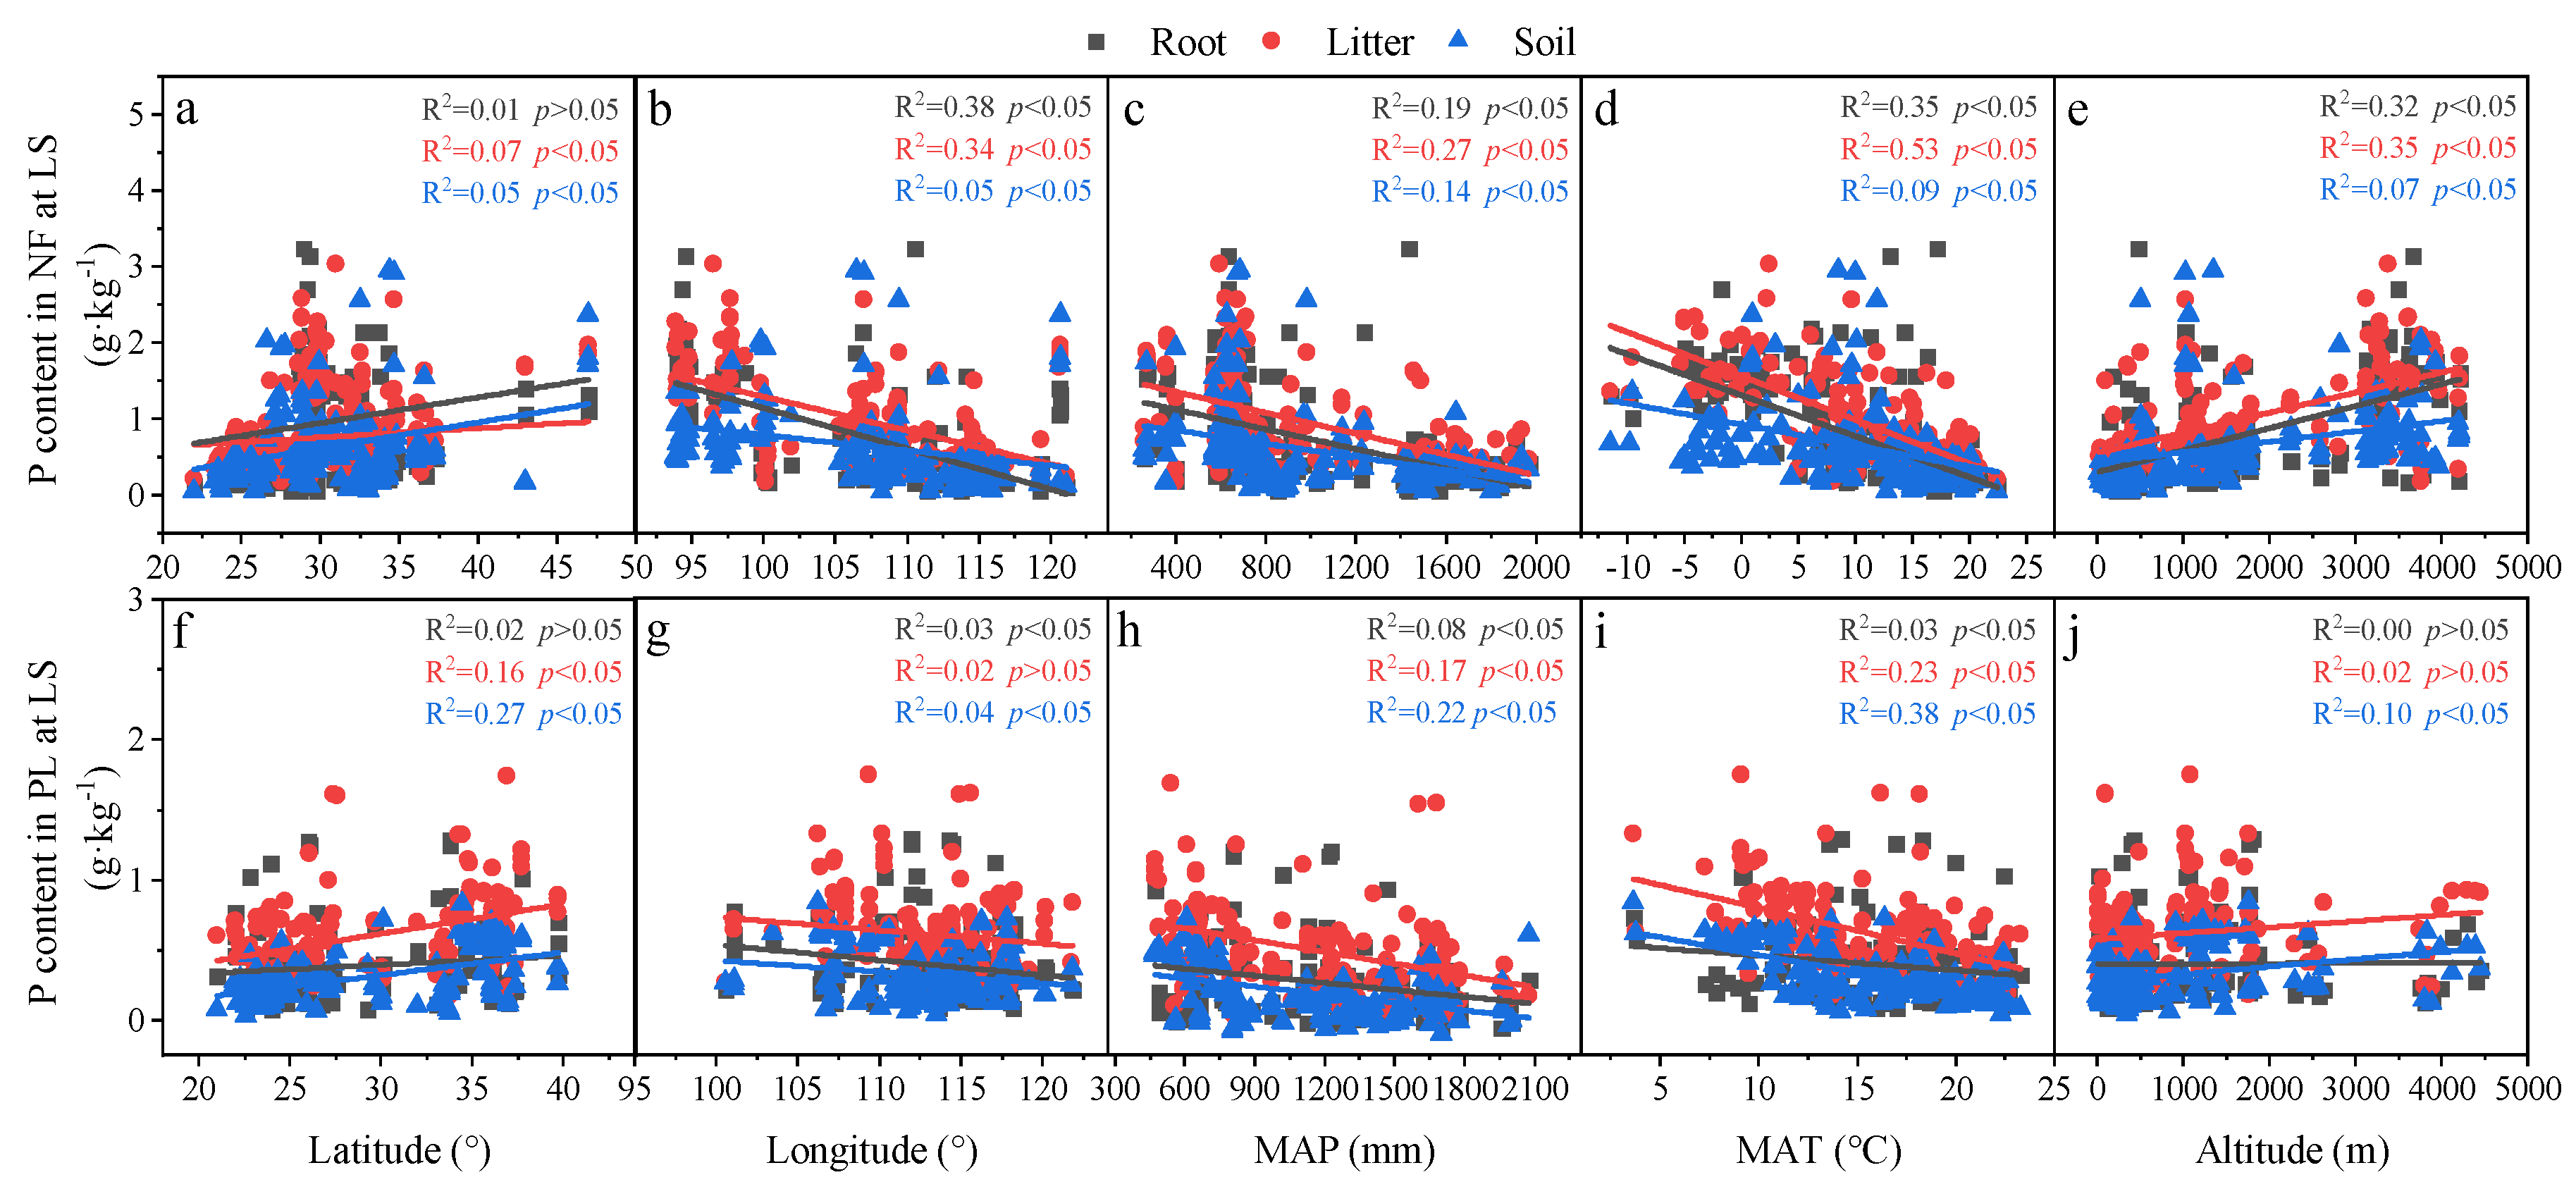
C concentrations in roots, litter and soil do not significantly change with latitude, longitude, MAP, MAT or altitude in different succession stages in PL (Figure A1, Figure A2 and Figure A3). However, in NF, litter C concentrations were positively correlated with altitude in the ES, but were significantly negatively correlated with altitude in the MS (p < 0.05) and did not change with altitude in the LS (Figure A1, Figure A2 and Figure A3). Root and litter N concentrations were significantly positively correlated with longitude, while soil N concentrations were negatively correlated with longitude over all three succession stages (p < 0.05) (Figure A4, Figure A5 and Figure A6). MAP, MAT and altitude had completely different effects on the N concentrations in roots, litter and soil in NF and PL. Overall, MAP and MAT had positive influences on root and litter N concentrations and a negative influence on the soil N concentrations in NF in all three succession stages. By contrast, MAP was inversely correlated with root and litter N concentrations and positively correlated with soil N concentrations in PL across the three successional stages (Figure A4, Figure A5 and Figure A6). MAP and MAT were significantly negatively correlated with P concentrations in roots, litter and soil in both NF and PL, while latitude had positive correlations with P concentrations in litter and soil in both NF and PL (except for litter in the ES in NF) (Figure 5, Figure 6 and Figure 7). The P concentrations of the roots were only significantly positively correlated with latitude in the MS in NF, and in both the ES and MS in PL. Furthermore, the P concentrations of the roots, litter and soil decreased markedly with longitude in both the ES and LS in NF (Figure 5 and Figure 7) (p < 0.05) but did not change with longitude in the MS (Figure 6). They increased with longitude in both the ES and MS (Figure 5 and Figure 6) (p < 0.05) but did not change with longitude in the LS in PL (Figure 7).

4. Discussion

4.1. C, N and P Concentrations and Stoichiometry in Roots, Litter and Soil in Different Forests

Ecosystem C, N and P are transferred and recycled in plants, litter and soil [23], and play an important role in maintaining the nutrient balance in forest ecosystems. For example, litter nutrients are important inputs for soil and help sustain the growth of plants [24]. Roots are not only an organ used by plants to absorb nutrients such as N and P [25], but are also an important source of nutrients themselves. Indeed, Vogt et al. [26] found that the carbon and nutrients (N and P) returned to the soil through the turnover of fine roots exceeded the ground litter in forest ecosystems on a global scale.
Our results showed that C, N and P concentrations were closely correlated between roots, litter and soil in both NF and PL (Figure 4), and significantly differed between different forest stands in China’s forest ecosystems. Root C and N concentrations in PL (451.8 g·kg−1 and 6.64 g·kg−1) were significantly higher than those in NF (443.3 g·kg−1 and 4.4 g·kg−1), and were also higher than the levels (417.8 g·kg−1 for root C, 4.87 g·kg−1 for root N) for China’s terrestrial ecosystems reported by Tang et al. [24]. By comparison, root P concentrations in PL (0.56 g·kg−1) were significantly lower than in NF (0.73 g·kg−1) (p < 0.05), and were smaller than the average root P in fine roots (0.78 g·kg−1) at a global level, as reported by Yuan et al. [27]. This may be related to the different morphological characteristics of roots and the different environment bases of the two forest stands [28,29]. Previous hypotheses have also claimed greater plant diversity with deeper roots, since more soil animals can capture and exploit P from the deeper soil [30]. Liu et al. [31] have reported for surface soil layers (0–10 cm) C (31.01 g·kg−1), N (1.71 g·kg−1) and P (0.39 g·kg−1) concentrations in China’s forests that are close to the C, N and P concentrations in the PL in our study. We found that soil C, N and P in NF were significantly higher than those in PL.
Forest restoration is the key factor affecting soil C, N and P concentrations [23]. In this study, we found that, as succession progressed, the C concentrations in roots and litter did not change significantly, while the soil C concentrations increased significantly in both NF and PL (p < 0.05). More specifically, the soil C concentrations were obviously higher in later successional stages in NF than in PL (p < 0.05). Zhou [32] have shown that old-growth forests can still accumulate carbon in soils. Our results imply that PL soils have a high C sequestration potential in China. Gu et al. [33] report that the soil physical and chemical properties change after vegetation restoration, which can be beneficial to the development of plant roots and thus to the accumulation of soil organic carbon. In addition, increases in community species richness and underground biomass may also contribute to the accumulation of soil organic carbon. N concentrations gradually increase as succession progresses, which could be attributable to nutrients released from the litter. In turn, the increase in soil N increases the soil carbon sequestration capacity of the forest [34]. However, P concentrations in roots, litter and soil significantly increase in NF as succession progresses but significantly decrease in PL. Plants have different nutrient strategies to survive and thrive in P-limited soils [35]. Previous studies have indicated that NF might obtain P from deeper layers of soil via roots and mycorrhizal fungi in the LS [22]. However, decreased P in PL might be due to its low P-retention ability, which is mainly due to the loss from erosion, harvest and the low efficiency of the P retention system. Yu et al. [22] also hypothesized that the P loss caused by horizontal (i.e., surface and subsurface runoff) and vertical (i.e., leaching into subsoils) transport played an important role in systems with low P efficiency.
C:N:P ratios are critical indicators of ecosystem processes [17]. The concentrations and stoichiometry of elements in our study between roots, litter and soil in different forest stands were highly correlated (Figure 4). From a single tissue to the entire community, a strong correlation is essential for measuring plants’ responses to global change [24]. The C:N and C:P ratios of plants reflect the efficiency of a plant’s use of N and P and their growth rates [4,36]. Litter C:N is also significantly correlated with the litter decomposition rate [6,37]. In our study, we found that root C:N and C:P ratios were higher than litter, both in NF and PL, which indicates that plants tend to recycle nutrients to ensure their growth and development [38]. As the succession/growth progressed, root C:P ratios significantly decreased (p < 0.05) in NF but significantly increased (p < 0.05) in PL, which also shows how a low-P soil environment can improve nutrient utilization efficiency in PL compared to NF. Plant N:P ratios have been proven to be useful for accessing the limitations of N and P on primary production of terrestrial ecosystems [12,18,39], in which a N:P ratio below 14 and above 16 can be used as indicators of N and P limitation, respectively [40]. Previous studies have also reported that China’s forests are more generally limited by P than by N concentrations [31]. Here we found that both the roots and litter N:P in PL were significantly higher than NF, thereby suggesting a greater P vs. N retention capacity (e.g., retranslocation) in native than planted forests. As the succession progressed, root N:P in NF did not change significantly (p > 0.05) but did significantly increase from 12.12 to 19.67 in PL. Such changes indicate that P is not the limiting nutrient in the ES in PL, but, rather, gradually becomes the limiting factor as the forest grows; this also suggests that the P retention capacity is worse in PL than in NF. As well, N gradually became the limiting nutrient in the LS in NF. In general, forests are usually limited by N in the early stage of succession and will become restricted by both N and P, or by just P, in later stages, a process that is more evident in PL (as indicated by our study). Soil C:P ratios can act as indicators of the potential of microbial mineralization in soil organic matter to release P or to absorb and store environmental P [41]. In our study we found that the soil C:P ratios in PL increased significantly as the succession progressed (p < 0.05) but did not change significantly in NF (p > 0.05). Decreasing P concentrations might therefore reduce the P availability in PL, which may further inhibit microbial activity and reduce long-term C storage capacity [42,43]. Wardle et al. [44] also found that in most long-term observational studies the N:P ratio in litter rose as the age of the soil substrate increased. This indicates that there are similar degradation trends in forest ecosystems from tropical to temperate zones, which generate a decrease in soil P availability as the succession advances. In our study, trends were observed to be more intense in PL than in NF. The frequent use of fast-growing, mostly non-native trees in plantations, above all in wet tropical and subtropical areas, tends to impoverish soil nutritional quality, which is especially evident in the case of P conservation in the plant–soil system [9,10]. Native forests, on the other hand, are generally more diverse and have several adaptations for coping with limited P availability, mainly in the late successional stages when there is a greater capacity for retaining P in the plant soil system [9,18,22].

4.2. Factors Affecting C, N and P Concentrations and Their Stoichiometry in Different Succession Stages in NF and PL

Recent analyses have shown that temperature [3,12], precipitation [18,27], functional group [31] and soil and litter nutrients [18,19,45,46] are strongly correlated with plant nutrients and stoichiometry. However, most of these previous studies have focused on changes at global or regional scales using published data and did not consider forest origins. Our results show that the changes in C concentrations along latitude, longitude, MAP and altitude gradients were similar in NF and PL. Tang et al. [20] report that vegetation and litter C concentrations decreased with increasing MAT. However, our study shows that during the three stages MAT had different effects on root and litter C concentrations in NF (negative) and PL (positive). This may be because of the differences in tree species composition in forest stands [47]. Sardans and Peñuelas [48] have demonstrated that water resources are an important driving force for increasing plant nutrient-use efficiency in ecosystems, and droughts will habitually change the internal N and P cycles in terrestrial ecosystems. Precipitation decreases from the southeast to the northwest in China, a pattern that shapes the distribution of the soil water content and further limits soil nutrient availability [49]. Certain studies report that climatic factors only have a weak impact on plant N concentrations, which are mainly determined by plant functional groups [31]. Moreover, the Temperature-Plant Physiological Hypothesis also indicates that higher N and P content help enhance the metabolic activity and growth rate of plants, which offsets the low impact of temperature at high latitude by decreasing the biochemical reaction rate of N-rich enzymes and P-rich RNA in plants [3,50]. The results of our study show that latitude and longitude affect the distribution of vegetation N content through temperature and precipitation. Moreover, MAP and MAT showed opposite effects on the root and litter N content between NF and PL, while they only had a significantly effect on the soil N content in the middle and later stage of NF. These results also suggested that plant species, rather than climatic variation, was the major determinant of plant N concentrations [51].
Like previous studies [3,12,18], climatic factors (MAT and MAP) were significantly and negatively correlated with P concentrations in both NF and PL (p < 0.05), but were related to the strong weathering and eluviation of soil in high MAT and MAP areas [52]. As succession progressed, P concentrations in root, litter and soil increased with greater longitude in the ES and MS stages in PL, but then decreased with longitude in the LS stages. However, we found that MAT, MAP, latitude, longitude and altitude all had the same effect on P concentrations in NF and PL in the LS, which indicates that geographical and climatic factors were not the reasons for differences in P concentrations between NF and PL. Yu et al. [53] have proved that high long-term N deposition significantly reduces total soil TP concentrations but has no significant influence on total soil TN concentrations, which has thus increased the C:P and N:P ratios over the past 60 years in subtropical China. These studies provide strong evidence that China’s total soil P concentrations have been decreasing over the past few decades, which has led to P limitations and higher N:P ratios in its forest ecosystems [31]. However, our results also support the idea that, given P limitation in forest ecosystems, natural forests (NF) seem to be more able to retain P than plantations (PL), which are frequently dominated by fast-growing non-native species. The overarching reason, as pointed out by Yu et al. [22], is that natural native vegetation during succession grows, retains and accumulates P from deeper soil layers and has a greater P-retention capacity [9,18,22]. However, we found that MAT, MAP, latitude, longitude and altitude all had the same effect on P concentrations in NF and PL in the LS, thus indicating that geographical and climatic factors were not the reasons for the differences in P concentrations between NF and PL. Instead, our results strongly suggest that species composition is the main cause of the different evolution of P limitation in soil in PL and in NF.

5. Conclusions

Ecological stoichiometry in forest ecosystems were different between forest origins. In this study, we found that P concentrations significantly decreased in the litter, root and soil in plantation forests (PL) as succession/growth proceeded, while the opposite occurred in natural forests (NF). Our results indicate that NF maybe more capable as growth progresses of storing P nutrients than PL. Different plant N:P ratios in NF and in PL during the progress of succession/growth also suggests that the difference between forest origins should be considered in the future research. Our study also reveals that geographical and climatic factors were not the dominant drivers of the differences in P concentrations between NF and PL in China, although more studies are still required to confirm this finding.

Author Contributions

Conceptualization, G.Z., L.L. (Lei Liu) and L.L. (Lin Li).; methodology, L.L. (Lin Li). and Q.C.; formal analysis, L.L. (Lin Li); writing—original draft preparation, L.L. (Lin Li) and L.L. (Lei Liu).; writing—review and editing, Z.Y., J.P., J.S., J.X. and G.Z.; supervision, L.L. (Lei Liu) and G.Z.; funding acquisition, G.Z. All authors have read and agreed to the published version of the manuscript.

Funding

This research was funded by the China National Science Foundation (No. 42130506), the Startup Foundation for Introducing Talent of NUIST (No. 2019r065) and Ministry of Science and Technology of China (No. G2021014071L). J.P. and J.S. were financially supported by the Spanish Government project PID2019-110521GB-I00, the Catalan government project SGR2017-1005, and the Fundación Ramón Areces project CIVP20A6621.

Informed Consent Statement

Informed consent was obtained from all subjects involved in the study.

Data Availability Statement

By 2022, the data will available for download at the website: http://dhf.cern.ac.cn/meta/metaData, accessed on 16 January 2021.

Acknowledgments

We thank field data collection efforts from Jingyun Fang, Guirui Yu, Gengxu Wang, Keping Ma, Shenggong Li, Sheng Du, Shijie Han, Youxin Ma, Deqiang Zhang, Shizhong Liu, Guowei Chu, Qianmei Zhang and Yuelin Li.

Conflicts of Interest

The authors declare no conflict of interest.

Abbreviations

The following abbreviations are used in this manuscript:
CCarbon
NNitrogen
PPhosphorus
NFNatural forests
PLPlantation forests
ESEarly stage
MSMiddle stage
LSLate stage
MATMean annual temperature
MAPMean annual precipitation

Appendix A

Table A1. Tree species of each growth stages in NF and PL.
Forest OriginnGrowth StagesNDominant Species
NF667ES149Quercus wutaishansea Mary, Populus simonii Carr, Betula platyphylla Suk., Betula albosinensis Burk., Quercus variabilis Bl., Quercus acutissima Carruth., Pinus tabuliformis Carr., Pinus massoniana Lamb., Quercus glandulifera var. brevipetiolata Nakai, Abies fabri (Mast.) Craib, Quercus semicarpifolia Smith, Pinus yunnanensis Franch., Cyclobalanopsis glauca (Thunb.) Oerst., Lithocarpus glaber (Thunb.) Nakai, Pinus densata Mast., Picea spinulosa (Griff.) A. Henry, Cunninghamia lanceolata (Lamb.) Hook., Abies georgei Orr var. smithii (Viguie et Gaussen) Cheng et L.
MS344Fraxinus rhynchophylla Hance, Quercus mongolica Fisch. ex Ledeb, Juglans mandshurica Maxim., Populus davidiana Dode, Betula dahurica Pall., Quercus aliena Bl. var. acuteserrata Maxim. ex Wenz., Robinia pseudoacacia L., Betula platyphylla Suk., Quercus wutaishansea Mary, Pinus armandii Franch., Pinus tabuliformis Carr., Picea crassifolia Kom., Sabina przewalskii Kom., Larix gmelinii (Rupr.) Kuzen., Quercus acutissima Carruth., Acer ginnala Maxim., Quercus variabilis Bl., Juniperus formosana Hayata, Quercus aliena Bl. var. acuteserrata Maxim. ex Wenz., Vernicia fordii (Hemsl.) Airy Shaw, Populus tomentosa Carr, Pinus tabuliformis var. henryi (Masters) C. T. Kuan, Cunninghamia lanceolata (Lamb.) Hook., Pinus massoniana Lamb., Bothrocaryum controversum, Abies fabri (Mast.) Craib, Pinus yunnanensis Franch., Quercus semicarpifolia Smith, Abies georgei Orr var. smithii (Viguie et Gaussen) Cheng et L., Picea spinulosa (Griff.) A. Henry
LS174Ulmus pumila L., Larix gmelinii (Rupr.) Kuzen., Quercus variabilis Bl., Cyclobalanopsis glauca (Thunb.) Oerst., Quercus aliena Bl. var. acuteserrata Maxim. ex Wenz., Pinus tabuliformis Carr., Picea crassifolia Kom., Pinus armandii Franch., Platycladus orientalis (L.) Franco, Quercus wutaishansea Mary, Betula albosinensis Burk., Quercus acutissima Carruth., Quercus aliena Bl. var. acuteserrata Maxim. ex Wenz., Pinus massoniana Lamb., Liquidambar formosana Hance, Quercus glandulifera var. brevipetiolata Nakai, Pinus yunnanensis Franch., Schima superba Gardn. et Champ., Loropetalum chinense (R. Br.) Oliver, Castanopsis fargesii Franch., Bothrocaryum controversum, Castanopsis sclerophylla (Lindl.) Schott., Cinnamomum porrectum (Roxb.) Kosterm., Castanopsis hystrix J. D. Hooker et Thomson ex A. De Candolle, Castanopsis carlesii (Hemsl.) Hayata., Cunninghamia lanceolata (Lamb.) Hook., Abies georgei Orr, Abies delavayi Franch., Abies georgei Orr var. smithii (Viguie et Gaussen) Cheng et L., Pinus densata Mast., Quercus semicarpifolia Smith, Picea spinulosa (Griff.) A. Henry
PL445ES102Larix gmelinii (Rupr.) Kuzen., Populus gansuensis C. Wang et H. L. Yang, Robinia pseudoacacia L., Platycladus orientalis (L.) Franco, Pinus tabuliformis Carr., Populus simonii Carr, Betula albosinensis Burk., Populus euramericana cv.‘I-214’, Pinus massoniana Lamb., Abies fabri (Mast.) Craib, Quercus semicarpifolia Smith, Cinnamomum camphora (L.) Presl., Pinus yunnanensis Franch., pinus elliottii, Eucalyptus robusta Smith, Cunninghamia lanceolata (Lamb.) Hook., Acacia mangium Willd., Schima superba Gardn. et Champ., E. urophylla × E. grandis
MS199Larix gmelinii (Rupr.) Kuzen., Pinus sylvestris var. mongolica Litv., Picea asperata Mast., Pinus tabuliformis Carr., Larix gmelinii var. principis-rupprechtii (Mayr) Pilger, Robinia pseudoacacia L., Larix kaempferi (Lamb.) Carr., Pinus thunbergii Parlatore, Quercus acutissima Carruth., Styphnolobium japonicum (L.) Schott, Populus tomentosa Carr, Quercus aliena Bl. var. acuteserrata Maxim. ex Wenz., Populus tomentosa Carr, Quercus variabilis Bl., Cunninghamia lanceolata (Lamb.) Hook., Cupressus funebris Endl., Eucalyptus robusta Smith, Acacia mangium Willd.
LS144Pinus tabuliformis Carr., Larix gmelinii (Rupr.) Kuzen., Populus davidiana Dode, Pinus densiflora Sieb. et Zucc., Platycladus orientalis (L.) Franco, Pinus thunbergii Parlatore, Populus simonii Carr, Populus cathayana Rehd., Populus tomentosa Carr, Larix kaempferi (Lamb.) Carr., Cunninghamia lanceolata (Lamb.) Hook., Pinus massoniana Lamb., pinus elliottii, Cinnamomum camphora (L.) Presl., Quercus variabilis Bl., Loropetalum chinense (R. Br.) Oliver, Acacia mangium Willd., Schima superba Gardn. et Champ., Liquidambar formosana Hance
Figure A1. C content changes with latitude (a,f), longitude (b,g), mean annual precipitation (MAP) (c,h), mean annual temperature (MAT) (d,i) and altitude (e,j) in different forest origins in the early stage (ES). The number of forest sites are 149 and 102 for NF−ES and PL−ES, respectively.
Forests 13 00755 g0a1
Figure A2. C content changes with latitude (a,f), longitude (b,g), mean annual precipitation (MAP) (c,h), mean annual temperature (MAT) (d,i) and altitude (e,j) in different forest origins in the middle stage (MS). The number of forest sites are 344 and 199 for NF−MS and PL−MS, respectively.
Forests 13 00755 g0a2
Figure A3. C content changes with latitude (a,f), longitude (b,g), mean annual precipitation (MAP) (c,h), mean annual temperature (MAT) (d,i) and altitude (e,j) in different forest origins in the late stage (LS). The number of forest sites are 114 and 144 for NF−LS and PL−LS, respectively.
Forests 13 00755 g0a3
Figure A4. N content changes with latitude (a,f), longitude (b,g), mean annual precipitation (MAP) (c,h), mean annual temperature (MAT) (d,i) and altitude (e,j) in different forest origins in the early stage (ES). The number of forest sites are 149 and 102 for NF−ES and PL−ES, respectively.
Forests 13 00755 g0a4
Figure A5. N content changes with latitude (a,f), longitude (b,g), mean annual precipitation (MAP) (c,h), mean annual temperature (MAT) (d,i) and altitude (e,j) in different forest origins in the middle stage (MS). The number of forest sites are 344 and 199 for NF−MS and PL−MS, respectively.
Forests 13 00755 g0a5
Figure A6. N content changes with latitude (a,f), longitude (b,g), mean annual precipitation (MAP) (c,h), mean annual temperature (MAT) (d,i) and altitude (e,j) in different forest origins in the late stage (LS). The number of forest sites are 114 and 144 for NF−LS and PL−LS, respectively.
Forests 13 00755 g0a6

References

  1. Reich, P.B.; Tjoelker, M.; Machado, J.L.; Oleksyn, J. Universal scaling of respiratory metabolism, size and nitrogen in plants. Nature 2006, 439, 457–461. [Google Scholar] [CrossRef] [PubMed]
  2. Sterner, R.; Elser, J.J. Ecological Stoichiometry: The Biology of Elements from Molecules to the Biosphere; Princeton University Press: Princeton, NJ, USA, 2002; p. 439. [Google Scholar]
  3. Reich, P.B.; Oleksyn, J. Global patterns of plant leaf N and P in relation to temperature and latitude. Proc. Natl. Acad. Sci. USA 2004, 101, 11001–11006. [Google Scholar] [CrossRef] [PubMed] [Green Version]
  4. Elser, J.J.; Dobberfuhl, D.R.; Mackay, N.A.; Schampel, J.H. Organism size, life history, and N:P stoichiometry. Bioscience 1996, 46, 674–684. [Google Scholar] [CrossRef] [Green Version]
  5. Chapin, F.S.; Matson, P.A.; Vitousek, P.M. Principles of Terrestrial Ecosystem Ecology; Springer: Berlin/Heidelberg, Germany, 2012; pp. 369–397. [Google Scholar]
  6. Schreeg, L.A.; Santiago, L.S.; Wright, S.J.; Turner, B.L. Stem, root, and older leaf N:P ratios are more responsive indicators of soil nutrient availability than new foliage. Ecology 2014, 95, 2062–2068. [Google Scholar] [CrossRef] [Green Version]
  7. Zeng, Z.X.; Wang, K.L.; Zeng, F.P.; Song, X.L.; Song, X.J. Litter decomposition and nutrient release in typical secondary and primary forests in karst region, Northwest of Guangxi. Acta. Ecol. Sin. 2012, 32, 2720–2728. [Google Scholar] [CrossRef] [Green Version]
  8. Ngaba, M.J.Y.; Hu, Y.L.; Bol, R.; Ma, X.Q.; Jin, S.F.; Mgelwa, A.S. Effects of land use change from natural forest to plantation on C, N and natural abundance of 13C and 15N along a climate gradient in eastern China. Sci. Rep. 2019, 9, 16516–16518. [Google Scholar] [CrossRef]
  9. Sheng, W.T. On the Maintenance of Long-term Productivity of Plantation in China. Forest. Res. 2018, 31, 1–14. [Google Scholar]
  10. Yu, Z.; Zhao, H.; Liu, S.; Zhou, G.; Fang, J.; Yu, G.; Tang, X.; Wang, W.; Yan, J.; Wang, G.; et al. Mapping forest type and age in China’s plantations. Sci. Total Environ. 2020, 744, 140790. [Google Scholar] [CrossRef]
  11. Ostertag, R.; DiManno, N.M. Detecting terrestrial nutrient limitation: A global meta-analysis of foliar nutrient concentrations after fertilization. Front. Earth. Sci. 2016, 4, 23. [Google Scholar] [CrossRef] [Green Version]
  12. Han, W.X.; Fang, J.Y.; Guo, D.L.; Zhang, Y. Leaf nitrogen and phosphorus stoichiometry across 753 terrestrial plant species in China. New. Phytol. 2005, 168, 377–385. [Google Scholar] [CrossRef]
  13. Xu, S.; Sardans, J.; Zhang, J.L.; Penuelas, J. Variations in foliar carbon:nitrogen and nitrogen:phosphorus ratios under global change: A meta-analysis of experimental field studies. Sci. Rep. 2020, 10, 12156. [Google Scholar] [CrossRef] [PubMed]
  14. Sophie, Z.B.; Maria, K.K.; Maria, M.; Josep, P.; Andreas, R.; Sardans, J.; Wolfgang, W. The application of ecological stoichiometry to plant–microbial–soil organic matter transformations. Ecol. Monogr. 2016, 85, 133–155. [Google Scholar]
  15. Güsewell, S. N: P ratios in terrestrial plants: Variation and functional significance. New Phytol. 2004, 164, 243–266. [Google Scholar] [CrossRef] [PubMed]
  16. Yuan, Z.Y.; Chen, H.Y.H. Global trends in senesced-leaf nitrogen and phosphorus. Glob. Ecol. Biogeogr. 2009, 18, 532–542. [Google Scholar] [CrossRef]
  17. Yuan, Z.Y.; Chen, H.Y.H. Decoupling of nitrogen and phosphorus in terrestrial plants associated with global changes. Nat. Clim. Change 2015, 5, 465–469. [Google Scholar] [CrossRef]
  18. Townsend, A.R.; Cleveland, C.C.; Asner, G.P.; Bustamante, M.M.C. Controls over foliar N:P ratios in tropical rain forests. Ecology 2007, 88, 107–118. [Google Scholar] [CrossRef]
  19. Bai, X.J.; Wang, B.R.; An, S.S.; Zeng, Q.C.; Zhang, H.X. Response of forest species to C:N:P in the plant-litter-soil system and stoichiometric homeostasis of plant tissues during afforestation on the Loess Plateau, China. Catena 2019, 183, 104186. [Google Scholar] [CrossRef]
  20. Tang, X.L.; Zhao, X.; Bai, Y.F.; Tang, Z.Y.; Wang, W.T.; Zhao, Y.C.; Wan, H.W.; Xie, Z.Q.; Shi, X.Z.; Wu, B.F.; et al. Carbon pools in China’s terrestrial ecosystems: New estimates based on an intensive field survey. Proc. Natl. Acad. Sci. USA 2018, 115, 4021–4026. [Google Scholar] [CrossRef] [Green Version]
  21. Jones, J.B. Laboratory Guide for Conducting Soil Tests and Plant Analysis; CRC Press: Boca Raton, FL, USA, 2001; pp. 14, 31, 43, 47. [Google Scholar]
  22. Yu, Z.; Zhou, G.Y.; Liu, L.; Manzoni, S.; Ciais, P.; Goll, D.; Peñuelas, J.; Sardans, J.; Wang, W.T.; Zhu, J.; et al. Natural forests promote phosphorus retention in soil. Glob. Change Biol. 2021, 28, 1678–1689. [Google Scholar] [CrossRef]
  23. Wang, S.Q.; Yu, G.R. Ecological stoichiometry characteristics of ecosystem carbon, nitrogen and phosphorus elements. Acta Ecol. Sin. 2008, 28, 457–467. [Google Scholar]
  24. Tang, Z.Y.; Xu, W.T.; Zhou, G.Y.; Bai, Y.F.; Li, J.X.; Tang, X.L.; Chen, D.M.; Liu, Q.; Ma, W.H.; Xiong, G.M.; et al. Patterns of plant carbon, nitrogen, and phosphorus concentration in relation to productivity in China’s terrestrial ecosystems. Proc. Natl. Acad. Sci. USA 2018, 115, 4033–4038. [Google Scholar] [CrossRef] [PubMed] [Green Version]
  25. Mcclaugherty, C.A.; Aber, J.D.; Melillo, J.M. The role of fine roots in the organic matter and nitrogen budgets of two forested ecosystems. Ecology 1982, 63, 1481–1490. [Google Scholar] [CrossRef] [Green Version]
  26. Vogt, K.A.; Grier, C.C.; Vogt, D.J. Production, turnover and nutrient dynamics of above- and below-ground detritus of world forests. Adv. Ecol. Res. 1986, 15, 3030–3377. [Google Scholar]
  27. Yuan, Z.Y.; Chen, H.Y.H.; Reich, P.B. Global-scale latitudinal patterns of plant fine-root nitrogen and phosphorus. Nat. Commun. 2011, 2, 344. [Google Scholar] [CrossRef] [Green Version]
  28. Beyer, F.; Hertel, D.; Leuschner, C. Fine root morphological and functional traits in Fagus sylvatica and Fraxinus excelsior saplings as dependent on species, root order and competition. Plant. Soil. 2013, 373, 143–156. [Google Scholar] [CrossRef]
  29. Guo, L.B.; Halliday, M.J.; Gifford, R.M. Fine root decomposition under grass and pine seedlings in controlled environmental conditions. Appl. Soil Ecol. 2006, 33, 22–29. [Google Scholar] [CrossRef]
  30. Jobbágy, E.G.; Jackson, R.B. The distribution of soil nutrients with depth: Global patterns and the imprint of plants. Biogeochemistry 2001, 53, 51–77. [Google Scholar] [CrossRef]
  31. Liu, J.X.; Fang, X.; Tang, X.L.; Wang, W.T.; Zhou, G.Y.; Xu, S.; Huang, W.J.; Wang, G.X.; Yan, J.H.; Ma, K.P.; et al. Patterns and controlling factors of plant nitrogen and phosphorus stoichiometry across China’s forests. Biogeochemistry 2019, 143, 191–205. [Google Scholar] [CrossRef]
  32. Zhou, G.Y. Old-growth forests can accumulate carbon in soils. Science 2006, 314, 1417. [Google Scholar] [CrossRef] [Green Version]
  33. Gu, X.; Zhang, S.J.; Liu, Z.D.; Li, L.D.; Chen, J.L.; Wang, L.F.; Fang, X. Effects of vegetation restoration on soil organic carbon concentration and density in the mid-subtropical region of China. Acta Ecol. Sin. 2018, 42, 595–608. [Google Scholar]
  34. Liu, S.R.; Wang, H.; Luan, J.W. A review of research progress and future prospective of forest soil carbon stock and soil carbon process in China. Acta Ecol. Sin. 2011, 31, 5437–5448. [Google Scholar]
  35. Lambers, H.; Bishop, J.G.; Hopper, S.D.; Laliberté, E.; Zúñiga-Feest, A. Phosphorus-mobilization ecosystem engineering: The roles of cluster roots and carboxylate exudation in young P-limited ecosystems. Ann. Bot. 2012, 110, 329–348. [Google Scholar] [CrossRef] [PubMed] [Green Version]
  36. Ren, Y.; Gao, G.L.; Ding, G.D.; Zhang, Y.; Guo, M.S.; Cao, H.Y.; Su, M. Stoichiometric characteristics of nitrogen and phosphorus in leaf-litter-soil system of Pinus sylvestris var. mongolica plantations. Chin. J. Appl. Ecol. 2019, 30, 36–43. [Google Scholar]
  37. Koerselman, W.; Meuleman, A.F.M. The vegetation N:P ratio: A new tool to detect the nature of nutrient limitation. J. Appl. Ecol. 1996, 33, 1441–1450. [Google Scholar] [CrossRef]
  38. Sardans, J.; Penuelas, J. Tree growth changes with climate and forest type are associated with relative allocation of nutrients, especially phosphorus, to leaves and wood. Glob. Ecol. Biogeogr. 2013, 22, 14. [Google Scholar] [CrossRef]
  39. Tessier, J.T.; Raynal, D.J. Use of nitrogen to phosphorus ratios in plant tissue as an indicator of nutrient limitation and nitrogen saturation. J. Appl. Ecol. 2003, 40, 523–534. [Google Scholar] [CrossRef]
  40. Güsewell, S.; Koerselman, W.; Verhoeven, J. Biomass N:P ratios as indicators of nutrient limitation for plant populations in wetlands. Ecol. Appl. 2003, 13, 372–384. [Google Scholar] [CrossRef]
  41. Chen, W.X. Soil and Environmental Microbiology; Beijing Agricultural University Press: Beijing, China, 1990. [Google Scholar]
  42. Herbert, D.A.; Williams, M.; Rastetter, E.B. A model analysis of N and P limitation on carbon accumulation in Amazonian secondary forest after alternate land-use abandonment. Biogeochemistry 2003, 65, 121–150. [Google Scholar] [CrossRef]
  43. Mckane, R.B.; Rastetter, E.B.; Melillo, J.M.; Shaver, G.R.; Hopkinson, C.S.; Fernandes, D.N.; Skole, D.L.; Chomentowski, W.H. Effects of global change on carbon storage in tropical forests of South America. Glob. Biogeochem. Cycles 1995, 9, 329–350. [Google Scholar] [CrossRef]
  44. Wardle, D.A.; Walker, L.R.; Bardgett, R.D. Ecosystem properties and forest decline in contrasting long-term chronosequences. Science 2004, 305, 509–513. [Google Scholar] [CrossRef] [Green Version]
  45. Zhang, S.B.; Zhang, J.L.; Slik, J.F.; Cao, K.F. Leaf element concentrations of terrestrial plants across China are influenced by taxonomy and the environment. Glob. Ecol. Biogeogr. 2012, 21, 809–818. [Google Scholar] [CrossRef]
  46. Ordoñez, J.C.; Bodegom, P.; Witte, J.; Wright, I.J.; Reich, P.B.; Aerts, R. A global study of relationships between leaf traits, climate and soil measures of nutrient fertility. Glob. Ecol. Biogeogr. 2010, 18, 137–149. [Google Scholar] [CrossRef]
  47. Li, Y.Y.; Zheng, J.Y.; Shao, M.A. Comparison of the Attributes of Natural Forests and Plantations in Ziwuling Mountain. Acta Biol. Boreali-Occident. Sin. 2005, 25, 2447–2456. [Google Scholar]
  48. Sardans, J.; Penuelas, J. The role of plants in the effects of global change on nutrient availability and stoichiometry in the plant-soil system. Plant Physiol. 2012, 160, 1741–1761. [Google Scholar] [CrossRef] [PubMed] [Green Version]
  49. He, M.Z.; Dijkstra, F.A. Drought effect on plant nitrogen and phosphorus: A meta-analysis. New. Phytol. 2014, 204, 924–931. [Google Scholar] [CrossRef] [PubMed]
  50. Weih, M.; Karlsson, P.S. Growth response of Mountain birch to air and soil temperature: Is increasing leaf-nitrogen content an acclimation to lower air temperature? New Phytol. 2001, 150, 147–155. [Google Scholar] [CrossRef]
  51. Luo, W.; Elser, J.J.; Lü, X.T.; Wang, Z.; Bai, E.; Yan, C.; Wang, C.; Li, M.-H.; Zimmermann, N.E.; Han, X.; et al. Plant nutrients do not covary with soil nutrients under changing climatic conditions. Glob. Biogeochem. Cycles 2015, 29, 1298–1308. [Google Scholar] [CrossRef] [Green Version]
  52. Vitousek, P.M.; Porder, S.; Houlton, B.Z.; Chadwick, O.A. Terrestrial phosphorus limitation: Mechanisms, implications, and nitrogen–phosphorus interactions. Ecol. Appl. 2010, 20, 5–15. [Google Scholar] [CrossRef] [Green Version]
  53. Yu, Z.P.; Wang, M.H.; Huang, Z.Q.; Lin, T.C.; Vadeboncoeur, M.A.; Searle, E.B.; Chen, H.Y.H. Temporal changes in soil C-N-P stoichiometry over the past 60 years across subtropical China. Glob. Change Biol. 2017, 24, 1308–1320. [Google Scholar] [CrossRef]
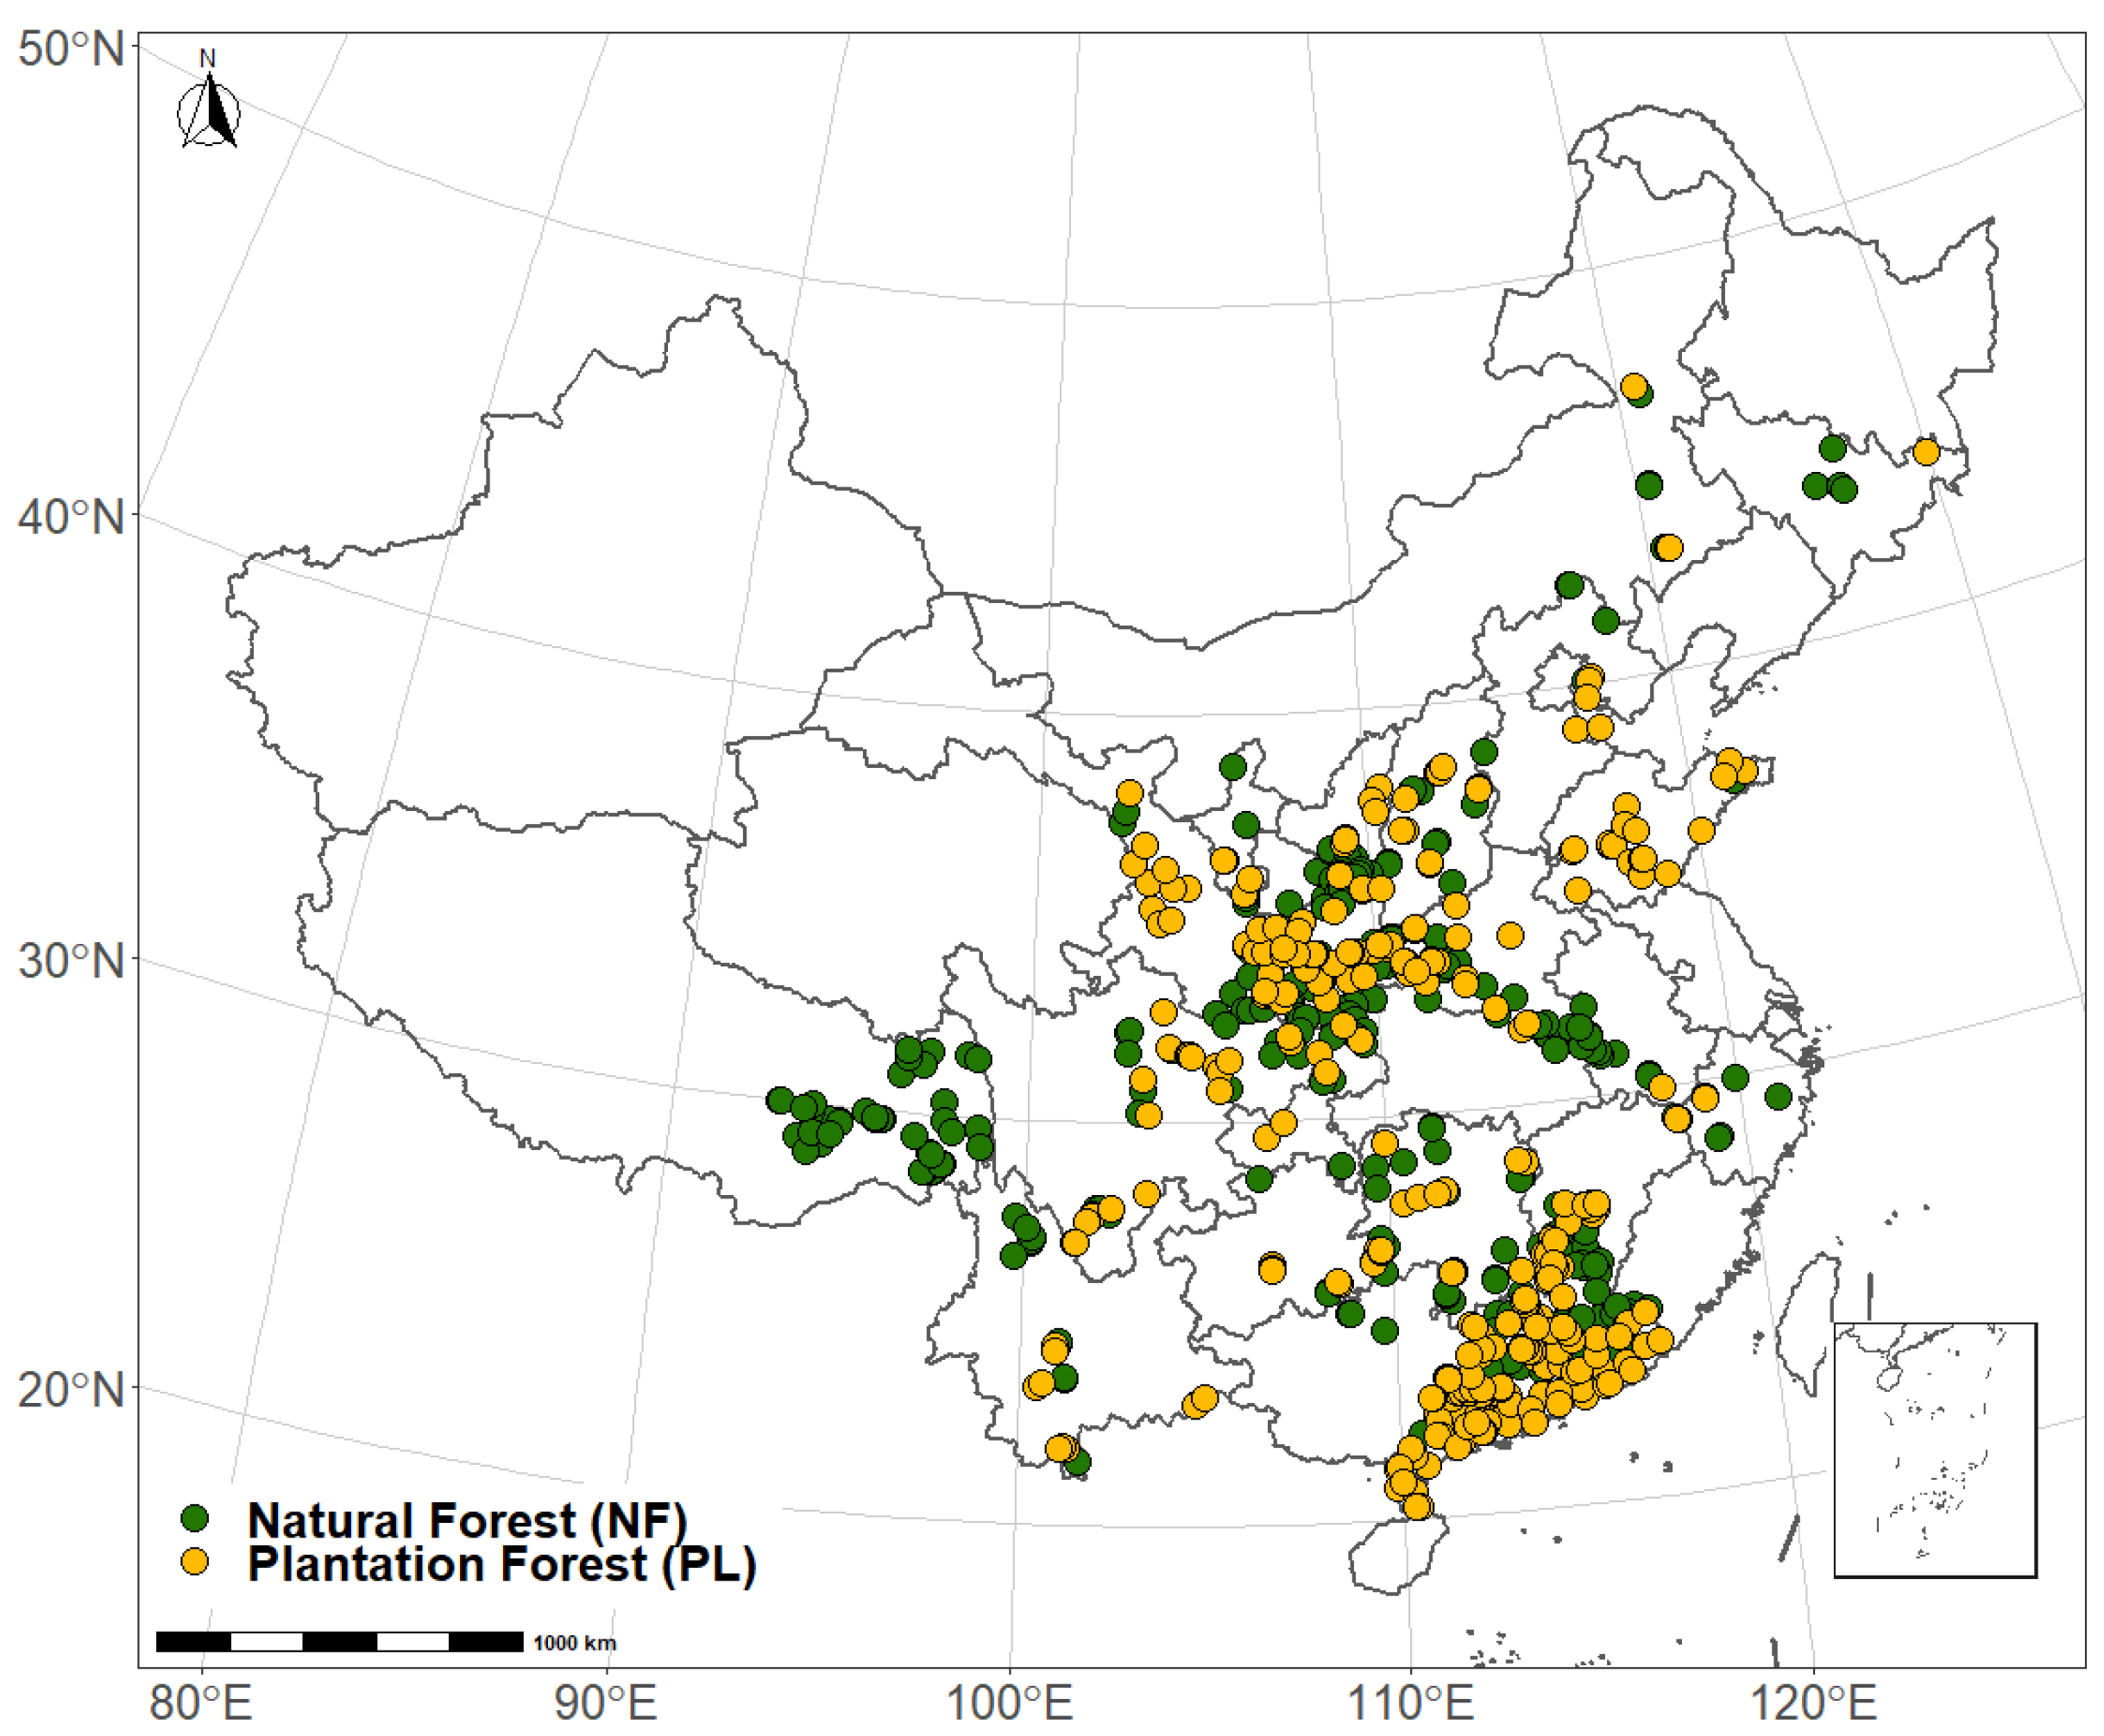
Figure 1. Sampling locations of the natural forests and plantations in this study.
Forests 13 00755 g001
Figure 2. C, N and P concentrations in roots (ac), litter (df) and soil (gi) in different succession stages in NF and PL. Note: The error bars indicate standard errors of the means. Capital letters indicate significant differences in concentrations in different forest origins at the same succession stage (p < 0.05), while lowercase letters indicate significant differences in concentrations in the same forest origin at different succession stages (p < 0.05); n = 149, 344, 174, 102, 199 and 144 for NF−ES, NF−MS, NF−LS, PL−ES, PL−MS and PL−LS, respectively.
Forests 13 00755 g002
Figure 3. C, N and P stoichiometry in roots (ac), litter (df) and soil (gi) in different succession stages in NF and PL. Note: The error bars indicate standard errors of the means. Capital letters indicate significant differences in concentrations in different forest origins in the same succession stage (p < 0.05), while lowercase letters indicate significant differences in concentrations in the same forest origin at different succession stages (p < 0.05); n = 149, 344, 174, 102, 199 and 144 for NF−ES, NF−MS, NF−LS, PL−ES, PL−MS and PL−LS, respectively.
Forests 13 00755 g003
Figure 4. Pearson’s correlation matrix between plant root, litter and soil C, N and P concentrations and stoichiometric ratios in NF and PL. (a,b) The correlation between the concentrations of C, N and P and the stoichiometric ratios of C:N, C:P and N:P in roots, litter and soil in NF; (c,d) the correlation between the concentrations of C, N and P and the stoichiometric ratios of C:N, C:P and N:P in roots, litter and soil in PL. * p < 0.05, ** p < 0.01,*** p < 0.001.
Forests 13 00755 g004
Figure 5. P concentration changes with latitude (a,f), longitude (b,g), mean annual precipitation (MAP) (c,h), mean annual temperature (MAT) (d,i) and altitude (e,j) in different forest origins in the early stage (ES). The numbers of forest sites are 149 and 102 for NF−ES and PL−ES, respectively.
Forests 13 00755 g005
Figure 6. P concentration changes with latitude (a,f), longitude (b,g), mean annual precipitation (MAP) (c,h), mean annual temperature (MAT) (d,i) and altitude (e,j) in different forest origins in the middle stage (MS). The numbers of forest sites are 344 and 199 for NF−MS and PL−MS, respectively.
Forests 13 00755 g006
Figure 7. P concentration changes with latitude (a,f), longitude (b,g), mean annual precipitation (MAP) (c,h), mean annual temperature (MAT) (d,i) and altitude (e,j) in different forest origins in the late stage (LS). The numbers of forest sites are 114 and 144 for NF−LS and PL−LS, respectively.
Forests 13 00755 g007
Table 1. Concentrations of C, N, and P in roots, litter and soil in NF and PL in forest ecosystems in China.
ParameterForest OriginC Concentration
(g·kg−1)
N Concentration
(g·kg−1)
P Concentration
(g·kg−1)
RootNF443.30 ± 1.87 B4.4 ± 0.12 B0.73 ± 0.03 A
PL451.80 ± 2.41 A6.64 ± 0.26 A0.56 ± 0.03 B
LitterNF412.71 ± 2.69 A10.48 ± 0. 13 B0.93 ± 0.03 A
PL410.40 ± 4.05 A10.96 ± 0.19 A0.71 ± 0.02 B
SoilNF22.00 ± 0.83 A1.56 ± 0.05 A0.48 ± 0.02 A
PL16.83 ± 0.69 B1.14 ± 0.06 B0.39 ± 0.01 B
Note: Capital letters indicate significant differences in C, N and P concentrations in roots, litter and soil between different forest origins (p < 0.05); n = 667 and 445 for NF and PL, respectively.
Table 2. Stoichiometry of the C, N, and P in roots, litter and soil in NF and PL in forest ecosystems in China.
ParameterForest
Origin
C:N RatioC:P RatioN:P Ratio
RootNF128.71 ± 2.70 A1352.19 ± 62.18 A11.86 ± 0.45 B
PL109.79 ± 4.16 B1421.91 ± 50.82 A16.56 ± 0.65 A
LitterNF46.19 ± 1.02 A674.38 ± 20.95 B16.19 ± 0.42 B
PL43.74 ± 1.11 A853.67 ± 36.52 A19.22 ± 0.48 A
SoilNF17.58 ± 0.75 A64.18 ± 5.76 A4.20 ± 0.40 A
PL19.21 ± 1.27 A60.64 ± 2.62 A3.79 ± 0.18 A
Note: Capital letters indicate significant differences in the C, N and P stoichiometry of roots, litter and soil between the different forest origins (p < 0.05); n = 667 and 445 for NF and PL, respectively.
Publisher’s Note: MDPI stays neutral with regard to jurisdictional claims in published maps and institutional affiliations.