
Robinia pseudoacacia Seedlings Are More Sensitive to Rainfall Frequency Than to Rainfall Intensity


 , ,
, ,
Abstract
:1. Introduction
2. Materials and Methods
2.1. Study Site
2.2. Plant Materials
2.3. Experimental Design
2.4. Measurements
2.5. Statistical Analysis
3. Results
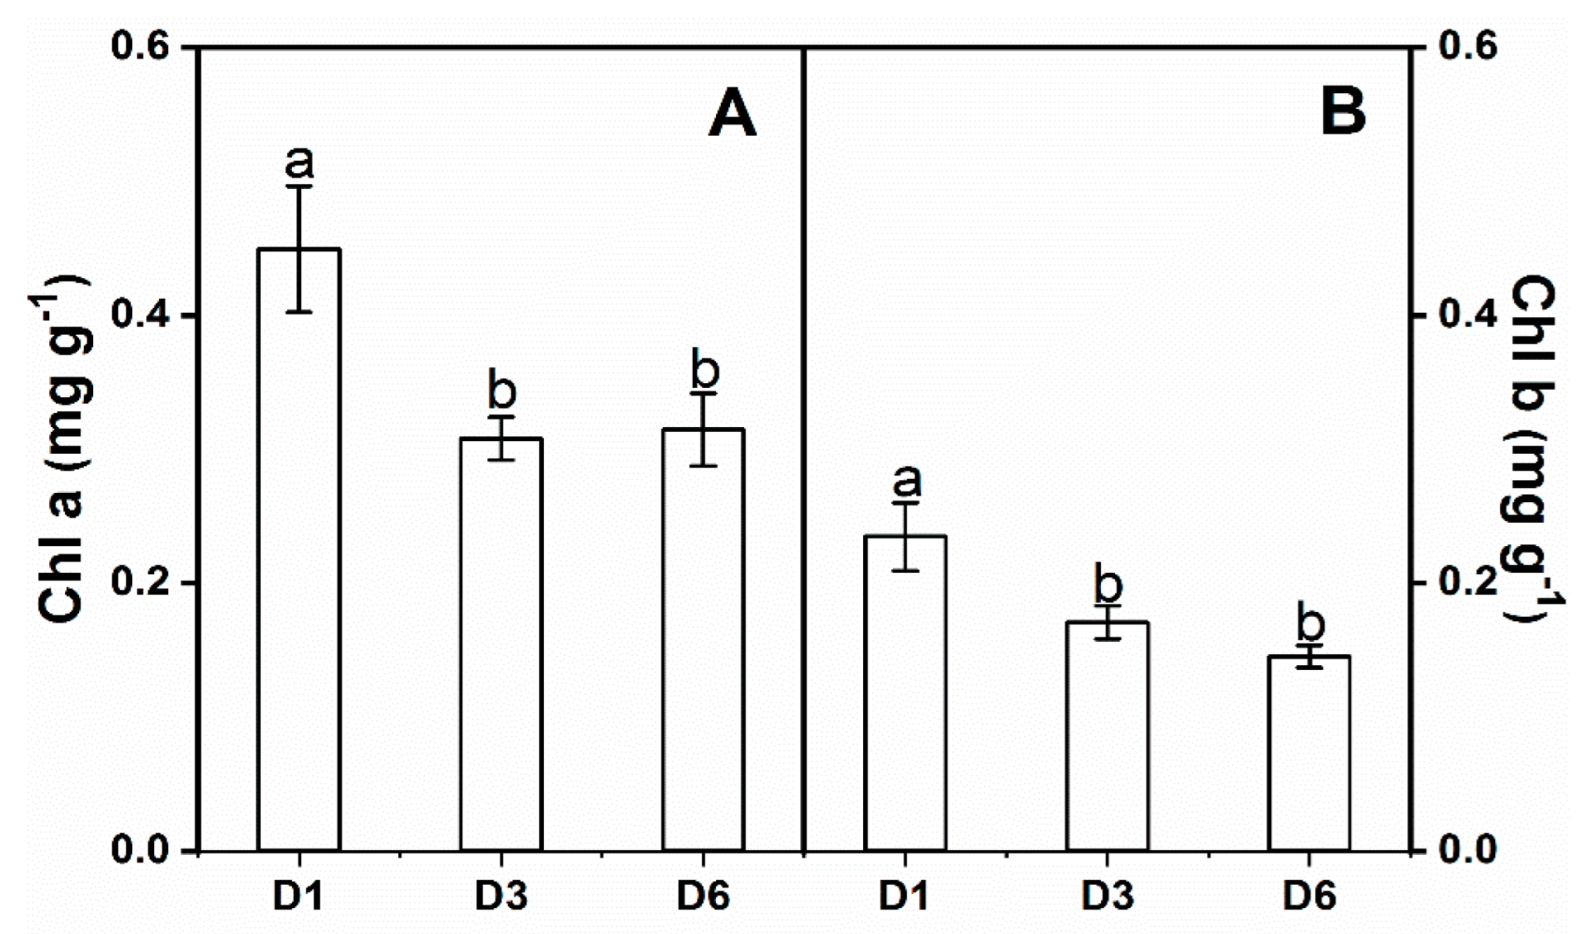
3.1. Leaf Physiology
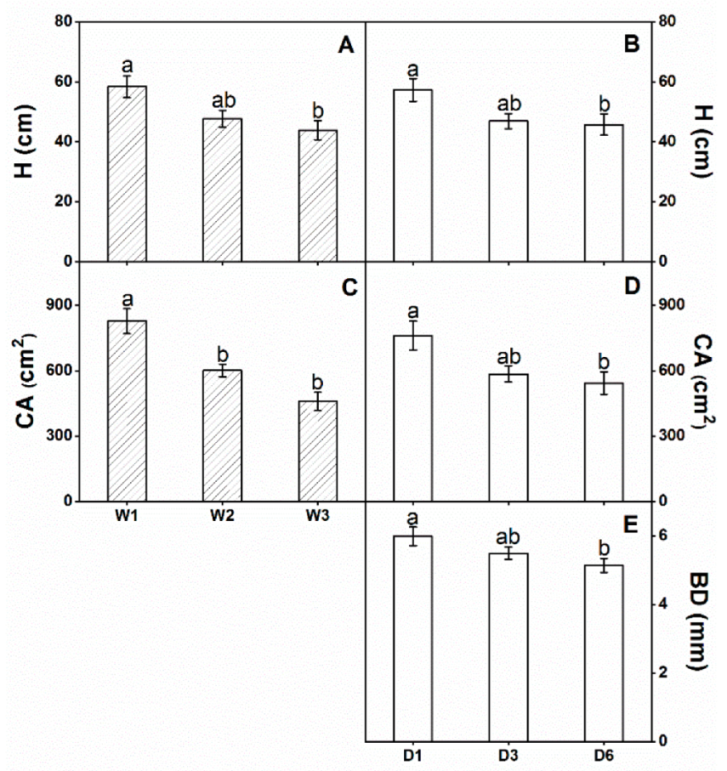
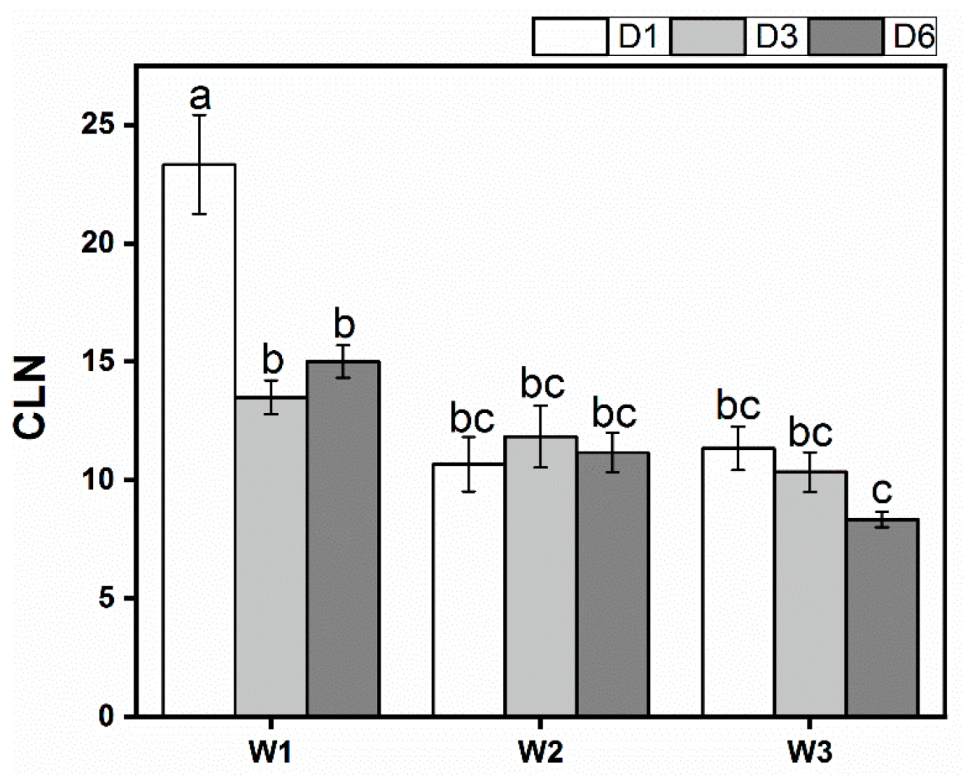
3.2. Growth
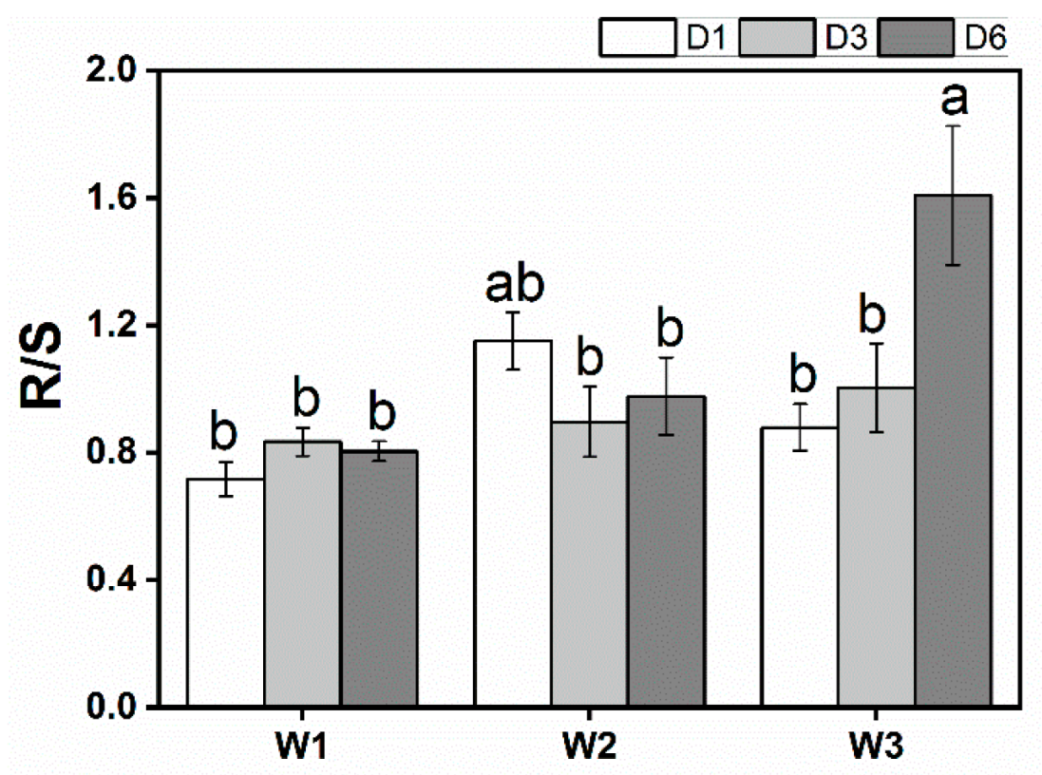
3.3. Biomass
4. Discussion
5. Conclusions
Author Contributions
Funding
Institutional Review Board Statement
Informed Consent Statement
Data Availability Statement
Acknowledgments
Conflicts of Interest
References
- Coumou, D.; Robinson, A. Historic and future increase in the global land area affected by monthly heat extremes. Environ. Res. Lett. 2013, 8, 034018. [Google Scholar] [CrossRef]
- IPCC. Climate Change 2021: The Physical Science Basis; Working Group I to the Sixth Assessment Report of the Intergovernmental Panel on Climate Change; Cambridge University Press: Cambridge, UK, 2021. [Google Scholar]
- Solomon, S.; Quin, D.; Manning, M.; Chen, Z.; Marquis, M.; Averyt, K.B.; Tignor, M.; Miller, H.L. Climate Change 2007: The Physical Science Basis; Working Group I Contribution to the Fourth Assessment Report of the IPCC; Cambridge University Press: Cambridge, UK, 2007.
- Kang, Y.Z.; Peng, X.D.; Wang, S.G.; Dong, C.Q.; Shang, K.Z.; Zhao, Y. Statistical characteristics and synoptic situations of long-duration heavy rainfall events over north China. Earth Space Sci. 2020, 7, e2019EA000923. [Google Scholar] [CrossRef] [Green Version]
- Zhao, S.H.; Cong, D.M.; He, K.X.; Yang, H.; Qin, Z.H. Spatial-temporal variation of drought in China from 1982 to 2010 based on a modified temperature vegetation drought index (mTVDI). Sci. Rep. 2017, 7, 17473. [Google Scholar] [CrossRef] [PubMed]
- Gao, R.; Yang, X.; Liu, G.; Huang, Z.; Walck, J.L. Effects of rainfall pattern on the growth and fecundity of a dominant dune annual in a semi-arid ecosystem. Plant Soil 2015, 389, 335–347. [Google Scholar] [CrossRef]
- Huang, L.; Zhang, Z. Effect of rainfall pulses on plant growth and transpiration of two xerophytic shrubs in a revegetated desert area: Tengger Desert, China. Catena 2016, 137, 269–276. [Google Scholar] [CrossRef]
- Padilla, F.M.; Mommer, L.; de Caluwe, H.; Smit-Tiekstra, A.E.; Visser, E.J.W.; de Kroon, H. Effects of extreme rainfall events are independent of plant species richness in an experimental grassland community. Oecologia 2019, 191, 177–190. [Google Scholar] [CrossRef] [PubMed] [Green Version]
- Guo, X.; Yu, T.; Li, M.Y.; Guo, W.H. The effects of salt and rainfall pattern on morphological and photosynthetic characteristics of Phragmites australis (Poaceae). J. Torrey Bot. Soc. 2018, 145, 212–224. [Google Scholar] [CrossRef]
- Guo, X.; Xu, Z.W.; Li, M.Y.; Ren, X.H.; Liu, J.; Guo, W.H. Increased soil moisture aggravated the competitive effects of the invasive tree Rhus typhina on the native tree Cotinus coggygria. BMC Ecol. 2020, 20, 17. [Google Scholar] [CrossRef] [Green Version]
- Li, M.; Du, N.; Guo, X.; Yu, T.; Zhao, S.; Guo, W. Nitrogen deposition does not reduce water deficit in Ailanthus altissima seedlings. Flora 2017, 233, 171–178. [Google Scholar] [CrossRef]
- Xu, N.; Guo, W.; Liu, J.; Du, N.; Wang, R. Increased nitrogen deposition alleviated the adverse effects of drought stress on Quercus variabilis and Quercus mongolica seedlings. Acta Physiol. Plant. 2015, 37, 107. [Google Scholar] [CrossRef]
- Robakowski, P.; Wyka, T.P.; Kowalkowski, W.; Barzdajn, W.; Pers-Kamczyc, E.; Jankowski, A.; Politycka, B. Practical implications of different phenotypic and molecular responses of evergreen conifer and broadleaf deciduous forest tree species to regulated water deficit in a container nursery. Forests 2020, 11, 1011. [Google Scholar] [CrossRef]
- Xu, F.; Guo, W.H.; Wang, R.Q.; Xu, W.H.; Du, N.; Wang, Y.F. Leaf movement and photosynthetic plasticity of black locust (Robinia pseudoacacia) alleviate stress under different light and water conditions. Acta Physiol. Plant. 2009, 31, 553–563. [Google Scholar] [CrossRef]
- Yuan, C.; Gao, G.Y.; Fu, B.J.; He, D.M.; Duan, X.W.; Wei, X.H. Temporally dependent effects of rainfall characteristics on inter- and intra-event branch-scale stemflow variability in two xerophytic shrubs. Hydrol. Earth Syst. Sci. 2019, 23, 4077–4095. [Google Scholar] [CrossRef] [Green Version]
- Gessler, A.; Bachli, L.; Freund, E.R.; Treydte, K.; Schaub, M.; Haeni, M.; Weiler, M.; Seeger, S.; Marshall, J.; Hug, C.; et al. Drought reduces water uptake in beech from the drying topsoil, but no compensatory uptake occurs from deeper soil layers. New Phytol. 2022, 233, 194–206. [Google Scholar] [CrossRef] [PubMed]
- Huang, L.; Zhang, Z.S.; Li, X.R. Sap flow of Artemisia ordosica and the influence of environmental factors in a revegetated desert area: Tengger Desert, China. Hydrol. Process. 2010, 24, 1248–1253. [Google Scholar]
- Zhang, Q.Y.; Shao, M.A.; Jia, X.X.; Wei, X.R. Changes in soil physical and chemical properties after short drought stress in semi-humid forests. Geoderma 2019, 338, 170–177. [Google Scholar] [CrossRef]
- Kletter, A.Y.; von Hardenberg, J.; Meron, E.; Provenzale, A. Patterned vegetation and rainfall intermittency. J. Theor. Biol. 2009, 256, 574–583. [Google Scholar] [CrossRef] [Green Version]
- Zhang, Z.S.; Li, X.R.; Liu, L.C.; Jia, R.L.; Zhang, J.G.; Wang, T. Distribution, biomass, and dynamics of roots in a revegetated stand of Caragana korshinskii in the Tengger Desert, northwestern China. J. Plant Res. 2009, 122, 109–119. [Google Scholar] [CrossRef]
- Zhang, Z.S.; Li, X.R.; Wang, T.; Wang, X.P.; Xue, Q.W.; Liu, L.C. Distribution and seasonal dynamics of roots in a revegetated stand of Artemisia ordosica Kracsh. in the Tengger Desert (North China). Arid Land Res. Manag. 2008, 22, 195–211. [Google Scholar] [CrossRef]
- Miranda, J.D.; Armas, C.; Padilla, F.M.; Pugnaire, F.I. Climatic change and rainfall patterns: Effects on semi-arid plant communities of the Iberian Southeast. J. Arid Environ. 2011, 75, 1302–1309. [Google Scholar] [CrossRef]
- Sepulveda, M.; Bown, H.E.; Miranda, M.D.; Fernandez, B. Impact of rainfall frequency and intensity on inter- and intra-annual satellite-derived EVI vegetation productivity of an Acacia caven shrubland community in Central Chile. Plant Ecol. 2018, 219, 1209–1223. [Google Scholar] [CrossRef]
- Spence, L.A.; Liancourt, P.; Boldgiv, B.; Petraitis, P.S.; Casper, B.B. Short-term manipulation of precipitation in Mongolian steppe shows vegetation influenced more by timing than amount of rainfall. J. Veg. Sci. 2016, 27, 249–258. [Google Scholar] [CrossRef]
- Padilla, F.M.; Miranda, J.D.; Jorquera, M.J.; Pugnaire, F.I. Variability in amount and frequency of water supply affects roots but not growth of arid shrubs. Plant Ecol. 2009, 204, 261–270. [Google Scholar] [CrossRef]
- Wang, R.Q.; Zhou, G.Y. The Vegetation of Shandong Province; Shandong Science and Technology Publisher: Jinan, China, 2000. [Google Scholar]
- Ding, W.; Wang, R.; Yuan, Y.; Liang, X.; Liu, J. Effects of nitrogen deposition on growth and relationship of Robinia pseudoacacia and Quercus acutissima seedlings. Dendrobiology 2012, 67, 3–13. [Google Scholar]
- Luo, Y.; Yuan, Y.; Wang, R.; Liu, J.; Du, N.; Guo, W. Functional traits contributed to the superior performance of the exotic species Robinia pseudoacacia: A comparison with the native tree Sophora japonica. Tree Physiol. 2015, 36, 345–355. [Google Scholar] [CrossRef] [Green Version]
- Minucci, J.M.; Miniat, C.F.; Teskey, R.O.; Wurzburger, N. Tolerance or avoidance: Drought frequency determines the response of an N2-fixing tree. New Phytol. 2017, 215, 434–442. [Google Scholar] [CrossRef] [Green Version]
- Sadeghi, S.M.M.; Van Stan, J.T.; Pypker, T.G.; Tamjidi, J.; Friesen, J.; Farahnaklangroudi, M. Importance of transitional leaf states in canopy rainfall partitioning dynamics. Eur. J. Forest Res. 2018, 137, 121–130. [Google Scholar] [CrossRef]
- Yildiz, O.; Altundağ, E.; Çetin, B.; Güner, Ş.T.; Sarginci, M.; Toprak, B. Experimental arid land afforestation in Central Anatolia, Turkey. Environ. Monit. Assess. 2018, 190, 355. [Google Scholar] [CrossRef]
- Li, Q.; Wang, N.; Liu, X.; Liu, S.; Wang, H.; Zhang, W.; Wang, R.; Du, N. Growth and physiological responses to successional water deficit and recovery in four warm-temperate woody species. Physiol. Plant. 2019, 167, 645–660. [Google Scholar] [CrossRef]
- Mantovani, D.; Veste, M.; Boldt-Burisch, K.; Fritsch, S.; Koning, L.A.; Freese, D. Carbon allocation, nodulation, and biological nitrogen fixation of black locust (Robinia pseudoacacia L.) under soil water limitation. Ann. For. Res. 2015, 58, 259–274. [Google Scholar] [CrossRef]
- Srodek, D.; Rahmonov, O. The properties of Black Locust Robinia pseudoacacia L. to selectively accumulate chemical elements from soils of ecologically transformed areas. Forests 2022, 13, 18. [Google Scholar]
- Wang, N.; Ji, T.Y.; Liu, X.; Li, Q.; Sairebieli, K.; Wu, P.; Song, H.J.; Wang, H.; Du, N.; Zheng, P.M.; et al. Defoliation significantly suppressed plant growth under low light conditions in two Leguminosae species. Front Plant Sci. 2022, 12, 14. [Google Scholar] [CrossRef] [PubMed]
- Guo, Y.; Qin, D.; Li, L.; Sun, J.; Li, F.; Huang, J. A complicated karst spring system: Identified by karst springs using water level, hydrogeochemical, and isotopic data in Jinan, China. Water 2019, 11, 947. [Google Scholar] [CrossRef] [Green Version]
- Dou, S.; Cao, S.L. Analysis of rainfall runoff and torrential flood characteristics in Xiaoqing river in Jinan. In Proceedings of the 5th China Water Forum, Nanjing, China, 11 November 2007. [Google Scholar]
- Lichtenthaler, H.K. Chlorophylls and carotenoids: Pigments of photosynthetic biomembranes. Methods Enzymol. 1987, 148, 350–382. [Google Scholar]
- Guo, X.; Wang, R.; Chang, R.; Liang, X.; Wang, C.; Luo, Y.; Yuan, Y.; Guo, W. Effects of nitrogen addition on growth and photosynthetic characteristics of Acer truncatum seedlings. Dendrobiology 2014, 72, 147–157. [Google Scholar] [CrossRef]
- Stallmann, J.; Schweiger, R.; Muller, C. Effects of continuous versus pulsed drought stress on physiology and growth of wheat. Plant Biol. 2018, 20, 1005–1013. [Google Scholar] [CrossRef]
- Jiménez, M.D.; Pardos, M.; Puértolas, J.; Kleczkowski, L.A.; Pardos, J.A. Deep shade alters the acclimation response to moderate water stress in Quercus suber L. Forestry 2009, 82, 285–298. [Google Scholar] [CrossRef] [Green Version]
- Zhang, J. Strategies for reclaiming and ameliorating saline soil in the Yellow River Delta region. In Coastal Saline Soil Rehabilitation and Utilization Based on Forestry Approaches in China; Springer: Berlin, Germany, 2014; pp. 55–64. [Google Scholar]
- Pinkard, E.A.; Battaglia, M.; Beadle, C.L.; Sands, P.J. Modelling the effect of physiological responses to green pruning on net biomass production of Eucalyptus nitens (Deane and Maiden) Maiden. Tree Physiol. 1999, 19, 1–12. [Google Scholar] [CrossRef] [Green Version]
- Ethier, G.J.; Livingston, N.J.; Harrison, D.L.; Black, T.A.; Moran, J.A. Low stomatal and internal conductance to CO2 versus Rubisco deactivation as determinants of the photosynthetic decline of ageing evergreen leaves. Plant Cell Environ. 2006, 29, 2168–2184. [Google Scholar] [CrossRef]
- Menezes, J.; Garcia, S.; Grandis, A.; Nascimento, H.; Domingues, T.F.; Guedes, A.; Aleixo, I.; Camargo, P.; Campos, J.; Damasceno, A.; et al. Changes in leaf functional traits with leaf age: When do leaves decrease their photosynthetic capacity in Amazonian trees? Tree Physiol. 2021, 42, 922–938. [Google Scholar] [CrossRef]
- Pinkard, E.A.; Baillie, C.C.; Patel, V.; Paterson, S.; Battaglia, M.; Smethurst, P.J.; Mohammed, C.L.; Wardlaw, T.; Stone, C. Growth responses of Eucalyptus globulus Labill. to nitrogen application and severity, pattern and frequency of artificial defoliation. Forest Ecolo. Manag. 2006, 229, 378–387. [Google Scholar] [CrossRef]
- Shan, L.; Zhao, W.; Li, Y.; Zhang, Z.; Xie, T. Precipitation amount and frequency affect seedling emergence and growth of Reaumuria soongarica in northwestern China. J. Arid Land 2018, 10, 574–587. [Google Scholar] [CrossRef] [Green Version]
- Wang, M.L.; Jiang, Y.S.; Wei, J.Q.; Wei, X.; Qi, X.X.; Jiang, S.Y.; Wang, Z.M. Effects of irradiance on growth, photosynthetic characteristics, and artemisinin content of Artemisia annua L. Photosynthetica 2008, 46, 17–20. [Google Scholar] [CrossRef]
- Hao, Y.; Kang, X.; Wu, X.; Cui, X.; Liu, W.; Zhang, H.; Li, Y.; Wang, Y.; Xu, Z.; Zhao, H. Is frequency or amount of precipitation more important in controlling CO2 fluxes in the 30-year-old fenced and the moderately grazed temperate steppe? Agr. Ecosyst. Environ. 2013, 171, 63–71. [Google Scholar] [CrossRef]
- Quentin, A.G.; O'Grady, A.P.; Beadle, C.L.; Mohammed, C.; Pinkard, E.A. Interactive effects of water supply and defoliation on photosynthesis, plant water status and growth of Eucalyptus globulus Labill. Tree Physiol. 2012, 32, 958–967. [Google Scholar] [CrossRef]
- Weber, R.; Schwendener, A.; Schmid, S.; Lambert, S.; Wiley, E.; Landhäusser, S.M.; Hartmann, H.; Hoch, G. Living on next to nothing: Tree seedlings can survive weeks with very low carbohydrate concentrations. New Phytol. 2018, 218, 107–118. [Google Scholar] [CrossRef] [Green Version]
- Jacquet, J.S.; Bosc, A.; O'Grady, A.; Jactel, H. Combined effects of defoliation and water stress on pine growth and non-structural carbohydrates. Tree Physiol. 2014, 34, 367–376. [Google Scholar] [CrossRef]
- Sala, A.; Woodruff, D.R.; Meinzer, F.C. Carbon dynamics in trees: Feast or famine? Tree Physiol. 2012, 32, 764–775. [Google Scholar] [CrossRef] [Green Version]
- Liu, Y.; Li, P.; Wang, T.; Liu, Q.; Wang, W. Root respiration and belowground carbon allocation respond to drought stress in a perennial grass (Bothriochloa ischaemum). Catena 2020, 188, 104449. [Google Scholar] [CrossRef]
- Sher, A.A.; Goldberg, D.E.; Novoplansky, A. The effect of mean and variance in resource supply on survival of annuals from Mediterranean and desert environments. Oecologia 2004, 141, 353–362. [Google Scholar] [CrossRef] [Green Version]
- Yan, W.M.; Zheng, S.X.; Zhong, Y.Q.W.; Shangguan, Z.P. Contrasting dynamics of leaf potential and gas exchange during progressive drought cycles and recovery in Amorpha fruticosa and Robinia pseudoacacia. Sci. Rep. 2017, 7, 4470. [Google Scholar] [CrossRef] [PubMed] [Green Version]
- Wang, L.; Dai, Y.X.; Sun, J.Z.; Wan, X.C. Differential hydric deficit responses of Robinia pseudoacacia and Platycladus orientalis in pure and mixed stands in northern China and the species interactions under drought. Trees 2017, 31, 2011–2021. [Google Scholar] [CrossRef]
- Minucci, J.M.; Miniat, C.F.; Wurzburger, N. Drought sensitivity of an N2-fixing tree may slow temperate deciduous forest recovery from disturbance. Ecology 2019, 100, e02862. [Google Scholar] [CrossRef] [PubMed]


| Parameters | Precipitation Intensity (W) | Precipitation Frequencies (D) | Intensity × Frequencies (W × D) |
|---|---|---|---|
| Leaf physiology | |||
| Amax (μmol·m−2·s−1) | 2.337 | 33.757 ** | 7.412 ** |
| E (mmol·m−2·s−1) | 12.211 ** | 113.818 ** | 25.533 ** |
| Gs (mmol·m−2·s−1) | 4.275 * | 54.326 ** | 14.975 ** |
| WUE (mmol·mol−1) | 29.112 ** | 24.415 ** | 24.374 ** |
| Chl a (mg·g−1) | 3.619 | 6.527 * | 0.709 |
| Chl b (mg·g−1) | 3.463 | 7.745 * | 0.439 |
| Chl a/b | 0.140 | 2.036 | 0.674 |
| Growth | |||
| H (cm) | 6.747 ** | 4.834 * | 2.089 |
| BD (mm) | 0.717 | 3.429 * | 0.559 |
| CA (cm2) | 24.217 ** | 9.398 ** | 1.920 |
| CLN | 35.000 ** | 6.001 ** | 4.969 ** |
| Biomass | |||
| LB (g) | 14.700 ** | 17.151 ** | 1.253 |
| SB (g) | 3.772 * | 10.254 ** | 1.791 |
| RB (g) | 2.444 | 13.462 ** | 0.342 |
| MRB (g) | 0.124 | 6.362 ** | 0.533 |
| LRB (g) | 4.274 * | 14.983 ** | 0.771 |
| TB (g) | 6.424 ** | 15.161 ** | 0.749 |
| R/S | 8.661** | 3.723 * | 4.990 ** |
Publisher’s Note: MDPI stays neutral with regard to jurisdictional claims in published maps and institutional affiliations. |
© 2022 by the authors. Licensee MDPI, Basel, Switzerland. This article is an open access article distributed under the terms and conditions of the Creative Commons Attribution (CC BY) license (https://creativecommons.org/licenses/by/4.0/).
Share and Cite
Li, M.; Guo, X.; Zhao, S.; Liu, L.; Xu, Z.; Du, N.; Guo, W. Robinia pseudoacacia Seedlings Are More Sensitive to Rainfall Frequency Than to Rainfall Intensity. Forests 2022, 13, 762. https://doi.org/10.3390/f13050762
Li M, Guo X, Zhao S, Liu L, Xu Z, Du N, Guo W. Robinia pseudoacacia Seedlings Are More Sensitive to Rainfall Frequency Than to Rainfall Intensity. Forests. 2022; 13(5):762. https://doi.org/10.3390/f13050762
Chicago/Turabian StyleLi, Mingyan, Xiao Guo, Song Zhao, Lele Liu, Zhenwei Xu, Ning Du, and Weihua Guo. 2022. "Robinia pseudoacacia Seedlings Are More Sensitive to Rainfall Frequency Than to Rainfall Intensity" Forests 13, no. 5: 762. https://doi.org/10.3390/f13050762
APA StyleLi, M., Guo, X., Zhao, S., Liu, L., Xu, Z., Du, N., & Guo, W. (2022). Robinia pseudoacacia Seedlings Are More Sensitive to Rainfall Frequency Than to Rainfall Intensity. Forests, 13(5), 762. https://doi.org/10.3390/f13050762