Article

Landowner Acceptability of Silvicultural Treatments to Restore an Open Forest Landscape

1
Institute of Landscape Development, Recreation and Conservation Planning, University of Natural Resources and Life Sciences, Vienna, Peter Jordan-Straße 82, 1190 Vienna, Austria
2
Northern Research Station, USDA Forest Service, 1033 University Pl. Ste. 360, Evanston, IL 60201, USA
3
Department of Forest Resources, University of Minnesota, 1530 Cleveland Ave. N., St. Paul, MN 55108, USA
4
Center for Land Use Education, University of Wisconsin-Stevens Point, 800 Reserve Street, Stevens Point, WI 54481, USA
*
Author to whom correspondence should be addressed.
Forests 2022, 13(5), 770; https://doi.org/10.3390/f13050770
Submission received: 22 March 2022 / Revised: 3 May 2022 / Accepted: 15 May 2022 / Published: 17 May 2022
(This article belongs to the Section Forest Economics, Policy, and Social Science)

Abstract

:
This study examined the acceptability of different silvicultural treatments to restore pine barrens, an open, fire-dependent forest landscape type globally imperiled across the northern Great Lakes region of the United States and Canada. In an online survey, we asked family-forest owners (N = 466) in Northeastern Wisconsin about the acceptability of pine barrens restoration treatments through ratings of both verbal descriptions and visual scenarios. An informational statement about pine barrens restoration purposes and goals preceded ratings for half the sample. Across the entire sample, acceptability ratings for eleven verbally-described treatments generally declined as treatments became more intensive, creating greater openness on the landscape. Information recipients found two groups of treatments identified by factor analysis (selective openings, fire) more acceptable than non-recipients, and cluster analysis identified four respondent subgroups, each with varying levels of acceptability. The respondents also rated the acceptability of visual scenarios, with treatment attribute combinations portraying a range of likely restoration alternatives. While we generally found correspondence between verbal and visual acceptability ratings across the entire sample, the groups distinguished by their verbal acceptability ratings did not substantially differ in how they rated the acceptability of the visual scenarios. Implications are discussed for designing and communicating the purpose and value of restoration treatments to stakeholder groups.

1. Introduction

Forests provide multiple ecosystem services [1,2]. To maximize services for human needs, the structure and function of some natural forest landscape types have been altered, often to increase the productivity of high-value tree species at the expense of other ecosystem services, such as biodiversity [3]. Today, there are increased efforts to restore some forest landscapes to a more natural state and provide a broader range of ecosystem services [4]. However, the restoration of natural ecological structure and function may not always meet with public acceptance, especially when it radically changes the landscape to which the local population is accustomed [5,6].
Such is the case with pine barrens restoration in the northern Great Lakes region of the United States (Northern Minnesota, Wisconsin, Michigan) and Canada (Ontario). Pine barrens are open, fire-dependent natural communities with sparse canopies of pine-dominant tree species (Pinus banksiana, P. resinosa) growing singly and in groves over a diverse understory of shrubs, grasses, and forbs [7]. Once extensive across sandy areas of the region and maintained in part by Indigenous Peoples, fire suppression and plantation silviculture beginning in the late 19th century reduced pine barrens to a few scattered sites on public lands—as such, this forest type is now globally imperiled [8]. To local residents and visitors who have long come to see the resulting closed-canopy forest of dense trees as natural, pine barrens are an unfamiliar forest landscape type. Moreover, silvicultural treatments such as large-scale clearcutting and prescribed burning to restore pine barrens’ ecosystem structure and function have raised stakeholder concerns, challenging forest managers to accomplish ecological goals in ways the public finds acceptable.
In an earlier paper [9], we presented data on preferences for visual choice scenarios of pine barrens restoration treatments from a survey of family-forest owners who owned property near a major new pine barrens restoration project in Northeastern Wisconsin (U.S.). Given theoretical arguments that preference may be a more aesthetic and affective construct while acceptability may be more cognitive and therefore useful to understand stakeholder responses to landscape management [10], we explore additional questions relating to pine barrens treatment acceptability. To build on prior work and extend it to an important but little-studied context of open forest landscapes, in this paper we examine the following questions:
  • What silvicultural treatments are seen as acceptable and unacceptable in a restoration context?
  • To what extent does the acceptability of treatments that are verbally described match the acceptability of those that are visually depicted?
  • Does the provision of information about the purpose and goals of restoration influence the acceptability of treatments?
  • Are respondents heterogeneous in their acceptability of treatments?

1.1. Acceptability of Forest Restoration Treatments

As used in our research, acceptability refers to a judgment made by an individual about the sufficiency of or support for a given forest management condition or treatment [11]. Acceptability judgments are usually made in the context of a range of alternatives presented to an individual, with ratings or other evaluations indicating the relative acceptability of or support for the given condition over other alternatives [11,12]. The acceptability construct has one of its origins in applied research on the social aspects of forest management, with early studies focused on the limits of acceptable change to ecological conditions in wilderness management [13] and the visual acceptability of timber harvest alternatives [14]. Since its introduction, research applications of the construct as it relates to forest management have expanded to include a range of ecological issues including the acceptability of treatments to sustain forest health and sustainability [15], increase structural and species diversity in production-oriented monocultural forest plantations [16], restore native landscapes [17,18], manage invasive species [19], and reduce fuel loading and wildland fire risk [20,21]. The concept is increasingly being applied beyond forestry to address a range of land use issues, especially in areas of renewable energy and sustainable land management [22].
The acceptability of forest management conditions and treatments hinges on a number of factors. An overarching concern, however, relates to the intensity of an intervention, including the degree to which existing conditions are altered or the perceived level of risk associated with a treatment [23]. In the context of timber harvesting, studies generally show high acceptability for low intensity silvicultural treatments such as thinning and selective cutting, and smaller clearcuts are seen as more acceptable than larger ones [15,24,25]. Such findings generally parallel similar research on scenic preferences for timber harvest alternatives [26,27,28], though there can be differences between these two types of judgments [10].
In the context of ecological restoration, the relationship between management intensity and acceptability appears to follow findings on timber management but with a wider range of silvicultural treatments (henceforth “restoration treatments”) considered. For example, in a study of urban oak woodland restoration, Gobster et al. [18] found nearly unanimous support for low-intensity treatments such as planting native seeds and seedlings and hand removal of invasive plants, moderate support for prescribed burning and mechanical removal of small trees and shrubs, and low support for lethal deer (Odocoileus spp.) removal and using herbicide to remove invasive vegetation. Similar findings were echoed in other studies of urban natural areas [20,29] and wildland forest and sagebrush ecosystem restorations [30,31]. Given this consistent pattern, we expected to find that low-intensity pine barrens restoration treatments such as selective thinning, the creation of small openings, and the infrequent use of prescribed burning would be more acceptable than more highly intensive treatments such as the creation of large openings and frequent prescribed burning (Hypothesis 1).

1.2. Verbal Description vs. Visual Depiction of Restoration Treatments

Much of the early research on forest management acceptability evolved out of landscape perception assessment, particularly the psychophysical paradigm that commonly ties physical landscape elements to subjective scenic beauty ratings [32]. As often employed, investigators use photographic images of actual forest landscapes carefully chosen to portray the range of conditions of interest, which are then presented to respondents in group presentations or individually through photo-based questionnaires [33,34]. While this basic technique is still used in preference and acceptability assessments [35], the advancement of digital imaging and editing tools has enabled researchers and practitioners to create photorealistic visualizations of management alternatives for stakeholder evaluation prior to on-the-ground implementation [36]. Methodologically, digital imaging provides a means to control extraneous visual elements that might influence judgments, and allows for systematic manipulation of visually-represented management attributes and levels. When used in combination with discrete choice models, digitally-calibrated visual scenarios provide an efficient and powerful way to isolate the relative effects of different restoration treatments [37,38,39].
For all of their advantages, image-based assessments are limited to portraying forest management conditions and treatments readily visible within a landscape scene. Some treatments, however, such as the use of herbicides or lethal deer control, are not only difficult to visualize but their description and labeling may link more directly to important socially-held beliefs, attitudes, and values that can influence acceptability [40,41]. For these reasons, many studies of acceptability employ verbal descriptions of treatments. For example, Schluter and Schneider [19] examined onsite visitor acceptability of eight different management practices to control tree-damaging insects, which were briefly described in a one-page handout and then paraphrased in a parallel set of acceptability rating scales. Similarly, Toman et al. [20] used a mail survey to ask residents living near public lands about the acceptability of two methods to reduce wildland fire risk, with a one-sentence description of each method preceding response ratings. Other studies have incorporated a short sentence or descriptive phrase directly into rating scales for a set of treatments [18,31], and others have used similar verbal descriptions of management attributes and attribute levels in discrete choice scenarios [42,43]. In these ways, investigators are able to describe treatments such as prescribed fire, biological and chemical control, and livestock grazing that would be difficult to realistically visualize. In this study, we employed both verbal rating scales and visual choice scenarios to describe a full range of treatments used in restoring pine barrens, with some treatments described in both verbal and visual terms. For these overlapping treatments, we expected to find similar acceptability responses (Hypothesis 2).

1.3. Preference, Acceptability, and the Effects of Information

Conceptually, acceptability judgments are thought to be grounded in aesthetic perceptions of a management condition or treatment practice [33]. But while a preference judgment implies a purely affective evaluation, acceptability judgments are thought to more explicitly incorporate cognitive information about the context of management and are made relative to socially-held norms for that context [10,34]. Thus, for some contexts, such as when intensive forest treatment practices are needed to accomplish socially held goals for ecosystem restoration, acceptability judgments for such treatments could be expected to differ (i.e., receive higher ratings) compared with preference judgments for the same treatment [15].
Because of this presumed cognitive, contextual focus, knowledge about a management issue can be a key component of acceptability judgments. When a management issue is presented to stakeholders who may not be familiar with management practices and applications, a common tool is to provide information to help establish a context from which more reasoned judgments can be made [44,45]. In a planning or project setting, this is often done via informational meetings, mailings to nearby residents, onsite visits to a project area, and the like [46,47]. In a research setting, informational statements are often provided to respondents prior to acceptability judgments.
A number of studies of timber and ecological management have examined information effects on judgments of acceptability and preference, though the effectiveness of such interventions has been inconsistent. On the effective side, Kearney [48] found that preference ratings for scenes of forest stands depicting clearcuts increased after participants read a ~200-word informational statements about the wildlife and biodiversity benefits of clearcutting. Similarly, Ribe [34] found that a one-sentence statement about habitat and ecosystem benefits resulted in a significant increase in acceptability ratings for scenes of regeneration clearcuts with 15% green tree retention. On the ineffective side, Brunson and Reiter [33] did not find any differences in acceptability ratings of scenes depicting ecosystem management stands between a group given information about ecosystem management silviculture and a control group who rated the scenes without the information. Similarly, Hill and Daniel [47] found a brief message and pictures explaining the purpose and benefits of ecological restoration had no effect on preference ratings of woodland and savanna landscapes and only a weak effect on acceptability ratings.
In our previous paper [9], the informational statement about pine barrens restoration did not influence treatment preferences portrayed in visual choice scenarios; nor did questions about prior knowledge about or experience visiting pine barrens distinguish preference among the sample (more in Methods and Materials, below). Given the conceptual differences described in the literature, we were guardedly optimistic that our informational intervention would be associated with more positive judgments of the acceptability of pine barrens restoration treatments (Hypothesis 3).

1.4. Heterogeneity of Acceptability Judgments

Some previous studies have found differences among stakeholder groups in their judgments of preference or acceptability of forest management conditions and treatments. These differences often relate to occupational or lifestyle differences such as between forestry professionals and conservationists [24,49], activity or interest groups [12,15], and social and demographic groups [43,50]. As mentioned above, knowledge and experience have been hypothesized to affect perceptions of preference and acceptability [44,51], as have a number of attitudinal measures such as trust in managers and perceived risk of treatments [20,52].
In our earlier paper [9], a latent class analysis grouped landowners into two segments based on their preference ratings of visual choice scenarios. A dominant group preferred closed forest conditions reflective of typical scenery associated with the “Northwoods” region and a smaller group preferred the more open characteristics indicative of pine barrens restorations. However, neither the informational intervention nor knowledge and experience explained the differences. In this paper, we revisit this issue using our verbal measures of acceptability and, on the basis of previous literature, we expected that if there was heterogeneity among respondents, higher ratings of acceptability would be found for those who had greater familiarity and experience with forestry issues and pine barrens management (Hypothesis 4).

2. Materials and Methods

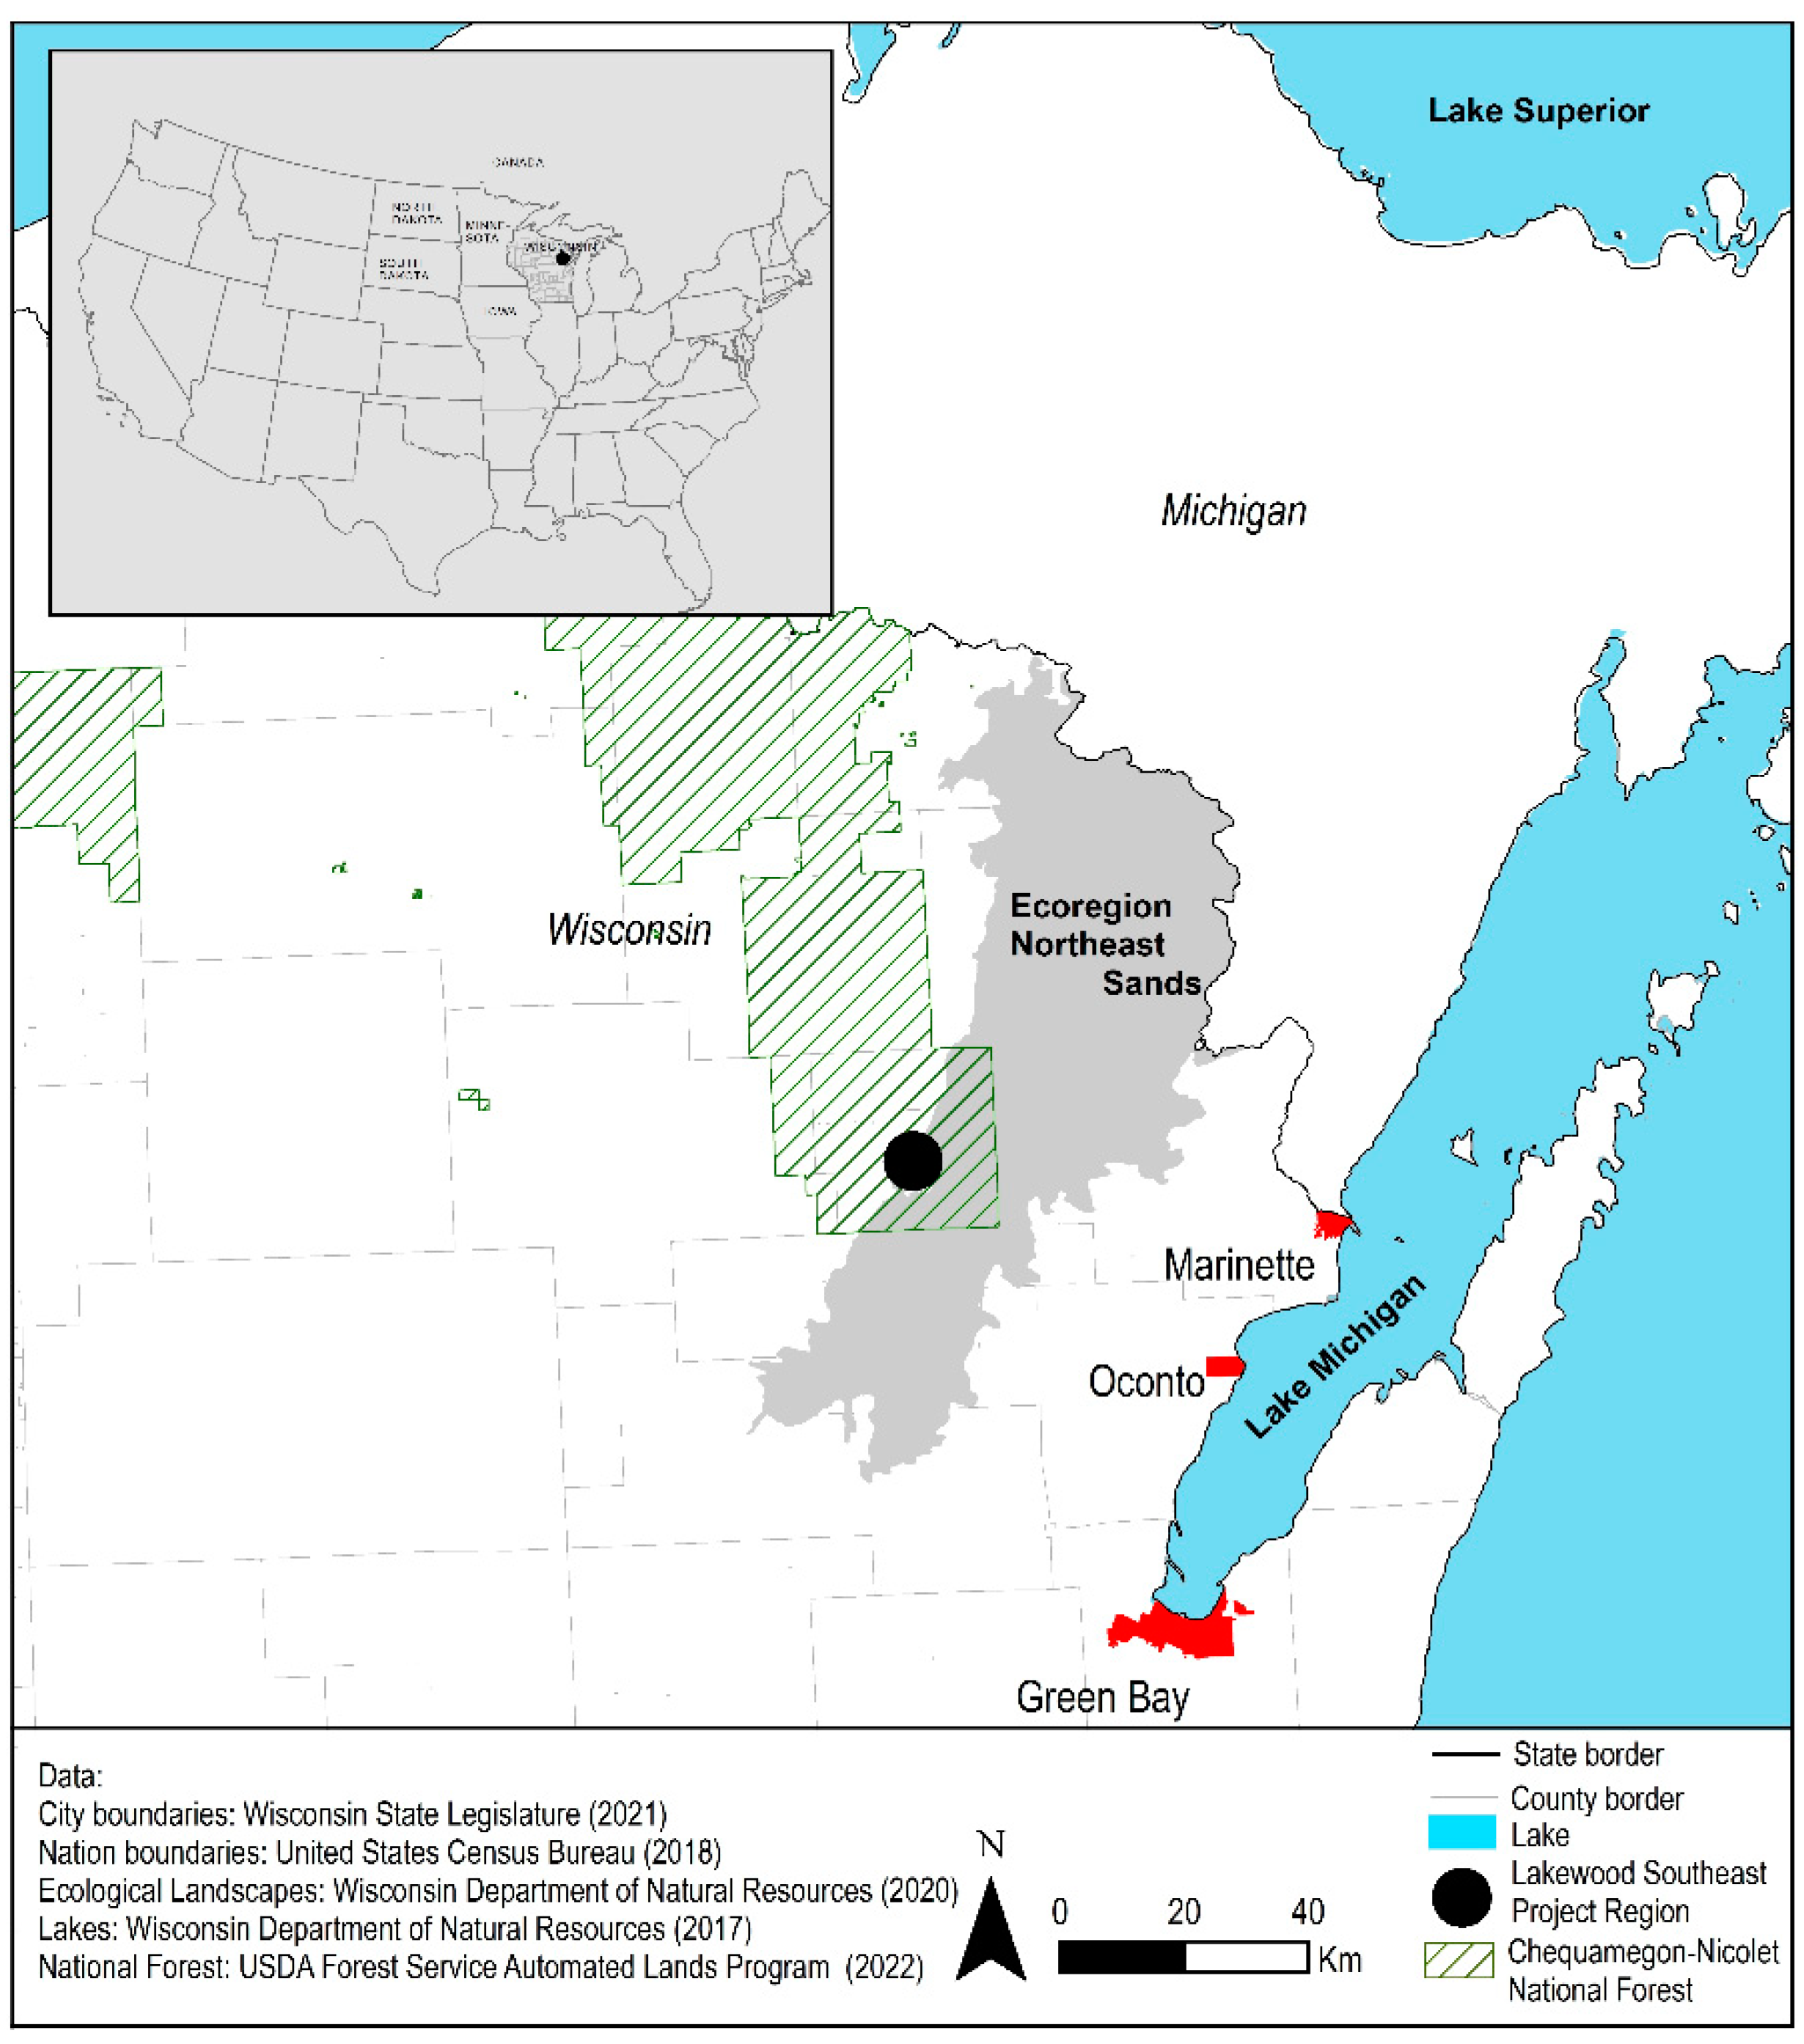
2.1. Study Area and Project Description

The Lakewood Southeast Project comprises a 15,000 ha area of the Chequamegon-Nicolet National Forest in Northeastern Wisconsin (45°08′ N, 88°20′ W; Figure 1). It lies within the Northeast Sands Ecoregion, a 4000 km2 belt of sandy glacial outwash that once contained extensive areas of pine barrens and associated dry forest communities and is part of the ancestral territory of the Menominee People [53]. Along with occasional lightning fires, the Menominee frequently burned these natural communities to yield an abundance of game, nuts, and berries for food, maintaining an open forest landscape of rich structural and species diversity [54,55]. Europeans began settling in what is now the northern Great Lakes region of the U.S. and Canada in the 1860s to log the pines for building the cities to the south. When this ‘Cutover’ period ended in the 1920s, European-style plantation forestry was instituted to maximize economic productivity [53]. While areas of pine barrens had not yielded much timber during the ‘Cutover’, an aggressive program of afforestation and fire suppression converted the open landscape to a dense, closed-canopy forest.
In the Lakewood Southeast Project area, the ground layer of grasses and forbs was so thick it needed to be plowed in furrows before any planting could begin [53] (Figure 2). But once established, pine barrens soon disappeared from the landscape and current residents and visitors have come to see the afforestation efforts as “natural” and indistinguishable from the naturally closed-canopy forests that surrounded the sandy regions [56,57]. Pine barrens diversity declined, and a number of key grassland species were extirpated or reduced to critical levels. The dry soils diminished goals of an economically productive forest enterprise and decades of fire suppression have put plantation forests as well as residents living in the wildland-urban interface at high wildfire risk [8,58].
For these reasons, in 2014, national forest managers initiated the Lakewood Southeast Project to restore the structure and function of pine barrens and associated dry forest communities [59]. Among the various restoration treatments, cutting has been a major tool, with selection cuts and clearcuts of various sizes employed to reintroduce spatial and structural diversity in existing canopy cover, and single trees left to be “thermally pruned” or killed by fire to provide wildlife habitat. Prescribed fire is employed in most treatment units to reduce slash and fuel loading, kill or set back resprouting tree and shrub cover, and stimulate the long-dormant seedbed of understory grasses and forbs. Managers have also used mechanical techniques such as mowing and chaining in initial reconversion of forest stands, and, if necessary, will consider using herbicides to control persistent regrowth of unwanted vegetation, particularly where aspen trees (Populus tremuloides) have become established (John Lampereur, personal communication, 7 June 2019). As used within a restoration context, these and other treatments can be unfamiliar to stakeholders, and early concerns about prescribed burning by some nearby landowners led to our involvement in the project to provide an informed social context for planning and management.

2.2. Research Design

To address our hypotheses (Table 1), we designed an online survey incorporating two different approaches to obtaining landowner judgments about the acceptability of pine barrens restoration treatments: a set of verbal descriptions with rating scales and sets of visual scenarios presented within a discrete choice experiment (DCE). The visual scenarios preceded the verbal descriptions to help ensure that respondents would judge the images on their overall appearance and not by trying to discern specific treatments mentioned in the verbal descriptions. The results of each task were assessed separately (Hypothesis 1) and overlapping treatments were compared across approaches (Hypothesis 2). For half of the respondents, a short statement about pine barrens preceded both tasks to test the effects of information on acceptability judgments (Hypothesis 3). Finally, to examine heterogeneity within the landowner sample we compared the verbal acceptability ratings of respondents as grouped by cluster analysis and used additional questions from the survey to help identify group membership (Hypothesis 4). Additionally, we also used the clusters to segment acceptability judgments obtained from the DCE to see how the groups defined by their verbal acceptability ratings related to the relative importance of attributes defined by their visual acceptability choice judgments (Hypotheses 2 and 4).

2.3. Selection and Specification of Restoration Treatments

The selection of specific treatments was informed by the literature as discussed above and by two companion studies conducted for the Lakewood Southeast Project. The first study [60] included a landowner survey in which we asked respondents how acceptable four different forest treatments were for managing the national forest (active management, logging, mechanical treatment, and prescribed burning). This survey was coupled with three focus groups with a subset of the same landowners during which they rated and commented on five images depicting forest landscapes along a continuum of openness from closed forests to wide-open pine barrens. While both approaches were informative, it was clear that finer distinctions in both verbal descriptions and visual depictions were needed to inform pine barrens management. The second study employed a modified Delphi process [61] where we asked a panel of land managers and researchers to describe and rate the importance of key attributes of pine barrens. Here, responses fell into five thematic categories (fire, landscape structure, plant and animal species, soil/surface characteristics, recreation/aesthetics), of which characteristics dealing with fire dependence and interval; landscape openness, tree density, and patch heterogeneity; and species dominance and rarity were rated among the most important.

2.3.1. Verbal Descriptions and Acceptability Rating Scales

Based on our companion studies and the literature, we developed an eleven-item question describing treatments that could be used to create and maintain the structure and function of pine barrens in the project area. These included five tree removal treatments ranging from selective thinning to large-scale clearcuts to provide relative degrees of overstory openness; and four fire, mechanical, and chemical control treatments to maintain open understory conditions. For coherence, items within these sets appeared together in the question and the tree removal treatments were arranged from small to large in scale or intensiveness. Two additional measures were included pertaining to reintroducing endangered plant species and leaving standing dead trees. Descriptions of individual treatments were kept short and informative, and each was followed by a five-point rating scale (1 = very unacceptable to 5 = very acceptable, with 3 = no opinion).

2.3.2. Visual Scenarios and Acceptability Choice Experiment

Also guided by our earlier studies and the literature, we defined six visual attributes of pine barrens: three relating to tree removal treatments to create various degrees of overstory openness (spatial configuration, tree density, tree distribution), two relating directly or indirectly to fire treatments to maintain understory openness (fire interval, shrub density), and a sixth that included standing dead trees and blueberry shrubs (Vaccinium sp.) as treatment elements. Each attribute included from three to six levels to cover the range of treatment conditions that could realistically occur in a pine barrens landscape, as informed by our Delphi panel (Table 2).
An asymmetric orthogonal fractional factorial design guided the construction of the visual scenarios, specifying which attribute levels should be combined with each other over a set of scenarios. To assess a main effects model for the six attributes and their levels required 128 different scenarios. To minimize respondent burden, these were distributed across eight different survey versions. Each respondent evaluated 16 scenarios, grouped into 4 choice sets with 4 scenarios per set. For each of the four choice sets, respondents chose their most preferred alternative out of the four scenarios presented (not presented here, see [9]). Immediately following the preference task, respondents were asked to mark each scenario that they judged as unacceptable (Figure 3). The scenarios were presented without any verbal information about the treatments or the attribute/attribute levels that were being visualized.
The visual scenarios were created in Adobe Photoshop using a base image of a treeless pine barrens taken at a long-established restoration site 70 km northwest of the project area. Individual landscape elements such as trees and shrubs were also taken at that site and saved in separate layers in Photoshop and if the design specified a certain attribute level, then the associated landscape elements were blended into the scenario.
The spatial configuration attribute defined the overall openness of overstory conditions and was depicted by placing trees either more in the fore-, mid-, or background. For accurate placement and scaling of trees and other landscape elements, the 72 ha viewshed area of the base photo was mapped in planimetric view using Google Earth and divided into four equal-area distance zones originating from the observer viewpoint. Zones 1 and 2 formed the foreground, zones 2 and 3 the midground, and zones 3 and 4 the background. We also tested the effect of different design options to simulate the scene’s openness character by placing 1% of the trees in the foreground and the remaining trees in the mid- or background. Along with spatial configuration, four levels of tree density (5%–35%) and two levels of tree distribution (scattered in the landscape or grouped as clumps) influenced the degree of openness of the overstory conditions.
As for understory treatments, the scenarios included three levels of prescribed fire intervals: 3, 10, and 30 years. As described by our Delphi experts, a 3-year interval was seen as optimal for maintaining the health and diversity of the pine barrens landscape and for reducing wildfire risk, while a 30-year interval compromised ecological function and increased wildfire risk. The shrub density attribute presented a major forest management concern because of the invasive spread of native oak (Quercus spp.) and aspen trees in the absence of frequent fires or other means of control (e.g., herbicide). Shrub density also defined varying degrees of visual penetration in the understory and midstory levels. The inclusion of standing dead trees addressed the acceptability of a measure of particular importance to wildlife. One attribute level showed four dead trees with flowering blueberry bushes; blueberries are a desirable food source for wildlife and recreationists.

2.4. Informational Intervention and Other Questionnaire Items

To assess the effects of information, a short statement describing pine barrens and the techniques and goals for their restoration preceded the acceptability rating and choice tasks for half of the respondent sample:
A Pine Barrens is a forest type that occurs in dry, sandy regions of the Upper Great Lakes, including land near your property in Northeastern Wisconsin. Periodic fire kept Pine Barrens in their natural state, with scattered pine trees, grassy ground cover, and low shrubs. Historically, Pine Barrens covered more than 2 million acres of Wisconsin, but due to fire suppression and other forestry activities, today only a few thousand acres remain. Forest managers are now working to restore additional Pine Barrens on a few public forests in Northeastern Wisconsin by using “prescribed” (planned and controlled) burning, cutting brush and timber, and other methods. Their goals are to reduce wildfire risk, improve habitat for plants and animals, and increase recreation like berry-picking, hunting, and wildlife viewing. Periodic burning would have some short-term effects including smoke and blackened areas, and there would be a long-term change in the typical “look” of the current landscape such as the one pictured below.
The image referred to at the end of the statement depicted a typical red pine stand in the project area prior to any restoration treatment and was very similar to Figure 2c. The image was also provided to the respondent half that did not receive the informational statement and was used by both groups as a reference anchor from which to compare visual scenarios for the preference choice task.
Initial survey questions asked respondents about the characteristics of their woodland property and their use of it (years of ownership, size, frequency, and seasons of use). After the acceptability tasks, we asked respondents questions about their knowledge of (4 responses from “never heard of them” to “know a lot about them”) and prior experience visiting pine barrens (yes/no/do not know), participation in outdoor recreation activities in the last 12 months (19 items plus “other”), and perceived importance of goals for managing public forests near landowners’ woodland property (11 items 1 = very unimportant; 5 = very important). The survey ended with social-demographic questions (age, gender, education, race/ethnicity) and whether they or family members were employed in the forest industry (yes/no).

2.5. Data Collection

Family forest owners are a key stakeholder group for project managers and the dominant owners of land near the project area. We randomly selected a 25% sample of the 10,560 family-forest owners who held parcels ≥ 0.1 ha within a 16km radius of the project area using land information databases from the two adjacent counties (n = 2417 usable addresses). Property tax information for the parcels included the owners’ mailing addresses, which were used to send individuals a letter requesting their participation in a survey about managing public forest lands in Northeastern Wisconsin. Respondents were directed to the online Qualtrics survey using a unique identification number and could request a hard copy format if desired. A follow-up postcard was mailed after ten days, followed by another letter requesting to complete the questionnaire two weeks later. The sampling yielded 566 respondents who completed 60% or more of the questionnaire (23.4% usable return rate). Removal of additional respondents that had missing data for the verbal and visual acceptability tasks yielded 466 questionnaires as for the analyses.
All subjects gave their informed consent for inclusion before they participated in the study. The study was conducted in accordance with the Declaration of Helsinki, and the protocol was approved by the Institutional Review Board of the University of Minnesota under expedited review procedures for activities classified as posing minimal risk to human subjects (CON000000066669).

2.6. Data Analysis

2.6.1. Analysis of Verbal Acceptability Ratings

To evaluate the relative acceptability of restoration treatments (Hypothesis 1) we visually compared the mean score ratings of individual acceptability items across all respondents. To test the effects of the informational intervention (Hypothesis 3), we segmented the respondent sample and compared the mean scores between those who received the informational statement and those who did not using t-tests.
To explore heterogeneity in verbal acceptability ratings among landowners (Hypothesis 4), we first conducted a factor analysis of individual acceptability items (varimax rotation), testing the solution with a reliability analysis (Cronbach’s alpha > 0.6) [62]. The resulting factors were then subjected to a hierarchical cluster analysis followed by a k-means cluster approach. The proposed four-cluster solution was confirmed by visual inspection of the dendrogram. A two-step cluster analysis suggested a five-cluster solution but did not provide useful results. Welch’s ANOVA/ANOVA was used to test differences between cluster means; when necessary, these were followed with Bonferroni or Tamhane post hoc tests, respectively. To help interpret the clusters we used attitude, use, knowledge/experience, and social-demographic items from the survey and tested their significance with Kruskal–Wallis (ordered data) or Chi-square (categorical data) tests. All analyses were done in IBM SPSS 25.

2.6.2. Analysis of Visual Scenarios and Comparison with Verbal Ratings

All attribute levels were effects coded with N-categorical variables defined by N-1 estimates only [63]. Latent Gold Choice 5.1 statistical software [64] was used to estimate the part-worth utilities and standard errors of each attribute level, i.e., the acceptability of each restoration treatment, of the logit model across all respondents. To evaluate the relative acceptability of restoration treatment practices (Hypothesis 1), the importance of each attribute was calculated by dividing the maximum range of parameter estimates between the levels of one attribute by the sum of the maximum ranges of all attributes [64]. To test the effects of the informational intervention (Hypothesis 3), we segmented the respondent sample and compared the parameter estimates between those who received the informational statement and those who did not using a Wald test. To further examine heterogeneity in acceptability judgments (Hypothesis 4), we segmented parameter estimates by the cluster-defined landowner groups and tested for differences using Wald tests. To compare verbal and visual acceptability approaches (Hypothesis 2), the attribute level parameter estimates from the visual scenario judgments were visually compared with similar items from the verbal acceptability ratings.

3. Results

3.1. Profile of Respondents

Respondents averaged 61.5 years in age, 76% were male, 38% had a college degree or higher, and 2.4% worked or had a family member who worked in the forest industry. Respondents owned their property an average of 19.4 years with an average property size of 8 ha. Respondents included 27% year-round residents, 38% seasonal residents, and 33% non-residents (e.g., camping, day visits; no residential structure on property). About 53% had never heard of pine barrens, 26% had only heard of them, 18% had some knowledge about pine barrens, and 3% knew a lot about them. One-fifth had visited pine barrens before, while 30% were not sure having ever visited them. Respondents engaged in a variety of outdoor recreation activities in the past 12 months, with the three most frequent activities viewing scenery (86.7%), relaxing (86.1%), and hiking/walking (83.5%). The three most important goals for managing public forests near respondents’ woodland property were maintaining water quality, preventing wildfire, and managing habitat.

3.2. Verbal Acceptability Ratings

Results from the analysis of verbal acceptability ratings generally supported Hypothesis 1 that less intensive treatments would be more acceptable to landowners (Table 3). For overstory tree removals, 85.3% of respondents found selective thinning to be acceptable or very acceptable and while a majority (58.3%) also felt this way about small (4 ha) clearcuts, acceptability dropped sharply for larger clearcuts of 8 (35.9%), 16 (25.5%), and 40 ha or more (15.6%). For understory treatments, mowing and infrequent burning were acceptable or very acceptable to the majority of respondents (60.7% and 58.3%, respectively), but acceptability again dropped considerably with frequent burning (34.7%) and herbicide (36.9%) treatments. Reintroduction of endangered plant species was acceptable or very acceptable to 72.6% of landowners, but leaving standing dead trees in the landscape was less acceptable (41.2%).
The factor analysis of verbal acceptability items yielded three factors (Table 3). Factor 1 included items associated with clearcuts of least 8 ha (“Large Openings”); Factor 2 was associated with measures indicating selective over- and understory treatments and small clearcuts (“Selective Openings”), and Factor 3 dealt with fire management (“Fire”). Despite various trial solutions with different numbers of factors and rotations, the items relating to herbicides, endangered plant reintroduction, and standing dead trees were excluded from all solutions because of low factor loadings (< 0.400).
We found partial support for Hypothesis 3 that those who received information about pine barrens restoration and goals would find treatments more acceptable than those not receiving the informational statement. Information recipients had significantly higher factor means for two of the three factors: Factor 2 (Selective Openings, p < 0.05) and Factor 3 (Fire, p < 0.05).

Landowner Heterogeneity

The cluster analysis suggested a 4-cluster solution (Table 4). Cluster sizes ranged from 14.6% to 41.0% of landowners, showing significant differences in acceptability factor means for treatments between the clusters. Cluster 1 included respondents who found all of the factors and individual treatments acceptable (M > 3.0 on a 5-pt. scale). Cluster 2 was the largest cluster and included respondents who supported selective openings but found larger clearcuts unacceptable. Respondents in Cluster 2 also found fire more acceptable than Clusters 3 and 4, though their support waned with the use of frequent fire. Cluster 3 members neither accepted nor rejected most factors; compared with Cluster 2 they found larger clearcuts much more acceptable but were somewhat less accepting of fire and selective treatments. For members of Cluster 4, none of the factors were acceptable (M < 3.0 on a 5-pt. scale). The only single-item means that rose above the mid-point of the acceptability scale for Cluster 4 were for selective thinning and endangered plant reintroduction.
In exploring associations between cluster membership and other questionnaire items, we found moderate support for Hypothesis 4 that landowners who had greater familiarity and experience with forestry issues and pine barrens management would rate the acceptability of treatments higher than those without familiarity and experience. Consistent with this hypothesis, we found that landowners in Cluster 1 (“all treatments are acceptable”) were more likely to be or have family members employed in the forest industry compared to other clusters (p < 0.05). Cluster 1 landowners also rated resource-use goals for managing public forests near their property such as managing timber, roads, wildlife, and fisheries higher in importance than other groups (Table 5) and were more likely to participate in the consumptive outdoor recreation activities of hunting, trapping, and berry picking (Table 6). Contrary to our Hypothesis 4, however, prior knowledge and past experience visiting pine barrens failed to distinguish landowner groups. As for other questionnaire items, Cluster 1 had the youngest respondents (M = 58.1 years) and Cluster 3 had the oldest (M = 63.3 years) (F = 3.824, p < 0.05). No differences between clusters emerged with respect to years of ownership, property size, gender, or time spent on their property.

3.3. Visual Acceptability Scenarios

3.3.1. Overall Logit Model

For the overall logit model, five of the six attributes were significant at or beyond the p < 0.05 level and the standing dead trees attribute was significant at the p < 0.10 level (Table 7). In support of Hypothesis 1, attribute levels portraying lower-intensity restoration treatments had higher positive acceptability parameter estimates than higher intensity treatments. For restoration treatments to manage overstory openness, spatial configuration was the dominant attribute (Table 8, see “All” column) and more enclosed configurations with trees in the foreground and spread across all distance zones were more acceptable. Higher tree density (15%) and clumped tree distribution also contributed to greater acceptability. For understory treatments, fire was the dominant attribute and very low fire intervals (30 yr) were associated with higher acceptability. A small amount of (5%) shrub cover was also associated with higher acceptability. Zero dead trees was the most acceptable treatment level.
These findings generally correspond to acceptability ratings of similar restoration treatments for the verbal descriptions and thus support Hypothesis 2. For example, both spatial configuration Levels 1 (foreground) and 2 (trees spread evenly) and selective thinning and small clearcuts portrayed lower intensity treatments for managing canopy openness and were similarly more highly acceptable, while spatial configuration Levels 3 (midground) and 4 (background) portrayed unacceptable overstory treatments similar to 8 to 40 ha clearcuts. Prescribed fire treatments were also judged similarly between the two approaches. The only questionable difference was for standing dead trees, which garnered a neutral rating in the verbal descriptions but were mostly deemed negative in the visual scenarios.
In contrast to the verbal acceptability ratings, we did not find support in logit model segmentation for Hypothesis 3: those who received information about pine barrens restoration and goals rated the acceptability of the visual choice scenarios essentially the same as those not receiving the informational statement.

3.3.2. Logit Model Segmentation by Landowner Clusters

Differences in the acceptability of treatments between the clusters were only found for the constant (p < 0.001) and spatial configuration attribute (p < 0.01) (Table 8 and Table 9). In partial support of Hypothesis 2, differences in the constant indicate that Cluster 1 judged most scenarios (81% of those shown) as acceptable, followed by cluster 3 with 71.1% and Cluster 2 with 70.3%, while for Cluster 4 only 57% of scenarios were acceptable. Figure 4 provides examples of scenarios showing differences in acceptability between Clusters 1 and 4, the two most disparate clusters.
While the differences in terms of the spatial configuration attribute between clusters may be due in part to differences in the magnitude of the parameter values, the pattern of differences generally parallels findings from the earlier segmentation findings (Table 4), where Cluster 1 found larger overstory openings more acceptable (less unacceptable) than the other clusters (Figure 5). Cluster 1 also found frequent fires more acceptable (less unacceptable) than other groups. These patterns are consistent with support for Hypothesis 4 in that Cluster 1 includes landowners whose employment, recreation participation, and attitudes toward forest management indicate greater familiarity and experience.
Other results showed differences between clusters with respect to the relative importance of selected attributes (Table 8) and the significance of attribute levels (Table 9). The patterns, however, were less interpretable and did not readily conform to our hypothesized relationships.

4. Discussion

This study examined landowner acceptability of treatments for restoring pine barrens, a globally imperiled open forest landscape. We employed verbal and visual approaches to evaluate the relative acceptability of treatments that affect the openness of canopy and understory conditions, compared these approaches with each other, and explored whether judgments of acceptability were affected by an informational statement about the purpose and goals of restoration or for other reasons differed among landowners. For a sample of family-forest owners whose land was located near a major pine barrens restoration project in Northeastern Wisconsin, we found that, with some exceptions, landowners largely accepted treatments that led only to marginal or modest changes from current closed forest conditions.

4.1. Acceptability of Treatments and Comparison of Judgment Approaches

Our findings generally supported Hypothesis 1, that landowners would judge less intensive treatments as more acceptable than highly intensive treatments that would create high degrees of openness. Acceptability ratings for five overstory treatments described in our verbal scales declined in linear fashion as openness moved from selective thinning of trees to large clearcuts. In support of Hypothesis 2, this pattern was generally echoed by the parameter estimates of the first four levels (foreground trees to background trees) of the spatial configuration attribute of our visual scenario model. While few studies have examined the restoration of open forest landscapes, these patterns were expected as they are highly consistent with much of the literature on the preference and acceptability of forest harvest and ecological management practices [34,37,65,66]. Our work helps to extend this finding to the unique context of pine barrens restoration, and the validity of the relationship is strengthened by demonstrating similar results in comparing verbal and visual acceptability judgments [67,68].
While the verbal descriptions allowed respondents to cognitively understand the magnitude of changes in overstory openness, the visual scenarios showed what the effect of treatment looks like on the ground. That we found general equivalence in support of our hypothesis is encouraging, but for this range of treatments, we also acknowledge the limitations of verbal approaches in assessing more nuanced changes to the landscape that visual scenarios can provide [67]. For Levels 5 and 6 of our spatial configuration attributes, we found that by leaving a small number of trees in the foreground view (1%), acceptability judgments of otherwise negatively perceived wide-open barrens increased significantly. Combined with other treatments affecting tree density and distribution, restoration managers can use our model results to make restoration projects more acceptable to stakeholders, for example, by leaving single trees and groves of trees near the foreground at key observation points and occasional spots along roads and trails [46,65].
Our findings on understory treatments also found declining acceptability for more frequent fire intervals and general equivalency between the verbal scales and visual scenarios. Here, however, we see a potential advantage in the verbal approach in communicating treatments that are difficult to visualize directly. We simulated fire char on trees and understory grasses and shrubs in the three-year interval, but this was difficult to see after ten years and a 30 yr interval only showed trees and shrubs that had grown due to lack of burning. More importantly, we were able to evaluate the acceptability of mechanical and chemical understory control methods, which besides being only indirectly observable may also connect with important beliefs and values held by public stakeholders [12,20]. Future research on the acceptability of treatments thus might consider making use of a combined verbal and visual approach to provide nuance on treatments that can be accurately visualized supplemented with information on treatments that are not easily visualized and/or that may carry important meanings to respondents.
Finally, while the acceptability choice task used for the visual scenario precluded a direct comparison of parameter estimates with the preference choice task we reported on in our earlier paper [9], an inspection of plots of the estimates for the first four spatial configuration levels showed less steep of a decline in acceptability compared with preference judgments as openings increased in size. As hypothesized by the literature and supported by some studies [15], this may indicate that landowners judged acceptability as different from their purely affective assessment of the scenarios. In the case of pine barrens restoration, it may be that large scale openings, while still seen as negative, might not be that much more negative than moderate scale openings in terms of their acceptability. This finding may give managers some flexibility in creating larger openings if necessary, for example, for meeting habitat requirements for successful grassland bird reproduction.

4.2. Information Effects and Heterogeneity of Acceptability Judgments

Analysis of the verbal ratings led to partial support for Hypothesis 3, that information about restoration goals would increase acceptability judgments, where those who received the informational statement found treatments relating to selective openings and fire more acceptable than those not receiving the statement. However, the same intervention, when tested in the context of our visual scenario data, showed no differences between recipients and non-recipients. While short-term informational interventions of this type have shown inconsistent effects on preference and acceptability as employed in other studies on forest management [47,48], the purpose of such interventions must be considered within the broader context of stakeholder knowledge and familiarity.
Our cluster analysis of the verbally described factors identified a minority group of landowners (Cluster 1, 19.5% of the sample) who found all of the verbally-described treatments acceptable and also judged 81% of all of the visual scenarios acceptable. Who were these people? With respect to Hypothesis 4, while they did not claim prior knowledge of or experience visiting pine barrens specifically, other questionnaire data showed that in comparison to the other, less accepting landowner groups, they were more likely to be or have family employed in the forest industry, participated in consumptive outdoor recreation activities such as hunting and trapping, and saw public forest management for timber, fisheries, and wildlife as more important than other clusters. Additionally, along with their more utilitarian orientation, this group saw increasing species diversity and reintroducing rare habitats as important reasons for managing public forests to a greater extent than other landowner segments.
These findings are consistent with other studies of forest management preference and acceptability showing heterogeneity among stakeholders, and in partial support of Hypothesis 4 reveal how broader measures of knowledge and familiarity might aid in the understanding and acceptability of restoration activities [69,70]. The findings also broadly comport with the heterogeneity we found in our latent class analysis of the preference data as reported in our earlier paper [9].

4.3. Management Implications

Given the current imperiled status of pine barrens, restoration ecologists have emphasized instituting treatments that favor widely open conditions, particularly large clearcuts and frequent burning [71]. However, the scope of ecosystem services is broad, and from a human dimension’s perspective, our research suggests that to be more socially acceptable, changes should be implemented cautiously. This might begin with treatments that bring about smaller-scale changes, at least in the short term, because intensive restoration treatments can radically change the landscape to which the local population is accustomed. That there is significant heterogeneity in stakeholder acceptability judgments is encouraging, however, and as more people come to see, use, and understand the values of open forest landscapes, larger scale, more intensive treatments may become more broadly acceptable. Forest managers and restoration practitioners can advance this progression through the design of restoration treatments that balance social and ecological concerns and by communicating the various intrinsic and instrumental values of these landscapes in ways that resonate with stakeholders. Further, given the inconsistent findings of static information, more engaging approaches such as immersive virtual reality might be considered [67,72].

5. Conclusions

A survey of family forest owners who held property near a landscape scale pine barrens restoration project in Northeastern Wisconsin helped answer important substantive and methodological questions related to the acceptability of a range of treatments commonly used in the restoration of open forest landscapes. In using two different approaches to describing treatments to study participants—verbal scales and visual choice scenarios—we found substantial convergence in support for our hypothesis that more intensive treatments would be judged less acceptable. However, each method also had unique advantages in conveying restoration options to forest stakeholders and together provided a more complete picture upon which to base management decisions. Additional study components and analyses examined the effects of information and landowner familiarity and experience on acceptability judgments. While our hypotheses here were only partially supported, the findings suggest that improving communications with stakeholders and encouraging participation in activities that bring stakeholders in closer contact with restored areas could lead to greater acceptance of pine barrens and other open forest landscapes.

Author Contributions

Conceptualization, I.E.S., P.H.G., A.A., K.M.F. and A.L.H.; methodology, A.A.; software, A.A.; validation, A.A. and I.E.S.; formal analysis, A.A., I.E.S. and R.E.; investigation, I.E.S. and A.A.; resources, I.E.S. and A.A.; data curation, I.E.S. and A.A.; writing—original draft preparation, A.A. and P.H.G.; writing—review and editing, P.H.G., A.A., I.E.S., K.M.F. and A.L.H.; visualization, A.A.; supervision, I.E.S. and A.A.; project administration, I.E.S., P.H.G. and A.A.; funding acquisition, P.H.G., I.E.S., K.M.F., A.A. and A.L.H. All authors have read and agreed to the published version of the manuscript.

Funding

This research was supported by Research Joint Venture Agreement 17-JV-11242309-037 between the USDA Forest Service Northern Research Station and the University of Minnesota.

Institutional Review Board Statement

The study was conducted in accordance with the Declaration of Helsinki, and the protocol was approved by the Institutional Review Board of the University of Minnesota under expedited review procedures for activities classified as posing minimal risk to human sub-jects (CON000000066669).

Informed Consent Statement

Informed consent was obtained from all subjects involved in the study.

Data Availability Statement

The data presented in this study are available upon request from the corresponding author.

Acknowledgments

We thank John Lampereur (Chequamegon-Nicolet National Forest) and Brian Sturtevant, Deahn Donner-Wright, and Heather Jensen (Northern Research Station) for their assistance in the study. We also thank Rob Ribe (University of Oregon) and Jim Palmer (Scenic Quality Consultants) for feedback on our study plan, Don Anderson (StatDesign) for consulting on the experimental design, Tamara Schlagbauer (University of Natural Resources and Life Sciences, Vienna) for preparing the visual scenarios, Claire Benton (University of Minnesota) for data collection and preparation, and Hemma Preisel (University of Natural Resources and Life Sciences, Vienna) for map production.

Conflicts of Interest

The authors declare no conflict of interest.

References

  1. Bennett, E.M.; Peterson, G.D.; Gordon, L.J. Understanding relationships among multiple ecosystem services. Ecol. Lett. 2009, 12, 1394–1404. [Google Scholar] [CrossRef] [PubMed]
  2. Kreye, M.M.; Rimsaite, R.; Adams, D.C. Public attitudes about private forest management and government involvement in the southeastern United States. Forests 2019, 10, 776. [Google Scholar] [CrossRef] [Green Version]
  3. Ishii, H.T.; Tanabe, S.; Hiuri, T. Exploring the relationships among canopy structure, stand productivity, and biodiversity of temperate forest ecosystems. For. Sci. 2004, 50, 342–355. [Google Scholar]
  4. Stanturf, J.; Lamb, D.; Madsen, P. (Eds.) Forest Landscape Restoration: Integrating Natural and Social Sciences; World Forests 15; Springer: Dordrecht, The Netherlands, 2012. [Google Scholar] [CrossRef]
  5. Arnberger, A.; Schoissengeier, R. The other side of the border: Austrian local residents’ attitudes towards the neighbouring Czech Sumava National Park. J. Nat. Conserv. 2012, 20, 135–143. [Google Scholar] [CrossRef]
  6. Stoll-Kleemann, S. Barriers to nature conservation in Germany: A model explaining opposition to protected areas. J. Environ. Psych. 2001, 21, 369–385. [Google Scholar] [CrossRef] [Green Version]
  7. Curtis, J.T. The Vegetation of Wisconsin: An Ordination of Plant Communities; University of Wisconsin Press: Madison, WI, USA, 1971. [Google Scholar]
  8. Quigley, K.M.; Kolka, R.; Sturtevant, B.R.; Dickinson, M.B.; Kern, K.C.; Donner, D.M.; Miesel, J.R. Prescribed burn frequency, vegetation cover, and management legacies influence soil fertility: Implications for restoration of imperiled pine barrens habitat. For. Ecol. Manage. 2020, 470–471, 118163. [Google Scholar] [CrossRef]
  9. Gobster, P.H.; Arnberger, A.; Schneider, I.E.; Floress, K.M.; Haines, A.L.; Dockry, M.J.; Benton, C. Restoring a “scenically challenged” landscape: Landowner preferences for pine barrens treatment practices. Landsc. Urban Plan. 2021, 211, 104104. [Google Scholar] [CrossRef]
  10. Ribe, R.G. Is scenic beauty a proxy for acceptable management? The influence of environmental attitudes on landscape perceptions. Environ. Behav. 2002, 34, 757–780. [Google Scholar] [CrossRef]
  11. Brunson, M.W. A definition of “social acceptability” in ecosystem management. In Defining Social Acceptability in Ecosystem Management: A Workshop Proceedings; General Technical Report PNW-GTR-369; Brunson, M.W., Kruger, L.E., Tyler, C.B., Schroeder, S.A., Eds.; U.S. Department of Agriculture, Forest Service, Pacific Northwest Research Station: Portland, OR, USA, 1996; pp. 7–16. [Google Scholar]
  12. Shindler, B.A.; Brunson, M.; Stankey, G. Social Acceptability of Forest Conditions and Management Practices: A Problem Analysis; General Technical Report PNW-GTR-537; U.S. Department of Agriculture, Forest Service, Pacific Northwest Research Station: Portland, OR, USA, 2002.
  13. Stankey, G.H.; Cole, D.N.; Lucas, R.C.; Petersen, M.E.; Frissel, S.S., Jr. The Limits of Acceptable Change (LAC) System for Wilderness Planning; General Technical Report INT-176; U.S. Department of Agriculture, Forest Service, Intermountain Forest and Range Experiment Station: Ogden, UT, USA, 1985.
  14. Brunson, M.W. “Socially acceptable” forestry: What does it imply for ecosystem management? West. J. Appl. For. 1993, 8, 116–119. [Google Scholar] [CrossRef]
  15. Ribe, R.G. Perceptions of forestry alternatives in the US Pacific Northwest: Information effects and acceptability distribution analysis. J. Environ. Psych. 2006, 26, 100–115. [Google Scholar] [CrossRef]
  16. Fuger, F.; Huth, F.; Wagner, S.; Weber, N. Can visual aesthetic components and acceptance be traced back to forest structure? Forests 2021, 12, 701. [Google Scholar] [CrossRef]
  17. Bright, A.D.; Newman, P. How forest context influences the acceptability of prescribed burning and mechanical thinning. In The Public and Wildland Fire Management: Social Science Findings for Managers; General Technical Report NRS-1; McCaffrey, S., Ed.; USDA Forest Service, Northern Research Station: St. Paul, MN, USA, 2006; pp. 47–52. [Google Scholar]
  18. Gobster, P.H.; Floress, K.; Westphal, L.M.; Watkins, C.A.; Vining, J.; Wali, A. Resident and user support for urban natural areas restoration practices. Biol. Conserv. 2006, 203, 216–225. [Google Scholar] [CrossRef] [Green Version]
  19. Schlueter, A.; Schneider, I.E. Emerald ash borer management: Visitor acceptance and confidence. For. Sci. 2016, 16, 316–322. [Google Scholar] [CrossRef]
  20. Toman, E.; Shindler, B.; McCaffrey, S.; Bennett, J. Public acceptance of wildland fire and fuel management: Panel responses in seven locations. Environ. Manag. 2014, 54, 557–570. [Google Scholar] [CrossRef] [Green Version]
  21. Western, J.M.; Cheng, A.S.; Anderson, N.M.; Motley, P. Examining the social acceptability of forest biomass harvesting and utilization from collaborative forest landscape restoration: A case study from western Colorado, USA. J. For. 2017, 115, 530–539. [Google Scholar] [CrossRef] [Green Version]
  22. Busse, M.; Siebert, R. Acceptance studies in the field of land use—A critical and systematic review to advance the conceptualization of acceptance and acceptability. Land Use Policy 2018, 76, 235–245. [Google Scholar] [CrossRef]
  23. Clausen, D.L.; Schroeder, R.F. Social Acceptability of Alternatives to Clearcutting: Discussion and Literature Review with Emphasis on Southeast Alaska; General Technical Report PNW-594; U.S. Department of Agriculture, Forest Service, Pacific Northwest Research Station: Portland, OR, USA, 2004.
  24. Ford, R.M.; Williams, K.J.H.; Bishop, I.D.; Hickey, J.E. Public judgements of the social acceptability of silvicultural alternatives in Tasmanian wet eucalypt forests. Austral. For. 2009, 72, 157–171. [Google Scholar] [CrossRef]
  25. Peterson, C.L.; Vaske, J.J. Colorado residents’ familiarity, aesthetic evaluations, and approval of forest management practices. J. For. 2017, 115, 10–15. [Google Scholar] [CrossRef]
  26. Edwards, D.; Jay, M.; Jensen, F.; Lucas, B.; Marzano, M.; Montagne, C.; Peace, A.; Weiss, G. Public preferences for structural attributes of forests: Towards a pan-European perspective. For. Policy Econ. 2012, 19, 12–19. [Google Scholar] [CrossRef]
  27. Gundersen, V.; Frivold, L.H. Public preferences for forest structures: A review of quantitative surveys from Finland, Norway and Sweden. Urban For. Urban Green. 2008, 7, 241–258. [Google Scholar] [CrossRef]
  28. Ribe, R.G. The aesthetics of forestry: What has empirical preference research taught us? Environ. Manag. 1989, 13, 55–74. [Google Scholar] [CrossRef]
  29. Miller, C.A.; Campbell, L.K.; Yeagle, J.A. Attitudes of Residents in the Greater Chicago Region toward Prescribed Burns and Ecological Restoration: A Report to the Chicago Wilderness Burn Communications Team; Human Dimensions Program Report SR-02-02; Illinois Natural History Survey: Champaign, IL, USA, 2002. [Google Scholar]
  30. Ryan, R.L. Social Science to Improve Fuels Management: A Synthesis of Research on Aesthetics and Fuels Management; General Technical Report NC-261; USDA Forest Service, Northern Research Station: St. Paul, MN, USA, 2005. [Google Scholar]
  31. Shindler, B.; Gordon, R.; Brunson, M.W.; Olsen, C. Public perceptions of sagebrush ecosystem management in the Great Basin. Rangel. Ecol. Manag. 2012, 64, 335–343. [Google Scholar] [CrossRef]
  32. Zube, E.H.; Sell, J.L.; Taylor, J.G. Landscape perception: Research, application and theory. Landsc. Plan. 1982, 9, 1–33. [Google Scholar] [CrossRef]
  33. Brunson, M.W.; Reiter, D.K. Effects of ecological information on judgments about scenic impacts of timber harvest. J. Environ. Manag. 1996, 46, 31–41. [Google Scholar] [CrossRef]
  34. Ribe, R. Regeneration harvests versus clearcuts: Public views of the acceptability and aesthetics of Northwest Forest Plan harvests. Northwest Sci. 1999, 73, 102–117. [Google Scholar]
  35. Hauru, K.; Koskinen, S.; Kotze, D.J.; Lehvävirta, S. The effects of decaying logs on the aesthetic experience and acceptability of urban forests—Implications for forest management. Landsc. Urban Plan. 2014, 123, 114–123. [Google Scholar] [CrossRef]
  36. Orland, B. Commentary: Persuasive new worlds: Virtual technologies and community decision-making. Landsc. Urban Plan. 2015, 142, 132–135. [Google Scholar] [CrossRef]
  37. Arnberger, A.; Ebenberger, M.; Schneider, I.E.; Cottrell, S.; Schlueter, A.C.; von Ruschkowski, E.; Venette, R.C.; Snyder, S.A.; Gobster, P.H. Visitor preferences for visual changes in bark beetle-impacted forest recreation settings in the United States and Germany. Environ. Manag. 2018, 61, 209–223. [Google Scholar] [CrossRef]
  38. Ebenberger, M.; Arnberger, A. Exploring visual preferences for structural attributes of urban forest stands for restoration and heat relief. Urban For. Urban Green. 2019, 41, 272–282. [Google Scholar] [CrossRef]
  39. Orland, B.; Daniel, T.C.; Haider, W. Calibrated images: Landscape visualizations to meet rigorous experimental design specifications. In Proceedings of the Combined Events of the 17th Annual Geographic Information Seminar and the Resource Technology ‘94 Symposium, Toronto, ON, Canada, 12–16 September 1994; Power, M.J., Strome, M., Daniel, T.C., Eds.; American Society for Photogrammetry and Remote Sensing: Bethesda, MD, USA, 1995; pp. 919–926. [Google Scholar]
  40. Gordon, R.; Brunson, M.W.; Shindler, B. Acceptance, acceptability, and trust for sagebrush restoration options in the Great Basin: A longitudinal perspective. Rangel. Ecol. Manag. 2014, 67, 573–583. [Google Scholar] [CrossRef] [Green Version]
  41. Wagner, R.G.; Flynn, J.; Gregory, R.; Mertz, C.K.; Slovic, P. Acceptable practices in Ontario’s forests: Differences between the public and forestry professionals. New For. 1998, 16, 139–154. [Google Scholar] [CrossRef]
  42. Nordén, A.; Coria, J.; Jönsson, A.M.; Lagergren, F.; Lehsten, V. Divergence in stakeholders’ preferences: Evidence from a choice experiment on forest landscapes preferences in Sweden. Ecol. Econ. 2017, 132, 179–196. [Google Scholar] [CrossRef] [Green Version]
  43. Tyrväinen, L.; Mäntymaa, E.; Juutinen, A.; Kurttila, M.; Ovaskainen, V. Private landowners’ preferences for trading forest landscape and recreational values: A choice experiment application in Kuusamo, Finland. Land Use Policy 2021, 107, 104478. [Google Scholar] [CrossRef]
  44. Gundersen, V.; Stange, E.E.; Kaltenborn, B.P.; Vistad, O.I. Public visual preferences for dead wood in natural boreal forests: The effects of added information. Landsc. Urban Plan. 2017, 158, 12–24. [Google Scholar] [CrossRef]
  45. Gutierrez-Castillo, A.; Penn, J.; Tanger, S.; Blazier, M.A. Conservation easement landowners’ willingness to accept for forest thinning and the impact of information. For. Policy Econ. 2022, 135, 102627. [Google Scholar] [CrossRef]
  46. Gobster, P.H. An ecological aesthetic for forest landscape management. Landsc. J. 1999, 18, 54–64. [Google Scholar] [CrossRef]
  47. Hill, D.; Daniel, T.C. Foundations for an ecological aesthetic: Can information alter landscape preferences? Soc. Nat. Resour. 2008, 21, 34–49. [Google Scholar] [CrossRef]
  48. Kearney, A.R. Effects of an informational intervention on public reactions to clear-cutting. Soc. Nat. Resour. 2001, 14, 777–790. [Google Scholar] [CrossRef]
  49. Ribe, R.G.; Ford, R.M.; Williams, K.J.H. Clearfell controversies and alternative timber harvest designs: How acceptability perceptions vary between Tasmania and the U.S. Pacific Northwest. J. Environ. Manag. 2013, 114, 46–62. [Google Scholar] [CrossRef]
  50. Giergiczny, M.; Czajkowski, M.; Żylicz, T.; Angelstam, P. Choice experiment assessment of public preferences for forest structural attributes. Ecol. Econ. 2015, 119, 8–23. [Google Scholar] [CrossRef]
  51. Ryan, R.L. The influence of landscape preference and environmental education on public attitudes toward wildfire management in the Northeast pine barrens (USA). Landsc. Urban Plan. 2012, 107, 55–68. [Google Scholar] [CrossRef]
  52. Toledo, D.; Kreuter, U.P.; Sorice, M.G.; Taylor, C.A. The role of prescribed burn associations in the application of prescribed fires in rangeland ecosystems. J. Environ. Manag. 2014, 132, 323–328. [Google Scholar] [CrossRef]
  53. Lampereur, J. Forest Vegetation Resource Report for the Lakewood Southeast Project, Chequamegon-Nicolet National Forest; USDA Forest Service: Rhinelander, WI, USA, 2013. [Google Scholar]
  54. Epstein, E.E. Natural communities, aquatic features, and selected habitats of Wisconsin. In The Ecological Landscapes of Wisconsin: An Assessment of Ecological Resources and a Guide to Planning Sustainable Management; Wisconsin Department of Natural Resources: Madison, WI, USA, 2017; Chapter 7. [Google Scholar]
  55. Kimmerer, R.W.; Lake, F.K. The role of indigenous burning in land management. J. For. 2001, 99, 36–41. [Google Scholar] [CrossRef]
  56. Shapiro, A. The Lure of the North Woods: Cultivating Tourism in the Upper Midwest; University of Minnesota Press: Minneapolis, MN, USA, 2013. [Google Scholar]
  57. Schewe, R.L.; Field, D.R.; Frosch, D.J.; Clendenning, G.; Jensen, D. Condos in the Woods: The Growth of Seasonal and Retirement Homes in Northern Wisconsin; University of Wisconsin Press: Madison, WI, USA, 2012. [Google Scholar]
  58. Radeloff, V.R.; Mladenoff, D.J.; Boyce, M.S. A historical perspective and future outlook on landscape scale restoration in the Northwest Wisconsin pine barrens. Restor. Ecol. 2000, 8, 119–126. [Google Scholar] [CrossRef]
  59. USDA Forest Service. Final Environmental Impact Statement, Lakewood Southeast Project; USDA Forest Service, Chequamegon-Nicolet National Forest: Lakewood, WI, USA, 2000. [Google Scholar]
  60. Floress, K.; Haines, A.; Usher, E.; Gobster, P.; Dockry, M. Landowner and Visitor Response to Forest Landscape Restoration: The Chequamegon-Nicolet National Forest Lakewood Southeast Project; Center for Land Use Education, University of Wisconsin—Stevens Point: Stevens Point, WI, USA, 2018. [Google Scholar]
  61. Gobster, P.H.; Schneider, I.E.; Floress, K.M.; Haines, A.L.; Arnberger, A.; Dockry, M.J.; Benton, C. Understanding the key characteristics and challenges of pine barrens restoration: Insights from a Delphi survey of forest land managers and researchers. Restor. Ecol. 2021, 29, e13273. [Google Scholar] [CrossRef]
  62. Cortina, J.M. What is coefficient alpha? An examination of theory and applications. J. Appl. Psych. 1993, 78, 98–104. [Google Scholar] [CrossRef]
  63. Louviere, J.J.; Hensher, D.A.; Swait, J.D. Stated Choice Methods—Analysis and Application; Cambridge University Press: London, UK, 2000. [Google Scholar]
  64. Vermunt, J.K.; Magidson, J. Technical Guide for Latent Gold Choice 4.0: Basic and Advanced; Statistical Innovations Inc.: Belmont, MA, USA, 2005. [Google Scholar]
  65. Arnberger, A.; Schneider, I.E.; Ebenberger, M.; Eder, R.; Venette, R.C.; Snyder, S.A.; Gobster, P.H.; Choi, A.; Cottrell, S. Emerald ash borer impacts on visual preferences for urban forest recreation settings. Urban For. Urban Green. 2017, 27, 235–245. [Google Scholar] [CrossRef]
  66. Floress, K.; Vokoun, M.; Huff, E.S.; Baker, M. Public perceptions of county, state, and national forest management in Wisconsin, USA. For. Policy. Econ. 2019, 104, 110–120. [Google Scholar] [CrossRef]
  67. Patterson, Z.; Darbani, J.M.; Rezaei, A.; Zacharias, J.; Yazdizadeh, A. Comparing text-only and virtual reality discrete choice experiments of neighbourhood choice. Landsc. Urban Plan. 2017, 157, 63–74. [Google Scholar] [CrossRef]
  68. Shr, Y.-H.; Ready, R.; Orland, B.; Echols, S. How do visual representations influence survey responses? Evidence from a choice experiment on landscape attributes of green infrastructure. Ecol. Econ. 2019, 156, 375–386. [Google Scholar] [CrossRef]
  69. Gundersen, V.; Frivold, L.H. Naturally dead and downed wood in Norwegian boreal forests: Public preferences and the effect of information. Scand. J. For. Res. 2011, 26, 110–119. [Google Scholar] [CrossRef]
  70. Van der Wal, R.; Miller, D.; Irvine, J.; Fiorini, S.; Amar, A.; Yearley, S.; Gill, R.; Dandy, N. The influence of information provision on people’s landscape preferences: A case study on understorey vegetation of deer-browsed woodlands. Landsc. Urban Plan. 2014, 124, 129–139. [Google Scholar] [CrossRef]
  71. Bried, J.T.; Patterson, W.A.; Gifford, N.A. Why pine barrens restoration should favor barrens over pine. Restor. Ecol. 2014, 22, 442–446. [Google Scholar] [CrossRef]
  72. Mokas, I.; Lizin, S.; Brijs, T.; Witters, N.; Malina, R. Can immersive virtual reality increase respondents’ certainty in discrete choice experiments? A comparison with traditional presentation formats. J. Environ. Econ. Manag. 2021, 109, 102509. [Google Scholar] [CrossRef]
Figure 1. Location of the Lakewood Southeast Project area in Northeastern Wisconsin.
Forests 13 00770 g001
Figure 2. Images of the Lakewood Southeast Project area: (a) Open landscape in 1928, prior to afforestation; (b) breaking the sod for tree planting, 1936; (c) red pine stand 2017, prior to restoration treatment; (d) red pine stand 2019, removal leaving 15% density of evenly scattered trees. All photos U.S. Department of Agriculture except upper left, by F.T. Thwaites, Wisconsin Geological and Natural History Survey.
Forests 13 00770 g002
Figure 3. Example of a choice set showing four visual scenarios of a pine barrens landscape under different treatment combinations. Question and response format for the acceptability judgment are shown below the set.
Forests 13 00770 g003
Figure 4. Examples of visual scenarios showing differences in acceptability judgments between the two most disparate landowner groups as identified by a cluster analysis: (a) Cluster 1: 94.6% acceptable, Cluster 4: 91.4% acceptable; (b) Cluster 1: 86.1% acceptable, Cluster 4: 39.4% acceptable; (c) Cluster 1: 62.8% acceptable, Cluster 4: 15.3% acceptable; (d) Cluster 1: 52.5% acceptable, Cluster 4: 10.5% acceptable.
Forests 13 00770 g004aForests 13 00770 g004b
Figure 5. Parameter values of the spatial configuration attribute per acceptability cluster (N = 466).
Forests 13 00770 g005
Table 1. Hypotheses and analyses for research.
HypothesesAnalyses
H1Acceptability of restoration treatments: Less intensive treatments such as selective thinning, small openings, and low frequency burning would be more acceptable than highly intensive treatments such as large openings and frequent burning.Compare mean scores (verbal scales); compare weights of individual attribute levels (DCE)
H2Verbal versus visual acceptability judgments: Treatments such as large openings and frequent burning that are both described verbally and depicted visually would be judged similarly. Comparison of findings between verbal and visual approaches; comparison of attribute level DCE model estimates for cluster-defined segments
H3Effects of information: Landowners who received an informational statement about the characteristics and goals of pine barrens restoration would rate the acceptability of treatments higher than those not receiving the statement.Yes/no segmentation of respondents and comparison of acceptability judgments for verbal and visual approaches
H4Heterogeneity of acceptability judgments: Landowners who had greater familiarity and experience with forestry issues and pine barrens management would rate the acceptability of treatments higher than those with lesser familiarity and experience.Cluster analysis of verbal acceptability factor ratings and exploratory covariate analysis; cluster segmentation of DCE logit estimates
Table 2. Description and specification of attributes and attribute levels used in the visual choice scenarios.
AttributesAttribute LevelsDescription
Spatial
configuration
(1)
Trees in foreground
(2)
Trees evenly spread
(3)
Trees in midground
(4)
Trees in background
(5)
Trees in midground with 1% forest cover foreground
(6)
Trees in background with 1% forest cover foreground
The spatial configuration attribute simulated increasing openness by showing trees concentrated in the foreground (Level 1), midground (Level 3), or background (Level 4). Level 2 distributed evenly trees across the landscape. Levels 5 and 6 explored specific treatment designs by placing 1% of all trees close to the observer viewpoint in the foreground and the rest of the trees distributed in the mid- or background.
Tree density
(1)
5% tree cover
(2)
15% tree cover
(3)
25% tree cover
(4)
35% tree cover
Tree cover ranged between 5%–35%, reflecting the range characterized by forest experts. In cases of high tree density, a small view corridor was always present in the image, allowing a view to the background landscape.
Tree distribution
(1)
Scattered trees
(2)
Clumps of trees
(3)
Mix of scattered and clumped trees
This attribute showed different design options by trees either scattered in the landscape (Level 1), grouped as clumps (Level 2), or appearing as a 1:1 mix of both tree distributions (Level 3).
Fire interval
(1)
3-year interval
(2)
10-year interval
(3)
30-year interval
Each interval simulated conditions just before the next fire. Level 1 showed lower understory vegetation, greater thermal pruning of trees and more dark open patches of ground, and a darker bark of trees to simulate fire charring compared to the other levels.
Shrub density
(1)
0% shrub cover
(2)
5% shrub cover
(3)
30% shrub cover
(4)
60% shrub cover
Shrub density ranged from 0%–60% of land cover. The height of shrubs, not their amount, depended on the fire interval. Frequent fire intervals reduced the height of shrubs.
Standing dead trees & blueberries
(1)
0 dead trees
(2)
4 dead trees
(3)
4 dead trees & blueberries
(4)
8 dead trees
The number of standing dead trees ranged from 0–8 and were shown in the foreground. Flowering blueberry bushes were shown in the immediate foreground (Level 3).
Table 3. Single item means and factor loadings for verbal acceptability ratings of restoration treatments (N = 466) 1.
How Acceptable to You Is the Use of Each of These Approaches to Restore a Pine Barrens?Factors
MeanLarge Openings (1)Selective Openings (2)Fire
(3)
Large areas where most of the trees are cut, 40 acres (16 ha)2.580.928
Very large areas where most of the trees are cut, 100+ acres (40 ha)2.170.893
Medium areas where most of the trees are cut, 20 acres (8 ha)2.940.797(−0.411)
Selective logging to thin trees4.05 0.760
Small areas where most of the trees are cut, less than 10 acres (4 ha)3.44(−0.489)0.680
Mowing or mechanical means to maintain open understory conditions3.55 0.678
Planned and controlled, low-intensity fire every 10 years3.50 0.876
Planned, low-intensity fire every 3 years3.02 0.843
Reintroduction of endangered plant species3.87
Leaving dead trees standing in the landscape3.05
Use of herbicides to remove invasive woody species2.81
Variance explained (total 75.1%) 32.60%21.70%20.80%
Cronbach’s Alpha 0.8940.6140.746
1 Varimax-rotation; KMO = 0.754; variance explained 75.1%; response scale: 1 = very unacceptable to 5 = very acceptable; factor loadings < 0.400 not shown; factor loadings in parentheses not used in reliability analysis.
Table 4. Factor and single-item means for landowner groups identified by cluster analysis of restoration treatment factors (overall N = 466; percentage of cluster share in parentheses) 1.
MeansAllCluster 1
(19.5%)
“All Are
Acceptable”
Cluster 2
(41.0%)
“No Clearcut”
Cluster 3
(24.9%)
“In Between”
Cluster 4
(14.6%)
“Nothing Is Acceptable”
Factors ANOVA (Welch)
Larger Openings (1)2.563.85 a1.97 b3.26 c1.33 dF = 517.8,
p < 0.0001
Selective Openings (2)3.684.34 a3.86 b3.49 c2.58 dF = 178.7,
p < 0.0001
Fire (3)3.264.26 a3.27 b2.89 c2.53 dF = 121.7,
p < 0.0001
Single items Kruskal-Wallis-Test
Large areas where most of the trees are cut, 40 acres (16 ha)2.584.00 a1.88 b3.37 c1.26 dp < 0.0001
Very large areas where most of the trees are cut, 100+ acres (40 ha)2.173.36 a1.45 b2.97 ac1.21 bdp < 0.0001
Medium areas where most of the trees are cut, 20 acres (8 ha)2.944.19 a2.57 b3.42 c1.50 dp < 0.0001
Selective logging to thin trees4.054.57 a4.19 b3.88 c3.22 dp < 0.0001
Small areas where most of the trees are cut, less than 10 acres (4 ha)3.444.25 a3.55 b3.48 b1.97 cp < 0.0001
Mowing or mechanical means to maintain open understory conditions3.554.21 a3.84 b3.12 c2.54 cp < 0.0001
Planned and controlled, low-intensity fire every 10 years3.504.33 a3.59 b3.08 c2.85 cp < 0.0001
Planned, low-intensity fire every 3 years3.024.2 a2.93 b2.71 b2.22 cp < 0.0001
Reintroduction of endangered plant species 3.874.21 a3.88 b3.65 c3.75 abcp < 0.0001
Leaving dead trees standing in the landscape 3.053.37 a2.97 b3.04 b2.87 bp < 0.05
Use of herbicides to remove invasive woody species 2.813.44 a2.73 b2.86 b2.10 cp < 0.0001
1 Response scale: 1 = very unacceptable to 5 = very acceptable; a–d means with the same superscripts do not differ at the p < 0.05 level; Items not assigned to a factor.
Table 5. Means of the importance of the goals for managing public forests near landowners’ property, per cluster (N = 466) 1.
ItemsAllCluster 1Cluster 2Cluster 3Cluster 4Kruskal-Wallis-Test
Manage timber for logging3.854.10 a3.83 ab3.90 ab3.47 bp < 0.05
Increase species diversity3.994.24 a3.96 b3.97 b3.81 bp < 0.001
Reintroduce rare habitats 3.794.07 a3.86 ab3.61 cd3.54 bdp < 0.0001
Manage wildlife habitat4.454.69 a4.47 ab4.41 bc4.15 bcp < 0.0001
Manage fisheries4.374.68 a4.34 b4.30 b4.15 bp < 0.0001
Prevent wildfire4.464.494.524.524.18n.s
Manage roads in the forest3.984.23 a3.92 b3.97 b3.87 abp < 0.001
Provide recreation opportunities4.064.26 a4.08 ab4.10 ab3.68 bp < 0.05
Provide beautiful landscapes4.114.114.224.013.94n.s.
Maintain water quality4.744.794.814.644.65n.s
Reduce greenhouse gas emissions4.103.924.214.054.06n.s.
1 Response scale 1 = very unimportant; 5 = very important; a–d means with the same superscripts do not differ at the p < 0.05 level.
Table 6. Percentage of respondents participating in outdoor recreation activities in the last 12 months, per cluster (N = 466).
ActivitiesAllCluster 1Cluster 2Cluster 3Cluster 4𝝌2
Viewing scenery86.793.4 a88.0 ab77.6 bc89.7 abcp < 0.01
Relaxing86.191.2 a89.0 a79.3 a82.4 ap < 0.05
Hiking/walking83.586.8 abc86.4 b73.3 c88.2 abcp < 0.01
Fishing77.386.873.877.673.5n.s.
Wildlife/bird Watching60.757.160.763.860.3n.s.
Berry picking57.969.2 a60.2 bc51.7 bc47.1 cp < 0.05
Hunting57.171.4 a52.4 bc63.8 ab39.7 cp < 0.001
Motor boating53.251.652.952.657.4n.s.
ATV/UTV riding51.557.147.156.048.5n.s.
Non-motorized boating45.151.645.536.250.0n.s.
Camping32.836.330.928.441.2n.s.
Picnicking25.827.526.219.832.4n.s.
Cross-country skiing/snowshoeing24.534.1 ab25.1 bc12.1 c30.9 abp < 0.001
Snowmobiling21.724.220.420.723.5n.s.
Road biking17.213.218.315.522.1n.s.
Mountain biking9.412.110.56.08.8n.s.
Running9.413.27.96.913.2n.s.
Off-road/dirt biking6.27.76.35.25.9n.s.
Trapping4.312.1 a3.7 b1.7 b0.0 bp < 0.001
a–c means with the same superscripts do not differ at the p < 0.05 level.
Table 7. Parameter estimates and standard errors for attribute levels of the overall acceptability model (N = 466).
Attributes and Attribute LevelsParameter Estimates S.E.Z-ValueWald Statistic
Spatial configuration *** 1075.1
(1)
Trees in foreground
*** 1.1350.07415.419
(2)
Trees spread evenly
*** 1.0550.07214.690
(3)
Trees in midground
*** −1.2060.062−19.417
(4)
Trees in background
*** −1.3660.063−21.731
(5)
Trees in midground and 1% forest cover foreground
*** 0.2060.0583.533
(6)
Trees in background and 1% forest cover foreground
** 0.1750.0583.017
Tree density * 10.0
(1)
5% tree cover
* −0.1230.048−2.553
(2)
15% tree cover
* 0.1150.0502.303
(3)
25% tree cover
−0.0390.049−0.797
(4)
35% tree cover
0.0470.0490.949
Tree distribution * 10.9
(1)
Scattered trees
* −0.1240.050−2.470
(2)
Clumps of trees
** 0.1400.0482.885
(3)
Mix of scattered and clumped trees
−0.0160.049−0.317
Fire interval *** 65.8
(1)
3-yr. interval
*** −0.3340.048−7.023
(2)
10-yr. interval
0.0220.0490.443
(3)
30-yr. interval
*** 0.3120.0516.121
Shrub density * 8.5
(1)
0% cover
** −0.1230.048−2.553
(2)
5% cover
* 0.0980.0501.985
(3)
30% cover
−0.0190.049−0.383
(4)
60% cover
0.0440.0490.895
Standing dead trees (*) 7.0
(1)
0 dead trees
(*) 0.0980.0501.938
(2)
4 dead trees
−0.0840.049−1.728
(3)
4 dead trees & blueberries
0.0480.0490.972
(4)
8 dead trees
−0.0620.049−1.273
Constant*** 0.8850.02930.400*** 924.1
Pseudo-R2(0)/R2: 0.32/0.18
Significant influence of the attribute levels on respondents’ choices: (*) p < 0.10; * p < 0.05; ** p < 0.01; *** p < 0.001.
Table 8. Relative importance in % and significance of the attributes in bold (p < 0.10) overall and per cluster (N = 466).
AttributesAllCluster 1Cluster 2Cluster 3Cluster 4
Spatial configuration50.741.553.543.452.5
Tree density4.82.55.39.85.2
Fire interval13.110.913.311.516.7
Tree distribution5.32.07.03.65.2
Shrub density4.55.42.58.59.5
Standing dead trees3.75.42.56.67.8
Constant17.932.316.016.53.1
Table 9. Parameter estimates for attribute levels per forest management acceptability cluster (N = 466).
Attributes and Attribute LevelsParameter EstimatesDifferences
Wald Statistic
Cluster 1Cluster 2Cluster 3Cluster 4
Spatial configuration *** 33.7
(1)
Trees in foreground
*** 0.772*** 1.367*** 1.073*** 1.263
(2)
Trees spread evenly
*** 0.764*** 1.236*** 0.865*** 1.409
(3)
Trees in midground
*** −0.945*** −1.425*** −1.162*** −1.322
(4)
Trees in background
*** −1.141*** −1.596*** −1.302*** −1.534
(5)
Trees in midground and 1% forest cover foreground
0.250** 0.2690.1360.229
(6)
Trees in background and 1% forest cover foreground
(*) 0.2990.149** 0.391−0.045
Tree density 10.1
(1)
5% tree cover
−0.069−0.056* −0.239−0.179
(2)
15% tree cover
0.0300.066** 0.2990.054
(3)
25% tree cover
−0.009(*) −0.1510.0030.113
(4)
35% tree cover
0.048(*) 0.141−0.0630.013
Tree distribution 4.4
(1)
Scattered trees
−0.001* 0.1640.0800.151
(2)
Clumps of trees
−0.039** −0.221−0.119−0.138
(3)
Mix of scattered and clumped trees
0.0400.0570.038−0.013
Fire interval 4.1
(1)
3-yr interval
* −0.266*** −0.404** −0.283*** −0.462
(2)
10-yr interval
0.0300.073−0.066−0.011
(3)
30-yr interval
(*) 0.235*** 0.331*** 0.348*** 0.473
Shrub density 12.1
(1)
0% cover
−0.000−0.030** −0.254* −0.312
(2)
5% cover
0.1510.0600.0840.144
(3)
30% cover
−0.0980.048−0.041−0.054
(4)
60% cover
−0.054−0.078* 0.211(*) 0.222
Standing dead trees 7.8
(1)
0 dead trees
0.176−0.014* 0.2290.051
(2)
4 dead trees
−0.031−0.055−0.087−0.173
(3)
4 dead trees and blueberries
−0.0750.084−0.008* 0.264
(4)
8 dead trees
−0.070−0.015−0.134−0.142
Constant*** −1.490 *** −0.888*** −0.900* −0.174*** 160.6
Pseudo-R2(0)/R2: 0.32/0.180.45/0.100.36/0.230.32/0.170.26/0.24
Significant influence of the attribute levels on respondents’ choices: (*) p < 0.10; * p < 0.05; ** p < 0.01; *** p < 0.001.
Publisher’s Note: MDPI stays neutral with regard to jurisdictional claims in published maps and institutional affiliations.

