Abstract
Pinus massoniana is a vital kind of coniferous species rich in rosin. Aluminum stress is a severe problem for P. massoniana growth in acidic soil causing root poisoning. However, the molecular mechanisms of aluminum-responsive are still unclear. We performed a transcriptome analysis of the P. massoniana root in response to aluminum stress. Through WGCNA analysis, we identified 338 early and 743 late response genes to aluminum stress. Gene Ontology analysis found many critical functional pathways, such as carbohydrate binding, cellulase activity, and phenylalanine ammonia-lyase activity. In addition, KEGG analysis revealed a significant enrichment of phenylpropanoid biosynthesis pathways. Further analysis showed that the expression of lignin synthesis genes 4CL, CAD, and COMT were up-regulated, indicating that they may play a crucial role in the process of aluminum tolerance in P. massoniana roots. These results provide method support for studying the regulation mechanism of P. massoniana aluminum stress.
1. Introduction
Aluminum stress is a severe problem for plant growth in acidic soil [1,2]. In neutral or weakly acidic conditions, most of the aluminum in the soil exists in the fixed form of silicates and oxides, and it is generally not harmful to plants. However, under acidic conditions (pH < 5), fixed aluminum is easily activated to produce soluble aluminum, mainly in the form of trivalent aluminum (Al3+), which has strong toxicity to plants and inhibits plant growth [3,4]. Over the past decades, the research on plant root growth and the physiology of aluminum stress has made great progress [5,6,7]. The root tip is the first tissue to contact and feel the aluminum toxicity [8]. A large number of experiments have shown that aluminum toxicity can inhibit the growth and division of root cells, thereby affecting the absorption of water and nutrients [9], such as rice [10], maize [11], and tea plant [12]. Meanwhile, aluminum toxicity will break the original balance of physiological reactions in plants, promotes excessive accumulation of active oxygen, and causes oxidative stress in plants [13,14].
Recently, with the rapid development of sequencing technology, many researches have described the internal response mechanism of plants to aluminum ions. The effect of Al on maize grown in acidic soil was studied, and it was discovered that there were several specifically expressed genes, and the expression of genes encoding citric acid cycle enzymes was up-regulated at the same time [15]. The MATE gene family encodes citrate transporter and plays a vital role in aluminum stress response [16]. Studies on alfalfa showed that Al treatment induced the expression of MsMATE transporters, indicating that these genes might be related to the aluminum tolerance to alfalfa [17]. In addition, ASR5 and STOP1 are key transcription factors that play an important role in the expression of al-responsive genes in rice [18] and Arabidopsis [19].
P. massoniana, one of the most important coniferous species in southern China, is widely cultivated with strong adaptability, rapid growth, and good stress tolerance [20,21]. P. massoniana has an important position in forestry production. It provides an essential source of timber and rosin, and it can be used as building materials and as an important raw material for chemical production [22]. In recent years, due to the increase of acidic sediments caused by industrialization, acid aluminum stress has seriously poisoned the roots of P. massoniana, causing the decline and even death [23,24]. Previous research of P. massoniana found that under aluminum stress the accumulation of Al ions primarily was in roots and small amounts of Al were transported aboveground [23]. However, there is little research on molecular mechanisms of A1 toxicity in P. massoniana. This suggested it will be meaningful to study the response mechanism of P. massoniana under aluminum stress. In this study, P. massoniana seedlings were under aluminum treatments, and the ones under water treatments served as controls. We analyzed the root transcriptome changes at different times of treatment stages. The aim was to identify the Al responsive genes and gain new insights into molecular mechanisms of aluminum stress and tolerance.
2. Materials and Methods
2.1. Plant Materials and Experimental Treatments
The seeds of P. massoniana were from Guangxi Forestry Research Institute (Nanning city, Guangxi Province, China). Seeds were sterilized with sodium hypochlorite for 30 min, washed with sterile water 3–5 times, then with pregermination in an artificial climate box at 28 °C for 24 h. After that, every 60 seeds were sowed evenly in 15 plastic pots containing yellow soil and coconut bran (3:1) and cultured under constant temperature conditions (25 ± 2 °C) and photoperiod (14/10 h light/dark cycle) for 30 days.
Then healthy seedlings of similar size were selected for treatment. We selected seedlings with consistent growth status for aluminum treatment. In the formalized treatment, seedlings were cultivated with 50 µM AlCl3 (50 mL of every pot and 1 time every 2 days for three times). The control group was treated with water instead of AlCl3 Samples of roots were collected. 0 d (sample of control group denoted as C0, as well as A0), 3 d (C1 and A1), and 6 d (C2 and A2) after treatment.
Samples for transcriptome sequencing and real-time quantitative PCR were root tips with a length of 2 cm and collected 0.5 g. All samples had 3 biological replicates and were stored at minus 80 °C for further use. Meanwhile, Samples for microstructure observation were 0.5 cm tissue away from the root tip fixed in FAA (70% alcohol 90 mL, glacial acetic acid 5 mL, and formaldehyde 5 mL).
2.2. Preparation of Paraffin Section
Paraffin sections were used to observe the cell morphology, according to previous research methods [25]. After embedding, slicing, staining, and making slices, permanent slices were made. The longitudinal sections were cut using the RM2235 rotary microtome (Leica, Wetzlar, Germany), and the slice thickness was 8 μm. Photomicrographs were taken using the Nikon Eclipse E100 microscope (Nikon, Tokyo, Japan) and edited using the Nikon DS-U3 imaging system. We observed the structure of root tips, measured cell wall thickness, and so on. The data were tested for differences by Student’s Test (p < 0.05).
2.3. RNA Extraction, Transcriptome Sequencing and Genome Mapping
Total RNA from each sample was extracted using the RNeasy Plant Mini Kit (Qiagen, Venlo, The Netherlands) according to the manufacturer’s instructions. The RNA integrity was confirmed using the 2100 Bioanalyzer (Agilent, Santa Clara, CA, USA), and the samples with RNA integrity >8 were used for library preparation. The prepared library was sequenced using the Illumina HiSeq 4000 platform (Illumina, San Diego, CA, USA). To obtain high-quality read data for sequence analysis, the raw reads containing adapter sequences and low-quality sequences were removed. After that, the clean reads were assembled into unigenes as the reference sequences using the Trinity (v2.4.0) [26] and were mapped back to reference sequences using the Bowtie2 (v2.2.5) [27]. Then, the read numbers of each gene were calculated by the RSEM (v1.2.8) [28]. Transcriptome sequencing and analysis were performed by BGI (Shenzhen, China).
2.4. Identification of Significant DEGs
The expression levels of each gene were estimated by fragments per kilobase per transcript per million mapped reads (FPKM). Differentially expressed genes (DEGs) analysis was performed using the R package DESeq2 (v1.32.0) [29]. The significant DEGs were filtered with |log2FC| ≥ 2 and FDR ≤ 0.001 in each pairwise comparison, and the number of DEGs in different comparisons was visualized using the R package UpSetR (v1.4.0) [30]. To infer the putative functions of DEGs, the Gene Ontology (GO) term and Kyoto Encyclopedia of Genes and Genomes (KEGG) pathway analysis was performed using the OmicShare tools, an online platform for data analysis (https://www.omicshare.com/tools (accessed on 15 February 2022)).
2.5. Construction and Visualization of Co-Expression Network
The WGCNA is a systems biology method aimed at finding modules of highly correlated genes and describing the co-expression network [31]. Modules are clusters of highly interconnected genes, and genes within the same cluster have high correlation coefficients among them. To reveal patterns of gene expression, the DEGs were used to perform the weighted gene co-expression network analysis, and co-expression networks were constructed using the R package WGCNA (v1.70.3) [31]. In this study, the genes with a low expression (FPKM < 0.05) and low variation of median absolute deviation (MAD < 0.01) were discarded. Based on the criterion of an approximate scale-free network, the adjacency matrix was calculated with a soft threshold (β = 14). The co-expression network was visualized using the Cytoscape (v3.8.2) [32]. We used Mapman (https://mapman.gabipd.org/ (accessed on 15 February 2022)) for drawing metabolic pathway maps and used Tbtools [33] and GraphPad Prism 7.0 (GraphPad Software, San Diego, CA, USA) for mapping gene cluster heat maps.
2.6. Real-Time Quantitative PCR (qRT-PCR) Analysis
To verify the results of RNA-Sequence, 10 DEGs were randomly selected to perform qRT-PCR, and ACT1 was selected as the housekeeping gene according to a previous report [34]. The specific primers for the qRT-PCR were designed using the primer primier5.0 (Table S1). Total RNA from each sample was extracted using the RNeasy Plant Mini Kit (Qiagen, Venlo, The Netherlands) according to the manufacturer’s instructions. Total RNA was reverse transcribed to cDNA using PrimeScript RT reagent Kit (Takara, Kusatsu, Japan). The qRT-PCR was carried out using a Light-Cycler 96 Real-Time PCR System (Roche, Basel, Switzerland), and the relative expression levels of each gene were calculated using the 2−ΔΔCt method [35].
3. Results
3.1. Root Tip Microstructure under Aluminum Stress
Roots play a vital role in plant growth, and root growth inhibition is a typical symptom of plants poisoned by aluminum. In order to reveal the root changes under aluminum stress, we observed the longitudinal section structures of the root tip by microscopy (Figure 1A). In the absence of aluminum stress, the cell structure of the root tip meristem is clear, arranged tightly and orderly, and the elongation zone cells are full and regular in shape. Compared with the control, aluminum stress changed the shape of root tip cells, the cells in the root tip meristem were loosely arranged, the cortical cells in the elongation zone became flattened, the intercellular space became smaller, the cell wall became wrinkled and uneven, and the meristem under severe aluminum stress cells are ruptured and the structure is blurred. Further analysis of the root tip cell structure showed that the root tip width and cell wall thickness under aluminum stress were significantly lower than those of the control (Figure 1B). Cell wall thickness was changed from 2.93 μm in C0 to 2.01 μm in A1 and 1.91 in A2. Root tip width was changed from 434.95 μm in C0 to 387.90 μm in A1 and 324.20 μm in A2. These structural transformations indicate that the root tip structure significantly changed when exposed to aluminum stress, and aluminum toxicity destroys the typical morphological structure of root tip cells.
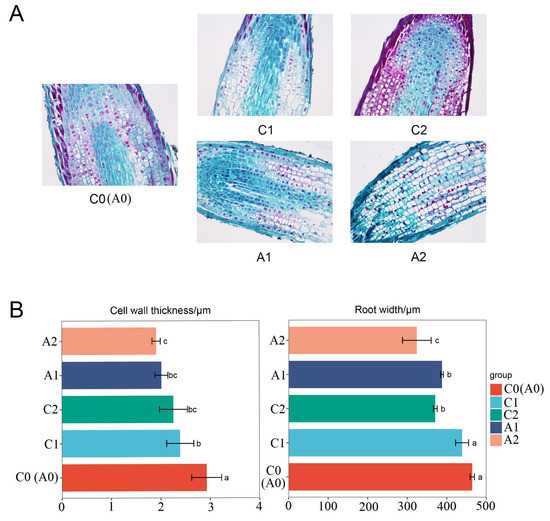
Figure 1.
Effects of aluminum stress on root. (A) Longitudinal anatomy of root at different aluminum stress stages (samples of C0, C1, C2, A1, and A2). (B) Statistics of cell wall thickness and root width. The values are represented as Mean ± SE, and different lowercase between samples indicate significance at p < 0.05. C0 and A0 were same samples and C0 was used to represent the two samples in this paper.
3.2. The Global Transcriptome Analysis under Aluminum Stress
RNA sequencing generated 63.24 to 68.51 million (M) of 150 bp pair-end reads from 15 different root samples at different aluminum stress stages (C0, C1, C2, A1, and A2). After trimming the adapter and low-quality reads, the counts of clean reads ranged from 54.89 to 58.86 M, the percentages of Q30 were greater than 80%, and the percentages of mapped reads were more significant than 70% (Table S2). The three components of PCA could divide the time series groups well. Principal component analysis revealed that the samples could be clearly assigned into five groups (C0, C1, C2, A1, and A2). Furthermore, a high correlation between three biological replicates was observed (Figure 2A,B), indicating the consistency between samples was good. Figure 2E showed a heat map of a total of 41,107 different expression genes among samples and classification situations. The heat map showed that three replicates of the same sample were clustered together, and genes responded differently at different times of treatment.
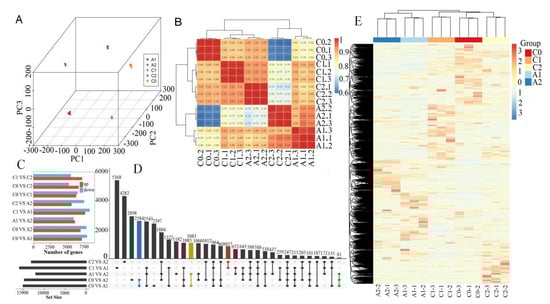
Figure 2.
Global analysis of transcriptome data. (A) Principal Component Analysis (PCA) of the RNA-Seq data. (B) Sample correlation coefficient clustering heat–map. (C) Comparison of the differential expressed genes of each pair. The red or blue bar indicates the up-regulated or down−regulated genes, respectively. (D) The Venn analysis for the number of DEGs between different-sample vs sample-groups. (E) Heat map indicating the different expression pattern of DEGs for classification.
3.3. Identification of Differentially Expressed Genes (DEGs) under Aluminum Stress
For a better understanding of gene expression dynamics under aluminum stress, the differentially expressed genes (DEGs) were identified between these samples of C0, C1, C2, A1, and A2. The differential expression analysis revealed a large number of candidate DEGs (Figure 2C,D). In total, 15,000 DEGs were identified in the comparison C0_vs_A1, with 7129 DEGs up-regulated and 7871 DEGs down-regulated. 14702 DEGs were identified in the comparison C0_vs_A2, with 6929 DEGs up-regulated and 7773 DEGs down-regulated. 11996 DEGs were identified in the comparison A1_vs_A2, with 6104 DEGs up-regulated and 5892 DEGs down-regulated. Among all these comparisons above, the total number of down-regulated genes was higher than up-regulated genes. Meanwhile, 857 DEGs were identified simultaneously between C1_vs_A1 and C2_vs_A2. 2584 DEGs were identified simultaneously between the comparisons of C0_vs_A1 and C0_vs_A2. 1083 DEGs were identified simultaneously between the comparisons of C0_vs_A1 and A2_vs_A2. Only 81 DEGs were identified simultaneously in the three comparisons of C0_vs_A1, C0_vs_A1, and A2_vs_A2. The results indicated that aluminum stress induces transcripts changes in P. massoniana shoots.
3.4. The Co-Expression Network Analysis of DEGs under Aluminum Stress
To identify genes related to aluminum stress, Weighted gene co-expression network analysis (WGCNA) be performed using non-redundant DEGs. After filtering out the genes with a low expression (FPKM < 0.05), 6641DEGs were retained for the WGCNA. The analysis identified 17 modules (labeled with different colors) shown in the cluster dendrogram, in which major tree branches define the modules, and each leaf in the branch is one gene (Figure 3A). The module eigengene is defined as the first principal component of a given module and represents the module’s gene expression profile. The correlation coefficient is calculated between module eigengene and sample traits for the module-trait relationships (Figure 3B). Notably, 2 out of 17 co-expression modules were highly expressed under aluminum stress (Figure 3C,D). The black module identified 338 genes and was highly correlated with the A1 sample (r = 0.94, p = 1 × 10⁻⁷); the expression levels of the genes belonging to the module were considered early aluminum-responsive genes. Through co-expression networks, we found genes, including Rab GDP dissociation inhibitor (RabGDI1), 5-methyltetrahydropteroyltriglutamate—homocysteine methyltransferase (METE), and heat shock proteins (HSP90), that play key early regulatory roles (Figure S2A). The brown module identified 743 genes and was highly correlated with the A2 sample (r = 0.99, p = 4 × 10⁻¹³). The expression levels of the genes belonging to the module were considered late aluminum-responsive genes. These genes mainly included beta-galactosidase (GLB1), xylose isomerase (xylA), interleukin-1 receptor-associated kinase 4 (IRAK4), zinc finger FYVE domain-containing protein 26 (ZFYVE26), and so on (Figure S2B).
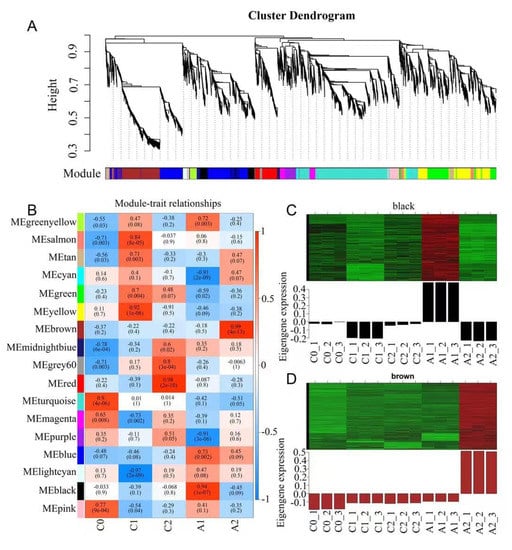
Figure 3.
Weighted gene co-expression network analysis (WGCNA) of DEGs identified. (A) Gene cluster dendrogram tree showing 17 modules of co-expressed genes. Each of the 6641 DEGs is represented by a tree leaf and each of the modules by a major tree branch. The color row underneath the dendrogram shows the module assignment determined by the Dynamic Tree Cut. (B) Module−trait relationships. Each row corresponds to a module, and each column corresponds to a time point. The number of each cell at the row−column intersection indicates the module−trait correlations and corresponding p−values (in parentheses) between the module and the time points. The left panel shows the 17 modules. The right panel shows the color scale of module−trait correlations from blue to red (−1 to 1). (C) Gene expression of the black module. (D) Gene expression of the brown module.
3.5. Functional Annotations of Aluminum-Responsive Genes
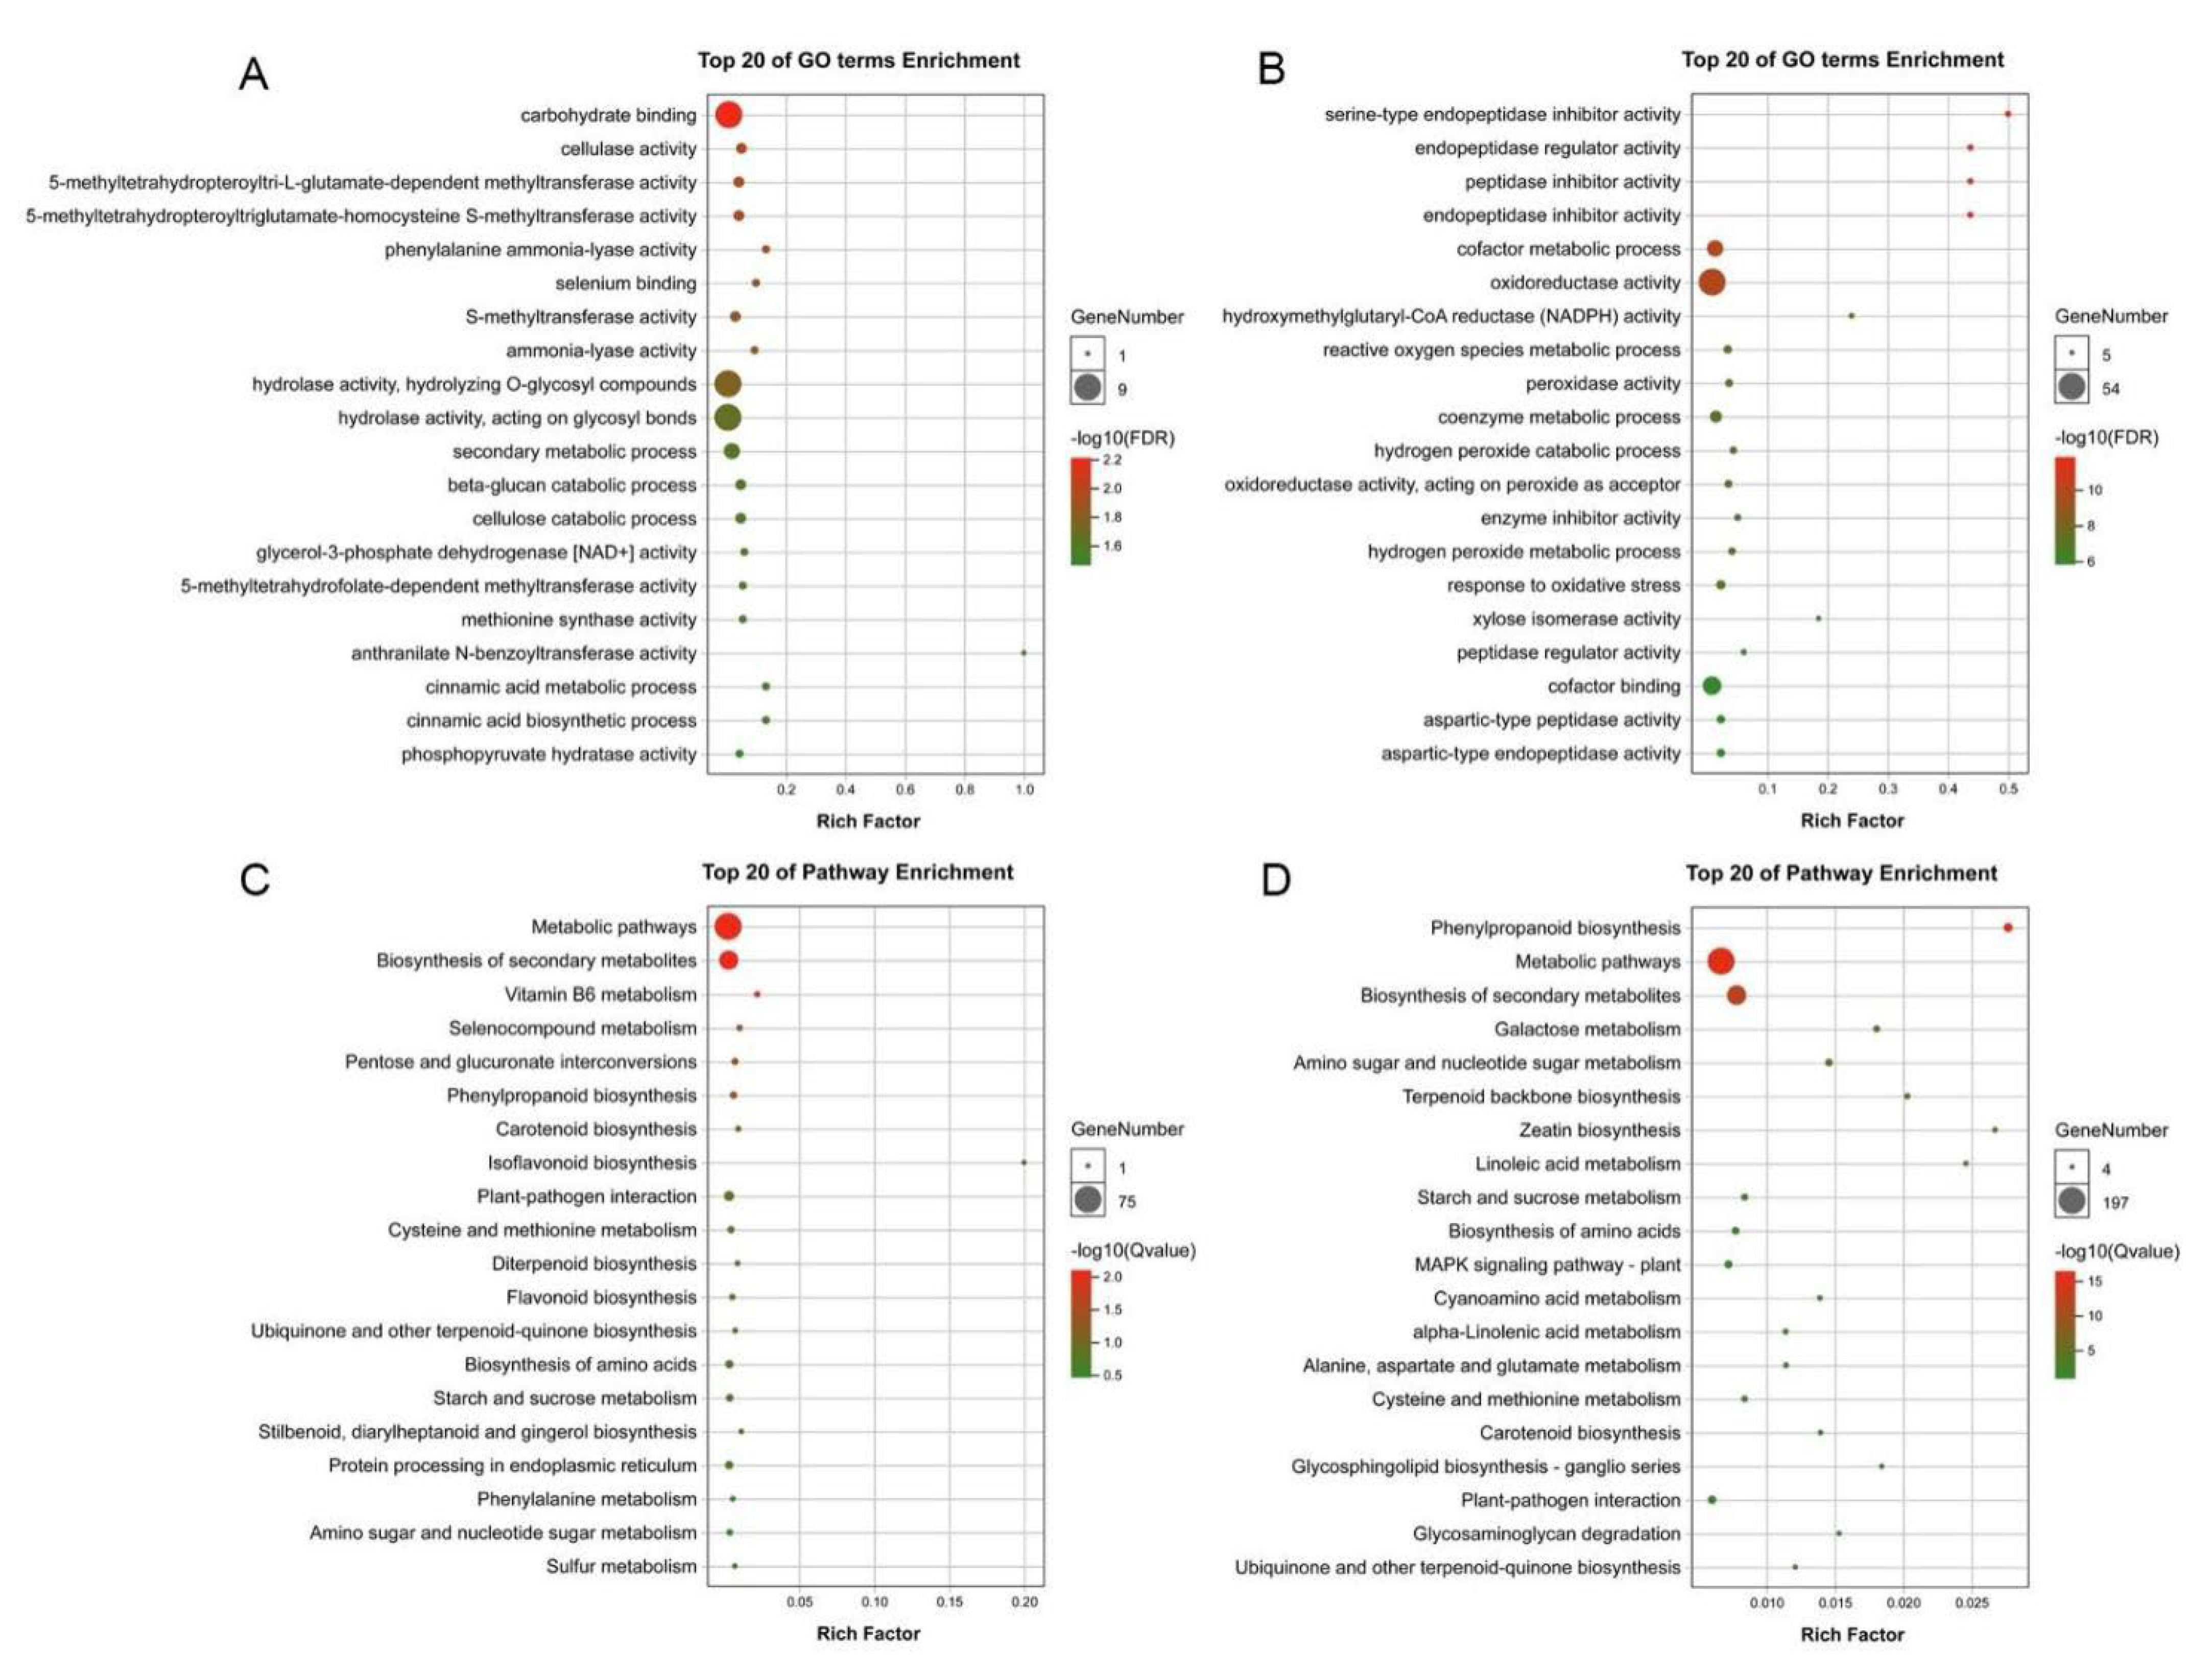
To further assess the biological functions of aluminum-responsive genes, we performed the Gene Ontology (GO) and Kyoto Encyclopedia of Genes and Genomes (KEGG) enrichment analyses GO term enrichment analysis of the early aluminum-responsive genes was mainly enriched in carbohydrate binding, cellulase activity, and phenylalanine ammonia-lyase activity (Figure 4A). However, the GO term enrichment analysis of the early aluminum-responsive genes was mainly enriched in oxidoreductase activity, hydrogen peroxide metabolic process, and catalytic activity (Figure 4B). It could be seen that most of the genes involved in aluminum stress were classified as molecular functions, followed by those classified as biological processes. The KEGG pathway enrichment analysis of the early aluminum-responsive genes was mainly enriched in Metabolic pathways, Biosynthesis of secondary metabolites, and Phenylpropanoid biosynthesis (Figure 4C). However, the KEGG pathway enrichment analysis of the late aluminum-responsive genes was mainly enriched in Phenylpropanoid biosynthesis, Metabolic pathways, and MAPK signaling pathway-plant (Figure 4D). The results indicated that aluminum stress has a significant impact on the root of P. massoniana, and the significant enrichment of biological functions is related to the response of P. massoniana to aluminum stress.
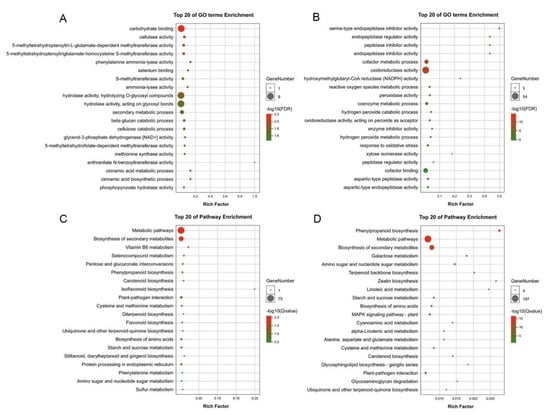
Figure 4.
Gene enriched on different GO terms and KEGG pathway. (A) GO term enrichment analysis of the early aluminum-responsive genes. (B) GO term enrichment analysis of the late aluminum−responsive genes. (C) KEGG pathway enrichment analysis of the early aluminum−responsive genes. (D) KEGG pathway enrichment analysis of the late aluminum−responsive genes.
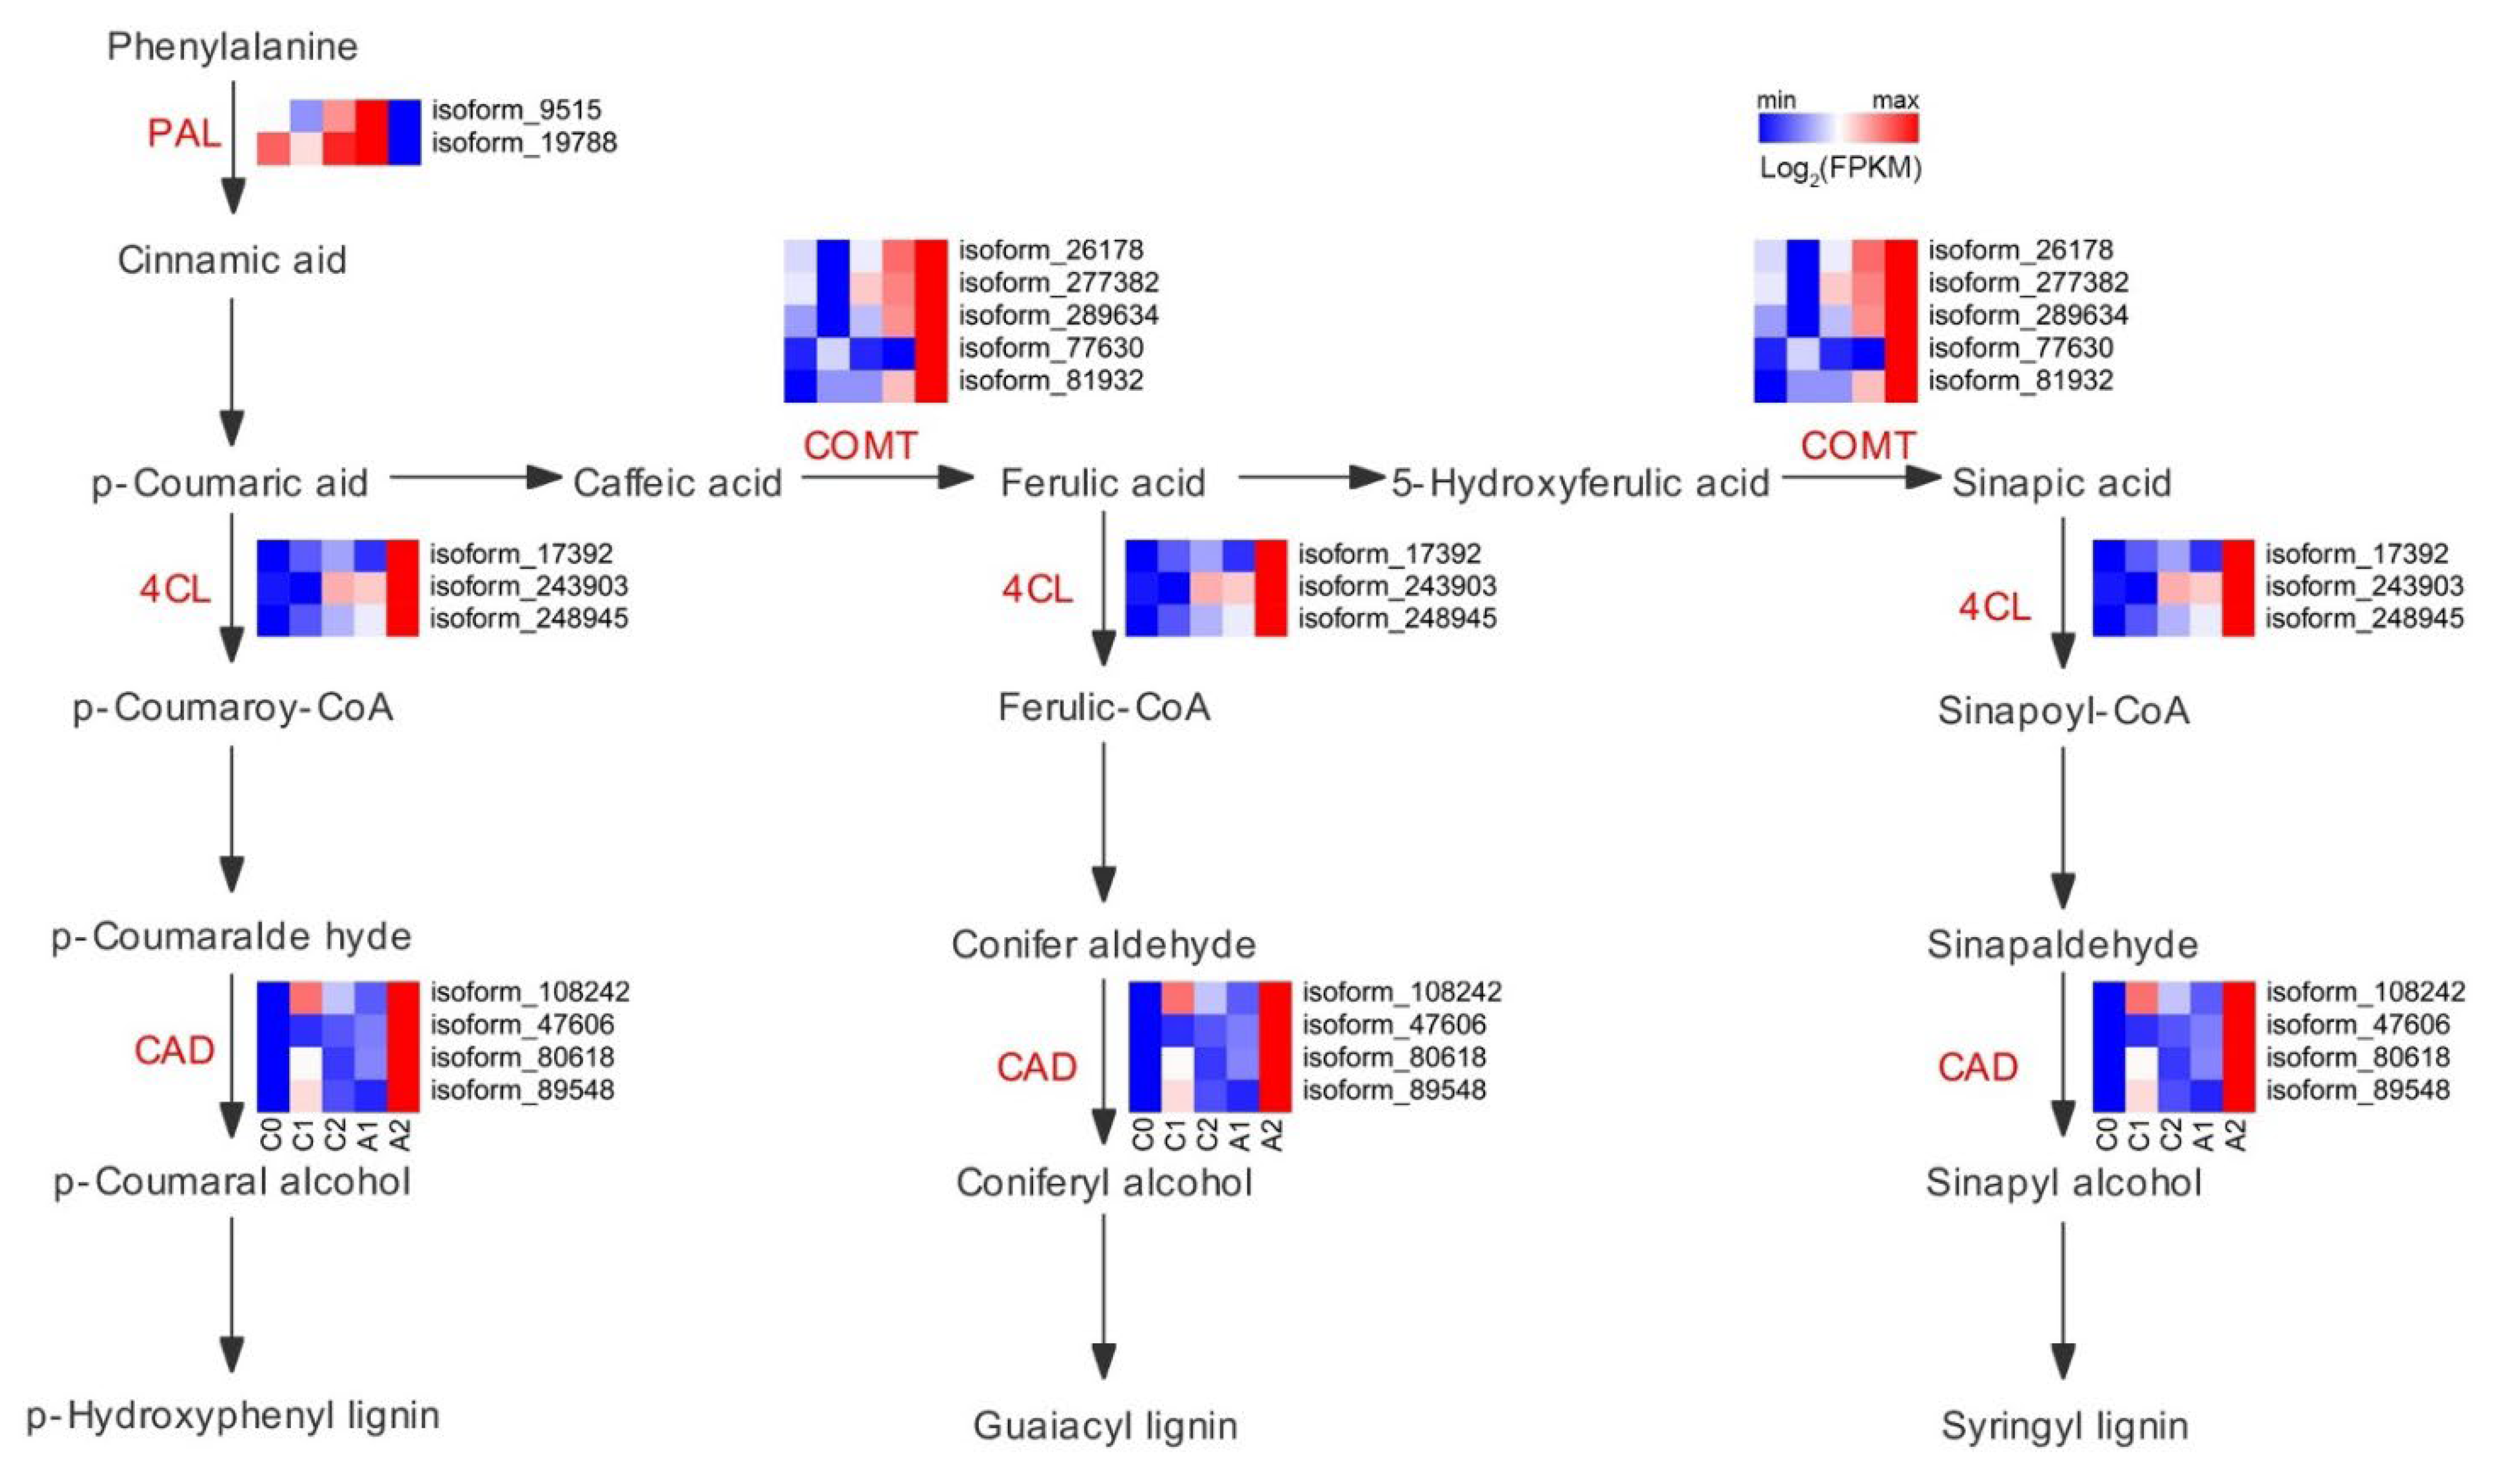
3.6. Expression of Genes Related to Phenylpropanoid Biosynthesis
Phenylpropanoid metabolism is one of the essential metabolisms in plants, associated with plant development and plant-environment interplay. Due to most of the early and late aluminum-responsive genes were enriched in phenylpropanoid biosynthesis, a closer pathway analysis of these genes was conducted (Figure 5). The key enzymes that catalyzed the reactions of the phenylpropanoid pathway exhibited different expression levels in the five samples. The phenylalanine ammonia-lyase (PAL) is the gateway enzyme of the general phenylpropanoid pathway, which guides metabolic flux from the shikimate pathway to the numerous branches of phenylpropanoid metabolism. The PAL gene (isoform_9515, isoform_19788) was up-regulated in A1 compared with those in C0, C1, C2, and A2. The 4-coumarate-CoA ligase (4CL) enzyme plays a crucial role in generating CoA esters. The 4CL gene (isoform_17392, isoform_243903, and isoform_248945) were significantly up-regulated in A2 compared with those in C0, C1, C2, and A1. The enzyme of caffeic acid 3-O-methyltransferase (COMT) catalyzes the methylation of caffeic acid. The COMT gene (isoform_26178, isoform_277382, isoform_289634, isoform_77630, and isoform_81932) was markedly higher in A2 compared with those in C0, C1, C2, and A1. The cinnamyl alcohol dehydrogenase (CAD) enzyme catalyzes the formation of p-coumaryl alcohol and coniferyl alcohol. The CAD gene was significantly higher in A2 compared with those in C0, C1, C2, and A1. Overall, the data indicate that differences in the expression levels of genes associated with the phenylpropanoid pathway may be a key factor in response to aluminum stress.
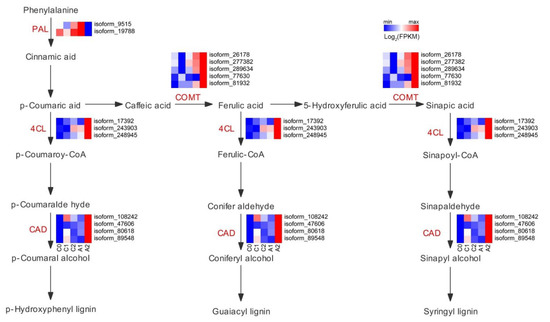
Figure 5.
Expression of genes associated with phenylpropanoid biosynthesis. The colors scale ranging from green to red (row min to row max) indicates the expression of genes, and the expressions were presented as FPKM and normalized by log2.
3.7. The qRT-PCR Validation of DEGs under Aluminum Stress
To verify the results of RNA-Seq, 10 DEGs were selected to perform qRT-PCR. The expression trends of 10 genes were similar to the transcriptome data, and the correlation between the two data sets is strong (Figure S1). These results verified the reliability of RNA-Seq data.
4. Discussion
The root tip is the main site of aluminum toxicity, which is a common material used to study the response of plants to aluminum stress [36]. Aluminum causes extensive root damage, leading to poor absorption of ions and water [37]. Due to the changes in root tissue structure and biochemical processes caused by aluminum stress, it has been observed that root tip growth is inhibited by aluminum stress in many plants [38]. Based on microscopic observations, we observed that aluminum stress has a tremendous negative effect on the roots of the P. massoniana. Compared with the control, the root anatomical characteristics of the roots under aluminum stress are pretty different. The cortical parenchyma cells are large, and the cell wall is wavy. That is similar to the observation results of the morphological anatomy of the corn root under aluminum toxicity [39]. Studies have shown that aluminum stress can reduce the size of plant root tips, among which root cap cells, meristems, and elongation cells are the most severely affected parts [40]. Counted the cell wall thickness and root tip width, we found that it was significantly lower than the control level, further confirming the loss of root tip caused by aluminum toxicity. Aluminum stress destroys the integrity of the cell structure, and affects the composition of the cell wall.
We found that RabGDI1, METE, and HSP90 might play important roles in the initial stage of response to aluminum stress. RabGDI1 has been confirmed that played an important role in improving rough dwarf disease resistance of maize [41]. RabGDI1 regulated intracellular vesicular trafficking to enhance salt tolerance of Chilense, and is highly expressed in roots [42]. HSP has been proven to play important roles in a variety of abiotic stresses [43]. Under heavy metal stress, plants improved responses by enhancing the expression of METE, or by intensifying the cytoskeleton and stimulation of ethylene metabolism [44]. After plants received a signal of abiotic stress, the content of beta-galactosidase increased, thus alleviating plant injury [45]. The higher expression level of xylose Isomerase indicated that the plant had started glucose metabolism in response to stress. This discovery of Xylose Isomerase provided a new idea for improving the aluminum tolerance of the plant through exogenous addition treatment in the future.
To adapt to the environment, plants have evolved complex response mechanisms [46]. The external morphology and physiological response in a stress environment are related to the gene expression in the body [47,48]. In this study, 220,204 genes were identified from the root tips of P. massoniana, and most DEGs were down-regulated under aluminum stress. Weighted correlation network analysis (WGCNA) can aggregate modules of highly correlated genes and associate the modules with sample traits to identify sample-specific modules and candidate central genes [31]. In this study, WGCAN analysis was used to identify the early and late modules of the aluminum stress response. GO analysis of the genes in these modules showed that most of the genes were enriched in carbohydrate binding, cellulase activity, and phenylalanine ammonia-lyase activity. KEGG enrichment analysis showed that Phenylpropanoid biosynthesis is a strong response metabolic pathway. The biosynthetic pathway of phenylalanine starts with phenylalanine. After a series of enzymatic reactions, phenylalanine can be converted into aromatic compounds, including benzene, flavonoids, and lignin. These compounds are usually involved in plant development and plant-environmental interactions [49].
As the primary binding site of aluminum, the cell wall of the root tip is the first position to contact and feel Al3+, so it is the first barrier for cells to resist aluminum poisoning [50]. Al3+ inhibits root cell elongation and cell division by interacting with plant cell walls and plasma membranes. The toughness of the cell wall regulates the elongation of the cell. Lignin is an essential part of the cell wall and determines the toughness of the cell wall [51]. Further analysis of Phenylpropanoid biosynthesis metabolism revealed that most of the catalytic genes known to be involved in lignin biosynthesis were lower expressed at the first time, and then more highly expressed under aluminum stress after treatment of 6 d, such as PAL, 4CL, COMT, and CAD. Previous studies have shown that when subjected to external stresses, such as mechanical damage, pathogen invasion, and heavy metals, the lignin content of plant root tip cell walls will all show varying degrees of increase [52]. Lignin provides mechanical strength and toughness to the cell wall and promotes the formation of xylem vessels. Moreover, lignin accumulation helps plants respond to various abiotic stresses [44]. It was found in cotton that the 4CL up-regulated gene leads to the accumulation of lignin, which promotes the thickening of cell walls and reduces the permeability of cells to water, which may help plants fight drought stress. The transcription of lignin synthesis genes 4CL and CAD are up-regulated, leading to lignin deposition, thickening of secondary cell walls, and enhancing the salt-resistance and permeability of birch and apple [53,54]. The expression of lignin synthesis gene PAL and 4CL in loquat is induced, and lignin accumulation may benefit plants adapting to the cold environment [55]. In this study, the up-regulated expression of lignin synthesis genes 4CL, CAD, and COMT genes might help P. massoniana survive under aluminum stress and involve cell rebuild in the late stage of stress.
The experimental results showed that there were many differentially expressed genes at different control sampling time points of C0, C1, and C2, which was related to the experimental materials used in this study. We used about 30-day of P. massoniana seedlings, which were in the rapid growth period of seedlings, and there might be a large number of differentially expressed genes regulating growth and development. In the future, we will further verify whether the removal of different genes at different time points will be more conducive to the discovery of key regulatory genes in P. massoniana responding to aluminum stress. P. massoniana is a typical ectomycorrhizal tree. Studies have shown that Mycorrhizal P. massoniana can improve plant drought resistance [56] and low phosphorus tolerance [57], regulate root heavy metal migration [58], and aluminum tolerance [24]. Mycorrhizal promotes the expression of the protective enzyme system gene and MATE gene in P. massoniana under aluminum stress, thus enhancing the activity of plant protective enzyme and nutrient metabolism, so as to enhance the absorption and utilization of nutrient elements and water in plants [24]. Under stress conditions, root secretion is involved in improving the utilization efficiency of plant resources, promoting the “dialogue” between plants and soil microorganisms to improve stress, and carboxylate plays an important role in aluminum decomposition [59]. Therefore, the interaction between mycorrhizal P. massoniana and root exudates, root microorganisms, and N and P elements will be the focus of future research.
In conclusion, we used WGCNA analysis to aggregate genes related to the Al stress response. Further functional analysis shows that the stress response is related to multiple pathways. The phenylpropanoid biosynthesis pathway is significantly enriched. Gene expression catalyzed lignin synthesis helps P. massoniana adapt to aluminum stress.
Supplementary Materials
The following supporting information can be downloaded at: https://www.mdpi.com/article/10.3390/f13060837/s1, Figure S1. The correlation between qPCR and RNA sequencing. Figure S2. Co-representation network. Table S1. Gene and primers for qRT-PCR. Table S2. Statistics on the quality and output of the RNA-Seq libraries.
Author Contributions
T.W., Y.H. and H.C. designed and conducted the experiments and wrote the manuscript; J.T. and H.X. contributed to manuscript writing and editing; P.L. executed the bioinformatics tools; D.W. and J.J. performed the physiology and biochemistry experiments and analyzed the data; and Z.Y. contributed to the experimental design and editing. All authors have read and agreed to the published version of the manuscript.
Funding
This research was supported by Guangxi Key Laboratory of Superior Timber Trees Resource Cultivation (17-B-01-01), the Guangxi Natural Science Foundation (2019GXNSFDA245033, 2019GXNSFBA245064), the Special Fund for Bagui Scholar and Bagui Young Scholar, the Natural Science Foundation of China (32060348, 31660219), and the Guangxi Science and Technology and Talents Special Project (AD19254004).
Institutional Review Board Statement
Not applicable.
Informed Consent Statement
Not applicable.
Data Availability Statement
Data is contained within the article or Supplementary Materials. It is also available from the correspondence author (yangzhangqi@163.com).
Conflicts of Interest
The authors declare no conflict of interest.
References
- Godbold, D.L.; Fritz, E.; Huttermann, A. Aluminum toxicity and forest decline. Proc. Natl. Acad. Sci. USA 1988, 85, 3888–3892. [Google Scholar] [CrossRef] [PubMed] [Green Version]
- Kochian, L.V.; Piñeros, M.A.; Liu, J.; Magalhaes, J.V. Plant adaptation to acid soils: The molecular basis for crop aluminum resistance. Annu. Rev. Plant Biol. 2015, 66, 571–598. [Google Scholar] [CrossRef] [PubMed]
- Liu, J.; Piñeros, M.A.; Kochian, L.V. The role of aluminum sensing and signaling in plant aluminum resistance. J. Integr. Plant Biol. 2014, 56, 221–230. [Google Scholar] [CrossRef] [PubMed]
- Sade, H.; Meriga, B.; Surapu, V.; Gadi, J.; Sunita, M.S.L.; Suravajhala, P.; Kavi Kishor, P.B. Toxicity and tolerance of aluminum in plants: Tailoring plants to suit to acid soils. Biometals 2016, 29, 187–210. [Google Scholar] [CrossRef]
- Zhu, X.; Wang, P.; Bai, Z.M.; Herde, M.; Ma, Y.Q.; Li, N.; Liu, S.; Huang, C.F.; Cui, R.X.; Ma, H.Y.; et al. Calmodulin-like protein CML24 interacts with CAMTA2 and WRKY46 to regulate ALMT1-dependent Al resistance in Arabidopsis thaliana. New Phytol. 2022, 233, 2471–2487. [Google Scholar] [CrossRef]
- Li, C.; Liu, G.; Geng, X.; He, C.; Quan, T.; Hayashi, K.I.; De Smet, I.; Robert, H.S.; Ding, Z.; Yang, Z.B. Local regulation of auxin transport in root-apex transition zone mediates aluminium-induced Arabidopsis root-growth inhibition. Plant J. 2021, 108, 55–66. [Google Scholar] [CrossRef]
- Sawaki, Y.; Iuchi, S.; Kobayashi, Y.; Ikka, T.; Sakurai, N.; Fujita, M.; Shinozaki, K.; Shibata, D.; Kobayashi, M.; Koyama, H. STOP1 regulates multiple genes that protect arabidopsis from proton and aluminum toxicities. Plant Physiol. 2009, 150, 281–294. [Google Scholar] [CrossRef] [Green Version]
- Kochian, L.V. Cellular Mechanisms of Aluminum Toxicity and Resistance in Plants. Annu. Rev. Plant Biol. 1995, 46, 237–260. [Google Scholar]
- Poschenrieder, C.; Gunsé, B.; Corrales, I.; Barceló, J. A glance into aluminum toxicity and resistance in plants. Sci. Total Environ. 2008, 400, 356–368. [Google Scholar] [CrossRef]
- Prakash, A.J.; Bedabrata, S.; Preetom, R.; Smita, S.; Umakanta, C.; Amit, P.; Anupam, R.; Kumar, P.S.; Manoj, P. Morpho-physiological analysis of tolerance to aluminum toxicity in rice varieties of North East India. PLoS ONE 2017, 12, e0176357. [Google Scholar]
- Luma, C.; Deise, C.; Liliane, C.; Thays, C.C.; Ana, B. Nitrogen compounds, proteins and amino acids in corn subjected to doses of aluminum. Afr. J. Agric. Res. 2016, 11, 1519–1524. [Google Scholar] [CrossRef] [Green Version]
- Ghanati, F.; Morita, A.; Yokota, H. Effects of Aluminum on the Growth of Tea Plant and Activation of Antioxidant System. Plant Soil 2005, 276, 133–141. [Google Scholar] [CrossRef]
- Huang, W.; Yang, X.; Yao, S.; LwinOo, T.; He, H. Reactive oxygen species burst induced by aluminum stress triggers mitochondria-dependent programmed cell death in peanut root tip cells. Plant Physiol. Biochem. 2014, 82, 76–84. [Google Scholar] [CrossRef] [PubMed]
- Li, N.N.; Meng, H.J.; Xing, H.T.; Liang, L.; Zhao, X.; Luo, K.M. Genome-wide analysis of MATE transporters and molecular characterization of aluminum resistance in Populus. J. Exp. Bot. 2017, 68, 5669–5683. [Google Scholar] [CrossRef] [Green Version]
- Mattiello, L.; Begcy, K.; da Silva, F.R.; Jorge, R.A.; Menossi, M. Transcriptome analysis highlights changes in the leaves of maize plants cultivated in acidic soil containing toxic levels of Al3+. Mol. Biol. Rep. 2014, 41, 8107–8116. [Google Scholar] [CrossRef]
- Magalhaes, J.V.; Liu, J.; Guimarães, C.T.; Lana, U.G.P.; Kochian, L.V. A gene in the multidrug and toxic compound extrusion (MATE) family confers aluminum tolerance in sorghum. Nat. Genet. 2007, 39, 1156–1161. [Google Scholar] [CrossRef]
- Min, X.; Jin, X.; Liu, W.; Wei, X.; Zhang, Z.; Ndayambaza, B.; Wang, Y. Transcriptome-wide characterization and functional analysis of MATE transporters in response to aluminum toxicity in Medicago sativa L. PeerJ 2019, 7, e6302. [Google Scholar] [CrossRef] [Green Version]
- Arenhart, R.A.; Bai, Y.; Oliveira, L.F.V.D.; Neto, L.B.; Schunemann, M.; Maraschin, F.D.S.; Mariath, J. New insights into aluminum tolerance in rice: The ASR5 protein binds the STAR1 promoter and other aluminum-responsive genes. Mol. Plant 2014, 7, 709–721. [Google Scholar] [CrossRef] [Green Version]
- Iuchi, S.; Koyama, H.; Iuchi, A.; Kobayashi, Y.; Kitabayashi, S.; Kobayashi, Y.; Ikka, T.; Hirayama, T.; Shinozaki, K.; Kobayashi, M. Zinc finger protein STOP1 is critical for proton tolerance in Arabidopsis and coregulates a key gene in aluminum tolerance. Proc. Natl. Acad. Sci. USA 2007, 104, 9900–9905. [Google Scholar] [CrossRef] [Green Version]
- Kuang, Y.W.; Sun, F.F.; Wen, D.Z.; Zhou, G.Y.; Zhao, P. Tree-ring growth patterns of Masson pine (Pinus massoniana L.) during the recent decades in the acidification Pearl River Delta of China. For. Ecol. Manag. 2008, 255, 3534–3540. [Google Scholar] [CrossRef]
- Yang, Z.Q.; Chen, H.; Tan, J.H.; Xu, H.L.; Jia, J.; Feng, Y.H. Cloning of three genes involved in the flavonoid metabolic pathway and their expression during insect resistance in Pinus massoniana Lamb. Genet. Mol. Res. 2016, 15, gmr15049332. [Google Scholar] [CrossRef] [PubMed]
- Zeng, W.S.; Tang, S.Z. Modeling compatible single-tree aboveground biomass equations for masson pine (Pinus massoniana) in southern China. J. For. Res. 2012, 23, 593–598. [Google Scholar] [CrossRef]
- Zhang, H.H.; Jiang, Z.; Qin, R.; Zhang, H.; Zou, J.; Jiang, W.; Liu, D. Accumulation and cellular toxicity of aluminum in seedling of Pinus massoniana. BMC Plant Biol. 2014, 14, 264. [Google Scholar] [CrossRef] [PubMed] [Green Version]
- Liu, H.Y.; Chen, H.Y.; Ding, G.J.; Li, K.F.; Ren, Q.F. Identification of candidate genes conferring tolerance to aluminum stress in Pinus massoniana inoculated with ectomycorrhizal fungus. BMC Plant Biol. 2020, 20, 521. [Google Scholar] [CrossRef]
- Pi, N.; Tam, N.F.Y.; Wu, Y.; Wong, M.H. Root anatomy and spatial pattern of radial oxygen loss of eight true mangrove species. Aquat. Bot. 2009, 90, 222–230. [Google Scholar] [CrossRef]
- Grabherr, M.G.; Haas, B.J.; Yassour, M.; Levin, J.Z.; Thompson, D.A.; Amit, I.A.; Xian, F.L.; Raychowdhury, R.; Zeng, Q.D. Full-length transcriptome assembly from RNA-Seq data without a reference genome. Nat. Biotechnol. 2011, 29, 644–652. [Google Scholar] [CrossRef] [Green Version]
- Langmead, B.; Salzberg, S.L. Fast gapped-read alignment with Bowtie 2. Nat. Methods 2012, 9, 357–359. [Google Scholar] [CrossRef] [Green Version]
- Dewey, C.N.; Li, B. RSEM: Accurate transcript quantification from RNA-Seq data with or without a reference genome. BMC Bioinform. 2011, 12, 323. [Google Scholar]
- Wang, L.; Feng, Z.; Wang, X.; Wang, X.W. DEGseq: An R package for identifying differentially expressed genes from RNA-seq data. Bioinformatics 2010, 26, 136–138. [Google Scholar] [CrossRef]
- Conway, J.R.; Lex, A.; Gehlenborg, N. UpSetR: An R package for the visualization of intersecting sets and their properties. Bioinformatics 2017, 33, 2938–2940. [Google Scholar] [CrossRef] [Green Version]
- Langfelder, P.; Horvath, S. WGCNA: An R package for weighted correlation network analysis. BMC Bioinform. 2008, 9, 559. [Google Scholar] [CrossRef] [PubMed] [Green Version]
- Shannon, P.; Markiel, A.; Ozier, O.; Baliga, N.S.; Wang, J.T.; Ramage, D.; Amin, N.; Schwikowski, B.; Ideker, T. Cytoscape: A software environment for integrated models of biomolecular interaction networks. Genome Res. 2003, 13, 2498–2504. [Google Scholar] [CrossRef] [PubMed]
- Chen, C.; Chen, H.; Zhang, Y.; Thomas, H.R.; Frank, M.H.; He, Y.H.; Xia, R. TBtools: An tntegrative toolkit developed for interactive analyses of big biological data. Mol. Plant 2020, 13, 1194–1202. [Google Scholar] [CrossRef] [PubMed]
- Chen, H.; Yang, Z.Q.; Hu, Y.; Tan, J.H.; Jia, J.; Xu, H.L.; Chen, X.H. Reference genes selection for quantitative gene expression studies in Pinus massoniana L. Trees-Struct. Funct. 2016, 30, 685–696. [Google Scholar] [CrossRef]
- Livak, K.J.; Schmittgen, T.D. Analysis of relative gene expression data using real-time quantitative PCR and the 2−ΔΔCT method. Methods 2002, 25, 402–408. [Google Scholar] [CrossRef]
- Samac, D.A.; Tesfaye, M. Plant improvement for tolerance to aluminum in acid soils—A review. Plant Cell Tissue Organ Cult. 2003, 75, 189–207. [Google Scholar] [CrossRef]
- Sasaki, M.; Yamamoto, Y.; Ma, J.F.; Matsumoto, H. Early events induced by aluminum stress in elongating cells of wheat root. Soil Sci. Plant Nutr. 1997, 41, 1009–1014. [Google Scholar] [CrossRef]
- Yang, J.L.; Zheng, S.J.; He, Y.F.; Tang, C.X.; Zhou, G.D. Genotypic differences among plant species in response to aluminum stress. J. Plant Nutr. 2005, 28, 949–961. [Google Scholar] [CrossRef]
- Batista, M.F.; Moscheta, I.S.; Bonato, C.M.; MA, de.; Almeida, O.J.G.; Inoue, T.T. Aluminum in corn plants: Influence on growth and morpho-anatomy of root and leaf. Rev. Bras. Ciênc. Solo 2013, 37, 177–187. [Google Scholar] [CrossRef]
- Ozyigit, I.I.; Vardar, F.; Yasar, U.; Sener, A. Long-term effects of aluminum and cadmium on growth, leaf anatomy, and photosynthetic pigments of cotton. Commun. Soil Sci. Plant Anal. 2013, 44, 3076–3091. [Google Scholar] [CrossRef]
- Liu, Q.C.; Deng, S.N.; Liu, B.S.; Tao, Y.F.; Ai, H.Y.; Liu, J.J.; Zhang, Y.Z.; Zhao, Y.; Xu, M.L. A helitron-induced RabGDIα variant causes quantitative recessive resistance to maize rough dwarf disease. Nat. Commun. 2020, 11, 495. [Google Scholar] [CrossRef] [PubMed] [Green Version]
- Martín-Davison, A.S.; Pérez-Díaz, R.; Soto, F.; Madrid-Espinoza, J.; González-Villanueva, E.; Pizarro, L.; Norambuena, L.; Tapia, J.; Tajima, H.; Blumwald, E. Involvement of SchRabGDI1 from Solanum chilense in endocytic trafficking and tolerance to salt stress. Plant Sci. Int. J. Exp. Plant Biol. 2017, 263, 1–11. [Google Scholar] [CrossRef] [PubMed]
- Waters, E.R.; Vierling, E. Plant small heat shock proteins—Evolutionary and functional diversity. New Phytol. 2020, 227, 24–37. [Google Scholar] [CrossRef] [PubMed] [Green Version]
- Hego, E.; Bes, C.M.; Bedon, F.; Palagi, P.M.; Chaumeil, P.; Barré, A.; Claverol, S.; Dupuy, J.W.; Bonneu, M.; Lalanne, C.; et al. Differential accumulation of soluble proteins in roots of metallicolous and nonmetallicolous populations of Agrostis capillaris L. exposed to Cu. Proteomics 2014, 14, 1746–1758. [Google Scholar] [CrossRef] [PubMed]
- Ramalingam, J.; Pathan, M.S.; Feril, O.; Ross, M.K.; Ma, X.F.; Mahmoud, A.A.; Layton, J.; Rodriguez-Milla, M.A.; Chikmawati, T.; Valliyodan, B.; et al. Structural and functional analyses of the wheat genomes based on expressed sequence tags (ESTs) related to abiotic stresses. Genome 2006, 49, 1324–1340. [Google Scholar] [CrossRef] [PubMed]
- Osakabe, Y.; Osakabe, K.; Shinozaki, K.; Tran, L.S.P. Response of plants to water stress. Front. Plant Sci. 2014, 5, 86. [Google Scholar] [CrossRef] [Green Version]
- Hirayama, T.; Shinozaki, K. Research on plant abiotic stress responses in the post-genome era: Past, present and future. Plant J. 2010, 61, 1041–1052. [Google Scholar] [CrossRef]
- Belal, R.; Tang, R.j.; Li, Y.P.; Mabrouk, Y.; Badr, E.; Luan, S. An ABC transporter complex encoded by Aluminum Sensitive 3 and NAP3 is required for phosphate deficiency responses in Arabidopsis. Biochem. Biophys. Res. Commun. 2015, 463, 18–23. [Google Scholar] [CrossRef]
- Dong, N.Q.; Lin, H.X. Contribution of phenylpropanoid metabolism to plant development and plant-environment interactions. J. Integr. Plant Biol. 2021, 63, 180–209. [Google Scholar] [CrossRef]
- Kobayashi, Y.; Kobayashi, Y.; Watanabe, T.; Shaff, J.E.; Ohta, H.; Kochian, L.V.; Wagatsuma, T.; Kinraide, T.B.; Koyama, H. Molecular and physiological analysis of Al3+ and H+ rhizotoxicities at moderately acidic conditions. Plant Physiol. 2013, 163, 180–192. [Google Scholar] [CrossRef] [Green Version]
- Sun, P.; Tian, Q.Y.; Chen, J.; Zhang, W.H. Aluminium-induced inhibition of root elongation in Arabidopsis is mediated by ethylene and auxin. J. Exp. Bot. 2010, 61, 347–356. [Google Scholar] [CrossRef] [PubMed] [Green Version]
- Meychik, N.R.; Yermakov, I.P. Swelling of root cell walls as an indicator of their functional state. Biochemistry 2001, 66, 178–187. [Google Scholar] [PubMed]
- Hu, P.; Zhang, K.; Yang, C. BpNAC012 Positively Regulates Abiotic Stress Responses and Secondary Wall Biosynthesis. Plant Physiol. 2019, 179, 700–717. [Google Scholar] [CrossRef] [PubMed] [Green Version]
- Chen, K.Q.; Song, M.R.; Guo, Y.N.; Liu, L.F.; Xue, H.; Dai, H.Y.; Zhang, Z.H. MdMYB46 could enhance salt and osmotic stress tolerance in apple by directly activating stress-responsive signals. Plant Biotechnol. J. 2019, 17, 2341–2355. [Google Scholar] [CrossRef] [PubMed] [Green Version]
- Zhang, J.; Yin, X.R.; Li, H.; Xu, M.; Zhang, M.X.; Li, S.J.; Liu, X.F.; Shi, Y.N.; Donald, G.; Chen, K.S. ETHYLENE RESPONSE FACTOR39–MYB8 complex regulates low-temperature-induced lignification of loquat fruit. J. Exp. Bot. 2020, 71, 3172–3184. [Google Scholar] [CrossRef] [PubMed]
- Wang, Y.; Ding, G. Physiological responses of mycorrhizal Pinus massoniana seedlings to drought stress and drought resistance evaluation. Chin. J. Appl. Ecol. 2013, 24, 639–645. [Google Scholar]
- Zhang, T.; Wen, X.; Ding, G. Ectomycorrhizal symbiosis enhances tolerance to low phosphorous through expression of phosphate transporter genes in masson pine (Pinus massoniana). Acta Physiol. Plant. 2017, 39, 101. [Google Scholar] [CrossRef]
- Yu, P.; Sun, Y.; Huang, Z.; Zhua, F.; Sun, Y.; Jiang, L. The effects of ectomycorrhizal fungi on heavy metals’ transport in Pinus massoniana and bacteria community in rhizosphere soil in mine tailing area. J. Hazard. Mater. 2020, 381, 121203. [Google Scholar] [CrossRef]
- Chai, Y.N.; Schachtman, D.P. Root exudates impact plant performance under abiotic stress. Trends Plant Sci. 2022, 27, 80–91. [Google Scholar] [CrossRef]


Publisher’s Note: MDPI stays neutral with regard to jurisdictional claims in published maps and institutional affiliations. |
© 2022 by the authors. Licensee MDPI, Basel, Switzerland. This article is an open access article distributed under the terms and conditions of the Creative Commons Attribution (CC BY) license (https://creativecommons.org/licenses/by/4.0/).