Article

Defoliation-Induced Growth Reduction of Pinus sylvestris L. after a Prolonged Outbreak of Diprion pini L.—A Case Study from Eastern Finland

by
Minna Blomqvist
1,*,
Päivi Lyytikäinen-Saarenmaa
2,
Maiju Kosunen
1,
Tuula Kantola
1 and
Markus Holopainen
1,3
1
Department of Forest Sciences, University of Helsinki, P.O. Box 27, FI-00014 Helsinki, Finland
2
School of Forest Sciences, University of Eastern Finland, P.O. Box 111, FI-80101 Joensuu, Finland
3
Department of Remote Sensing and Photogrammetry, Finnish Geospatial Research Institute (FGI), National Land Survey of Finland (NLS), Geodeetinrinne 2, FI-02430 Masala, Finland
*
Author to whom correspondence should be addressed.
Forests 2022, 13(6), 839; https://doi.org/10.3390/f13060839
Submission received: 6 May 2022 / Revised: 24 May 2022 / Accepted: 25 May 2022 / Published: 27 May 2022
(This article belongs to the Section Forest Ecology and Management)

Abstract

:
The frequency and intensity of insect outbreaks have increased in boreal forests, along with associated impacts on the growth and economic losses of host trees. In Finland, the common pine sawfly (Diprion pini L.) is a serious pest, causing declines in health and growth responses of Scots pine (Pinus sylvestris L.). We focused on investigating the species’ defoliating impact on tree radial and volume growth and estimated the economic value of the declined growth. Managed P. sylvestris forests in our study area in eastern Finland have suffered from extended defoliation by D. pini for 15 years since 1999 at varying intensity levels. We classified 184 trees into four defoliation classes and compared annual growth, expressed as growth indices between the classes. We modelled tree volume, estimated economic loss, and compared those to a reference period preceding the initial outbreak. We found significant differences in growth indices between the defoliation classes. Growth losses of 4.2%, 20.8%, and 40.4% were obtained for the mild, moderate, and high defoliation classes, with related economic impacts of 51 €, 272 €, and 734 € per ha for 11 years, respectively. Growth was slightly enhanced in the lowest defoliation class. We suggest that growth-related economic loss caused by D. pini may be significant and depend on defoliation intensity and outbreak duration.

1. Introduction

Forest pest insects can affect forest characteristics and resources and impact ecological and economic values. Typical negative consequences of insect-induced damage involve reduced wood production and increasing tree mortality [1]. Economic impacts consist mostly of timber losses through reduced tree growth and timber quality [2] but also of costs associated with pest and forest management and stand regeneration [3]. The magnitude of the economic losses depends, e.g., on the feeding guild of the insect species, damage intensity and history, rate of tree mortality, spatial scale, and forest site type and age [4,5,6].
Defoliating insects can have a major adverse impact on tree growth regardless of whether the defoliation occurred in a natural environment or in laboratory conditions [7,8,9]. The relationship between defoliation intensity and growth loss may be linear or non-linear [8,10,11]. A non-linear relationship may occur when a growth loss stabilizes after a certain defoliation level. The influence of defoliation on tree growth depends on multiple factors, such as needle age, tree age, timing and intensity of the infestation, length of the consumption period, and the defoliation history of the stand in question [5,12,13]. The defoliation impact on growth is mainly due to the allocation of carbon and nutrients to photosynthetically more important parts of the tree, such as the needles [14,15]. Natural and artificial defoliations can affect tree growth differently [9]. Defoliation diminishes the size of the carbon sink that is stored in the needles and increases the relative proportion of needle nitrogen content [10,11]. Biochemical changes in the remaining needles affect the growth responses of trees. The influence of defoliation intensity appears to be more substantial on radial growth than on needle biomass or shoot length [16,17]. Ref. [7] found that radial growth decreased by over 86% and 94% for the defoliation intensities of 50% and 90%, respectively, due to needle consumption of the common pine sawfly (Diprion pini L.) on very dry sites in western Finland.
Pine sawflies (Hymenoptera, Diprionidae) have been observed to affect the economic return from Fennoscandian forests. The total losses caused by the European pine sawfly (Neodiprion sertifer Geoffroy) in Norway were estimated to vary between 321 NOK (32 €, (converted to 2020 value) and 11757 NOK (1188 €, converted to 2020 value) per hectare at a 2% interest rate, depending on stand age and site index class, during the nine-year defoliation period [4]. Economic losses from N. sertifer were approximately 38 € (converted to 2020 value) per hectare in Finland [7]. Ref. [18] estimated that the five-year-long outbreak of N. sertifer caused roughly 1.9–2.4 million € (converted to 2020 value) losses in a total of 19 study plots in southwest Finland. Diprion pini caused an economic loss of approximately 288 € (converted to 2020 value) per hectare after a one-year outbreak in western Finland [7]. Ref. [5] valued the cumulative economic impact of D. pini to be 365–1218 € (converted to 2020 value) per hectare for the whole nine-year-long recovery period, involving both growth losses and tree mortality and depending on defoliation intensity.
D. pini is a native univoltine pest species that infests mature, even-aged pine forests in Finland [6,19]. The population dynamic of D. pini is eruptive. Normally, the epidemic phase subsides after 2–4 years and is followed with several years of the endemic population phase [20]. Formerly, D. pini only caused small-scale, low-intensity damage [6,21]. Pine monocultures and extreme weather patterns, such as summer heat and drought, have caused D. pini to become a severe pest in Finland [22,23]. Consumption of all the needle age classes during the late season has more substantial adverse effects on tree physiology and health than that of the early season defoliator, N. sertifer [5,24]. In addition, weakened trees are exposed to secondary pests, such as bark beetles, which may further intensify the damage [25,26]. D. pini does not typically cause tree mortality during short-term infestations, but feeding on needles for two or more consecutive years may cause tree death [20,24].
Outbreaks of D. pini and other pine sawflies have attracted attention, but only a few studies have examined the economic impacts of pine sawfly outbreaks in forest environments [4,5,7,18]. A demand therefore exists to address the economic impact on tree growth loss and defoliation caused by D. pini. In this study, we focus on growth reductions of mature Scots pine (Pinus sylvestris L.) and the associated decreased timber commercial value during a prolonged gradation and post-gradation phase of a D. pini population in eastern Finland. Our specific study objectives were to (i) investigate the relationship between D. pini defoliation and radial tree growth, (ii) investigate the differences in growth loss between four defoliation intensity levels, (iii) estimate the quantitative impact of defoliation by D. pini on radial tree growth and volume, and (iv) estimate the reduction in market value of timber and pulp wood for various damage intensities.

2. Materials and Methods

2.1. Study Area and Data Sets

Our study area (34.5 km2) is located in the municipality of Ilomantsi, eastern Finland (62°52′ N, 30°56′ E), where D. pini caused notable defoliation of the commercial forests for 15 years. A widespread outbreak of D. pini began in the western part of Finland in 1997 and spread to the east, resulting in damage to an area of 500,000 ha [22]. The frontline of the outbreak reached the most eastern part of Finland in 1999, and high population densities have since been fluctuating within the study area [27].
Our study area is mainly covered by managed even-aged P. sylvestris stands, which have been regenerated by sowing. Sampling plots of this study were established in mature P. sylvestris stands growing on poor and rather poor heath (Vaccinium type, VT and Calluna type, CT), based on Cajander’s forest site type classification [28]. Eleven of the sampling plots were established in 2002, and 17 in 2007. At least 20 trees (dbh > 6 cm) grew on each of these plots, with plot radii varying from 8.5 m to 13 m. Tree characteristics were inventoried concurrently with establishment of the sampling plots. The location of each tree was recorded with a Trimble Pro XH GPS device (Trimble Navigation Ltd., Sunnyvale, CA, USA). The characteristics were re-measured at the end of the study period, in spring 2010 (Table 1). All field measurements and assessments, including those discussed in the following text, were conducted in spring, thus representing the status of the previous autumn.

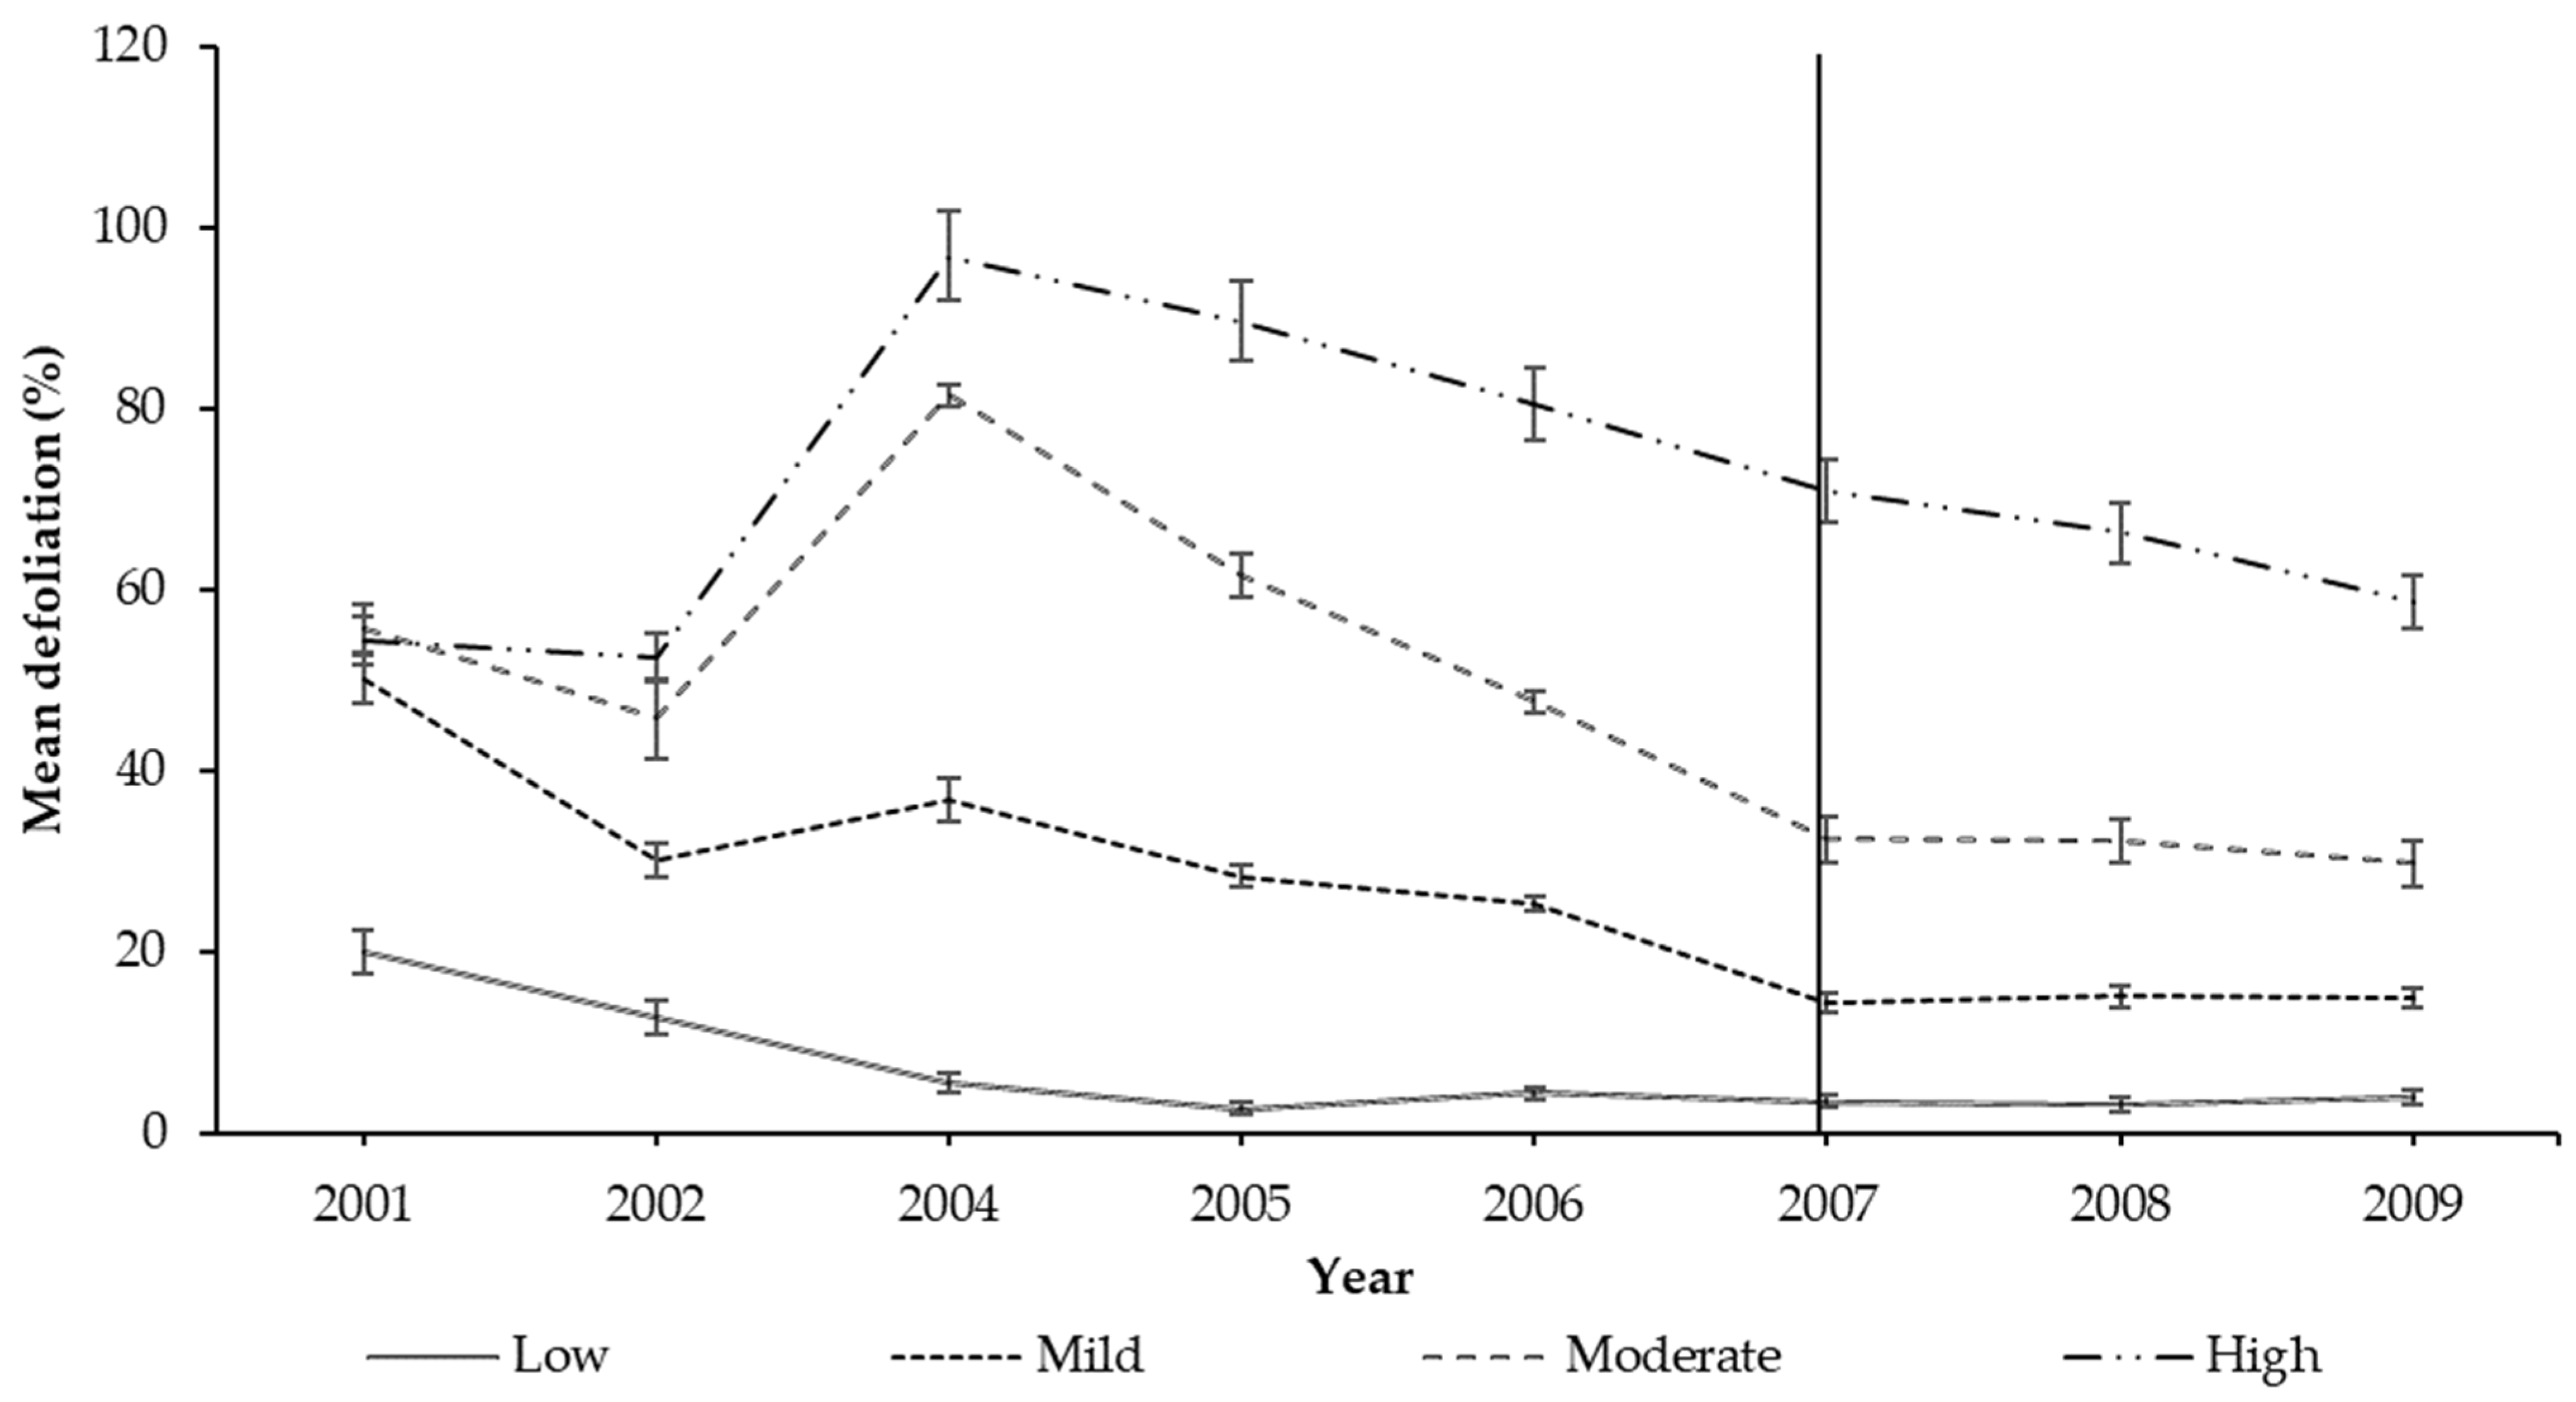
2.2. Defoliation Assessment

Defoliation intensity for each sample tree was assessed annually from 2002 or 2007 onwards, depending on the year of establishment, until 2010. The assessment was conducted in May or early June before the elongation of new needles occurring in this part of Finland. Each tree’s foliage was visually assessed with a precision of 10% by comparing the tree to an imaginary healthy tree with full foliage on similar sites, according to the method explained by [29]. A tree with 0% defoliation represented a healthy tree with full foliage, and a tree with 100% defoliation represented a tree without needles. Defoliation intensity varied between 0% and 100%. The year 2004 was the peak year for needle loss during the assessment period (Figure 1) (see [27]). Trees were classified into four defoliation classes based on their defoliation intensity in 2007, which was the first year for a complete assessment of all 28 plots. The four defoliation classes were categorized according to the percentage of lost needles: low (0%–10%), mild (20%–30%), moderate (40%–60%), and high (70%–100%) (Figure 1). The use of four broader classes is justified because the tree-wise defoliation level can vary between years. We excluded six trees from the analysis because the assessed defoliation intensity of these trees varied considerably between the years. Most of the assessed trees suffered from low to moderate defoliation annually. A smaller number of trees was heavily defoliated (n = 26) (Table 1). In this study, trees with 100% defoliation were still alive with a living cambium. Thus, dead trees were not included in the analyses.

2.3. Radial Tree Growth Measurement
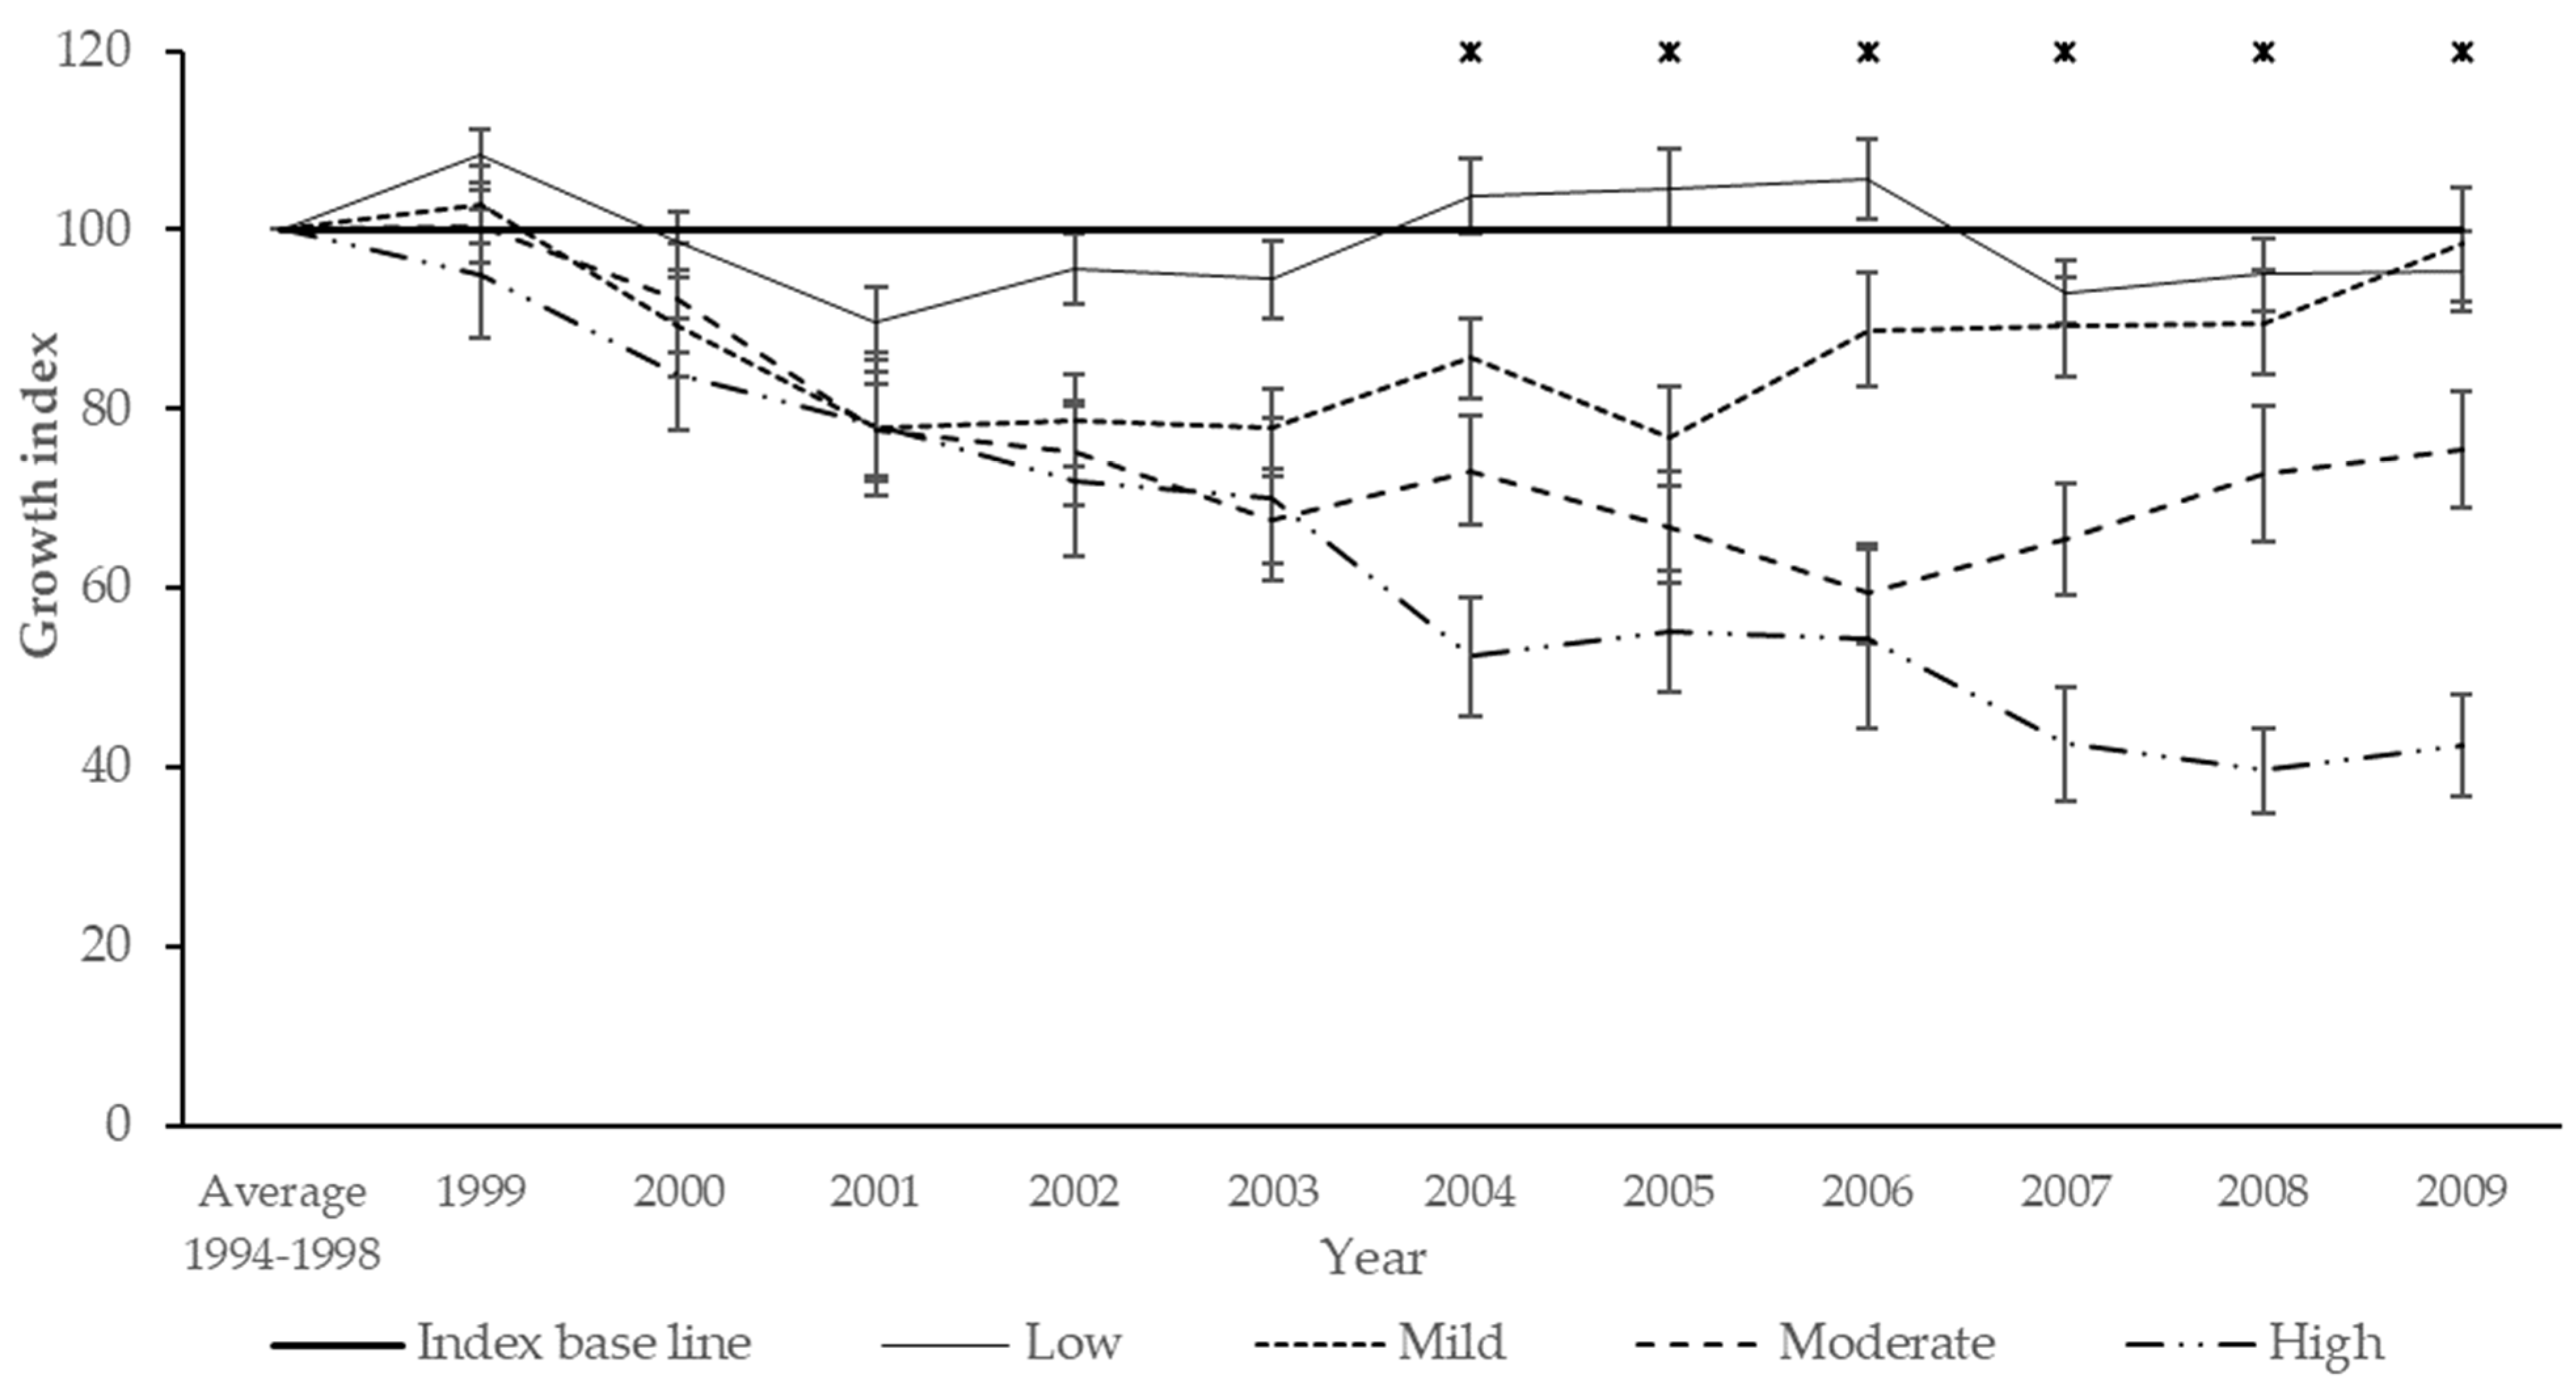
Tree ring measurements were used to compare the effect of defoliation intensity on radial growth. We took 184 tree ring samples using an increment borer, i.e., one sample per tree, in May 2010. Median trees and every third tree across the plots were systematically sampled, including trees from each diameter and defoliation class. The core samples were taken at breast height, perpendicular to the plot radius.
The samples were glued to wooden chutes in the laboratory. Annual radial growths were measured in micrometres (µm), inwards from the bark to the core, using a stereomicroscope fitted with a linear scale encoder (ENC-150) (Accurite, Jamestown, NY, USA). Data were gathered and saved using the MeasureJ2X programme (VoorTech Consulting, Holderness, NH, USA).
The relationship between defoliation (year n) and radial growth (year n + 1) was modelled with a simple linear regression [30]. We modelled radial growth for each year separately. Simple linear regression was applied to explain the variable y using one predictor variable x.

2.4. Growth Indices

We developed a growth index to investigate how defoliation intensity influences tree growth. The growth indices were based on annual radial growths. First, we computed an annual growth index for each tree (n = 184), where the annual radial growth was divided by the mean radial growth from years 1994–1998 and multiplied by 100 to be presented as percent values (see Equation (1)). The year 1998 was the last year before the initial outbreak and was assumed to be the last healthy year.
Tree - wise   growth   index α   ( % ) = 100 × ( r a d i a l   t r e e   g r o w t h α m e a n   r a d i a l   t r e e   g r o w t h   f o r   1994 1998 )
where α = year. For example, if radial tree growth was 0.264 cm in a certain year and mean radial growth for 1994–1998 was 0.2556 cm, the growth index was 103.29%.
After calculating the tree-wise growth indices, we computed a growth index for each defoliation class as a mean of the calculated tree-wise growth indices for the outbreak years 1999–2010. This value was compared with the standardized baseline growth level (mean radial growth for 1994–1998), which was marked as 100.
The data did not meet the criteria for normally distributed data. Thus, we utilized the non-parametric Kruskall–Wallis test [30] to explore any possible differences between the annual mean growth indices of the four defoliation classes. We therefore pinpointed any significant differences using the Nemenyi post hoc test with Bonferroni adjustment of the p-values. We applied R software (The R Project, 2014) in the analysis.

2.5. Estimation of Tree Volume and Economic Impact

We modelled tree volume based on dbh measurements from the increment cores and tree heights. We used modelled heights for all trees when modelling tree volume due to absent height measurements for some of the trees. Tree heights were modelled using Näslund’s equation for tree height [31]. The parameter values for tree height were estimated using a total of 1239 trees from data reported by [19] from the same P. sylvestris population growing on similar site types within the Palokangas area. Estimates for tree volumes were thereafter computed using the two variable regression models for P. sylvestris volume as specified by [32]. Tree volume for each sample tree was modelled for three years: 1989, 1998, and 2009. The mean annual growth in volume for each tree was calculated by dividing the volume difference between the starting and ending years of the period in question by the number of years in the period. We compared the class-wise mean annual volume growth of an 11-year period of the gradation and post-gradation phases of D. pini (1999–2009) with the mean growth rate of a 10-year reference period prior to the outbreak (1989–1998). These tree volumes were multiplied by the respective mean stem density to obtain estimates per hectare.
In this study, we defined economic loss strictly as the impact on economic return in the market prices due to the estimated loss of timber and pulpwood. The percentages of timber and pulpwood were estimated based on the mean dbh values for each of the four defoliation classes separately [33]. In May 2010, at the time of the final field measurements, the prices of timber and pulpwood in North Karelia were €53.19 per m3 and €14.85 per m3, respectively. Due to the inflation rate, we converted results to correspond to year 2020 using the value of money converter (https://www.stat.fi/tup/laskurit/rahanarvonmuunnin.html, accessed on 20 December 2021).

3. Results

3.1. Radial Growth and Growth Indices

Defoliation explained radial growth after one growing season for all years except 2002 (p-values < 0.005) (Table 2, Figure S1). According to results of the Kruskall–Wallis test, the annual growth index values varied significantly (p < 0.05) between the four defoliation classes over several years (Figure 2, Table S1). Growth indices of at least two defoliation classes varied significantly in 2004 (Chi-squared = 35.152, df = 3, p < 0.001), 2005 (Chi-squared = 41.579, df = 3, p < 0.001), 2006 (Chi-squared = 47.152, df = 3, p < 0.001), 2007 (Chi-squared = 37.353, df = 3, p < 0.001), 2008 (Chi-squared = 42.746, df = 3, p < 0.001), and 2009 (Chi-squared = 31.884, df = 3, p < 0.001). In the pairwise comparisons for each year separately, the growth indices of low and high defoliation differed for all years after 2004 (Table 2, Figure 2). However, growth indices of the moderate and high defoliation classes did not show any significant differences for any year.

3.2. Volume Growth and Economic Loss

We detected growth losses in the mild, moderate, and high defoliation classes (Table 3). Trees in the healthiest class, i.e., the low defoliation class, gained more volume compared with the reference period in 1989–1998. Losses in the other three defoliation classes varied between −0.11 m3 (4.2%) and −1.44 m3 (40.4%) per hectare per year. The economic losses per hectare for the 11-year outbreak period were 51 €, 272 €, and 734 € for the mild, moderate, and high defoliation classes, respectively (Table 3).

4. Discussion

We utilized tree-ring analysis to estimate growth loss and the impact on economic return during 11 years of a D. pini outbreak. These methods are widely used in studying the effects of past disturbance events and natural hazards on tree growth, e.g., [4,34,35]. We observed that the defoliation intensity caused by D. pini had a linear negative impact on tree growth and thus caused economic losses. The differences in the growth indices between the defoliation classes were significant, and the growth loss increased as the defoliation level intensified. The growth losses and the corresponding economic impact were remarkable, especially within the highly defoliated trees, at over €700 per hectare during the 11 years.
Population densities of D. pini fluctuated within the study area after the initial outbreak in 1999. After the first population peak in 2000–2001, population densities decreased until 2004 [22]. In 2004, population densities increased rapidly, seeing a peak in defoliation intensity in 2005 (marked as 2004 in the figures due to our sampling time in early May, which represented defoliation in the previous autumn). Relatively high fluctuations in the declining postgradation densities have occurred within the area since 2004 [27]. Even in 2015, varying defoliation intensities from very mild to high could be observed in the area, but the postgradation phase ended in 2017 (Blomqvist, Kantola, and Lyytikäinen-Saarenmaa personal observations).
The growth index values of the low defoliation class differed significantly from those of the three other classes over several years. This growth index remained close to the index baseline, which reflected tree status before the initial outbreak, indicating minor positive, negative, or no growth responses to the low defoliation intensity. Growth indices of the mild and moderate defoliation classes showed slightly V-shaped patterns, which is a typical growth response to defoliation intensity [4,5,24]. Trees with mild defoliation showed recovery almost to the baseline, i.e., a healthy state at the end of the study period. The growth indices of the moderate and high defoliation classes did not recover completely during the study period. Recovery to a pre-outbreak state after severe defoliation caused by the species may take a decade, depending on declined carbohydrate reserves, the impact of secondary insect pests, or a recurrent outbreak of the sawfly [5,24,36]. We observed that P. sylvestris in our study area did not entirely reach their normal healthy state after high defoliation.
The culmination of a typical D. pini outbreak subsides after two to four years in the gradation phase [20], but the outbreak at Palokangas continued with varying defoliation intensities for over 15 years. Potential explanations for the extended gradation could firstly be found in the harsh conditions of dry sites and depleted soil nutrient content, predisposing trees to deprived vitality [37]. Secondly, the diversity and numbers of natural enemies may be poor in the study area, leading to low pest population control, which increased gradually during the outbreak [27]. Thirdly, annual sanitation cuttings created new forest edges, serving as spots of emerging defoliation. Fourthly, temperature fluctuations are very high in this part of the country, which has led to a rapid increase in degree-day sums since the 1990s and promoted pest insect development [23].
We observed no growth loss or only a slight loss with the low and mild defoliation classes, and the low defoliation class even showed slightly increased growth. Ref. [5] found that a low (approximately 10%) one-year defoliation caused by D. pini reduced tree growth by 31% during a nine-year recovery period. Ref. [8] reported that the mean relative tree growth loss resulting from low defoliation (<24%) caused by a processionary moth (Thaumetopoea pityocampa (Denis & Schiffer)) outbreak was approximately 20%. Ref. [4] found that the growth increment of mature undefoliated trees was 16% higher than baseline growth during the N. sertifer outbreak. Ref. [13] noted that undefoliated trees may undergo compensatory growth when neighbouring trees suffer a more severe defoliation. This could be due to altered microclimatic conditions and a higher level of photosynthesis from more sunlight reaching the remaining needles of the mildly defoliated trees. Furthermore, severe tree defoliation due to insect outbreaks can significantly affect nutrient inputs from canopy to forest floor [38]. Thus, the growth of some of the mildly defoliated trees in our study area may have benefited from the proximity of the more severely defoliated ones. Potential nutrient additions to the forest floor might also assist in growth recovery of severely defoliated trees surviving intense outbreaks.
Moderate defoliation by D. pini caused an approximate growth loss of 20% in our study. According to [7], moderate defoliation reduces the radial growth of P. sylvestris by 86%. In our study, the relatively modest growth loss due to moderate defoliation may relate to the mature status of the trees in the study area. Larger trees may tolerate defoliation better than smaller trees due to a larger nutrient reserve [39]. Trees that undergo moderate defoliation may compensate for the impacts by reallocating nutrients [40,41]. In previous studies, high defoliation (72%) caused by N. sertifer and T. pityocampa was shown to diminish diameter growth by 28% and over 50%, respectively [4,8]. We observed a similar magnitude in growth loss (over 40%) in heavily defoliated trees. The growth loss has been suggested to stabilize after 50% defoliation [8].
The economic impacts of growth losses are often ignored after pest outbreaks in commercial forest management, and only tree mortality is factored into the yield loss calculations. Economic losses were found to be substantial in the moderate and high defoliation classes of our study. According to [5], moderate defoliation (50%) by D. pini caused annual economic losses of 143 € (converted to 2020 value) per hectare after a one-year outbreak in western Finland. A total economic loss, including tree mortality, for a nine-year recovery period was calculated to be 1290 € (converted to 2020 value) per hectare [5]. Our 11-year outbreak entailed slightly lower economic losses, even for the high defoliation class, compared with the results of [5]. Forest sites in the study by [5] in western Finland are located on extremely dry soils with a very thin humus layer and poor vegetation as compared with those in Palokangas, which may explain the difference. Pines in the above-mentioned study were also suffering from heavy metal pollution, explaining the impact of additional environmental stress to trees [42].
Several factors may have influenced the magnitude of the insect outbreak effects on tree growth and the associated economic impacts. First, an outbreak that lasts for several consecutive years and causes severe defoliation may lead to missing annual growth rings [5]. However, such years are consequently difficult to detect. Second, the growth reduction may have increased because of a subsequent attack by the common pine shoot beetle (Tomicus piniperda L.) and the lesser pine shoot beetle (Tomicus minor Hartig) (Coleoptera: Scolytidae) [24]. These pith borers cut off shoots, which decreases the photosynthetic crown area, and their reproduction under the bark affects tree water balance [43,44]. Mild damage by both species was observed within the study area, particularly during the postgradation phase (P.L-S., personal observation). In addition, these species attack trees with high defoliation and can increase the growth losses to some extent [24]. Unfortunately, the effect on growth reduction caused by Tomicus spp. cannot be distinguished from D. pini. Third, we used the ten-year period before the initial outbreak as a reference for the volume growth calculations. The sample trees were all mature (averaging 70–80 years of age), supposing stability in biomass allocation and most tree functions [45]. It is also important to bear in mind that tree-wise defoliation for all the classes fluctuated from one year to the next, thereby creating a possible source of error. Fourth, the estimation accuracy of the economic losses is affected by a lack of estimates of tree mortality. D. pini has also killed trees in our study area, but we did not sample any dead trees, nor did we estimate an economic loss for such trees. In addition, realized total losses in incomes are higher due to costs of annual sanitation cuttings and other forest management expenses by the forest owner. Fifth, the natural enemies could have mildly affected the D. pini population and hence diminished the growth and economic losses [27]. The effect of the natural enemies was nearly stable during the study years, increased gradually, and had its peak in the postgradation phase [27]. Sixth, spatial autocorrelation could have influenced the regression results to some degree due to study design and the nature of D. pini dispersal. However, as the method for estimating economic losses was rather rough, we assume that the magnitude and differences in the growth and economic losses between defoliation classes were not greatly influenced by potential autocorrelation. Despite the aforementioned potential error sources, we find it justified to assume that the main conclusions in our study are valid, and any sources of error only affect the accuracy of the detected effects.
In the future, it is important to carry out more extensive and comprehensive field studies on the effect of defoliation caused by D. pini and other defoliating pest insects on stands with a wider geographical distribution. Including the effect of climatic factors on tree growth in the studied years would also provide more accurate tree growth estimates. Furthermore, accounting for economic losses due to tree mortality and forest management operations performed before the end of a normal forest rotation period is important, to develop more complicated estimates of growth and economic losses after pine sawfly outbreaks.

5. Conclusions

We found a negative relationship between the previous year’s defoliation caused by D. pini and tree increment, even after one growing season. In addition, our results indicated that prolonged defoliation caused growth reductions when defoliation intensity exceeded 20%. Trees with moderate or severe defoliation did not recover even near to pre-outbreak state during the study period of 11 years. Severe defoliation showed the most remarkable growth reduction (40%) between the pre-outbreak and outbreak phases, which led to high cumulative economic losses.
Longer-term defoliation, such as in our case, should be accounted for when planning forest and pest management operations. Intense and prolonged pine sawfly outbreaks may cause a major risk to forest owner profits in the future as a result of climate change. Therefore, professional forest health management planning with economic projections is highly needed.

Supplementary Materials

The following supporting information can be downloaded at: www.mdpi.com/article/10.3390/f13060839/s1, Figure S1: Scatter plots of relationships between radial growths and defoliation of the study trees; Table S1: p-values from the Nemenyi Post hoc test for multiple pairwise comparisons of growth indices for each year separately.

Author Contributions

Conceptualization, P.L.-S.; data curation, M.B., P.L.-S. and T.K.; formal analysis, M.B. and T.K.; funding acquisition, P.L.-S., M.H. and M.B; investigation, M.B., P.L.-S., T.K. and M.K.; methodology, M.B., T.K. and P.L.-S.; project administration, M.B. and P.L.-S.; resources, P.L.-S. and M.B.; supervision, P.L.-S.; visualization, M.B.; writing—original draft preparation, M.B.; writing—review and editing, P.L.-S., M.K., M.H. and T.K. All authors have read and agreed to the published version of the manuscript.

Funding

This research was funded by European Space Agency Esa, Niemi Foundation, Societas Pro Fauna Et Flora Fennica, Jouko Tuovola Foundation, Societas Entomologica Helsingforsiensis, Societas Entomologica Fennica, Maj And Tor Nessling Foundation, Ministry of Agriculture and Forestry, grant number 350/311/2012, and Finnish Academy, grant number 272195.

Institutional Review Board Statement

Not applicable.

Informed Consent Statement

Not applicable.

Data Availability Statement

Not applicable.

Acknowledgments

We want to thank Antero Pasanen, Maarit Sallinen, and Jari Tahvanainen from Tornator Ltd., who enabled this study in the Palokangas area in Ilomantsi. Many thanks also go to Bert De Somviele, Anna-Maija Kokkonen, and Saara Ilvesniemi, who helped with the sampling plot establishment in 2002 and 2007. We thank Mervi Talvitie, who participated in the fieldwork and commented on earlier versions of the manuscript. Open access funding provided by University of Helsinki.

Conflicts of Interest

The authors declare no conflict of interest. The funders had no role in the design of the study; in the collection, analyses, or interpretation of data; in the writing of the manuscript, or in the decision to publish the results.

References

  1. Dajoz, R. Insects and Forests: The Role and Diversity of Insects in the Forest Environment; Intercept Limited: Paris, France, 2000; ISBN 1898298688. [Google Scholar]
  2. Twery, M.J. Effects of defoliation by Gypsy moth. In US Department of Agriculture Interagency Gypsy Moth Research Review; Gottschalk, K.W., Twery, M.J., Smith, S.I., Eds.; US Department of Agriculture, Forest Service, Northeastern Forest Experiment Station: Radnor, PA, USA; East Windsor, CT, USA, 1990; pp. 27–39. [Google Scholar]
  3. Niquidet, K.; Tang, J.; Peter, B. Economic analysis of forest insect pests in Canada. Can. Entomol. 2016, 148, 357–366. [Google Scholar] [CrossRef] [Green Version]
  4. Austarå, Ø.; Orlund, A.; Svendsrud, A.; Veidahl, A. Growth loss and economic consequences following two years defoliation of Pinus sylvestris by the pine sawfly Neodiprion sertifer in West-Norway. Scand. J. For. Res. 1987, 2, 111–119. [Google Scholar] [CrossRef]
  5. Lyytikäinen-Saarenmaa, P.; Niemela, P.; Annila, E. Growth Responses and Mortality of Scots Pine (Pinus sylvestris L.) after a Pine Sawfly Outbreak. In IUFRO Kanazawa 2003 “Forest Insect Population Dynamics and Host Influences”; Kanazawa University: Kanazawa, Japan, 2006; pp. 81–85. [Google Scholar]
  6. De Somviele, B.; Lyytikäinen-Saarenmaa, P.; Niemelä, P. Sawfly (Hym., Diprionidae) outbreaks on Scots pine: Effect of stand structure, site quality and relative tree position on defoliation intensity. For. Ecol. Manag. 2004, 194, 305–317. [Google Scholar] [CrossRef]
  7. Lyytikäinen-Saarenmaa, P.; Tomppo, E. Impact of sawfly defoliation on growth of Scots pine Pinus sylvestris (Pinaceae) and associated economic losses. Bull. Entomol. Res. 2002, 92, 137–140. [Google Scholar] [CrossRef] [PubMed]
  8. Jacquet, J.S.; Orazio, C.; Jactel, H. Defoliation by processionary moth significantly reduces tree growth: A quantitative review. Ann. For. Sci. 2012, 69, 857–866. [Google Scholar] [CrossRef] [Green Version]
  9. Lyytikäinen-Saarenmaa, P. Growth responses of scots pine. Ecol. Appl. 1999, 9, 469–474. [Google Scholar]
  10. Reich, P.B.; Walters, M.B.; Krause, S.C.; Vanderklein, D.W.; Raffs, K.F.; Tabone, T. Growth, nutrition and gas exchange of Pinus resinosa following artificial defoliation. Trees 1993, 7, 67–77. [Google Scholar] [CrossRef]
  11. Lyytikäinen-Saarenmaa, P. The responses of Scots pine, Pinus sylvestris, to natural and artificial defoliation stress. Ecol. Appl. 1999, 9, 469–474. [Google Scholar]
  12. Krause, C.; Gionest, F.; Morin, H.; MacLean, D.A. Temporal relations between defoliation caused by spruce budworm (Choristoneura fumiferana Clem.) and growth of balsam fir (Abies balsamea (L.) Mill.). Dendrochronologia 2003, 21, 23–31. [Google Scholar] [CrossRef]
  13. Wainhouse, D. Ecological Methods in Forest Pest Management; Oxford University Press: Oxford, UK, 2005; ISBN 9780198505648. [Google Scholar]
  14. Krause, S.C.; Raffa, K.F. Differential growth and recovery rates following defoliation in related deciduous and evergreen trees. Trees 1996, 10, 308. [Google Scholar] [CrossRef]
  15. Jacquet, J.S.; Bosc, A.; O’Grady, A.; Jactel, H. Combined effects of defoliation and water stress on pine growth and non-structural carbohydrates. Tree Physiol. 2014, 34, 367–376. [Google Scholar] [CrossRef] [PubMed]
  16. Ericsson, B.Y.A.; Larsson, S.; Tenow, O. Effects of Early and Late Season Defoliation on Growth and Carbohydrate Dynamics in Scots Pine. J. Appl. Ecol. 1980, 17, 747–769. [Google Scholar] [CrossRef]
  17. Nordkvist, M.; Klapwijk, M.J.; Edenius, L.R.; Björkman, C. Interacting effects of insect and ungulate herbivory on Scots pine growth. Sci. Rep. 2020, 10, 22341. [Google Scholar] [CrossRef]
  18. Tiihonen, P. Ruskean Mäntypistiäisen (N. sertifer Geoffr.) Tuhojen Vaikutuksesta Männiköiden Kasvuun Etelä-Pohjanmaalla, Pohjois-Pohjanmaalle ja Länsi-Uudellamaalla Vuosina 1960–1967 (English Abstact Available); Communicationes Instituti Forestalis Fenniae: Helsinki, Finland, 1970. [Google Scholar]
  19. Talvitie, M.; Kantola, T.; Holopainen, M.; Lyytikäinen-Saarenmaa, P. Adaptive Cluster Sampling in Inventorying Forest Damage by the Common Pine Sawfly. J. For. Plan. 2011, 16, 141–147. [Google Scholar]
  20. Geri, C. The pine sawfly in central France. In Dynamics of Forest Insect Populations: Patterns, Causes and Implications; Berryman, A., Ed.; Plenum Press: New York, NY, USA, 1988; pp. 377–405. ISBN 978-1-4899-0789-9. [Google Scholar]
  21. Viitasaari, M.; Varama, M. Sawflies 4. Conifer Sawflies (Diprionidae). English Summary in Sahapistiäiset 4. Havupistiäiset (Diprinidae), 10th ed.; Maatalous- ja Metsäeläintieteen Laitos; Helsingin Yliopisto: Helsinki, Finland, 1987; ISBN 951-45-4179-0. [Google Scholar]
  22. De Somviele, B.; Lyytikäinen-Saarenmaa, P.; Niemelä, P. Stand edge effects on distribution and condition of Diprionid sawflies. Agric. For. Entomol. 2007, 9, 17–30. [Google Scholar] [CrossRef]
  23. Aalto, J.; Pirinen, P.; Kauppi, P.E.; Rantanen, M.; Lussana, C.; Lyytikäinen-Saarenmaa, P.; Gregow, H. High-resolution analysis of observed thermal growing season variability over northern Europe. Clim. Dyn. 2022, 58, 1477–1493. [Google Scholar] [CrossRef]
  24. Långström, B.; Annila, E.; Hellqvist, C.; Varama, M.; Niemelä, P. Tree mortality, needle biomass recovery and growth losses in Scots pine following defoliation by Diprion pini (L.) and subsequent attack by Tomicus piniperda (L.). Scand. J. For. Res. 2001, 16, 342–353. [Google Scholar] [CrossRef]
  25. Annila, E.; Långström, B.; Varama, M.; Hiukka, R.; Niemelä, P. Susceptibility of defoliated Scots pine to spontaneous and induced attack by Tomicus piniperda and Tomicus minor. Silva Fenn. 1999, 33, 93–106. [Google Scholar] [CrossRef] [Green Version]
  26. Jacquet, J.S.; Bosc, A.; O’Grady, A.P.; Jactel, H. Pine growth response to processionary moth defoliation across a 40-year chronosequence. For. Ecol. Manag. 2013, 293, 29–38. [Google Scholar] [CrossRef]
  27. Blomqvist, M.; Lyytikäinen-Saarenmaa, P.; Kantola, T.; Kosunen, M.; Talvitie, M.; Holopainen, M. Impacts of natural enemies and stand characteristics on cocoon mortality of the pine sawfly Diprion pini in a Fennoscandian boreal forest. Silva Fenn. 2016, 50, 20. [Google Scholar] [CrossRef] [Green Version]
  28. Mikola, P. Application of vegetation science to forestry in Finland. In Handbook of Vegetation Science, Part 12; Jahn, G., Ed.; Dr. Junk Publishers: The Hague, The Netherlands, 1982; pp. 199–224. [Google Scholar]
  29. Eichhorn, J. Manual on Methods and Criteria for Harmonized Sampling, Assessment, Monitoring and Analysis of the Effects of Air Pollution on Forests. In Visual Assessment of Crown Condition and Submanual on Visual Assessment of Crown Condition on Intensive Monitoring Plots; United Nations Economic Commission for Europe Convention on LongRange Transboundary Air Pollution; United Nations Economic Commission for Europe: Hamburg, Germany, 1998; p. 69. [Google Scholar]
  30. Sokal, R.; Rohlf, F. Biometry: The Principles and Practice of Statistics in Biological Research; W. H. Freeman and Company: New York, NY, USA, 1995; ISBN 978-0716724117. [Google Scholar]
  31. Näslund, M. Skogsförsöksanstaltens gallringsförsök i tallskog. In Meddelanden Från Statens Skogsförsöksanstalt; Meddelanden Fran Statens Skogsforsoksanstalt: Stockholm, Sweden, 1936; Volume 29, pp. 1–169. [Google Scholar]
  32. Laasasenaho, J. Taper Curve and Volume Functions for Pine, Spruce and Birch; Metsäntutkimuslaitos: Helsinki, Finland, 1982; Volume 108, ISBN 951-40-0589-9. [Google Scholar]
  33. Rantala, S. (Ed.) Tapion Taskukirja, 25th ed.; Metsäkustannus Oy: Helsinki, Finland, 2008; ISBN 9789525694260. [Google Scholar]
  34. Lynch, A.M. What Tree-Ring Reconstruction Tells Us about Conifer Defoliator Outbreaks. Insect Outbreaks Revisit. 2012, 126–154. [Google Scholar] [CrossRef]
  35. Magnussen, S.; Alfaro, R.I. Linking aerial survey data of forest insect defoliation and tree ring data to estimate forest level growth losses. Dendrochronologia 2012, 30, 287–294. [Google Scholar] [CrossRef]
  36. Perot, T.; Vallet, P.; Archaux, F. Growth compensation in an oak-pine mixed forest following an outbreak of pine sawfly (Diprion pini). For. Ecol. Manag. 2013, 295, 155–161. [Google Scholar] [CrossRef] [Green Version]
  37. Kosunen, M.; Kantola, T.; Starr, M.; Blomqvist, M.; Talvitie, M.; Lyytikäinen-Saarenmaa, P. Influence of soil and topography on defoliation intensity during an extended outbreak of the common pine sawfly (Diprion pini L.). Iforest Biogeosci. For. 2017, 10, 164–171. [Google Scholar] [CrossRef] [Green Version]
  38. Le Mellec, A.; Michalzik, B. Impact of a pine lappet (Dendrolimus pini) mass outbreak on C and N fluxes to the forest floor and soil microbial properties in a Scots pine forest in Germany. Can. J. For. Res. 2008, 38, 1829–1841. [Google Scholar] [CrossRef]
  39. Niinemets, Ü. Responses of forest trees to single and multiple environmental stresses from seedlings to mature plants: Past stress history, stress interactions, tolerance and acclimation. For. Ecol. Manag. 2010, 260, 1623–1639. [Google Scholar] [CrossRef]
  40. Trumble, J.T.; Kolodny-Hirsch, D.M.; Ting, I.P. Plant Compensation for arthropod herbivory. Ann. For. Sci. 1993, 38, 93–119. [Google Scholar] [CrossRef]
  41. Palacio, S.; Hernández, R.; Maestro-Martínez, M.; Camarero, J.J. Fast replenishment of initial carbon stores after defoliation by the pine processionary moth and its relationship to the re-growth ability of trees. Trees Struct. Funct. 2012, 26, 1627–1640. [Google Scholar] [CrossRef] [Green Version]
  42. Salemaa, M.; Vanha-Majamaa, I.; Derome, J. Understorey vegetation along a heavy-metal pollution gradient in SW Finland. Environ. Pollut. 2001, 112, 339–350. [Google Scholar] [CrossRef]
  43. Ericsson, A.; Hellqvist, C.; Langstrom, B.; Larsson, S.; Tenow, O. Effects on Growth of Simulated and Induced Shoot Pruning by Tomicus piniperda as Related to Carbohydrate and Nitrogen Dynamics in Scots Pine. J. Appl. Ecol. 1985, 22, 105. [Google Scholar] [CrossRef]
  44. Czokajlo, D.; Wink, R.A.; Warren, J.C.; Teale, S.A. Growth reduction of Scots pine, Pinus sylvestris, caused by the larger pine shoot beetle, Tomicus piniperda (Coleoptera, Scolytidae), in New York State. Can. J. For. Res. 1997, 27, 1394–1397. [Google Scholar] [CrossRef]
  45. Hu, M.; Lehtonen, A.; Minunno, F.; Mäkelä, A. Age effect on tree structure and biomass allocation in Scots pine (Pinus sylvestris L.) and Norway spruce (Picea abies [L.] Karst.). Ann. For. Sci. 2020, 77, 90. [Google Scholar] [CrossRef]
Figure 1. The annual mean defoliation (±standard error) of the four defoliation classes. Defoliation intensity was assessed in May or early June, before the elongation of new needles. Thus, the defoliation values correspond to the defoliation status of the previous autumn, presented in the x-axis. Outbreak peak was assessed in May 2005, indicating the defoliation status for autumn 2004. The estimates before 2007 are based on trees in the plots established in 2002 (n = 70). The whole data set (n = 197) is included in the calculations after 2007, shown on the right-hand side of the vertical line. No assessments were carried out in 2003.
Forests 13 00839 g001
Figure 2. Growth indices from five pre-outbreak years. The base line (index value 100, thin black line) represents five-year (1994–1998) mean growth before the outbreak. At least two growth indices of defoliation classes were statistically significantly different (* p < 0.05) for every year from 2004 according to the Kruskall–Wallis test.
Forests 13 00839 g002
Table 1. Number of trees and mean (±standard deviation) tree age, mean height in metres, and mean diameter-at-breast-height (dbh) in cm by defoliation class (low 0%–10%, mild 20%–30%, moderate 40%–60%, and high 70%–100%) in 2010. The age of each tree was measured from the sample core.
Defoliation ClassesLowMildModerateHigh
N of trees83433226
Age76.8 (±12.8)74.4 (±15.8)75.9 (±10.9)74.2 (±12.8)
Height18.8 (±1.7)18.7 (±1.9)18.8 (±1.7)18.5 (±2.2)
Dbh21.3 (±3.8)21.3 (±3.7)22.9 (±3.8)22.7 (±4.2)
Table 2. Results of the linear regression between radial growth and defoliation, where radial growth is the dependent variable and defoliation is the explanatory variable. Growth in millimetres, DEF = defoliation in percentages, Std. Error = standard error, DF = degrees of freedom. p-value with <0.05 indicates statistically significant difference (marked *).
ModelCoefficientsEstimateStd. Errort-Valuep-ValueDFFSignificance of FAdjusted R²
Growth 2003
~DEF 2002
Intercept0.8640.0929.401<0.001 *
DEF 2002−0.0030.002−1.5050.137642.2660.1370.0340.019
Growth 2005
~DEF 2004
Intercept0.8650.08110.715<0.001 *
DEF 2004−0.0060.002−2.4080.02 *645.7970.019 *0.0830.069
Growth 2006
~DEF 2005
Intercept0.8290.05914.002<0.001 *
DEF 2005−0.0040.001−3.0880.003 *649.5360.003 *0.1300.116
Growth 2007
~DEF 2006
Intercept0.6950.05013.779<0.001 *
DEF 2006−0.0030.001−2.8170.006 *647.9330.006 *0.1100.096
Growth 2008
~DEF 2007
Intercept0.9560.04123.182<0.001 *
DEF 2007−0.0060.001−5.791<0.001 *19033.54<0.000*0.1500.146
Growth 2009
~DEF 2008
Intercept1.0060.04522.261<0.001 *
DEF 2008−0.0090.001−5.797<0.001 *19033.6<0.000 *0.1500.146
Growth 2010
~DEF 2009
Intercept1.2830.06021.228<0.001
DEF 2009−0.0120.002−5.768<0.00112433.27<0.000 *0.2120.205
Table 3. Volume growth and economic impact within the defoliation classes per hectare. Volume growth is presented in m3 per hectare per year and economic loss in euros per hectare for the whole outbreak period (11 years). Values indicate growth and economic losses compared with the reference period. Values of economic impact are converted to correspond to year 2020.
Defoliation ClassAnnual Volume Growth (m3/ha)Growth (%)Cumulative Economic
Loss (€/ha)
Low0.4016.5+146
Mild−0.11−4.2−51
Moderate−0.57−20.8−272
High−1.44−40.4−734
Publisher’s Note: MDPI stays neutral with regard to jurisdictional claims in published maps and institutional affiliations.

