Abstract
The stoichiometric characteristics of plant nitrogen (N) and phosphorus (P) and their correlations with soil properties are regarded as key for exploring plant physiological and ecological processes and predicting ecosystem functions. However, quantitative studies on the relative contributions of water–salt gradients and nutrient gradients to plant stoichiometry are limited. In addition, previous studies have been conducted at the plant species and individual levels, meaning that how community-scale stoichiometry responds to soil properties is still unclear. Therefore, we selected typical sample strips from 13 sampling sites in arid regions to assess the leaf N and P levels of 23 species of desert plants and measure the corresponding soil water content, total salt content, total nitrogen content, and total phosphorus content. The aim was to elucidate the main soil properties that influence the stoichiometric characteristics of desert plants and compare the individual and community responses to those soil properties. Our results indicated that the growth of desert plants is mainly limited by nitrogen, with individual plant leaf nitrogen and phosphorus concentrations ranging from 4.08 to 31.39 mg g−1 and 0.48 to 3.78 mg g−1, respectively. Community stoichiometry was significantly lower than that of individual plants. A significant correlation was observed between the mean N concentration, P concentration, and N:P ratio of plant leaves. At the individual plant scale, aridity significantly reduced leaf N and P concentrations, while high salt content significantly increased leaf N concentrations. At the community scale, aridity had no significant effects on leaf nitrogen or phosphorus stoichiometry, while high salinity significantly increased the leaf N:P ratio and there were no significant interactions between the aridity and salinity conditions. No significant effects of soil nutrient gradients were observed on plant N and P stoichiometric characteristics at the individual or community levels. These results suggest that individual desert plants have lower leaf N and P concentrations to adapt to extreme drought and only adapt to salt stress through higher leaf N concentrations. The N and P stoichiometric characteristics of desert plant communities are not sensitive to variations in aridity and salinity in this extreme habitat. The results of this study could enhance our perceptions of plant adaptation mechanisms to extreme habitats within terrestrial ecosystems.
1. Introduction
Ecological stoichiometry research focuses on the quantitative relationships of carbon (C), nitrogen (N), and phosphorus (P) concentrations within ecosystems and yields new insights into the mechanisms of steady-state ecosystem transformations [1,2,3]. The dynamic patterns at global and regional scales have received widespread attention [4,5,6,7]. As plants are an important component of the ecosystem, their stoichiometry can be used to interpret the status and dynamic exchange of nutrient demand and supply within the habitat. Plant stoichiometry also serves as an important link between plant physiological processes, biogeochemical cycles, and ecosystem functions [8,9,10]. An accurate description of the plant stoichiometry–habitat interrelationship is important for tracking changes in ecosystem nutrient cycling and predicting ecosystem productivity and carbon cycles [11,12].
Soil is one of the main habitat factors that affects plant stoichiometry. Plant survival is influenced by soil water and salt conditions, which can interfere with the evolution of nutrient supply, demand, and regulatory systems [13]. It has been suggested that drought and salt stress cause osmotic imbalance and decreased photosynthesis in plants, which in turn inhibits their nutrient uptake capacity [14,15]. Zhang et al. found that plants allocate more C to leaves and reduce N and P concentrations as a resource allocation strategy in response to stress [16]. Luo et al. found that leaf concentrations are positively related to aridity, which is primarily driven by species turnover [17]. In addition, the nutrient conditions of soil are the main source of nutrients for plant tissues [18,19,20]. In particular, N and P are tightly linked to plant functions, such as growth, reproduction, and metabolism [21]. Plants require photosynthetic products for growth and ribosomes for protein synthesis. N and P, which are essential components of proteins and genetic material, regulate the carbon sequestration capacity of plants by altering the assimilation rate of CO2 [22,23]. The balance of N and P is also important for explaining and predicting the underlying mechanisms of ecosystem functions, environmental stress, and nutrient limitation [24,25]. The frequency and magnitude of extreme events are increasing due to ongoing global climate change, which has severe direct and indirect repercussions on soil [26,27,28]. More specifically, these events, such as heavy rainfall, drought, nitrogen deposition, and hurricanes, affect nutrient cycling and its effectiveness by altering the water–salt contents and nutrient conditions of soil [29,30,31]. High temperatures and aridity, for example, can modify soil particle size, water and salt contents, organic matter decomposition rates, and nutrient inputs, while prompting plants to optimize nutrient allocation within their tissues in response to habitat change [30,32]. Therefore, identifying the potential driving mechanisms of these two soil properties (water and salt contents and nutrient conditions) in the adaptation of plant stoichiometry to extreme habitats could help to reveal the nutrient partitioning strategies and coupling between plants and soil.
Although there is considerable evidence for the influence of soil water–salt conditions and nutrient conditions on plant stoichiometry, few scholars have compared the relative contributions of water–salt contents and nutrients to plant stoichiometry in extreme habitats and the accurate identification of the main factors that drive plant stoichiometry is lacking. Our understanding of plant–soil nutrient cycling has mostly so far come from studies that were performed to investigate individual- and species-level responses [33,34,35], meaning that few mechanisms are known in terms of the responses of community stoichiometry [36,37]. This knowledge gap prevents us from developing an accurate understanding of the response strategies of plants in extreme habitats to climate change because the biochemical cycling of nitrogen and phosphorus may become decoupled in extreme habitats [38,39,40,41,42] and the contribution of soil water–salt conditions to plant stoichiometry may be underestimated [3,43]. In addition, plant communities are the product of reciprocal, competitive, and co-evolutionary interactions between individuals, which can directly and accurately reflect the nature and dynamic characteristics of ecosystem functions [10]. Plant community stoichiometry is constrained by factors such as species composition, abundance, and nutrient limitation and the community adaptation processes to habitats are different from those of individual plants [44,45]. Studies that ignore community stoichiometric response mechanisms may bias our understanding of soil–plant nutrient cycling. Moreover, strong environmental screening can alter the ecological needs and strategies of plants [46] and previous findings have not applied to extreme habitats [38,47]. For example, in nitrogen-limited habitats, the relative growth rate of plants was found to be positively correlated to the N:P ratio, while in phosphorus-limited habitats, it was found to be negatively correlated [48]. This study suggested that a feasible approach would be to identify the mechanisms driving both the soil water–salt conditions and the nutrient conditions pathways for individual and community stoichiometric characteristics to gain more precise insights.
Addressing this issue is particularly important for arid zones due to the climatic conditions of high temperature, sparse rainfall, and strong evaporation, meaning that ecosystems experience the extremes of aridity, salinization, and nutrient depletion in the soil. In the context of climate change, arid zones are at risk of severe degradation [49,50]. Based on the biogeochemical hypothesis that soil nutrient effectiveness has a significant effect on plant nutrients and is influenced by temperature and precipitation due to organic matter decomposition and leaching effects [51], we hypothesized that (1) soil water and salt conditions regulate plant stoichiometry more than soil nutrients, based on a community species turnover strategy that alters stoichiometric plasticity and adaptation in response to environmental change [52]. We also hypothesized that (2) community stoichiometry is more stable in the face of stress compared to that of individuals. Answering these questions could help us to further understand the potential value of nutrient cycling between soil and plants in a changing climate. To verify the above hypotheses, we selected typical sample strips from13 sampling sites in the Kalamaili Mountain Nature Reserve to assess the leaf N and P levels of 23 species of desert plants and measure the corresponding soil water content, total salt content, total N content, and total P content. Answering these questions could help us to elucidate both the stoichiometric characteristics of desert plants at the individual and community levels and their mechanisms for coping with extreme habitats.
2. Material and Methods
2.1. Study Area and Sampling Sites
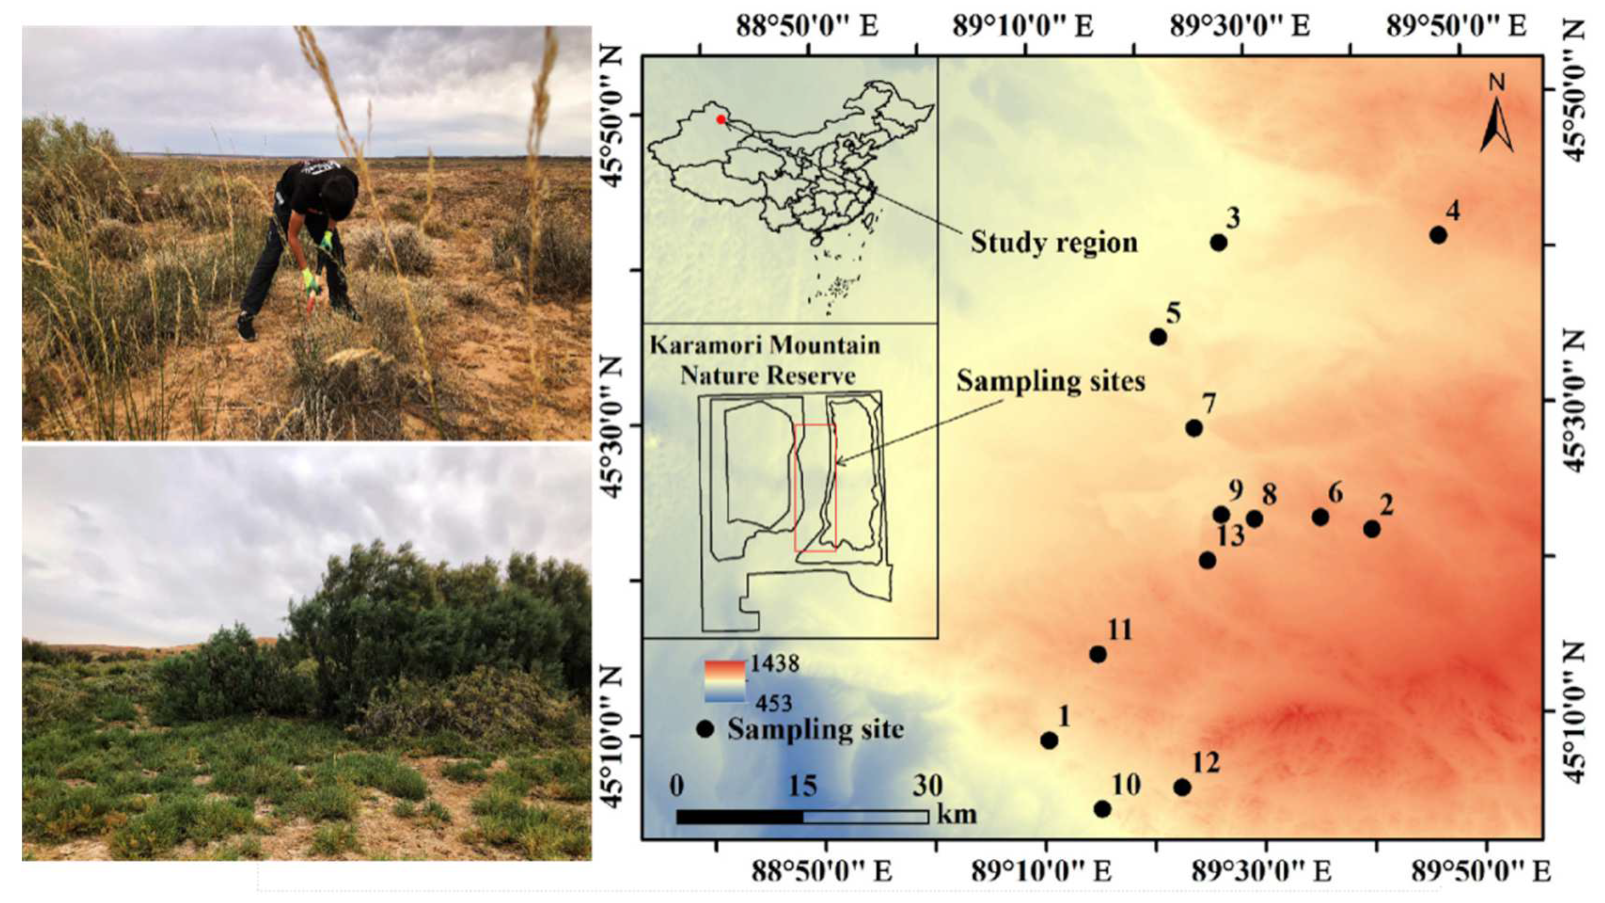
The study area is located in the Kalamaili Mountain Nature Reserve, China (88°30′–90°03′ E, 44°36′–46°00′ N), in the hinterland of the Asian continent in the mid-latitudes of the Northern Hemisphere (Figure 1). It has a temperate continental arid climate, characterized by extreme dryness and sparse rainfall (159.1 mm/annum) that is accompanied by windy weather and a strong annual average evaporation of about 2090.4 mm [53]. The main soil types are calcic Solonchaks [54].
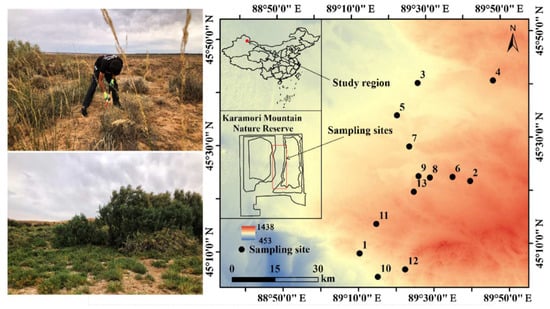
Figure 1.
Sampling sites. This figure was originally generated using the ArcGIS 10.0 software (Environmental Systems Research Institute, Redlands, CA, USA. http://www.esri.com/software/arcgis/arcgisonline (accessed on 1 January 2022)).
The desert plants in this region have the biomes of both the Central Asian desert and the Mongolian Gobi Desert, as well as unique external morphologies, internal structures, reproductive activity, and interspecific associations [55], which are of priceless ecological significance. The dominant community types in this region include Haloxylon ammodendron, Krascheninnikovia ceratoides, Reaumuria songarica, Artemisia songarica, Anabasis salsa, and Stipa glareosa. In this study, 13 sampling sites were randomly surveyed based on differences in soil properties. There were no differences in temperature or precipitation between these sampling sites and they were not subject to any domestic grazing activities or disturbed by other human beings. The spacing between the sampling sites was approximately 1 km. The sampling locations were referenced by GPS for latitude, longitude, and elevation (eTrex Venture, Garmin, Olathe, KS, USA).
2.2. Sampling and Measurements
Field sampling took place from 15 to 20 August 2019. At each of the 13 sites, 5 randomly selected 10 m × 10 m sample squares (65 squares in total) were selected to collect plant and soil samples. The species names of the present plants, the abundance of individuals of each species, the individual cover of each species, and the average height of each species (23 species in total within the study area) were recorded in each sample square and used to estimate the importance value of each species. To measure plant nitrogen and phosphorus stoichiometry, 10 individual plants of each species were selected from each sample square (when the number of individuals of the species in the sample square was less than 10, the sample could be replicated outside the nearest sample square), from which 30–50 healthy and fresh leaves were collected (171 leaf samples in total). The collected leaf samples were rinsed twice in the field using deionized water. The aim was to reduce the influence of the dust that adhered to the leaves on the experimental results. They were then immediately stored in a drying oven at 105 °C and dried for 30 min to reduce nutrient loss due to the respiration and decomposition of the leaves. After being taken back to the laboratory, the leaf samples were dried to a constant weight in a drying oven at 70 °C. After grinding and passing the dried leaf samples through a 1-mm sieve (Retsch mm 400; Retsch, Haan, Germany), the leaf N concentrations were analyzed using a PE–2400 CHN analyzer (Perkin Elmer, Foster City, CA, USA). The leaf P concentrations were determined using the molybdate/stannous chloride method after H2SO4–H2O2–HF digestion [56]. The plant N:P ratio was calculated from the above data, as was the characterization of plant absorption and storage trade-offs for various nutrients [57]. Studies have shown that an N:P ratio of < 14 suggests N limitation, an N:P ratio of > 16 suggests P limitation, and an N:P ratio between 14 and 16 suggests either N or P limitation or both [58].
To obtain accurate information about the soil properties, soil samples were collected from a depth of 0–40cm after the removal of vegetation and litter from each sample square (65 soil samples with 5-cm diameters were collected in total). Plant roots, gravel, and debris were removed from the soil samples, which were then mixed thoroughly and the fresh weight was recorded in the field. The soil samples were then immediately placed in a refrigerator at 4 °C and taken back to the laboratory. The soil samples were dried to a constant weight in a drying oven at 105 °C. The dry weight was recorded and the soil water content was measured using the weight method. The soil total N concentrations were measured using the Kjeltec System 2300 Analytical Unit (Tecator, Höganäs, Sweden). The soil total P concentration was determined using the molybdate/ascorbic acid blue method after digestion with HClO4 and H2SO4 acid [59]. The soil salt content was obtained by drying the soil extraction to a constant weight (weight M1) at 105–110 °C. After removing the organic matter from the dried sample using H2O2, the weight (M2) was recorded. The soil salt content was calculated as M1 − M2.
2.3. Data Analysis
In this study, the nutrient coupling between individual plants and soil properties was measured by calculating the mean values of the plant N and P stoichiometry and the soil properties at the sample square level (Table 1). Community composition within the study area was described by calculating the species importance values (Equation (1)) at the sample square level (Figure 2). The higher the importance value of a species, the more dominant it is within the community [60].
The importance value = (relative height + relative abundance + relative cover)/3

Table 1.
Soil properties at the 13 sampling sites.
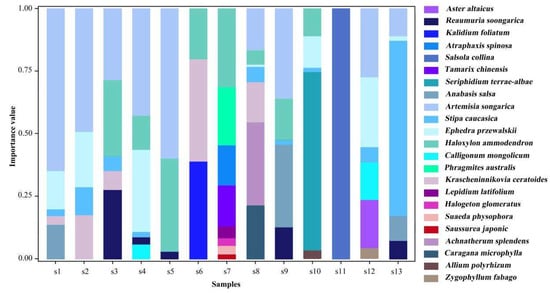
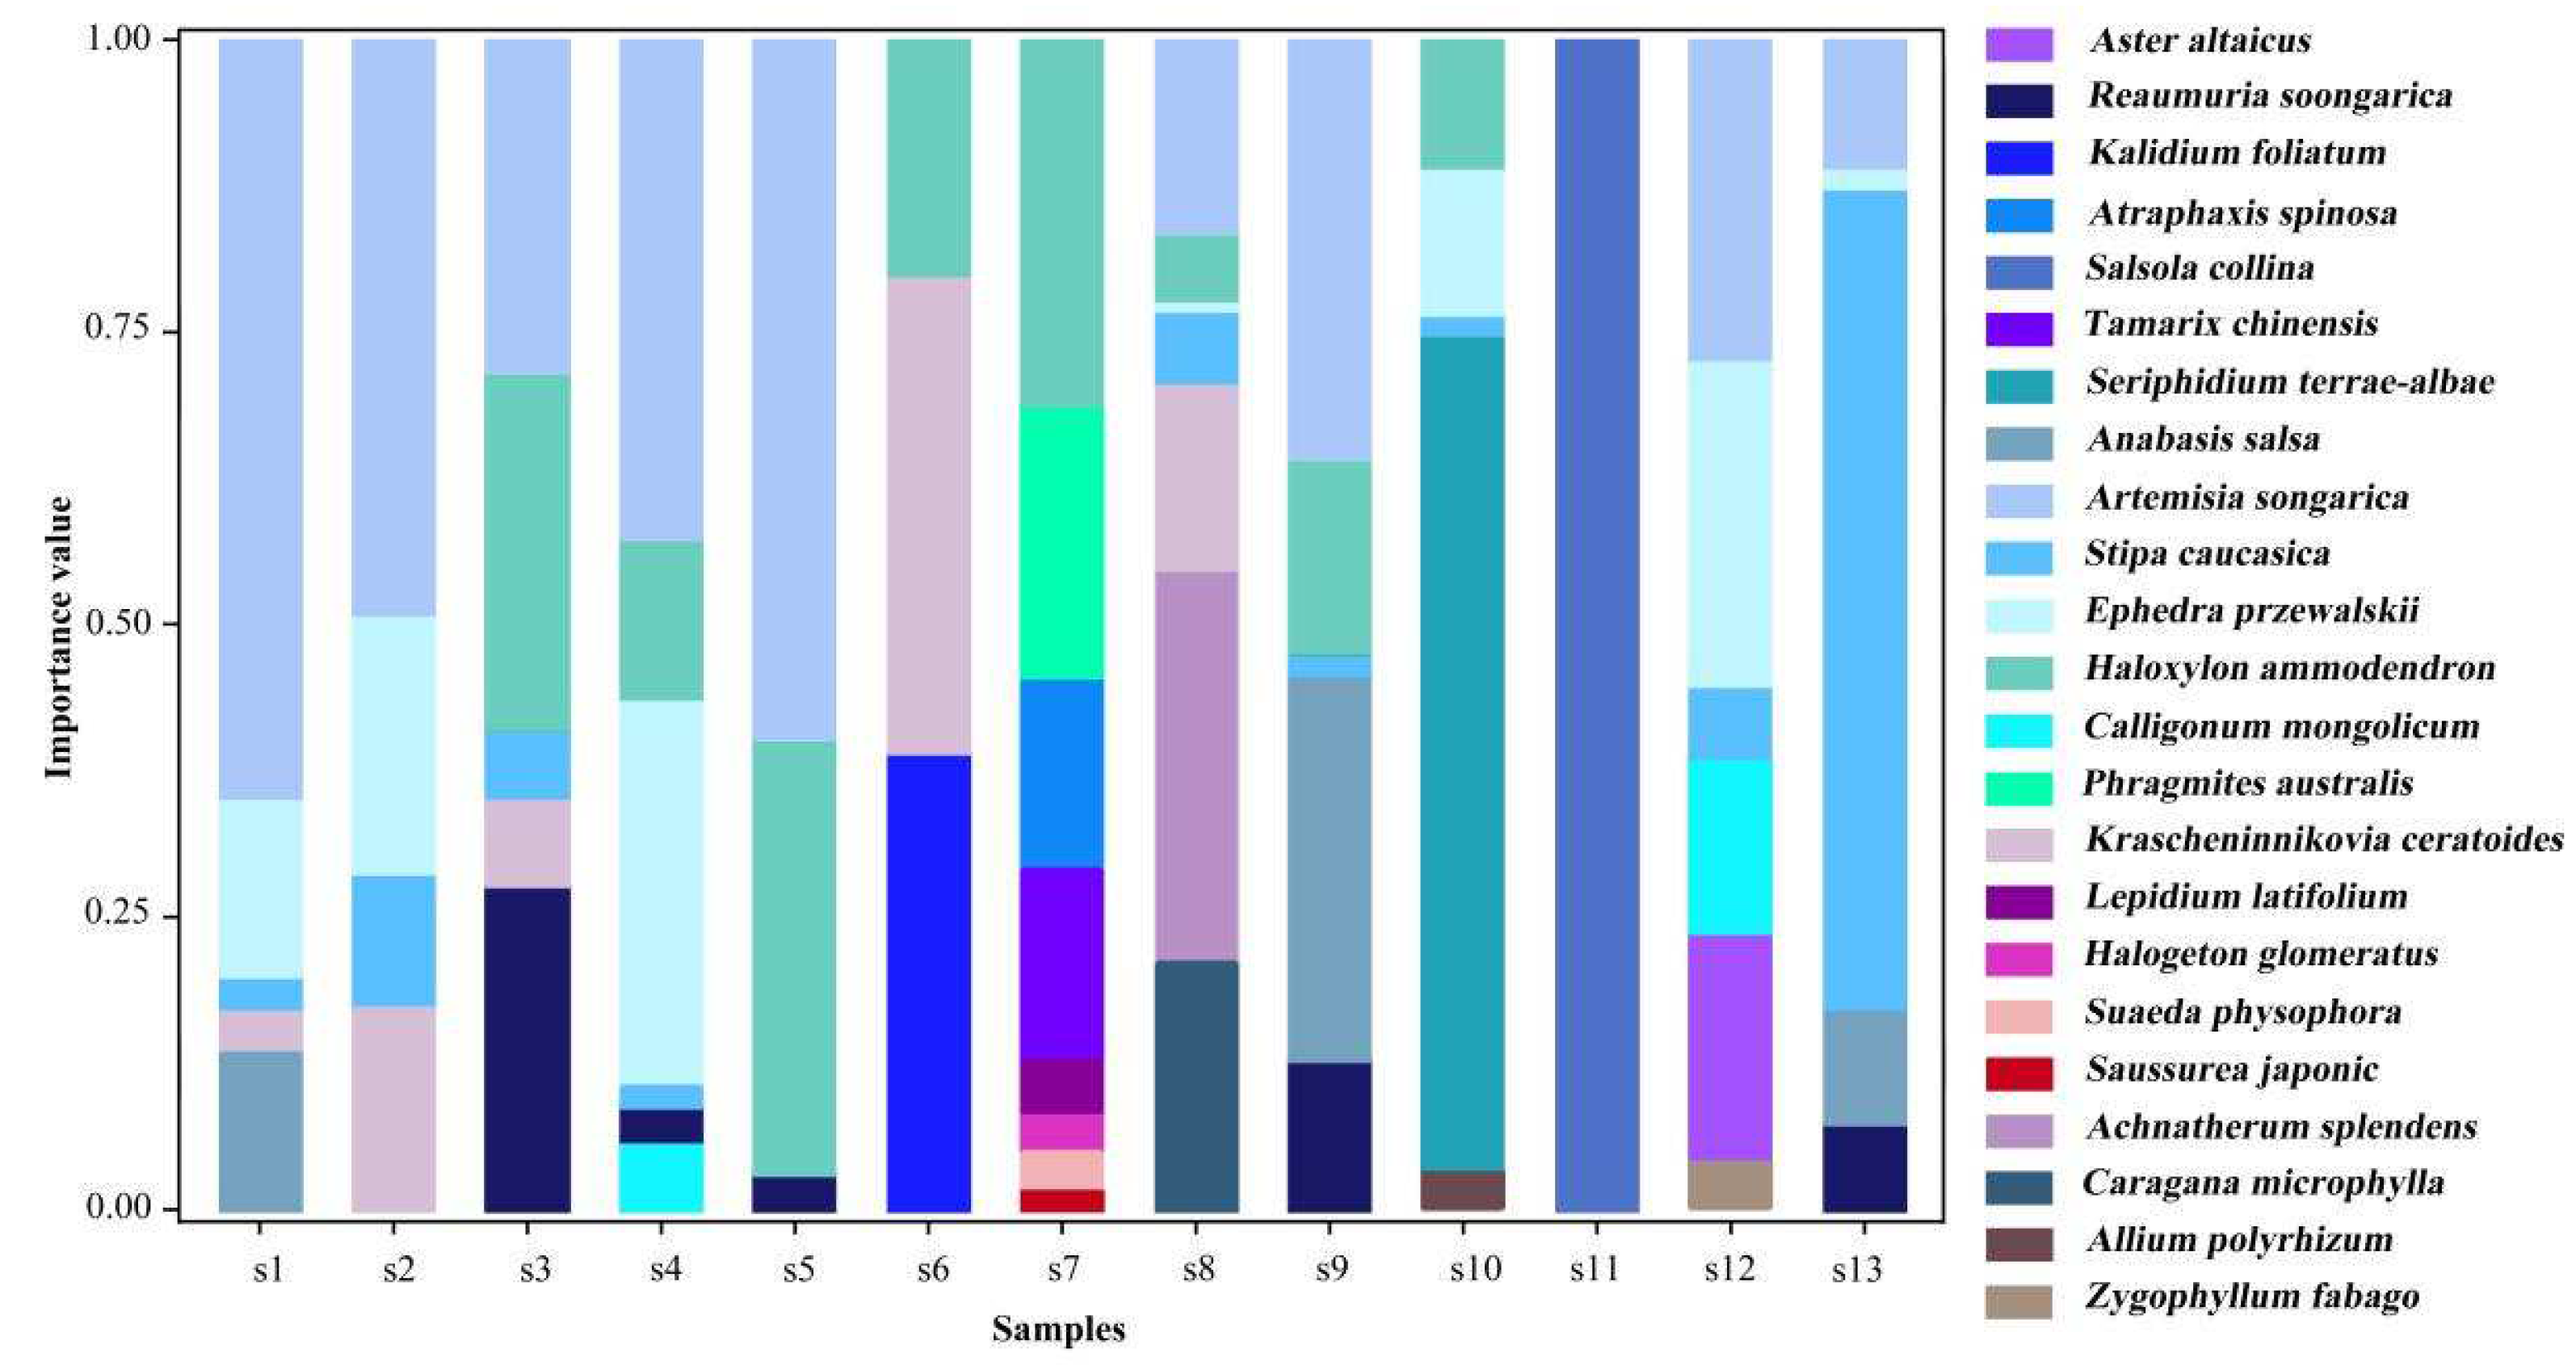
Figure 2.
The importance values of the 23 plant species in the 13 sampling sites.
To reflect the coupling of the plant and soil nutrients at the community level, the indicators that were related to soil properties were averaged at the sampling site level. The plant community stoichiometry was obtained by calculating the community–weighted nitrogen and phosphorus stoichiometries (Equation (2)).
In the formula, j is the weighted mean of the community N or P stoichiometry (mg g−1) or the N:P ratio at sampling site , xi is the average leaf N or P concentrations or the N:P ratios of the species at sampling site , is the relative abundance of species at sampling site , and is the relative plant height of species at sampling site .
All data were subjected to the Kolmogorov–Smirnov test and the Levene test before analysis. When necessary, a natural log transformation was applied to the data to meet the assumption of the normal distribution of the data and the homogeneity of variances [61]. One-way analysis of variance was used to examine the differences between the individual plant and community nitrogen and phosphorus stoichiometries, as well as the differences between the soil properties of the sample squares. Linear regression was used to analyze the responses of the N and P stoichiometric characteristics of individual plants and the community to the fluctuations produced by the soil properties. The above statistical analyses were conducted using the SPSS statistical package (PASW statistics 21.0; IBM Corporation, Armonk, NY, USA) and SigmaPlot 12.5 (SyStat Software Inc., San Jose, CA, USA). Variance partitioning analysis was used to quantify and disentangle the relative contributions of soil water and salt conditions and nutrient conditions to community N and P stoichiometries. This was performed using the R studio (vegan, ade4, gclus, ape, psych) package.
3. Results
3.1. Plant Community Composition and Soil Properties
In this study, 23 plant species were identified in the 13 sample sites. The spatial distribution of the dominant species showed heterogeneity (Figure 2). Sampling sites s1, s2, s4, s5, and s9 were Artemisia desert with a small shrub (Artemisia songarica) as the dominant species. Sampling sites s3, s7, and s12 were typical small tree and shrub desert with Haloxylon ammodendron and Ephedra przewalskii as the dominant species. Sampling sites s6, s8, s10, and s13 were dominated by the perennial herbs Krascheninnikovia ceratoides, Achnatherum splendens, Seriphidium terrae-albae, and Stipa caucasica. The dominant species at sampling site s11 was the annual herb Salsola collina.
There was substantial variation in soil properties among the 13 sampling sites (Table 1). The variations in soil water content ranged from 8.17% to 38.9%, with the lowest and highest values occurring at s1 and s7, respectively. Variations in soil salt content ranged from 0.406 (s5) to 22.000 (s7) g kg−1. Soil total N concentrations ranged from 0.174 (s12) to 1.209 (s7) mg g−1 and soil total P concentrations ranged from 0.453 (s13) to 0.802 (s7) mg g−1.
3.2. Individual Plant Stoichiometric Characteristics in Relation to Soil Properties
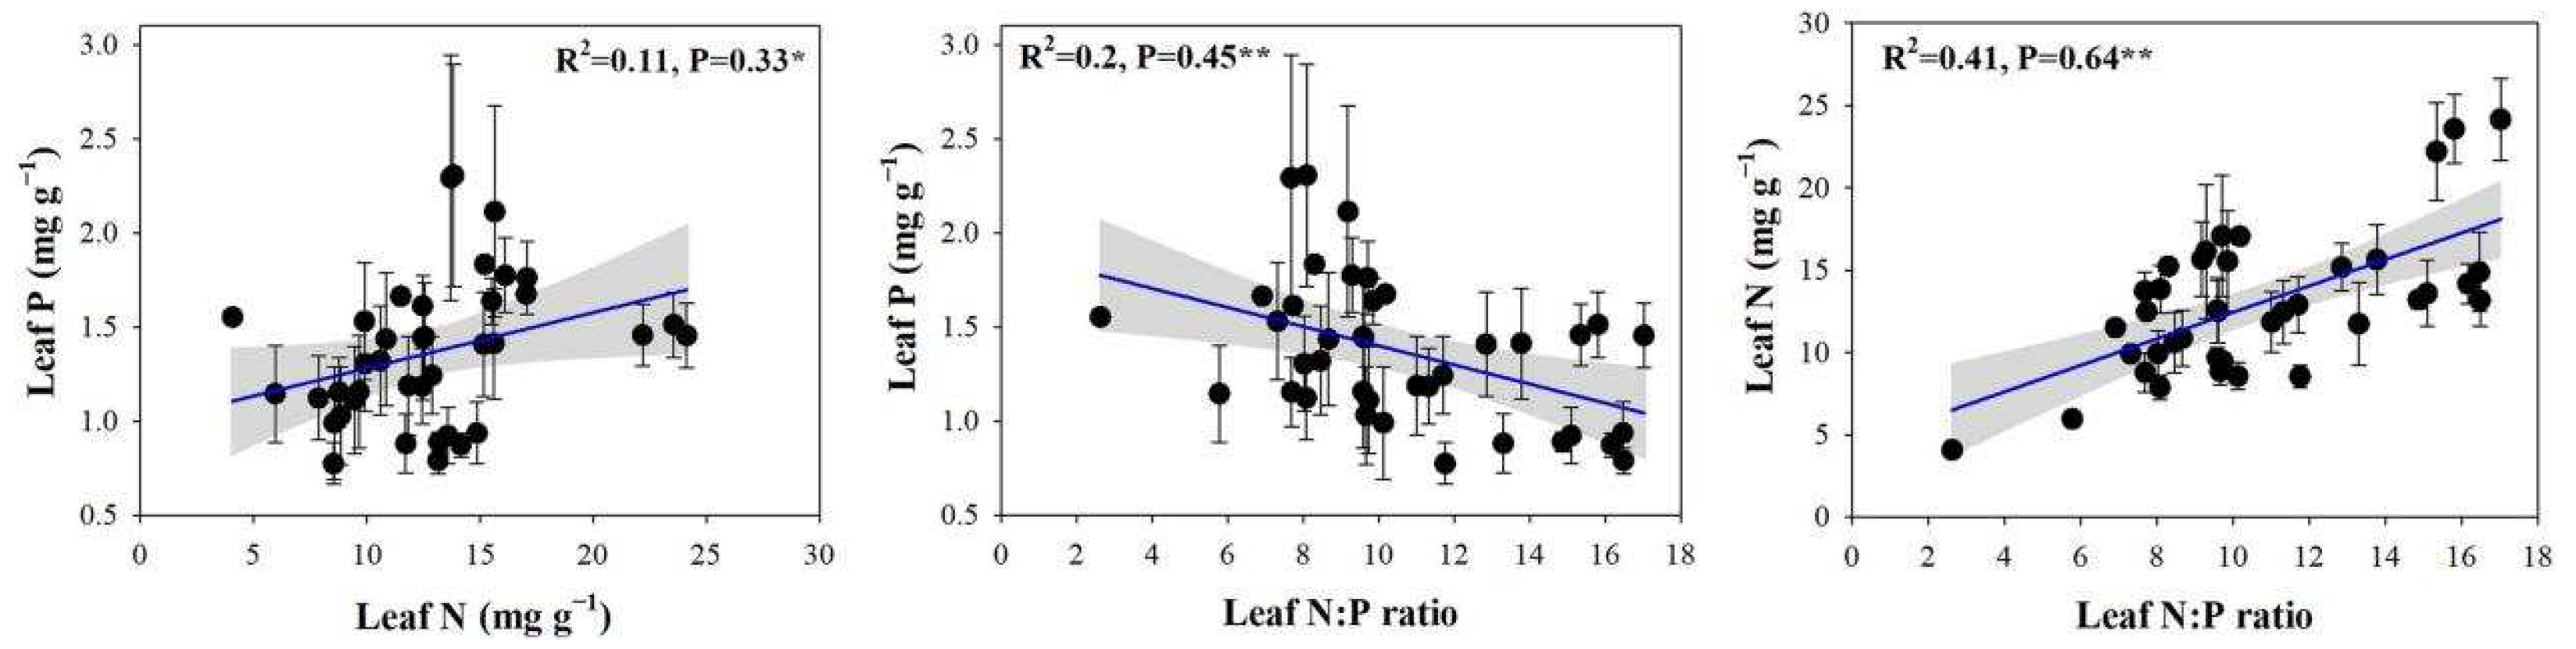
In this study, the leaf N concentrations, P concentrations, and N:P ratios of 23 plant species ranged from 4.08 to 31.39 mg g−1, from 0.48 to 3.78 mg g−1, and from 2.63 to 22.52, respectively. Significant correlations between the N and P concentrations and the N:P ratios of plant leaves were found (Figure 3), Along with positive and significant correlations between the leaf N and P concentrations (p < 0.05) and a highly significant positive correlation between the leaf N concentrations and the N:P ratios (p < 0.01). By contrast, a highly significant and negative correlation was observed between the leaf P concentrations and the N:P ratios (p < 0.01).
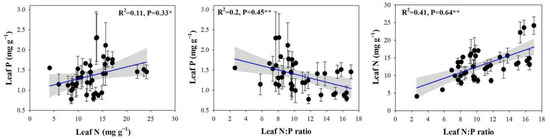
Figure 3.
Relationships between leaf N and P concentrations and N:P ratios. Note: the significant differences are reported from one-way analysis of variance as *, p < 0.05; **, p < 0.01.
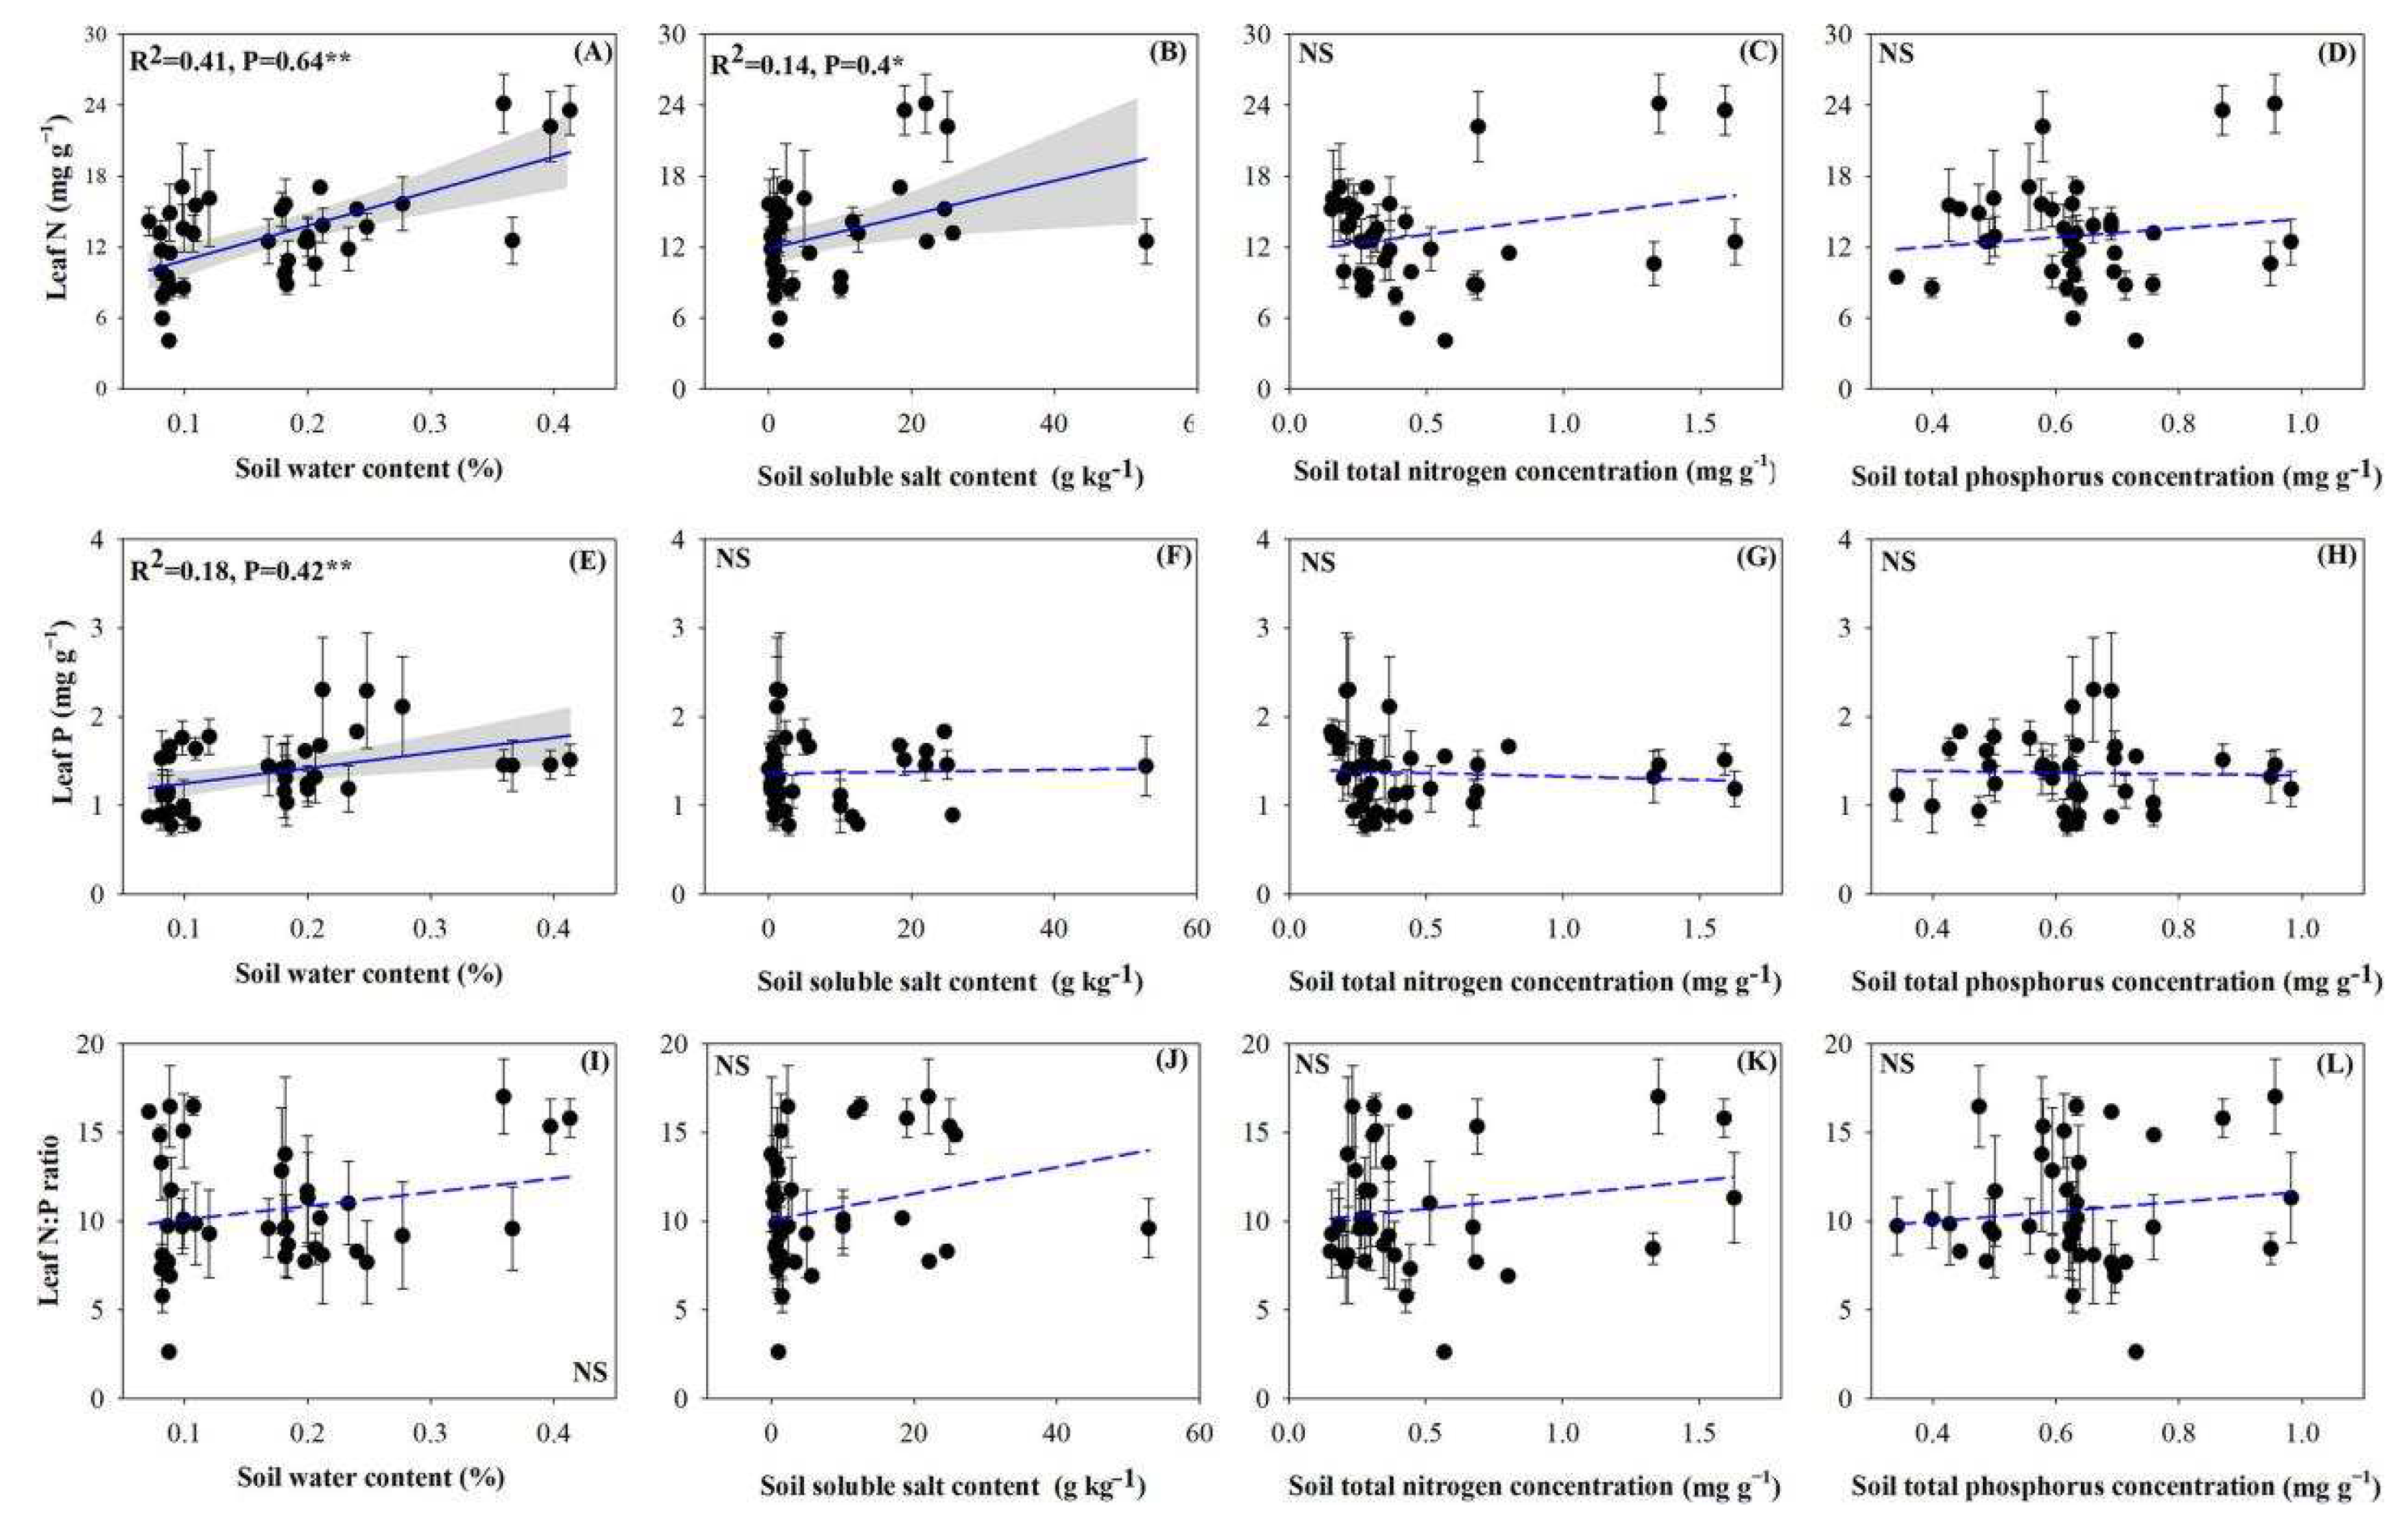
The concentrations of both N and P in the leaves positively and highly significantly correlated with the soil water content (Figure 4A,E; p < 0.01). Leaf N concentration also reached significant levels of positive correlation with soil salinity (Figure 4B; p < 0.05). N and P stoichiometries between the soil and individual plants were not significant (Figure 4C,D,G,H,K,L).
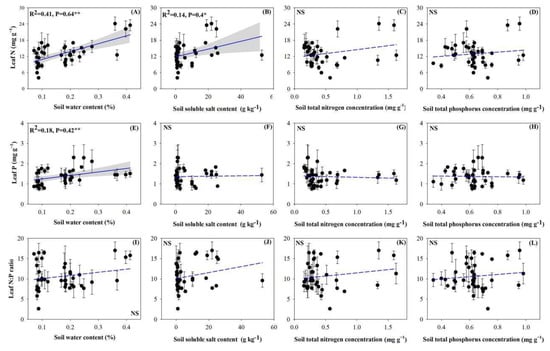
Figure 4.
Relationships between individual plant stoichiometric characteristics and soil properties. (A), Correlation between the individual plant leaf N concentration and soil water content; (B), Correlation between the individual plant leaf N concentration and soil soluble salt content; (C), Correlation between the individual plant leaf N concentration and soil N concentration; (D), Correlation between the individual plant leaf N concentration and soil P concentration; (E), Correlation between the individual plant leaf P concentration and soil water content; (F), Correlation between the individual plant leaf P concentration and soil soluble salt content; (G), Correlation between the individual plant leaf P concentration and soil N concentration; (H), Correlation between the individual plant leaf P concentration and soil P concentration; (I), Correlation between the individual plant leaf N:P ratio and soil water content; (J), Correlation between the individual plant leaf N:P ratio and soil soluble salt content; (K), Correlation between the individual plant leaf N:P ratio and soil N concentration; (L), Correlation between the individual plant leaf N:P ratio and soil P concentration. Note: the significant differences are reported from one-way analysis of variance as NS, p ≥ 0.05; *, p < 0.05; **, p < 0.01.
3.3. Plant Community Stoichiometric Characteristics in Relation to Soil Properties
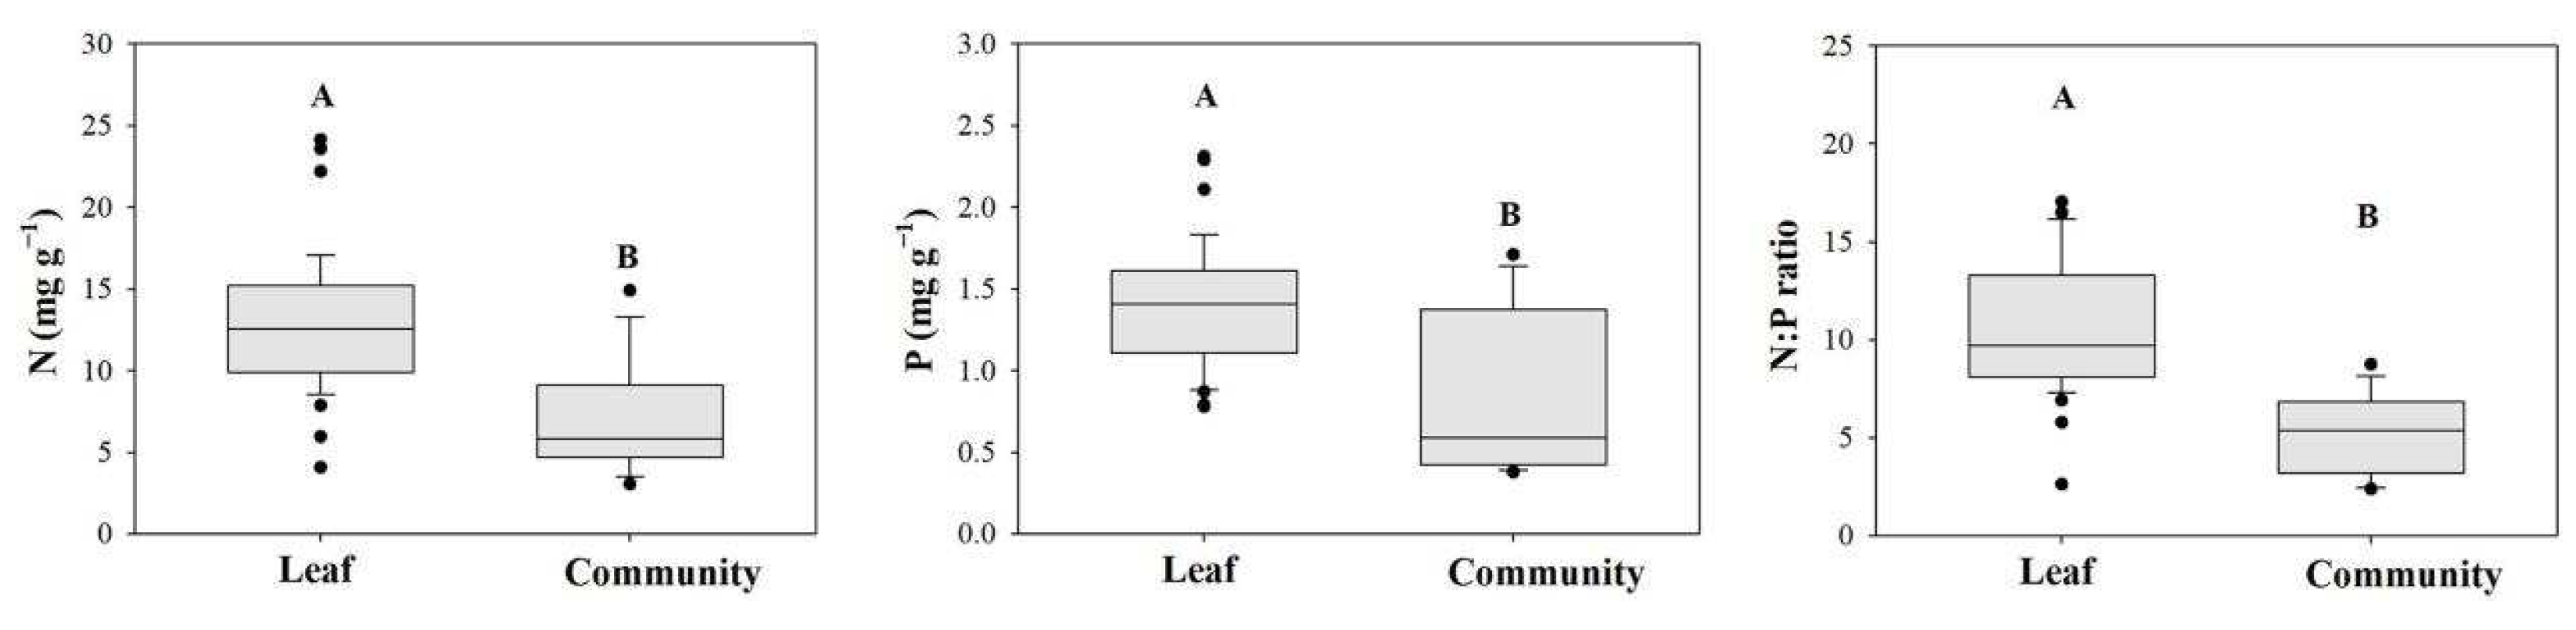
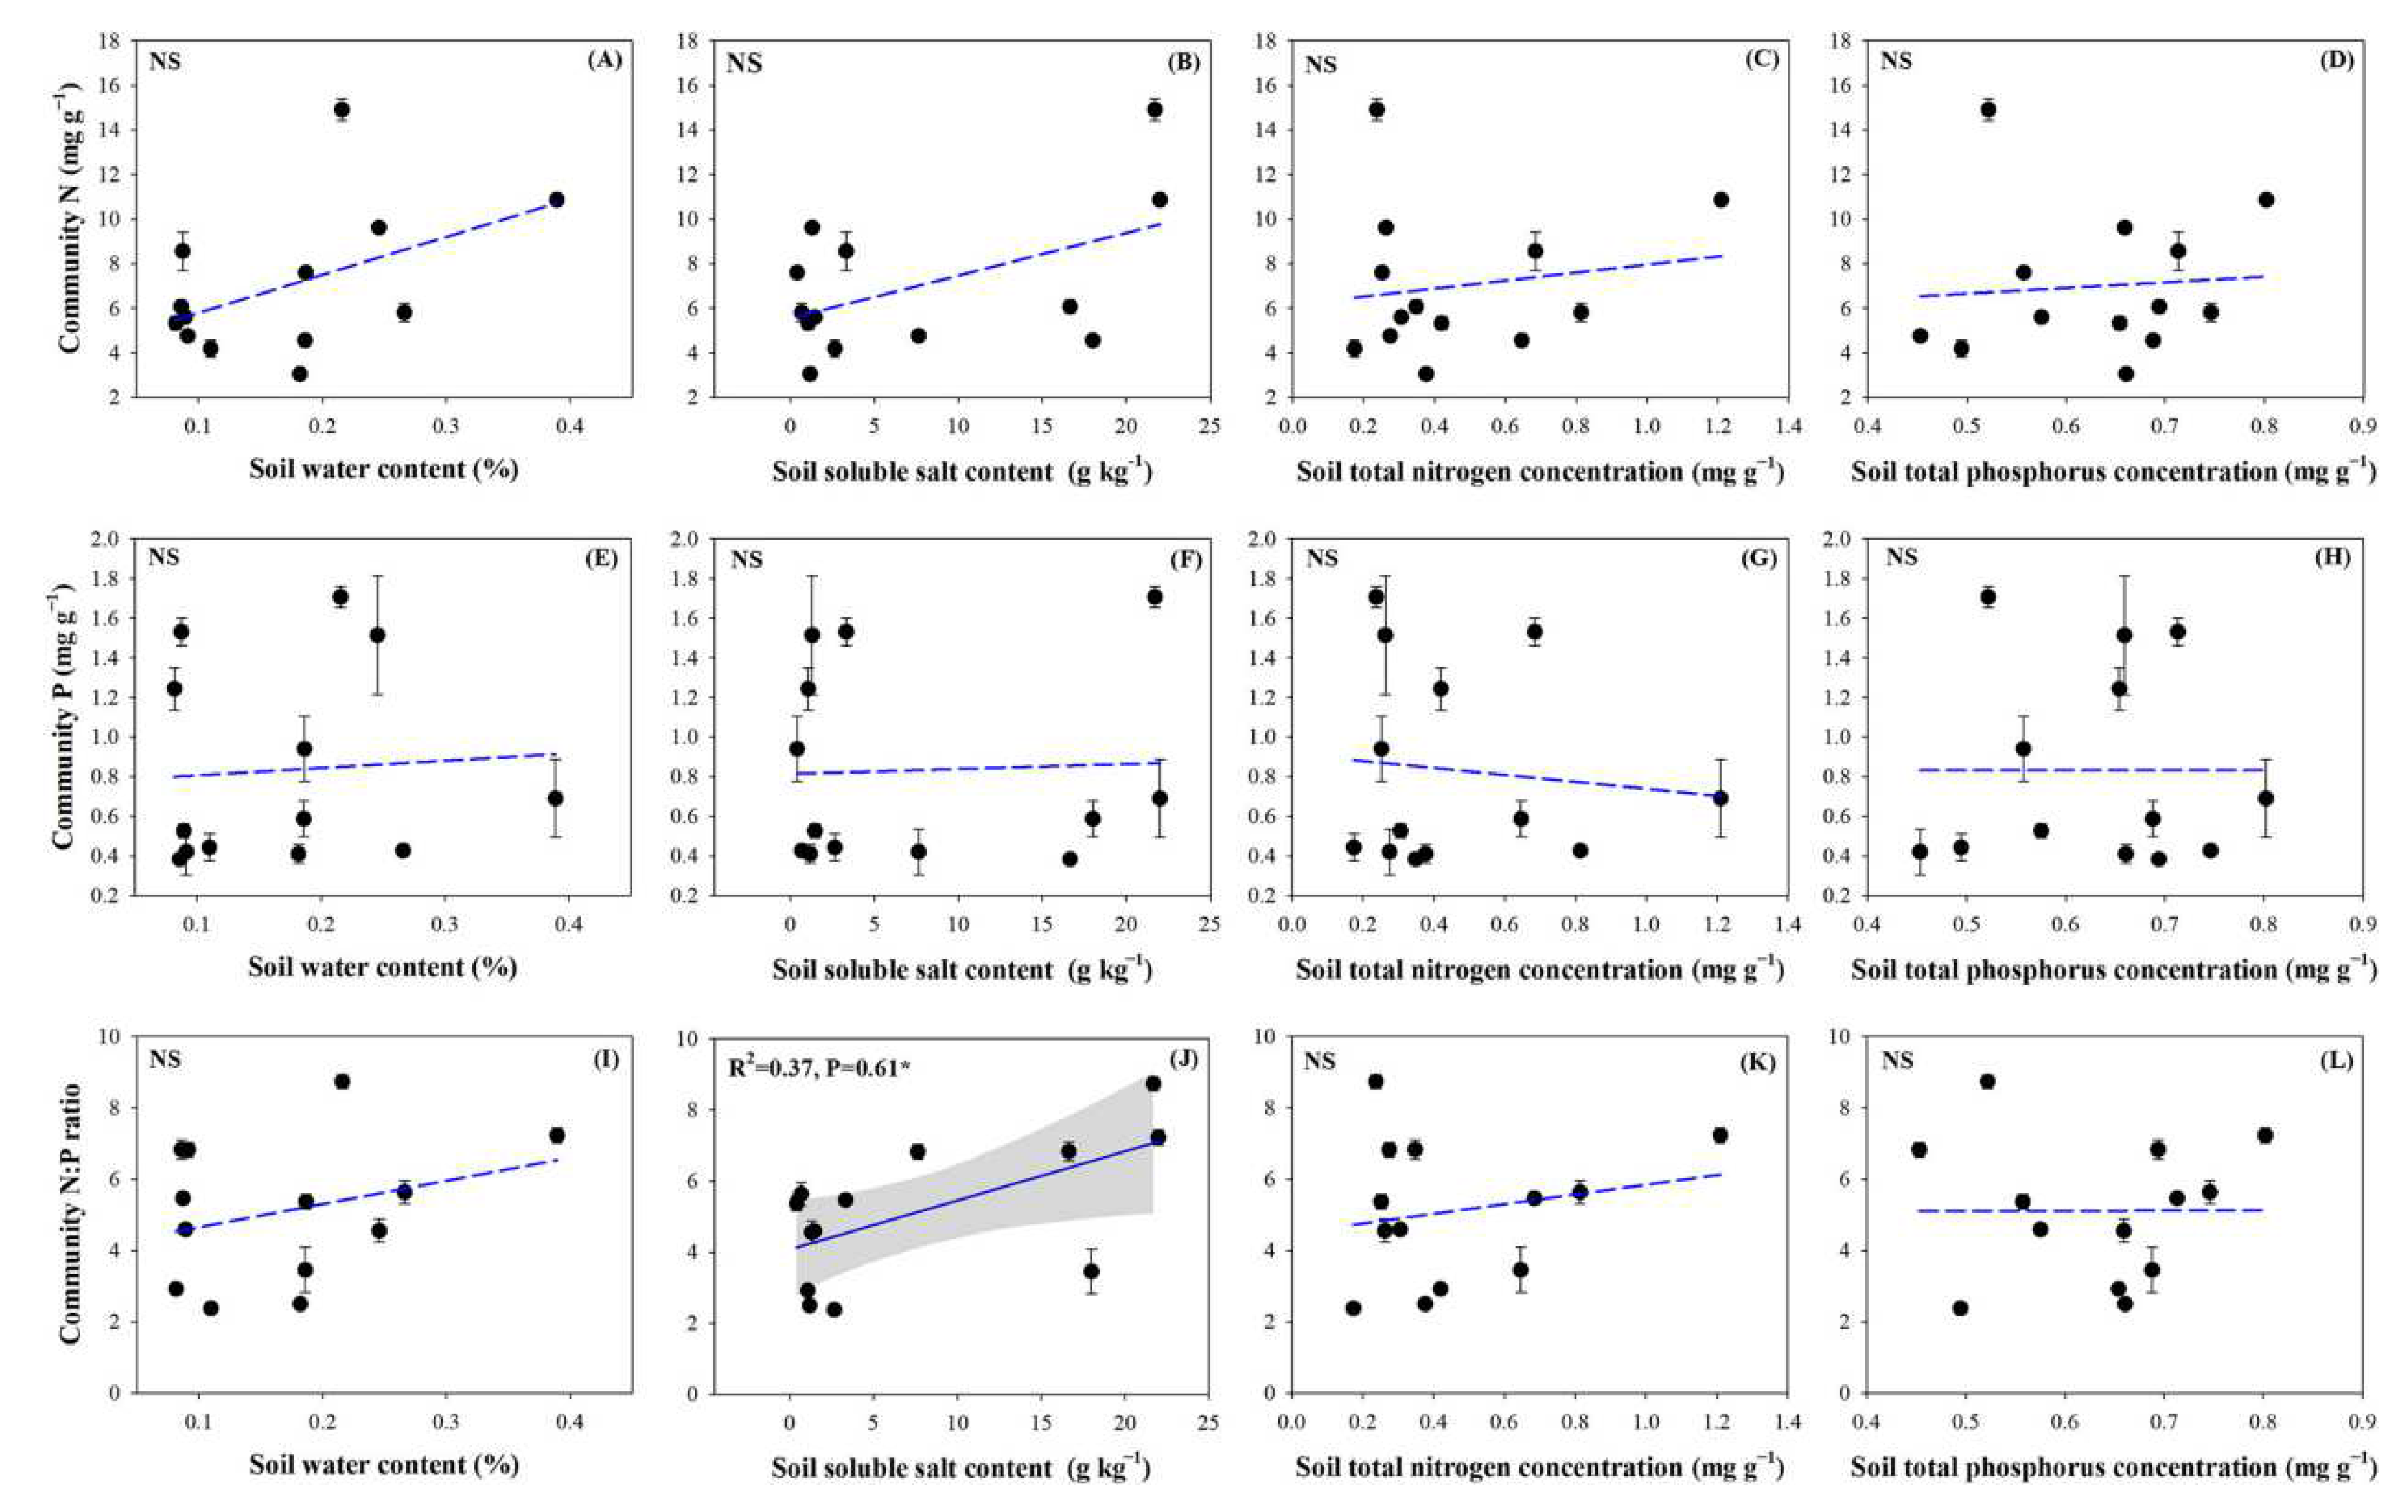
The plant community N and P concentrations and N:P ratios were highly significantly lower than those of individual plants in all 13 sampling sites (p < 0.01). The community N concentrations, P concentrations, and N:P ratios ranged from 3.06 to 14.91 mg g−1, from 0.38 to 1.71 mg g−1, and from 2.38 to 8.74, respectively (Figure 5). There were no significant correlations between the N and P concentrations or the N:P ratio at the community level and the soil water content, total N or total P content (Figure 6; p > 0.05). However, a positive correlation between the soil salt content and the N:P ratio of the community reached a significant level (Figure 6J; p < 0.05).
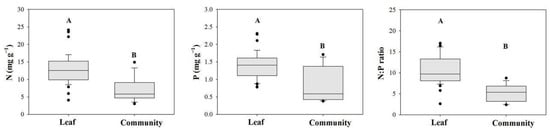
Figure 5.
Comparing the N and P stoichiometries of individual plants and plant communities.
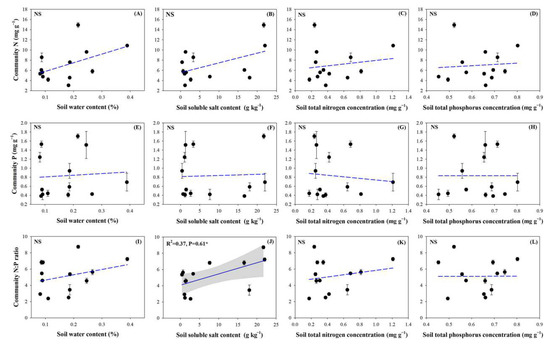
Figure 6.
Plant community stoichiometry in relation to soil properties. (A), Correlation between the plant community N concentration and soil water content; (B), Correlation between the plant community N concentration and soil soluble salt content; (C), Correlation between the plant community N concentration and soil N concentration; (D), Correlation between the plant community N concentration and soil P concentration; (E), Correlation between the plant community P concentration and soil water content; (F), Correlation between the plant community P concentration and soil soluble salt content; (G), Correlation between the plant community P concentration and soil N concentration; (H), Correlation between the plant community P concentration and soil P concentration; (I), Correlation between the plant community N:P ratio and soil water content; (J), Correlation between the plant community N:P ratio and soil soluble salt content; (K), Correlation between the plant community N:P ratio and soil N concentration; (L), Correlation between the plant community N:P ratio and soil P concentration. Note: the significant differences are reported from one-way analysis of variance as NS, p ≥ 0.05; *, p < 0.05.
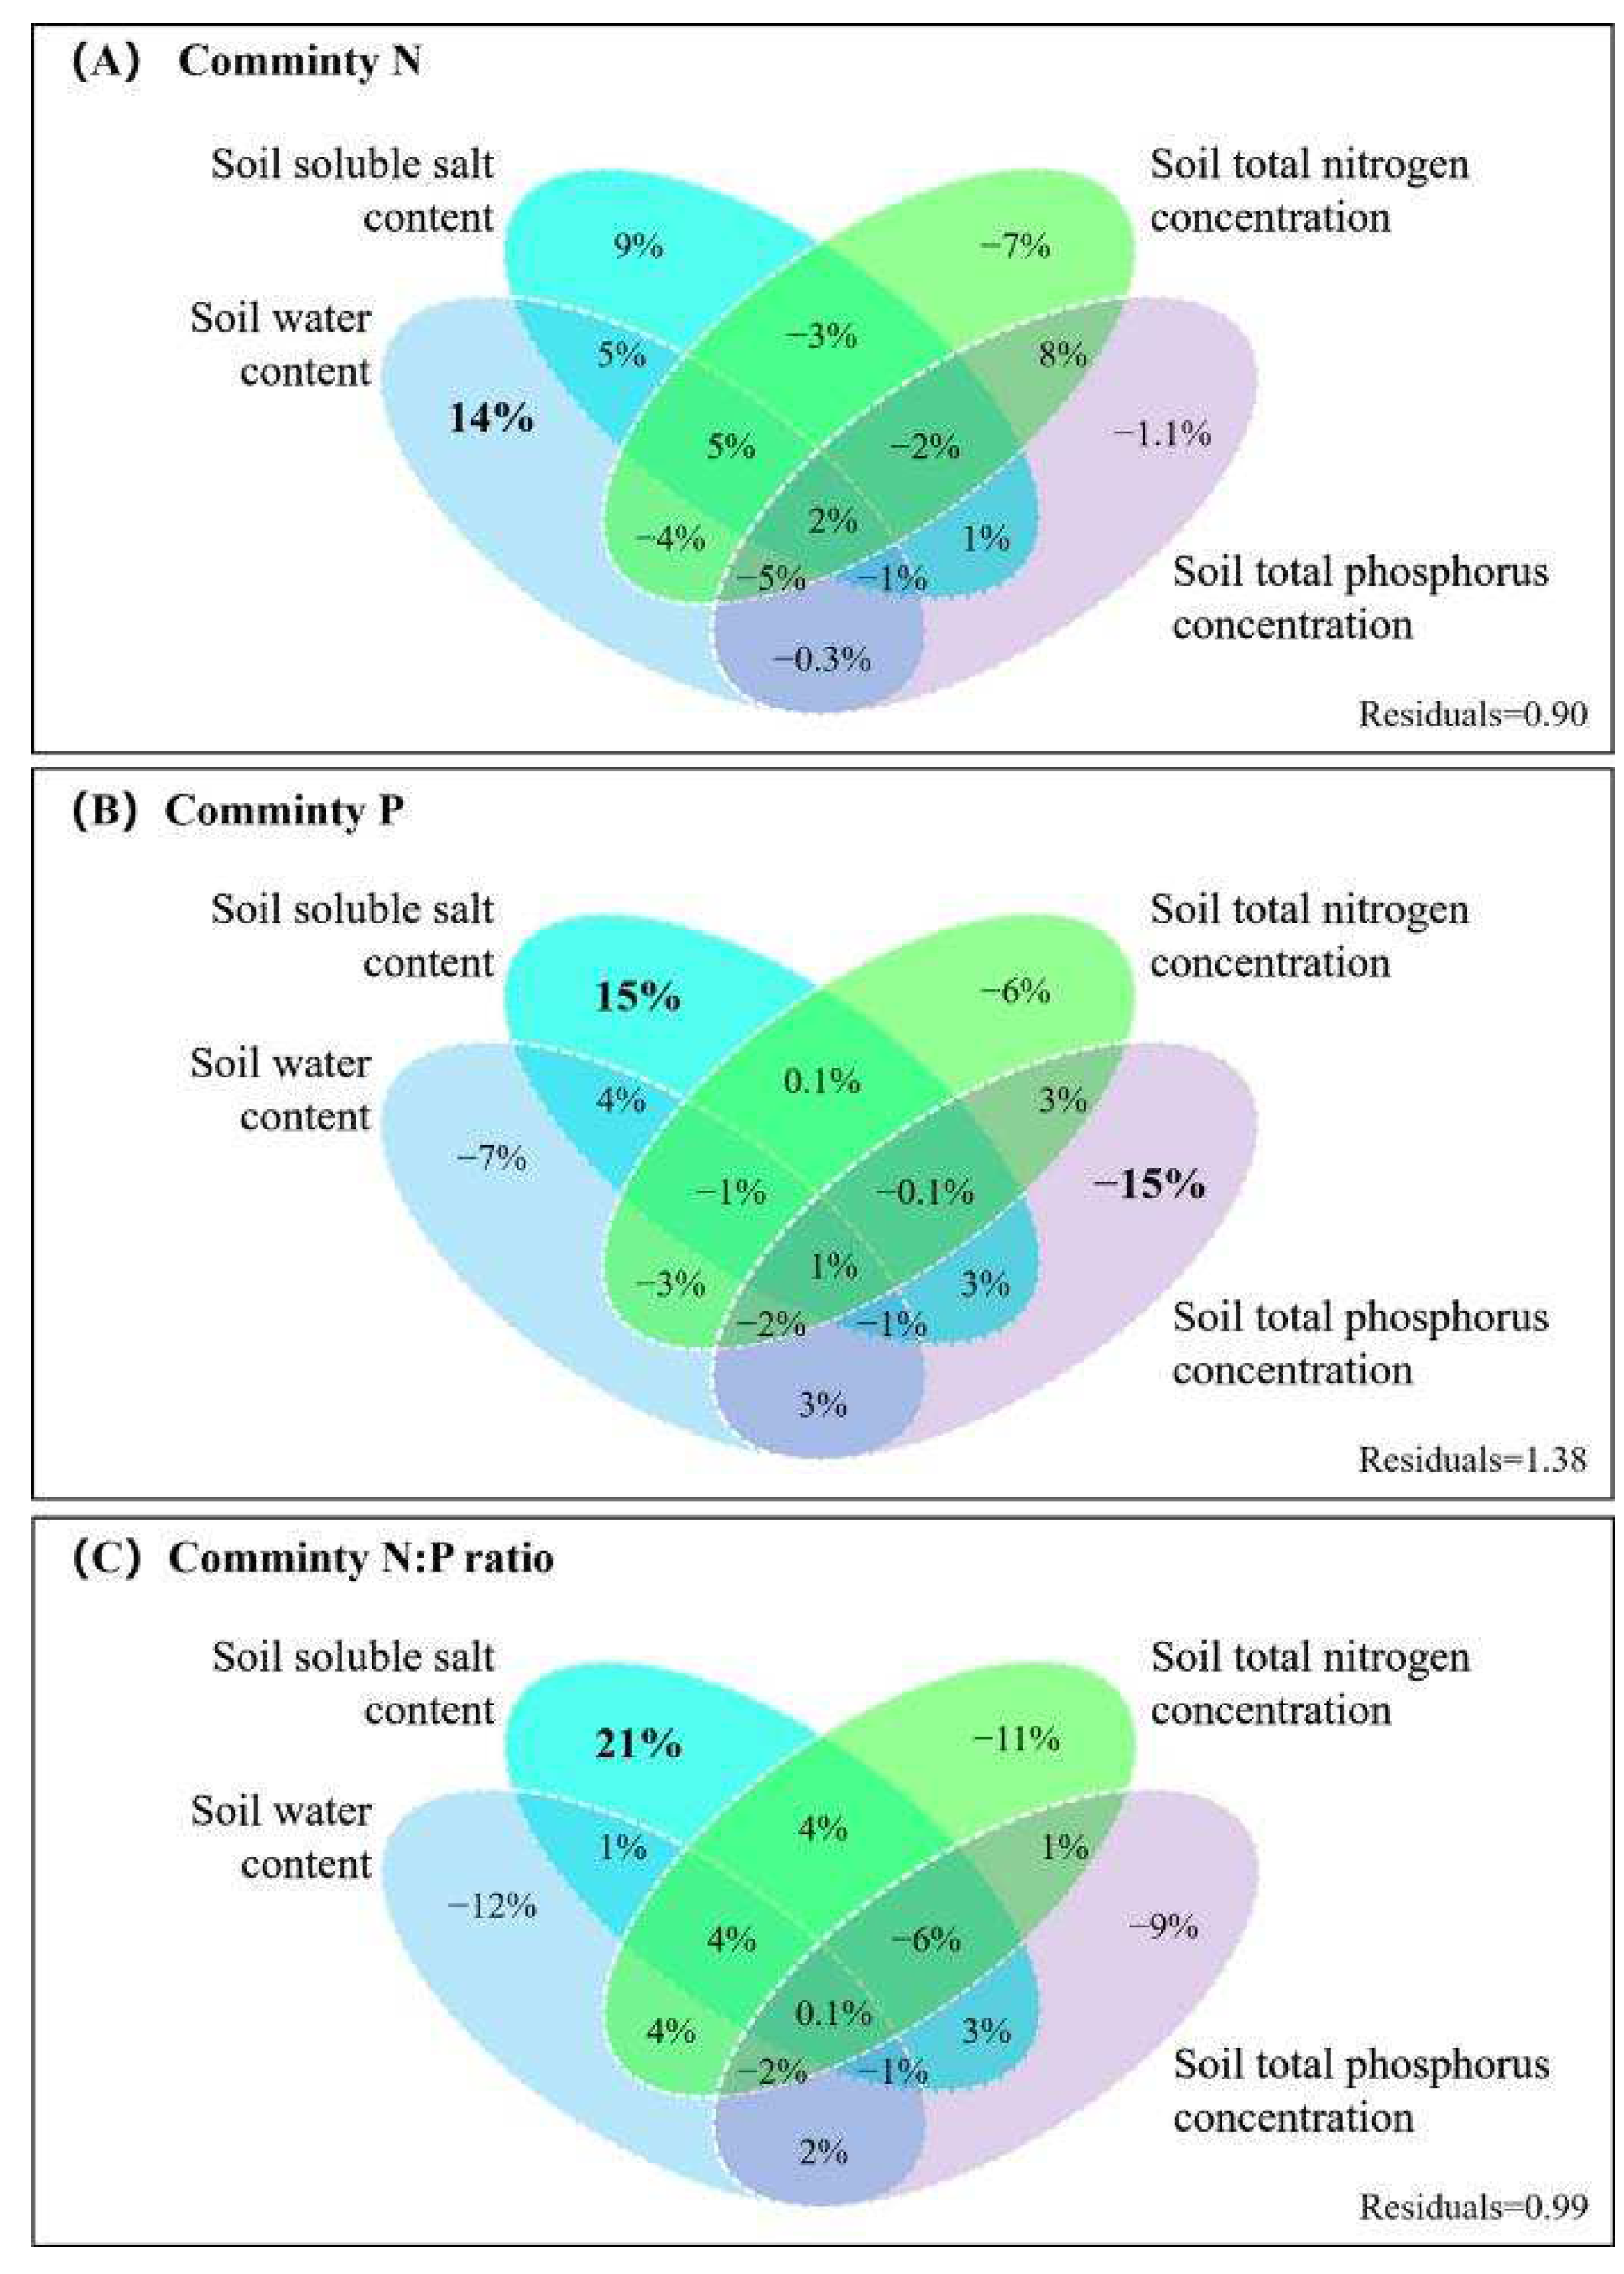
The variance partitioning analysis provided additional evidence that the community N concentration was mainly influenced by soil water content, while the single effect value was 14% (Figure 7A). The soil water content and salt content showed negative effects on the community P concentration (7% and 15%, respectively) and soil total P content had a negative feedback effect on the community P concentration (15%, see Figure 7B). The effect on the community N:P ratio was mainly from soil salt concentration with a single effect value of 21% (Figure 7C). The variance partitioning analysis also showed that the effects of soil properties on community stoichiometry were not significant.
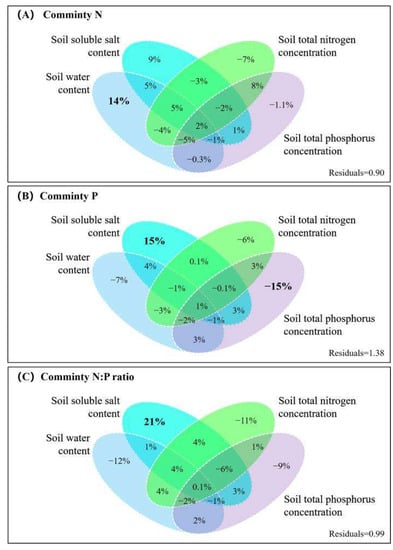
Figure 7.
The results of the variance partitioning analysis for the community N and P concentrations and N:P ratios.
4. Discussion
4.1. Soil Nutrients Are Not Associated with Stoichiometric Variation in Desert Plants
In the current study, the mean leaf N concentration (12.94 mg g−1) of the 23 plant species was lower than the range (20.09–26.46 mg g−1) that has been reported for plants in terrestrial ecosystems, whereas the mean leaf P concentration (1.39 mg g−1) was close to the results (1.46–1.99 mg g−1) that have been reported for plants in terrestrial ecosystems [33]. The N:P ratios suggested that N elements were the primary constraint to plant growth in the studied region (the average leaf N:P ratio was 10.64). Previous research has shown that soil nutrients are the primary regulators of plant stoichiometry and that plant growth is mainly controlled by soil phosphorus in habitats with sufficient precipitation and by soil nitrogen in environments with little precipitation [62,63]. However, the influence of soil nutrients on plant stoichiometry was not as significant in this study as prior research has shown. We found that the relationships were not significant (p > 0.05) by analyzing the correlations and variance partitioning results between individual plant and community stoichiometric characteristics and soil nutrients (Figure 4, Figure 6, and Figure 7). This indicates that the coupling relationship between the soil and plant nutrients is mutated in extreme habitats.
Compared to other non-desert ecosystems, the saline–alkaline soil (enriched in Ca and Mg ions and high conductivity) in this study area increased the forms of N and P solidification and reduced enzyme activity, nutrient mineralization, and soil organic matter decomposition rates [58,64], resulting in increased nutrient transfer costs between the plants and soil [65]. Furthermore, the extremely poor soil nutrient conditions acted as a strong environmental filter for desert plants. The physiological and ecological processes of plants could also explain the weak responses of their nitrogen and phosphorus stoichiometries to soil nutrients. There were significant correlations between leaf N and P concentrations and the N:P ratios of individual plants in the study area (Figure 3), with a significant positive correlation between leaf N and P concentrations (p < 0.05) and a highly significant correlation between leaf N and P concentrations and N:P ratios (p < 0.01). This shows that the relative consistency of N and P changes in the leaves of desert plants in nutrient-poor soil can avoid limitation or toxicity caused by N and P concentrations, which is a strong guarantee for plants growing and developing stably. In addition, the growth rate hypothesis proposed that rapid-growth plants have greater nutrient requirements and are more susceptible to nutrient limitation [66,67]. By contrast, desert plants in this study area developed exceedingly slowly, thereby obscuring the nutrient coupling between the plants and the soil. Furthermore, the unique nutrient recycling and redistribution strategies of desert plants also minimized the dependence of plant stoichiometry on soil nutrients [68,69].
4.2. Aridity and High Salinity Drive the Individual and Community Stoichiometric Characteristics of Desert Plants
This study discovered that in extreme desert environments, soil water and salt conditions, particularly soil water content, contributed more to plant stoichiometry than soil nutrients. This result supports Hypothesis 1 of this paper. In this study, soil water content had highly significant and positive correlations with individual plant leaf N and P concentrations (Figure 4) and promoted the accumulation of community N concentrations (Figure 6). The interaction between soil water content and soil salt content positively affected the community P concentrations. Plant stoichiometry is not only dependent on nutrient concentrations in the soil but is also limited by soil nutrient effectiveness [70,71], mobility [72], and plant ecophysiological properties [73]. Soil water content is the main soil property that interferes with the growth of vegetation in arid areas and limits soil nutrient contents by limiting vegetation productivity, apoplastic input, decomposition, and root absorption and utilization [72,74,75]. N and P in the soil need to be converted into ammonium–N, nitrate–N, and organophosphorus forms through hydrolysis, electrolysis, and ammonification before they can be taken up by plants [29,76,77]. Nunes et al. found that aridity limits the metabolic capacity of soil enzymes and produces oxidative damage that hinders nitrogen fixation [78]. Delgado-Baquerizo et al. found a direct negative effect of aridity on phosphatase activity [39]. In such extreme habitats, the positive effects of N, P, and soil water content are related to the specific responses of plants to drought. Aridity increases the production of abscisic acid and the initiation of protective mechanisms against stress enzymes. Plants tend to reduce their photosynthetic rates, reduce their leaf surface area, and divert nutrients to escape drought. The elements N and P play an important role in drought adaptation as they are the proteomics and metabolomics of plants. In plants, N is a component of organic compounds (e.g., amino acids, chlorophyll, biological enzymes, etc.), the basis of genetic material [79], and an effective instrument for enhancing respiration, resource requirements, and productivity [37,74,80,81]. Higher P concentrations in plants increase water use efficiency by inhibiting water transpiration per leaf unit [82,83] and improving stomatal control [84].
Previous studies have confirmed that salt stress increases plant metabolic costs [65,85] and has an inhibitory effect on plant nutrient accumulation. In salinized desert ecosystems (areas that are similar to the present study area), no significant correlations between plant stoichiometric characteristics and soil salinity were found by Gong et al. [86]. In contrast, in the present study, some plant stoichiometric characteristics showed a positive correlation with soil salinity. Soil salt content was positively coupled with N concentrations and N:P ratios at the individual plant and community levels, with individual plant leaf N concentrations and the community N:P ratios reaching significant levels (Figure 4 and Figure 6; p < 0.05). The variance partitioning results also showed a 21% contribution of salinity to the community N:P ratio (Figure 7). The differences between the results found in this study and those in previous works under desert conditions could be due to regional heterogeneity. Plants (such as Tamarix spp., Kalidium spp., Equisetum spp., and Salsola spp.) that live in extreme drought and high-salt habitats display enhanced defense mechanisms against salt stress by active salt excretion, the isolation of salt ions, and other salt-tolerant methods. They can also absorb and accumulate salt to regulate the cellular osmotic functions that are involved in the absorption of other nutrients by the root system and improve the plant resistance to stress [87,88]. In addition, it has also been shown that N actively couples with salt ions from saline plants to synergistically improve soil fertility conditions [89]. By contrast, we did not find any significant relationships between individual plant and community P concentrations and soil salt content, which could be due to the presence of many Cl−, SO42−, and other anions in the soil that compete with P, resulting in the decrease in P uptake by plants [90,91,92] and the high N:P ratio that was positively coupled with the total soil salt content.
There were differences between the responses of individual plant and community stoichiometries to soil water content and salt content in the study area. The individual leaf N and P concentrations (Figure 4) were not statistically significantly correlated with the average N and P concentrations of the community (Figure 6). This could be due to the impact of community diversity on resource uptake and storage [17,93]. Gong et al. found that a water deficit in the topsoil (0–20 cm) inhibits nutrient uptake by desert community plants and reduces community stoichiometry within the arid zone [86]. They also found that in response to stress, communities increase opportunities for nutrient uptake selection or complementary effects through species turnover, thereby masking the response of individual plant stoichiometry to the mechanism drivers [52]. Abbas et al. suggested that as species diversity increases, communities change their resource allocation patterns and transfer more nutrients from the leaves to the stems in competition for light, resulting in a weakened coupling between leaf stoichiometry and soil properties within the community [94]. In combination with the findings of this study, the community N and P concentrations and N:P ratios were significantly lower than the leaf N and P concentrations and N:P ratios of individual plants (Figure 5; p < 0.01). The soil water content promoted community N accumulation (Figure 6; even though the relationship was not significant, it should not be ignored). The soil salt content enhanced the community N:P ratios (Figure 6 and Figure 7). We suggest that desert plant communities try to reduce their sensitivity to soil properties by limiting nutrient requirements, metabolic rates, and productivity. Desert plant communities exhibit conservative stoichiometric strategies and stable adaptive capacities in the face of stress. These findings support our Hypothesis 2. In addition, we all know that the community N:P ratio is a characteristic mechanism of nutrient regulation that involves the uptake and interspecific partitioning of N and P elements [95]. The significant positive correlation between soil salt contents and community N:P ratios in this study suggested that the community N and P stoichiometries were relatively more sensitive to fluctuations in salinity. Furthermore, the community actively adjusted its nutrient allocation. This could be attributed to the dominance of saline plants in the study area. It was shown that the negative correlation between the leaf N and P concentrations at the community level and the intensity of stress was mainly due to changes in the shared species [52].
5. Conclusions
In this study, it was found that drought reduces the stoichiometry of plant nitrogen and phosphorus, thereby prompting them to decouple from soil nutrients. Desert plants adapt to high salt stress by accumulating salt ions and increasing their nitrogen concentration, which results in drought and high salinity being the main soil constraints to the formation of stoichiometric characteristics in desert plants. Desert plants have also developed stress tolerance mechanisms that adjust their internal balance of nitrogen and phosphorus elements and reduce the nutrient requirements of the community. In addition, we acknowledged the influence of extreme habitat types on the coupling mechanisms between soil properties and plant stoichiometry and highlighted the need for further research on plant stoichiometry under different extreme stresses to obtain a more accurate and comprehensive characterization of the biogeochemical cycles. Overall, our results provide valuable information about soil properties and plant nutrient cycling under aridity and high salinity stress and foreshadow greater pressure on vegetation survival in the study region within the context of continued climatic dryness in the future, which should be taken into account when managing ecosystems in arid zones.
Author Contributions
K.Y.: conceptualization, data curation, investigation, writing—original draft. H.X.: conceptualization, methodology, project administration. G.Z.: data curation, investigation. J.Y.: data curation. All authors have read and agreed to the published version of the manuscript.
Funding
This research received no external funding.
Acknowledgments
We would like to thank the Xinjiang Institute of Ecology and Geography, Chinese Academy of Sciences, for their support with the laboratory work.
Conflicts of Interest
The authors declare that the research was conducted in the absence of any commercial or financial relationships that could be construed as potential conflict of interest.
References
- Elser, J.J.; Sterner, R.W.; Gorokhova, E.; Fang, W.F.; Markow, T.A.; Conter, J.B.; Harrison, J.F.; Hobbie, S.E.; Odell, G.M.; Weider, L.W. Biological stoichiometry from genes to ecosystems. Ecol. Lett. 2000, 3, 540–550. [Google Scholar] [CrossRef] [Green Version]
- Hessen, D.O.; Ågren, G.I.; Anderson, T.R.; Elser, J.J.; De Ruiter, P.C. Carbon sequestration in ecosystems: The role of stoichiometry. Ecology 2004, 85, 1179–1192. [Google Scholar] [CrossRef]
- Tian, L.; Zhao, L.; Wu, X.; Fang, H.; Zhao, Y.; Hu, G.; Yue, G.; Sheng, Y.; Wu, J.; Chen, J.; et al. Soil moisture and texture primarily control the soil nutrient stoichiometry across the Tibetan grassland. Sci. Total Environ. 2018, 622–623, 192–202. [Google Scholar] [CrossRef]
- Heidrich, L.; Bae, S.; Levick, S.; Seibold, S.; Weisser, W.; Krzystek, P.; Magdon, P.; Nauss, T.; Schall, P.; Serebryanyk, A.; et al. Heterogeneity-diversity relationships differ between and within trophic levels in temperate forests. Nat. Ecol. Evol. 2020, 4, 1204–1212. [Google Scholar] [CrossRef] [PubMed]
- Zhang, Y.W.; Guo, Y.; Tang, Z.; Feng, Y.; Zhu, X.; Xu, W.; Bai, Y.; Zhou, G.; Xie, Z.; Fang, J. Patterns of nitrogen and phosphorus pools in terrestrial ecosystems in China. Earth Syst. Sci. Data 2021, 13, 5337–5351. [Google Scholar] [CrossRef]
- Yue, K.; Fornara, D.A.; Yang, W.; Peng, Y.; Li, Z.; Wu, F.; Peng, C. Effects of three global change drivers on terrestrial C:N:P stoichiometry: A global synthesis. Glob. Chang. Biol. 2017, 23, 2450–2463. [Google Scholar] [CrossRef] [PubMed]
- Dijkstra, F.A.; Pendall, E.; Morgan, J.A.; Blumenthal, D.M.; Carrillo, Y.; LeCain, D.R.; Follett, R.F.; Williams, D.G. Climate change alters stoichiometry of phosphorus and nitrogen in a semiarid grassland. New Phytol. 2012, 196, 807–815. [Google Scholar] [CrossRef] [Green Version]
- Elser, J.J. Biological stoichiometry: A chemical bridge between ecosystem ecology and evolutionary biology. Am. Nat. 2006, 168, S25–S35. [Google Scholar] [CrossRef]
- Geng, Y.; Ma, W.H.; Wang, L.; Baumann, F.; Kühn, P.; Scholten, T.; He, J.S. Linking above-and belowground traits to soil and climate variables:an integrated database on China’s grassland species. Ecology 2017, 98, 1471. [Google Scholar] [CrossRef] [Green Version]
- He, N.P.; Liu, C.C.; Piao, S.L.; Sack, L.; Xu, L.; Luo, Y.Q.; He, J.S.; Han, X.G.; Zhou, G.S.; Zhou, X.H.; et al. Ecosystem traits linking functional traits to macroecology. Trends Ecol. Evol. 2019, 34, 200–210. [Google Scholar] [CrossRef]
- Hobbie, S.E. Plant species effects on nutrient cycling: Revisiting litter feedbacks. Trends Ecol. Evol. 2015, 30, 357–363. [Google Scholar] [CrossRef] [PubMed]
- Luo, Y.; Peng, Q.W.; He, M.S.; Zhang, M.X.; Liu, Y.Y.; Gong, Y.M.; Eziz, A.; Li, K.H.; Han, W.X. N, P and K stoichiometry and resorption efficiency of nine dominant shrub species in the deserts of Xinjiang, China. Ecol. Res. 2020, 35, 625–637. [Google Scholar] [CrossRef]
- Moorhead, D.L.; Sinsabaugh, R.L.; Hill, B.H.; Weintraub, M.N. Vector analysis of ecoenzyme activities reveal constraints on coupled C, N and P dynamics. Soil Biol. Biochem. 2016, 93, 1–7. [Google Scholar] [CrossRef]
- Viciedo, D.O.; Prado, R.; Martinez, C.A.; Habermann, E.; Piccolo, M. Short-term warming and water stress affect Panicum maximum Jacq. stoichiometric homeostasis and biomass production. Sci. Total Environ. 2019, 681, 267–274. [Google Scholar] [CrossRef]
- Hafez, E.M.; Osman, H.S.; Gowayed, S.M.; Okasha, S.A.; Omara, A.E.-D.; Sami, R.; El-Monem, A.M.A.; El-Razek, U.A.A. Minimizing the Adversely Impacts of Water Deficit and Soil Salinity on Maize Growth and Productivity in Response to the Application of Plant Growth-Promoting Rhizobacteria and Silica Nanoparticles. Agronomy 2021, 11, 676. [Google Scholar] [CrossRef]
- Zhang, X.; Zhou, J.; Guan, T.; Cai, W.; Jiang, L.; Lai, L.; Gao, N.; Zheng, Y. Spatial variation in leaf nutrient traits of dominant desert riparian plant species in an arid inland river basin of China. Ecol. Evol. 2019, 9, 1523–1531. [Google Scholar] [CrossRef] [PubMed]
- Luo, W.; Zuo, X.; Ma, W.; Xu, C.; Li, A.; Yu, Q.; Knapp, A.K.; Tognetti, R.; Dijkstra, F.A.; Li, M.H.; et al. Differential responses of canopy nutrients to experimental drought along a natural aridity gradient. Ecology 2018, 99, 2230–2239. [Google Scholar] [CrossRef] [PubMed]
- Bennett, J.A.; Klironomos, J. Mechanisms of plant-soil feedback: Interactions among biotic and abiotic drivers. New Phytol. 2018, 222, 91–96. [Google Scholar] [CrossRef] [PubMed] [Green Version]
- Fang, Z.; Li, D.D.; Jiao, F.; Yao, J.; Du, H.T. The latitudinal patterns of leaf and soil C:N: P stoichiometry in the Loess Plateau of China. Front. Plant Sci. 2019, 10, 85. [Google Scholar] [CrossRef] [Green Version]
- Liu, X.; Ma, Z.; Huang, X.; Li, L. How does grazing exclusion influence plant productivity and community structure in alpine grasslands of the Qinghai-Tibetan Plateau? Glob. Ecol. Conserv. 2020, 23, e01066. [Google Scholar] [CrossRef]
- Sardans, J.; Penuelas, J. The role of plants in the effects of global change on nutrient availability and stoichiometry in the plant-soil system. Plant Physiol. 2012, 160, 1741–1761. [Google Scholar] [CrossRef] [Green Version]
- Ågren, G.I.; Weih, M. Plant stoichiometry at different scales: Element concentration patterns reflect environment more than genotype. New Phytol. 2012, 194, 944–952. [Google Scholar] [CrossRef]
- Elser, J.J.; Bracken, M.E.S.; Cleland, E.E.; Gruner, D.S.; Harpole, W.S.; Hillebrand, H.; Ngai, J.T.; Seabloom, E.W.; Shurin, J.B.; Smith, J.E. Global analysis of nitrogen and phosphorus limitation of primary producers in freshwater, marine and terrestrial ecosystems. Ecol. Lett. 2007, 10, 1135–1142. [Google Scholar] [CrossRef] [Green Version]
- Koerselman, W.; Meuleman, A.F.M. The vegetation N:P ratio: A new tool to detect the nature of nutrient limitation. J. Appl. Ecol. 1996, 33, 1441–1450. [Google Scholar] [CrossRef]
- Zhang, J.; Wang, Y.; Cai, C. Multielemental Stoichiometry in Plant Organs: A Case Study With the Alpine Herb Gentiana rigescens Across Southwest China. Front. Plant Sci. 2020, 11, 441. [Google Scholar] [CrossRef]
- Zheng, K.; Zhou, W.J.; Ying, P.J.; Cheng, H.; Zhang, X.L.; Huang, F.Q.; Li, F.M.; Ye, J.S. Impacts of climate change and human activities on grassland vegetation variation in the Chinese Loess Plateau. Sci. Total Environ. 2019, 660, 236–244. [Google Scholar] [CrossRef] [PubMed]
- Wang, J.; Wang, K.; Zhang, M.; Zhang, C. Impacts of climate change and human activities on vegetation cover in hilly southern China. Ecol. Eng. 2015, 81, 451–461. [Google Scholar] [CrossRef]
- Chen, T.; Tang, G.; Yuan, Y.; Guo, H.; Chen, X. Unraveling the relative impacts of climate change and human activities on grassland productivity in Central Asia over last three decades. Sci. Total Environ. 2020, 743, 140649. [Google Scholar] [CrossRef]
- Santos, F.; Abney, R.; Barnes, M.; Bogie, N.; Ghezzehei, T.A.; Jin, L.; Moreland, K.; Sulman, B.N.; Berhe, A.A. The role of the physical properties of soil in determining biogeochemical responses to soil warming. Ecosyst. Conseq. Soil Warm. 2019, 209–244. [Google Scholar]
- Wang, H.; Liu, S.; Schindlbacher, A.; Wang, J.; Yang, Y.; Song, Z.; You, Y.; Shi, Z.; Li, Z.; Chen, L.; et al. Experimental warming reduced topsoil carbon content and increased soil bacterial diversity in a subtropical planted forest. Soil Biol. Biochem. 2019, 133, 155–164. [Google Scholar] [CrossRef]
- Hou, E.; Chen, C.; Luo, Y.; Zhou, G.; Kuang, Y.; Zhang, Y.; Heenan, M.; Lu, X.; Wen, D. Effects of climate on soil phosphorus cycle and availability in natural terrestrial ecosystems. Glob. Chang. Biol. 2018, 24, 3344–3356. [Google Scholar] [CrossRef] [Green Version]
- Wang, R.; Creamer, C.A.; Wang, X.; He, P.; Xu, Z.; Jiang, Y. The effects of a 9-year nitrogen and water addition on soil aggregate phosphorus and sulfur availability in a semi-arid grassland. Ecol. Indic. 2016, 61, 806–814. [Google Scholar] [CrossRef] [Green Version]
- Tian, D.; Yan, Z.B.; Niklas, K.J.; Han, W.X.; Kattge, J.; Reich, P.B.; Luo, Y.K.; Chen, Y.H.; Tang, Z.Y.; Hu, H.F.; et al. Global leaf nitrogen and phosphorus stoichiometry and their scaling exponent. Natl. Sci. Rev. 2018, 5, 723–739. [Google Scholar] [CrossRef] [Green Version]
- Yan, Z.; Han, W.; Peñuelas, J.; Sardans, J.; Elser, J.J.; Du, E.; Reich, P.B.; Fang, J.Y. Phosphorus accumulates faster than nitrogen globally in freshwater ecosystems under anthropogenic impacts. Ecol. Lett. 2016, 19, 1237–1246. [Google Scholar] [CrossRef]
- Yan, Z.; Tian, D.; Han, W.; Tang, Z.; Fang, J. An assessment on the uncertainty of the nitrogen to phosphorus ratio as a threshold for nutrient limitation in plants. Ann. Bot. 2017, 120, 937–942. [Google Scholar] [CrossRef] [PubMed]
- Smith, M.D.; Wilcox, K.R.; Power, S.A.; Tissue, D.T.; Knapp, A.K. Assessing community and ecosystem sensitivity to climate change-toward a more comparative approach. J. Veg. Sci. 2017, 28, 235–237. [Google Scholar] [CrossRef] [Green Version]
- Hou, S.L.; Yin, J.X.; Sistla, S.; Yang, J.J.; Sun, Y.; Li, Y.Y.; Lü, X.T.; Han, X.G. Long-term mowing did not alter the impacts of nitrogen deposition on litter quality in a temperate steppe. Ecol. Eng. 2017, 102, 404–410. [Google Scholar] [CrossRef]
- Liu, J.; Gou, X.; Zhang, F.; Bian, R.; Yin, D. Spatial patterns in the C:N: P stoichiometry in Qinghai spruce and the soil across the Qilian Mountains, China. Catena 2021, 196, 104814. [Google Scholar] [CrossRef]
- Delgado-Baquerizo, M.; Maestre, F.; Gallardo, A.; Bowker, M.A.; Wallenstein, M.D.; Quero, J.L.; Ochoa, V.; Gozalo, B.; García-Gómez, M.; Soliveres, S.; et al. Decoupling of soil nutrient cycles as a function of aridity in global drylands. Nature 2013, 502, 672–676. [Google Scholar] [CrossRef] [PubMed]
- Wang, X.G.; Lü, X.T.; Dijkstra, F.A.; Zhang, H.Y.; Wang, X.B.; Wuyunna; Wang, Z.W.; Feng, J.; Han, X.G. Changes of plant N:P stoichiometry across a 3000-km aridity transect in grasslands of northern China. Plant Soil 2019, 443, 107–119. [Google Scholar] [CrossRef]
- Williamson, T.J.; Cross, W.F.; Benstead, J.P.; Gíslason, G.M.; Hood, J.M.; Huryn, A.D.; Johnson, P.W.; Welter, J.R. Warming alters coupled carbon and nutrient cycles in experimental streams. Glob. Change Biol. 2016, 22, 2152–2164. [Google Scholar] [CrossRef] [PubMed] [Green Version]
- Mooshammer, M.; Hofhansl, F.; Frank, A.H.; Wanek, W.; Hämmerle, I.; Leitner, S.; Schnecker, J.; Wild, B.; Watzka, M.; Keiblinger, K.M.; et al. Decoupling of microbial carbon, nitrogen, and phosphorus cycling in response to extreme temperature events. Sci. Adv. 2017, 3, e1602781. [Google Scholar] [CrossRef] [Green Version]
- Salazar, P.C.; Navarro-Cerrillo, R.M.; Grados, N.; Cruz, G.; Barrón, V.; Vallar, R. Leaf nutrients in Prosopis pallida are determined by soil chemical attributes under eutric conditions in a dryland forest. Trees 2021, 35, 375–386. [Google Scholar] [CrossRef]
- Tang, Z.; Xu, W.; Zhou, G.; Bai, Y.; Li, J.; Tang, X.; Chen, D.; Liu, Q.; Ma, W.; Xiong, G.; et al. Patterns of plant carbon, nitrogen, and phosphorus concentration in relation to productivity in China’s terrestrial ecosystems. Proc. Natl. Acad. Sci. USA 2018, 115, 4033–4038. [Google Scholar] [CrossRef] [Green Version]
- Zhang, J.; Zhao, N.; Liu, C.; Yang, H.; Li, M.; Yu, G.; Wilcox, K.; Yu, Q.; He, N. C:N:P stoichiometry in China’s forests: From organs to ecosystems. Funct. Ecol. 2018, 32, 50–60. [Google Scholar] [CrossRef]
- Zhang, A.; Li, X.; Wu, S.; Li, L.; Jiang, Y.; Wang, R.; Ahmed, Z.; Zeng, F.; Lin, L.; Li, L. Spatial pattern of C:N:P stoichiometry characteristics of alpine grassland in the Altunshan Nature Reserve at North Qinghai-Tibet Plateau. Catena 2021, 207, 105691. [Google Scholar] [CrossRef]
- Wang, Z.; Wu, Z.; Wang, Y.; Yu, D. Variations in species-level n:p stoichiometry of charophytes and aquatic angiosperms on the Tibetan Plateau. Front. Plant Sci. 2018, 9, 870. [Google Scholar] [CrossRef]
- Li, L.; Liu, B.; Gao, X.; Li, X.; Li, C. Nitrogen and phosphorus addition differentially affect plant ecological stoichiometry in desert grassland. Sci. Rep. 2019, 9, 18673. [Google Scholar] [CrossRef]
- Huang, J.; Yu, H.; Dai, A.; Wei, Y.; Kang, L. Drylands face potential threat under 2 ° C global warming target. Nat. Clim. Change 2017, 7, 417–422. [Google Scholar] [CrossRef]
- Abbott, B.W.; Bishop, K.; Zarnetske, J.P.; Minaudo, C.; Pinay, G. Human domination of the global water cycle absent from depictions and perceptions. Nat. Geosci. 2019, 12, 533–540. [Google Scholar] [CrossRef]
- Reich, P.B.; Oleksyn, J. Global patterns of plant leaf N and P in relation to temperature and latitude. Proc. Natl. Acad. Sci. USA 2004, 30, 11001–11006. [Google Scholar] [CrossRef] [Green Version]
- Gong, Y.; Ling, H.; Chen, Y.; Cao, J.; Guo, Z.; Lv, G. N:P stoichiometric changes via species turnover in arid versus saline desert environments. Ecol. Evol. 2020, 10, 6635–6645. [Google Scholar] [CrossRef]
- Ling, W.; Wang, X.; Wu, W.; Liu, L. Spatial Differences of the Variations of Vegetation Coverage in Mt.Kalamaili Ungulate Nature Reserve during 1990–2014. J. Northwest For. Univ. 2016, 31, 227–232. (In Chinese) [Google Scholar]
- United States Department of Agriculture. Keys to Soil Taxonomy; United States Government Printing Office: Washington, DC, USA, 2014.
- Wang, L.J.; Sun, D.Y.; Zhao, C.Y.; Li, J.Y.; Sheng, Y. Plant architecture characteristics of Haloxylon ammodendron and Haloxylon persicum in Zhungar Basin. Acta Ecol. Sin. 2011, 31, 4952–4960. (In Chinese) [Google Scholar]
- Gerasimova, M. Chinese soil taxonomy: Between the American and the international classification systems. Eurasian Soil Sci. 2010, 43, 945–949. [Google Scholar] [CrossRef]
- Zhang, J.; Yan, X.; Su, F.; Li, Z.; Wang, Y.; Wei, Y.; Ji, Y.; Yang, Y.; Zhou, X.; Guo, H.; et al. Long-term N and P additions alter the scaling of plant nitrogen to phosphorus in a Tibetan alpine meadow. Sci. Total Environ. 2018, 625, 440–448. [Google Scholar] [CrossRef]
- Aerts, R.; Chapin, F.S., III. The Mineral Nutrition of Wild Plants Revisited: A Re-evaluation of Processes and Patterns. Ecol. Res. 2000, 30, 1–67. [Google Scholar]
- John, M.K. Colorimetric determination of phosphorus in soil and plant materials with ascorbic acid. Soil Sci. 1970, 109, 214–220. [Google Scholar] [CrossRef]
- Muthulingam, U.; Thangavel, S. Density, diversity and richness of woody plants in urban green spaces: A case study in Chennai metropolitan city. Urban For. Urban Green. 2012, 11, 450–459. [Google Scholar] [CrossRef]
- Menge, D.N.L.; MacPherson, A.C.; Bytnerowicz, T.A.; Quebbeman, A.W.; Schwartz, N.B.; Taylor, B.N.; Wolf, A.A. Logarithmic scales in ecological data presentation may cause misinterpretation. Nat. Ecol. Evol. 2018, 2, 1393–1402. [Google Scholar] [CrossRef] [PubMed]
- Du, E.; Terrer, C.; Pellegrini, A.F.A.; Ahlström, A.; van Lissa, C.J.; Zhao, X.; Xia, N.; Wu, X.; Jackson, R.B. Global patterns of terrestrial nitrogen and phosphorus limitation. Nat. Geosci. 2020, 13, 221–226. [Google Scholar] [CrossRef]
- Deng, Q.; Hui, D.; Dennis, S.; Reddy, K.C. Responses of terrestrial ecosystem phosphorus cycling to nitrogen addition: A meta-analysis. Glob. Ecol. Biogeogr. 2017, 26, 713–728. [Google Scholar] [CrossRef]
- Hedin, L.O. Global organization of terrestrial plant-nutrient interactions. Proc. Natl. Acad. Sci. USA 2004, 101, 10849–10850. [Google Scholar] [CrossRef] [Green Version]
- Chaves, M.M.; Flexas, J.; Pinheiro, C. Photosynthesis under drought and salt stress: Regulation mechanisms from whole plant to cell. Ann. Bot. 2009, 103, 551–560. [Google Scholar] [CrossRef] [Green Version]
- Matzek, V.; Vitousek, P.M. N:P stoichiometry and protein: RNA ratios in vascular plants: An evaluation of the growth-rate hypothesis. Ecol. Lett. 2009, 12, 765–771. [Google Scholar] [CrossRef]
- Harpole, W.S.; Ngai, J.T.; Cleland, E.E.; Seabloom, E.W.; Borer, E.T.; Bracken, M.E.S.; Elser, J.J.; Gruner, D.S.; Hillebrand, H.; Shurin, J.B.; et al. Nutrient co-limitation of primary producer communities. Ecol. Lett. 2011, 14, 852–862. [Google Scholar] [CrossRef]
- Lü, X.T.; Reed, S.; Yu, Q.; He, N.P.; Wang, Z.W.; Han, X.G. Convergent responses of nitrogen and phosphorus resorption to nitrogen inputs in a semiarid grassland. Glob. Chang. Biol. 2013, 19, 2775–2784. [Google Scholar] [CrossRef] [PubMed]
- He, M.; Song, X.; Tian, F.; Zhang, K.; Zhang, Z.; Chen, N.; Li, X. Divergent variations in concentrations of chemical elements among shrub organs in a temperate desert. Sci. Rep. 2016, 6, 20124. [Google Scholar] [CrossRef] [Green Version]
- Fernández-Martínez, M.; Vicca, S.; Janssens, I.A.; Sardans, J.; Luyssaert, S.; Campioli, M.; Chapin III, F.S.; Ciais, P.; Malhi, Y.; Obersteiner, M.; et al. Nutrient availability as the key regulator of global forest carbon balance. Nat. Clim. Chang. 2014, 4, 471–476. [Google Scholar] [CrossRef] [Green Version]
- Wieder, W.R.; Cleveland, C.C.; Smith, W.K.; Todd-Brown, K. Future productivity and carbon storage limited by terrestrial nutrient availability. Nat. Geosci. 2015, 8, 441–445. [Google Scholar] [CrossRef]
- Bista, D.R.; Heckathorn, S.A.; Jayawardena, D.M.; Mishra, S.; Boldt, J.K. Effects of Drought on Nutrient Uptake and the Levels of Nutrient-Uptake Proteins in Roots of Drought-Sensitive and-Tolerant Grasses. Plants 2018, 7, 28. [Google Scholar] [CrossRef] [Green Version]
- Varela, M.C.; Arslan, I.; Reginato, M.A.; Cenzano, A.M.; Luna, M.V. Phenolic compounds as indicators of drought resistance in shrubs from Patagonian shrublands (Argentina). Plant Physiol. Biochem. 2016, 104, 81–91. [Google Scholar] [CrossRef]
- Forni, C.; Duca, D.; Glick, B.R. Mechanisms of plant response to salt and drought stress and their alteration by rhizobacteria. Plant Soil 2017, 410, 335–356. [Google Scholar] [CrossRef]
- Habermann, E.; Dias de Oliveira, E.A.; Contin, D.R.; Delvecchio, G.; Viciedo, D.O.; de Moraes, M.A.; de Mello Prado, R.; de Pinho Costa, K.A.; Braga, M.R.; Martinez, C.A. Warming and water deficit impact leaf photosynthesis and decrease forage quality and digestibility of a C4 tropical grass. Physiol. Plant. 2019, 165, 383–402. [Google Scholar] [CrossRef] [PubMed]
- Bünemann, E.K. Assessment of gross and net mineralization rates of soil organic phosphorus-A review. Soil Biol. Biochem. 2015, 89, 82–98. [Google Scholar] [CrossRef]
- Sanaullah, M.; Rumpel, C.; Charrier, X.; Chabbi, A. How does drought stress influence the decomposition of plant litter with contrasting quality in a grassland ecosystem? Plant Soil 2012, 352, 277–288. [Google Scholar] [CrossRef]
- Nunes, A.; Kobel, M.; Pinho, P.; Matos, P.; Bello, F.; Correia, O.; Branquinho, C. Which plant traits respond to aridity? A critical step to assess functional diversity in Mediterranean drylands. Agric. For. Meteorol. 2017, 239, 176–184. [Google Scholar] [CrossRef]
- Palo, F.D.; Fornara, D.A. Plant and soil nutrient stoichiometry along primary ecological successions: Is there any link? PLoS ONE 2017, 12, e0182569. [Google Scholar]
- Vico, G.; Thompson, S.E.; Manzoni, S.; Molini, A.; Albertson, J.D.; Almeida-Cortez, J.S.; Fay, P.A.; Feng, X.; Guswa, A.J.; Liu, H.; et al. Climatic, ecophysiological, and phenological controls on plant ecohydrological strategies in seasonally dry ecosystems. Ecohydrology 2015, 8, 660–681. [Google Scholar] [CrossRef] [Green Version]
- Rawat, M.; Arunachalam, K.; Arunachalam, A.; Alatalo, J.; Pandey, R. Associations of plant functional diversity with carbon accumulation in a temperate forest ecosystem in the Indian Himalayas. Ecol. Indic. 2019, 98, 861–868. [Google Scholar] [CrossRef]
- Singh, D.K.; Sale, P.W.G.; Pallachy, C.K.; McKenzie, B.M. Phosphorus concentrations in the leaves of defoliated white clover affect abscisic acid formation and transpiration in drying soil. New Phytol. 2000, 146, 249–259. [Google Scholar] [CrossRef]
- Jones, C.A.; Jacobsen, J.S.; Wraith, J.M. Response of malt barley to phosphorus fertilization under drought conditions. J. Plant Nutr. 2005, 28, 1605–1617. [Google Scholar] [CrossRef]
- Waraich, E.A.; Ahmad, R.; Ullah, S.; Ashraf, M.Y. Role of mineral nutrition in alleviation of drought stress in plants. Aust. J. Crop Sci. 2011, 5, 764–777. [Google Scholar]
- Wang, L.L.; Zhao, G.X.; Li, M.; Zhang, M.T.; Zhang, L.F.; Zhang, X.F.; An, L.Z.; Xu, S.J. C:N:P stoichiometry and leaf traits of halophytes in an arid saline environment, Northwest China. PLoS ONE 2015, 10, e0119935. [Google Scholar] [CrossRef] [PubMed] [Green Version]
- Gong, Y.; Lv, G.; Guo, Z.; Chen, Y.; Cao, J. Influence of aridity and salinity on plant nutrients scales up from species to community level in a desert ecosystem. Sci. Rep. 2017, 7, 6811. [Google Scholar] [CrossRef] [Green Version]
- Lu, Y.; Lei, J.Q.; Zeng, F.J.; Zhang, B.; Liu, B. Effect of NaCl-induced changes in growth, photosynthetic characteristics, water status and enzymatic antioxidant system of Calligonum caput-medusae seedlings. Photosynthetica 2017, 55, 96–106. [Google Scholar] [CrossRef]
- Pilon-Smits, E.A.; Quinn, C.F.; Tapken, W.; Malagoli, M.; Schiavon, M. Physiological functions of beneficial elements. Curr. Opin. Plant Biol. 2009, 12, 267–274. [Google Scholar] [CrossRef] [PubMed]
- Yong, Y.H.; Zhang, X.; Wang, S.M.; Wu, L. Salt accumulation in vegetative organs and ecological stoichiometry characteristics in typical halophytes in Xinjiang, China. Chin. J. Plant Ecol. 2016, 40, 1267–1275. (In Chinese) [Google Scholar]
- Feng, J.; Turner, B.L.; Lü, X.T.; Chen, Z.H.; Wei, K.; Tian, J.H.; Wang, C.; Luo, W.T.; Chen, L.J. Phosphorus transformations along a large-scale climosequence in arid and semiarid grasslands of northern China. Glob. Biogeochem. Cycles 2016, 30, 1264–1275. [Google Scholar] [CrossRef] [Green Version]
- Von Tucher, S.; Hörndl, D.; Schmidhalter, U. Interaction of soil pH and phosphorus efficacy: Long-term effects of P fertilizer and lime applications on wheat, barley, and sugar beet. Ambio 2018, 47, 41–49. [Google Scholar] [CrossRef] [Green Version]
- Rong, Q.Q.; Liu, J.T.; Cai, Y.P.; Lu, Z.H.; Zhao, Z.Z.; Yue, W.C.; Xia, J.B. Leaf carbon, nitrogen and phosphorus stoichiometry of Tamarix chinensis Lour. in the Laizhou Bay coastal wetland, China. Ecol. Eng. 2015, 76, 57–65. [Google Scholar] [CrossRef]
- Volf, M.; Redmond, C.; Albert, Á.J.; Bagousse-Pinguet, Y.L.; Biella, P.; Götzenberger, L.; Hrázský, Z.; Janeček, Š.; Klimešová, J.; Lepš, J.; et al. Effects of long–and short–term management on the functional structure of meadows through species turnover and intraspecific trait variability. Oecologia 2016, 180, 941–950. [Google Scholar] [CrossRef] [PubMed]
- Abbas, M.; Ebeling, A.; Oelmann, Y.; Ptacnik, R.; Roscher, C.; Weigelt, A.; Weisser, W.W.; Wilcke, W.; Hillebrand, H. Biodiversity Effects on Plant Stoichiometry. PLoS ONE 2013, 8, e58179. [Google Scholar] [CrossRef] [PubMed] [Green Version]
- Lü, X.T.; Hu, Y.Y.; Zhang, H.Y.; Wei, H.W.; Hou, S.L.; Yang, G.J.; Liu, Z.Y.; Wang, X.B. Intraspecific variation drives community-level stoichiometric responses to nitrogen and water enrichment in a temperate steppe. Plant Soil 2018, 423, 307–315. [Google Scholar] [CrossRef]
Publisher’s Note: MDPI stays neutral with regard to jurisdictional claims in published maps and institutional affiliations. |
© 2022 by the authors. Licensee MDPI, Basel, Switzerland. This article is an open access article distributed under the terms and conditions of the Creative Commons Attribution (CC BY) license (https://creativecommons.org/licenses/by/4.0/).