Article

A Study on the Vulnerability of the Gross Primary Production of Rubber Plantations to Regional Short-Term Flash Drought over Hainan Island

1
Development Research Center, National Forestry and Grassland Administration, Beijing 100714, China
2
Ecology and Environment College, Hainan University, Haikou 570208, China
3
Hainan Provincial Ecological and Environmental Monitoring Centre, Haikou 571126, China
4
School of Water Conservancy and Electric Power, Heilongjiang University, Harbin 150080, China
5
Danzhou Investigation & Experiment Station of Tropical Crops, Ministry of Agriculture, Rubber Research Institute, Chinese Academy of Tropical Agricultural Sciences, Danzhou 571737, China
*
Author to whom correspondence should be addressed.
Forests 2022, 13(6), 893; https://doi.org/10.3390/f13060893
Submission received: 2 May 2022 / Revised: 6 June 2022 / Accepted: 6 June 2022 / Published: 8 June 2022
(This article belongs to the Section Natural Hazards and Risk Management)

Abstract

:
Rapidly developing droughts, including flash droughts, have occurred frequently in recent years, causing significant damage to agroforestry ecosystems, and they are expected to increase in the future due to global warming. The artificial forest area in China is the largest in the world, and its carbon budget is crucial to the global carbon sink. As the most prominent plantation plant in the tropics, the rubber (Hevea brasiliensis (Willd. ex A. Juss.) Muell. Arg.) ecosystem not only has important economic significance, but also has the potential to be a major natural carbon sink in hot areas. Frequent drought events have a significant impact on rubber ecosystem productivity, yet there have been few reports on the vulnerability of rubber productivity to drought. The objective of this study is to evaluate the vulnerability of rubber ecosystem gross primary production (GPP) to short-term flash drought (STFD) in Hainan Island, utilizing the localized EC-LUE model (eddy covariance–light use efficiency) validated by flux tower observations as the research tool to conduct the scenario simulations which defined by standard relative humidity index (SRHI), in a total of 96 scenarios (timing × intensity). The results show that, in terms of time, the rubber ecosystem in Hainan Island has the highest vulnerability to STFD during the early rainy season and the lowest at the end of the rainy season. From the dry season to the rainy season, the impact of STFD gradually extends to the northeast. Spatially, the vulnerability of the northern island is higher than that of the southern island and that of the western part is higher than that of eastern Hainan Island. With the increase in STFD intensity, the spatial distribution center of the vulnerability of rubber ecosystem GPP in Hainan Island gradually moves southward. The spatiotemporal pattern of the vulnerability of the rubber ecosystem GPP to STFD over Hainan Island plotted by this study is expected to provide decision makers with more accurate information on the prevention and control of drought disaster risk in rubber ecosystems.

1. Introduction

Plantations are rapidly growing global carbon sinks [1], and rubber (Hevea brasiliensis (Willd. ex A. Juss.) Muell. Arg.) forests, which produce strategic commodities, are among the most important planted ecosystems. The rubber plantation area in Hainan Island accounts for approximately half of the total rubber plantation area in China [2] and is an important carbon sink growing point in the tropical climate zone [3]. However, in recent years, drought events have occurred frequently and intensified [4,5,6,7], which has a serious impact on even-aged pure rubber plantations [8,9].
Research on rubber plantations and drought has been carried out for many years [10,11,12,13], and the scientific findings obtained are relatively rich. The research has mostly been from a macro perspective, showing the effects of meteorological drought caused by abnormal climatic factors on rubber yield [12,13,14]; or from the perspective of biodiversity—the improvement of the drought resistance of rubber ecosystem through reasonable collocation of understory planting structure [15]. At the molecular biological scale, research on the drought tolerance and drought resistance genes of Hevea brasiliensis [10,16] have been reported. In addition, research on the causes of drought in the rubber ecosystem [17] and the mechanisms of drought resistance [9] are considered in depth, and systematic progress has been made. However, there are few findings on the vulnerability of rubber ecosystems to drought [18,19]. The term vulnerability refers to the frangible nature of a system threatened by different disasters [20] with different intensities and duration. Vulnerability can provide a basis framework for the causes of drought influences from the point of view of society, the economy, and the environment [21], helping us to understand where is susceptible to drought and when [22,23], and it is the basis for conducting disaster risk assessments. For providing effective, targeted solutions to drought [23,24,25] and formulating drought mitigation measures [26], the management of rubber plantations is inseparable from the mastery and understanding of vulnerability characteristics. Thus far, assessing vulnerability to drought on a regional scale has been a great challenge. However, remote sensing (RS) techniques are appropriate tools to analyze rubber ecosystems in Hainan Island, because they are statistically reliable, operationally robust, and economically cost-effective [25]. RS-based LUE (light use efficiency) models are powerful instruments for characterizing vegetation behavior under drought conditions on a regional scale [27]. Accordingly, the eddy covariance–light use efficiency (EC-LUE) [28] one of RS-based LUE models, is used to evaluate the drought vulnerability of rubber plantations distributed across Hainan Island. Terrestrial gross primary production (GPP), which is defined as the amount of carbon uptake through photosynthesis at the ecosystem scale [29], is the start point of the terrestrial biogeochemical cycle and, thus, serves as the energy that are required for almost all ecosystem processes. Therefore, GPP, which is closed to the water cycle, is an important biophysical parameter for ecosystem that plays a key role in evaluating the response to drought [30,31]. Since the characteristics of drought are complex, in order to accurately grasp the impact of drought, many types of drought have been established [32], e.g., meteorological drought, hydrological drought, agricultural drought, ecological drought etc.. To quantitatively reveal the impact of drought, various criteria and indexes have also been proposed [33,34,35]. Long-term monitoring [36], RS techniques [35,37,38] and a large number of models and tools [23] have been developed to assist researchers with in-depth drought research. In recent years, a new type of drought, flash drought, has become a hot topic in current research [39]. Compared with classic droughts, flash droughts have remarkably rapid onset [40], but the scientific community has not yet agreed on a definition [39], and the essential causes of flash droughts have not been directly proved. The earliest research on flash droughts began in North America, where it was found that a flash drought of any type is caused by a rapid loss of soil moisture, and most likely to occur during the growth period of crops [40,41,42]. A study focused on China indicated that the number of flash droughts had an increasing trend, and that they were more likely to occur in humid and sub-humid regions [43]. In addition, according to the latest research results [44,45,46], soil moisture in arid and semi-arid areas is the dominant water factor that limit plant growth, while in low latitudes like Hainan Island and humid areas, atmospheric water demand is the dominant factor limiting plant growth. Therefore, Standardized relative humidity index (SRHI), which is calculated by atmospheric relative humidity, has been selected as the index to evaluate drought level in this study. Rubber plantations are mostly managed manually, and irrigation and other interventions will be carried out to mitigate water stress when flash droughts have a significant influence; therefore, the present study only focuses on short-term flash drought (STFD) events that are more likely to affect the rubber ecosystem in Hainan Island, and aims to define such droughts according to the atmospheric water demand.
In this study, vulnerability is defined as the rate of the loss of GPP compared to the optimal GPP, which is under the conditions of drought at a monthly scale. For STFD events, they are established by utilizing SRHI and historical climate data to gather multi-scenario input from various intensity gradients in different months. The EC-LUE model is used to quantify the rubber ecosystem GPP under different drought scenarios in order to draw a vulnerability curve of drought and GPP and to explore the spatiotemporal patterns of the vulnerability of rubber ecosystem GPP in Hainan Island and its formation mechanism. The objectives of this study are to: (1) optimize the free parameters of the EC-LUE model for the rubber forest ecosystem; (2) evaluate the impacts of various STFD scenarios on rubber forest ecosystem on the basis of atmospheric water demand; (3) figure out the spatio-temporal distribution pattern rules of vulnerability of GPP of rubber plantations to STFDs.

2. Materials and Methods

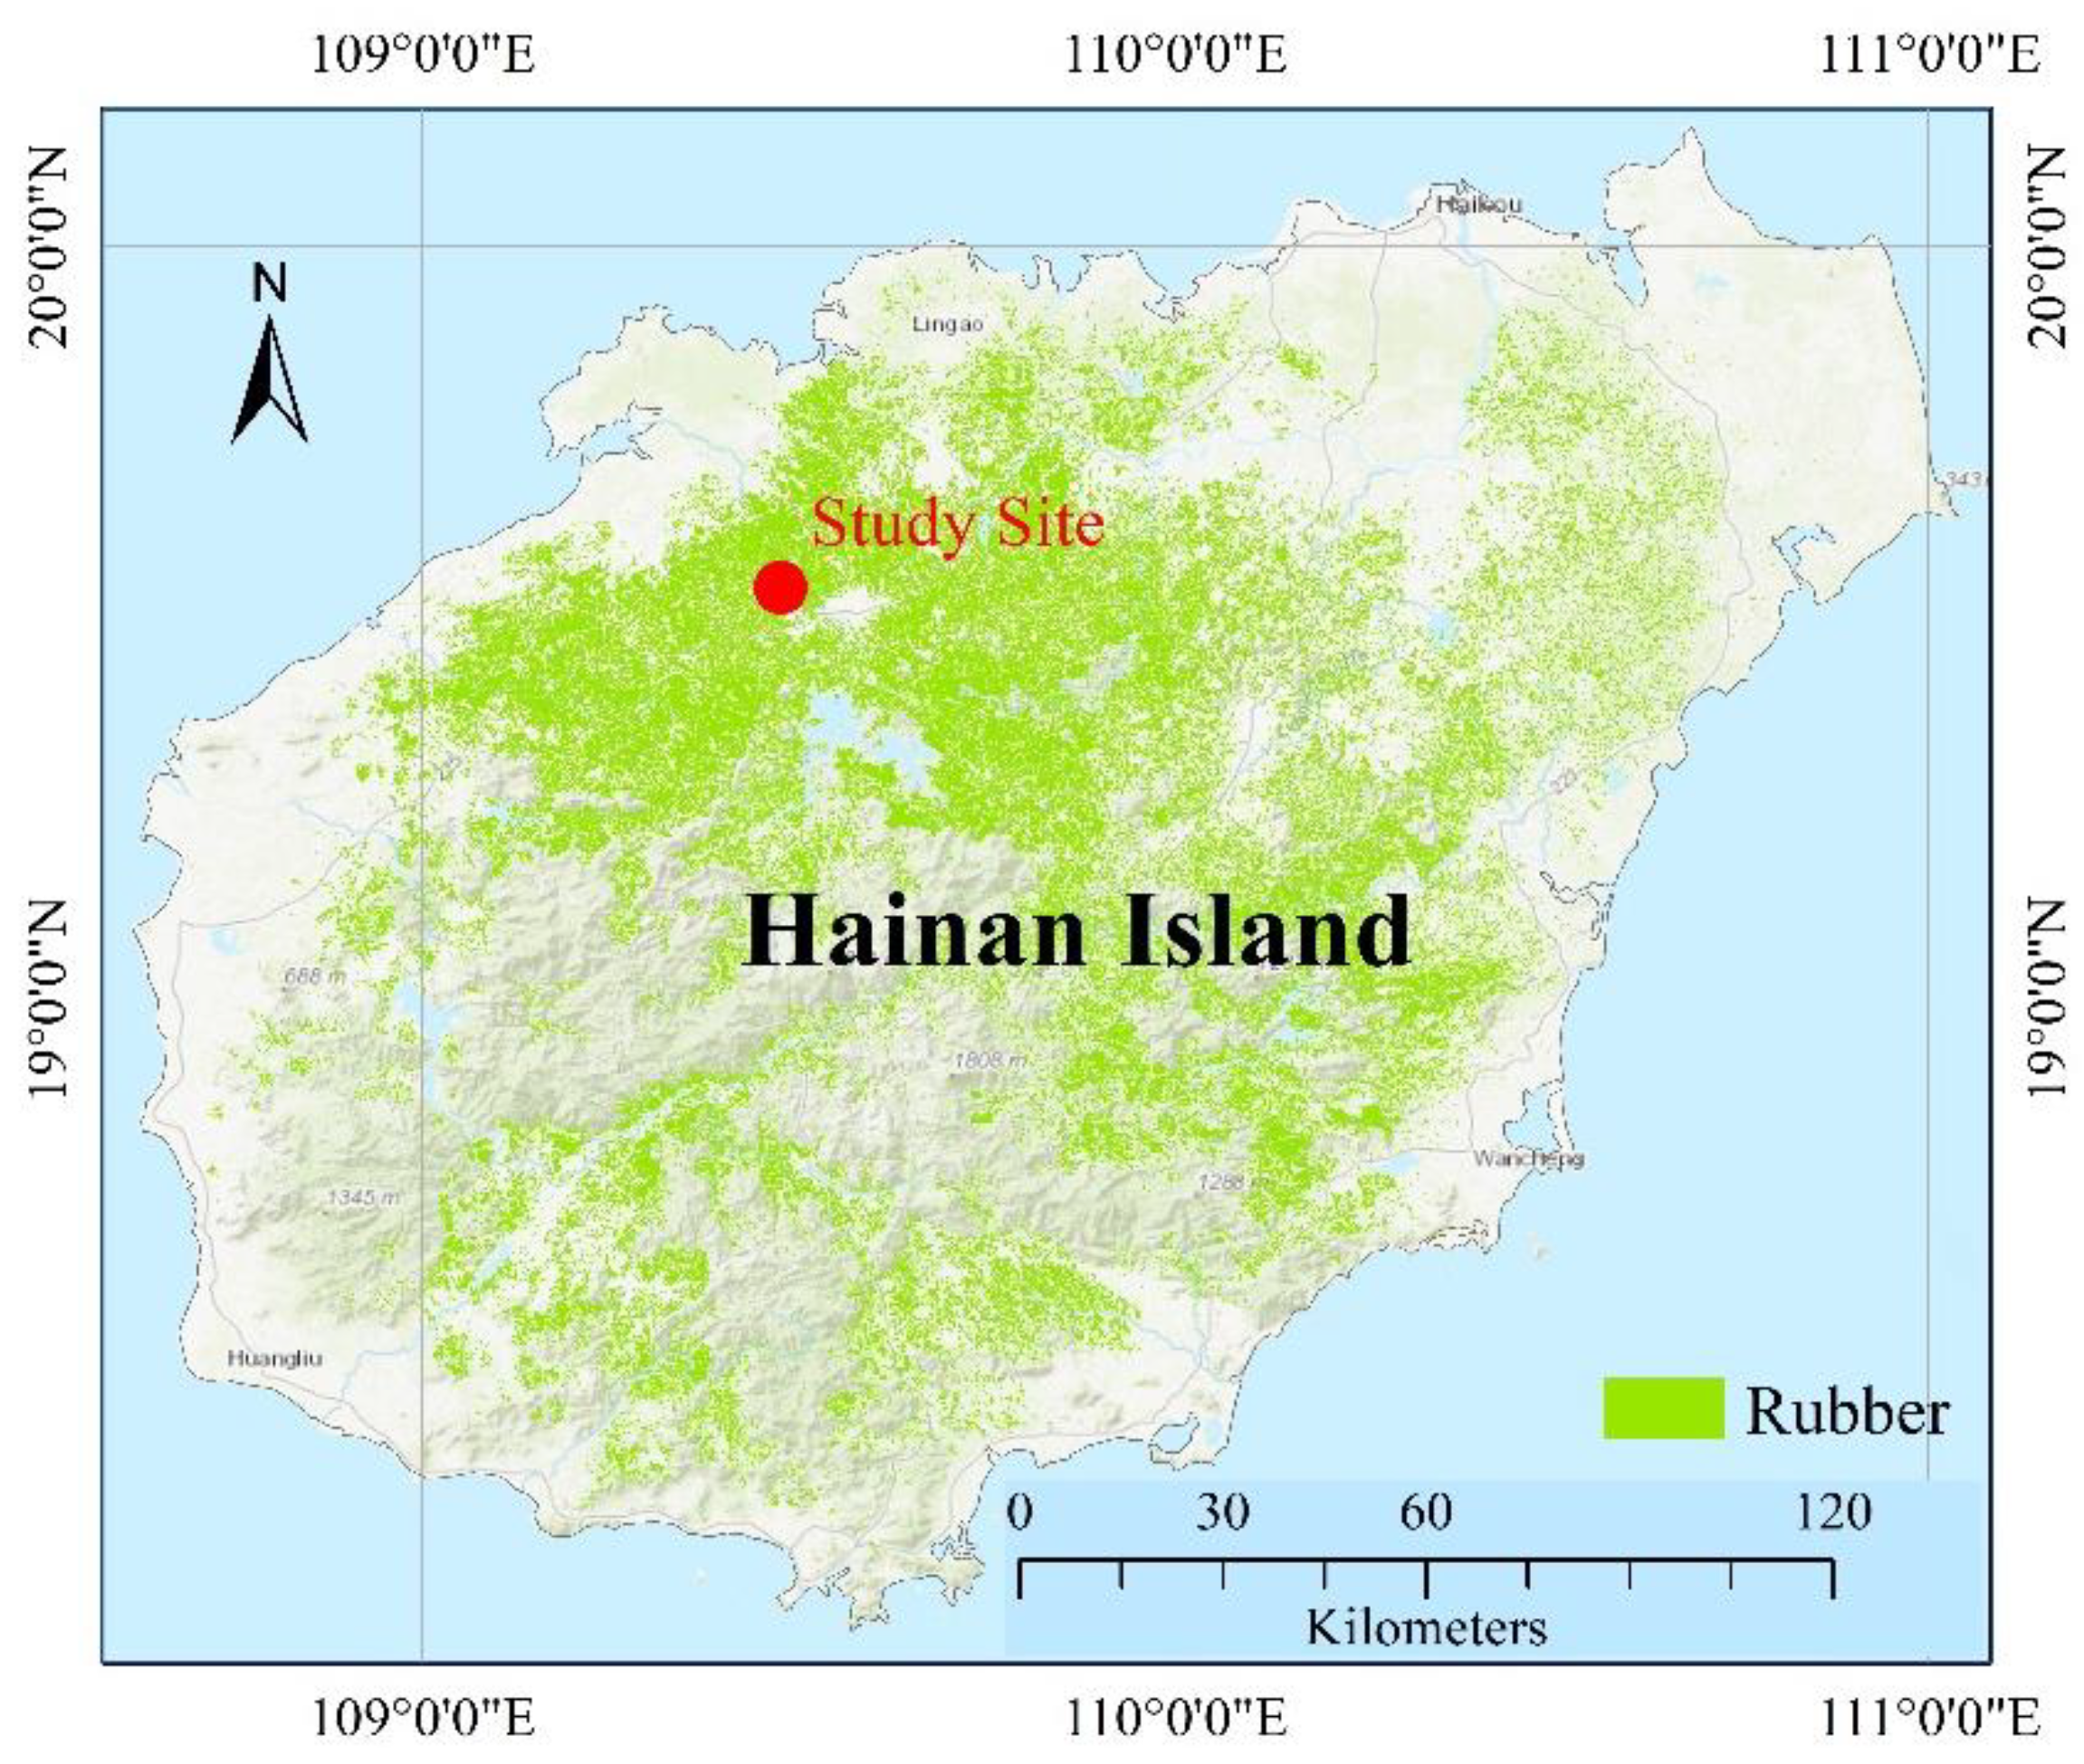
2.1. Study Area and Site

Hainan Island (18°10′–20°10′ N, 108°37′–111°03′ E) is located in Southern China with a total area of about 34,000 km2. It has a tropical monsoon climate, warm and humid year-round, with abundant precipitation ranging from 1000 to 2600 mm yearly and an average temperature of 22–26 °C. Rainy and dry seasons are clearly separated, with the dry season occurring from November to April with only 10–30% of the total annual precipitation (about 140 mm), and the rainy season from May to October with precipitation of about 1500 mm. The rubber plantation area in Hainan Island was stable around 2010, with no large-scale expansion and deforestation, accounting for about 20% of the total area of Hainan Island. The plantations are found on the plateaus surrounding the central mountainous zone and are concentrated in the northern island with the total area of 7269.88km2(Figure 1).
The site, Danzhou Investigative and Experimental Station of Tropical Crops (19°32′47″ N, 109°28′30″ E), is in a rubber-dominated area and has an altitude of 114 m and flat terrain. The rubber plantation has a simple vegetation structure, with a planting density of 3 m × 7 m. For the rubber ecosystem, the upper layer is the arbor layer of the rubber forest with a canopy height of about 16 m, and the lower layer is mostly an annual herb layer with a height of about 0.5 m. There is a 50 m tower equipped with an open-path eddy covariance (OPEC) and vertical microclimate profile system of the plant canopy, and the plantation has been continuously observed for more than 10 years [47]. The data obtained at this site were used to adjust the GPP estimation model for rubber ecosystems (Section 3.1).

2.2. Data Sources

2.2.1. Atmospheric CO2 Concentration Data

The CO2 fertilization effect was calculated by the atmospheric CO2 concentration from Carbon Tracker CT2019B [48], which is a database of the global monthly continuous spatial CO2 concentration from 2000 to 2019 (http://carbontracker.noaa.gov, accessed on 7 April 2022). Since the area of Hainan Island is smaller than one pixel of CT2019B (0.5° × 0.5°), we only used one-pixel value to run the model. The atmospheric CO2 concentration shows a continuous seasonal increase; for this study, the monthly average value from 2001 to 2019 was used as the driving data, in order to avoid the offsetting effect of different atmospheric CO2 concentrations on drought.

2.2.2. Climatic Data

For the estimation of GPP in rubber plantations over Hainan Island, we used input datasets of photosynthetically active radiation (PAR) from the Global Land Surface Satellite (GLASS) product [49] (http://www.glass.umd.edu/index.html, accessed on 7 April 2022), as well as air temperature (Ta) and relative humidity (RH) data from the National Earth System Science Data Center (NESSDC) (http://www.geodata.cn/data/, accessed on 7 April 2022). The spatial resolution of PAR is 0.05°, and we used the linear interpolation method to obtain the 1 km data. The monthly PAR was calculated by averaging daily values. Ta and RH were spatially downscaled to a spatial resolution of 1 km from the reanalysis datasets of ERA-5 [50]; and the temporal step was monthly.

2.2.3. Digital Elevation Model (DEM)

DEM data were downloaded from the Resource and Environment Science and Data Center (RESDC) (https://www.resdc.cn/, accessed on 7 April 2022) at a spatial resolution of 1 km, resampled from the Shuttle Radar Topography Mission (SRTM) 90 m product by the mean value method.

2.2.4. Normalized Difference Vegetation Index (NDVI)

NDVI data from 2001 to 2020 in Hainan Island were downloaded from NASA Earth Data; the product is MOD13A2 (https://doi.org/10.5067/MODIS/MOD13A2.006, accessed on 7 April 2022) [51] at a per-pixel basis at 1 km spatial resolution and 16-day temporal resolution. MOD13A2 chooses the best available pixel value from all the acquisitions from the 16-day period; in this study, the criterion used to calculation monthly value was the maximum value composition (MVC).

2.3. Methods

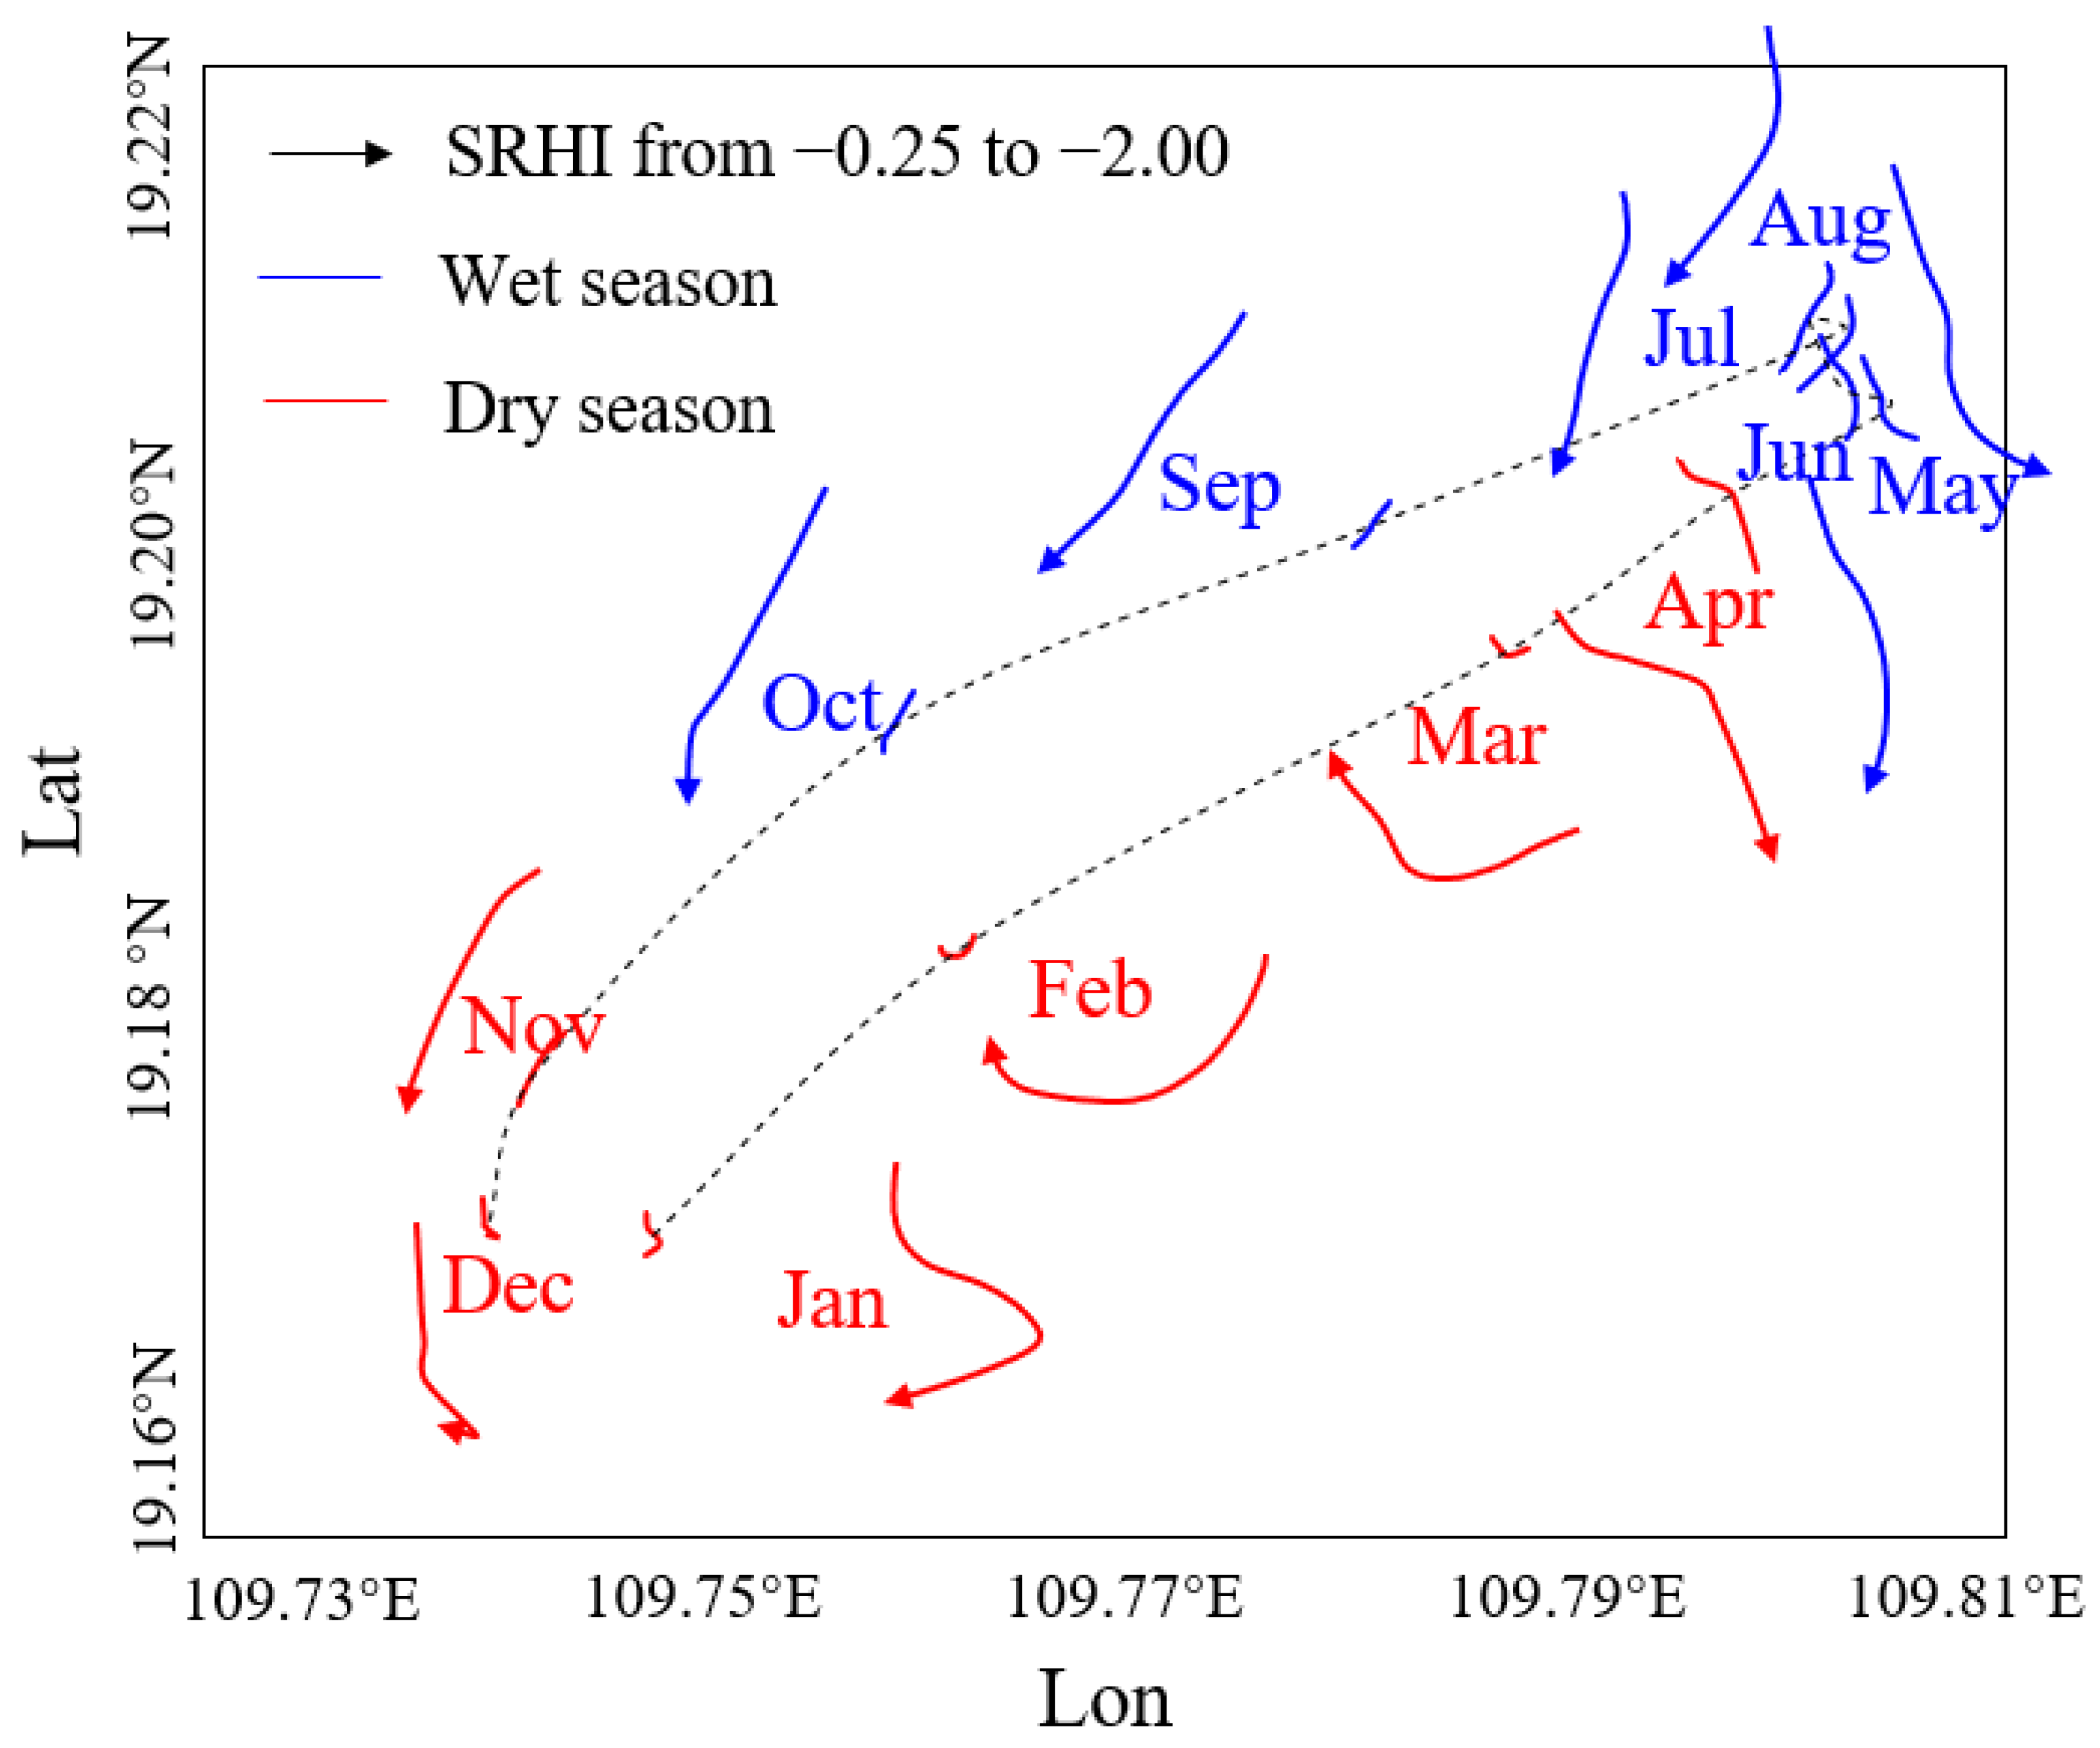
2.3.1. Standardized Relative Humidity Index (SRHI)

For calculating SRHI, we followed the calculation method of standard precipitation index (SPI); Γ distribution was used to normalize the cumulative probability of the relative humidity over a certain period of time (H(rh)). One attractive feature of SRHI is that it can be derived for different time scales such as one, three, or nine months; and the drought is identified by standardizing the cumulative frequency distribution of relative humidity. In this study, we focused on STFD, so SRHI at the one-month scale was selected as the indicator to calculate drought intensity. The calculation formula was based on the following approximation [35,52]:
SRHI = { ( t 2.516 + 0.803 t + 0.01 t 2 1 + 1.433 t + 0.189 t 2 + 0.001 t 3 ) if   0.0 < H ( rh ) 0.5 + ( t 2.516 + 0.803 t + 0.01 t 2 1 + 1.433 t + 0.189 t 2 + 0.001 t 3 ) if   0.5 < H ( rh ) 1.0
t = { ln [ 1 H ( rh ) 2 ] if   0.0 < H ( rh ) 0.5 ln [ 1 ( 1 H ( rh ) ) 2 ] if   0.5 < H ( rh ) 1.0
where H(rh) is the cumulative probability of relative humidity during a certain period. When SRHI is negative, that means below-average relative humidity is expected as a measure of dryness.

2.3.2. GPP Estimation Model

The original EC-LUE (Eddy Covariance Light Use Efficiency) model, belonging to the LUE model, was developed by Yuan et al. in 2007 [28] and is driven by inputting NDVI, PAR, air temperature, and the Bowen ratio. However, in this study, we used the revised EC-LUE model [53] derived by integrating the CO2 fertilization effect on GPP and adding the limit of VPD to GPP. Compared with other LUE models, the LUE calculated from εmax (the maximum LUE) is only limited by the most limiting factor between air temperature and the atmospheric water demand according to Liebig’s law. The model estimates terrestrial ecosystem GPP as follows:
GPP = PAR × fPAR × ε max × C s × min ( T s , W s )
where PAR is the incident photosynthetically active radiation (MJ m-2 day-1); fPAR is the fraction of PAR absorbed by plant canopy; εmax is the maximum LUE; and Cs, Ts, and Ws are the regulation scalars for the CO2 fertilization effect, the limitations from air temperature, and the atmospheric water demand on LUE, respectively.
In EC-LUE, fPAR is calculated by a linear equation that describes the relationship with NDVI established by a set of empirical constants [28]:
fPAR = 1.24 × NDVI 0.168
For Cs,
C s = C i Γ * C i + 2 Γ *
where Ci is the intercellular concentration of CO2 (ppm); Γ* is the CO2 compensation point in the absence of dark respiration (ppm) depending on temperature. Bernacchi et al. (2001) estimated Γ* through a biochemical rate parameter as follows:
Γ * = 4.22 × e 37830 × ( T a 298.15 ) 298.15 RT a
where R is the molar gas constant (8.314 J mol-1 K−1), Ta is the air temperature (K), and 4.22 Pa is the photorespiratory point at 25 °C.
Ci is calculated through the ratio of leaf internal to ambient CO2 (χ) as follows:
C i = C a × χ
where χ depends on Ta and VPD as follows:
χ = γ γ + VPD ,   where   γ = 356.51 K 1.6 η *
where η* is the viscosity of water as a function of Ta; K is the Michaelis–Menten coefficient of Rubisco, calculated as follows:
K = K c ( 1 + P o K o )  
K c = 39.97 × e 79.43 × ( T a 298.15 ) 298.15 RT a  
K o = 27480 × e 36.38 × ( T a 298.15 ) 298.15 RT a  
where Kc and Ko are the Michaelis–Menten coefficient of Rubisco for carboxylation and oxygenation, respectively, expressed in partial pressure units; Po is the partial pressure of O2 (ppm); and e is the base of the natural logarithm.
The temperature and water dependency factor are defined by [53] as follows:
T s = ( T a T min ) × ( T a T max ) ( T a T min ) × ( T a T max ) ( T a T opt ) 2
W s = VPD 0 VPD + VPD 0
where Tmin (0 °C), Tmax (40 °C), and Topt (20.33 °C) are the minimum, maximum, and optimum ambient temperature, respectively, for photosynthetic activity. VPD0 is the empirical coefficient of the water demand constraint equation.

2.3.3. Impact of Short-Term Flash Drought on GPP

The loss from optimal GPP was used as the index to evaluate the impact of STFD. The GPP loss of rubber forest ecosystem in Hainan Island was estimated corresponding to various intensities of STFD in different months as drought scenarios. The drought intensity was delineated by SRHI, from –0.25 (light) to –2.00 (extreme) with a step of 0.25, for a total of eight drought levels. There were a total of 96 drought scenarios in the present study.
In the EC-LUE model, RH is not necessary inputting data; we connected RH with the downward-regulation scalars for atmospheric water demand on LUE via VPD. On the one hand, VPD has an effect on the ratio of leaf internal to ambient CO2; on the other hand, VPD directly impacts Ws. We calculated VPD in the same way as Integrated Surface Database Humidity (HadISDH) [54] and the Modern-Era Retrospective analysis for Research and Applications (MERRA) [55] in order to consider RH:
VPD = E s   E a
E a = RH 100 × E s
E s = 6.112 × e 17.67 T a T a + 234.5 × f w
f w = 1 + 7 × 10 4 + 3.46 × 10 6 P
P = atm ( T a + 273.16 T a + 273.16 + 0.0065 × H ) 5.625
where Es and Ea are the saturated vapor pressure and actual vapor pressure (kPa), respectively; Es is a function of Ta adjusted by P, the atmospheric pressure (hPa); atm is standard atmosphere (1013.25 hPa); and H is the altitude (m).
So far, the coupling of drought index, SRHI, and GPP estimating model EC-LUE, has been completed; next an impact assessment of drought was conducted.

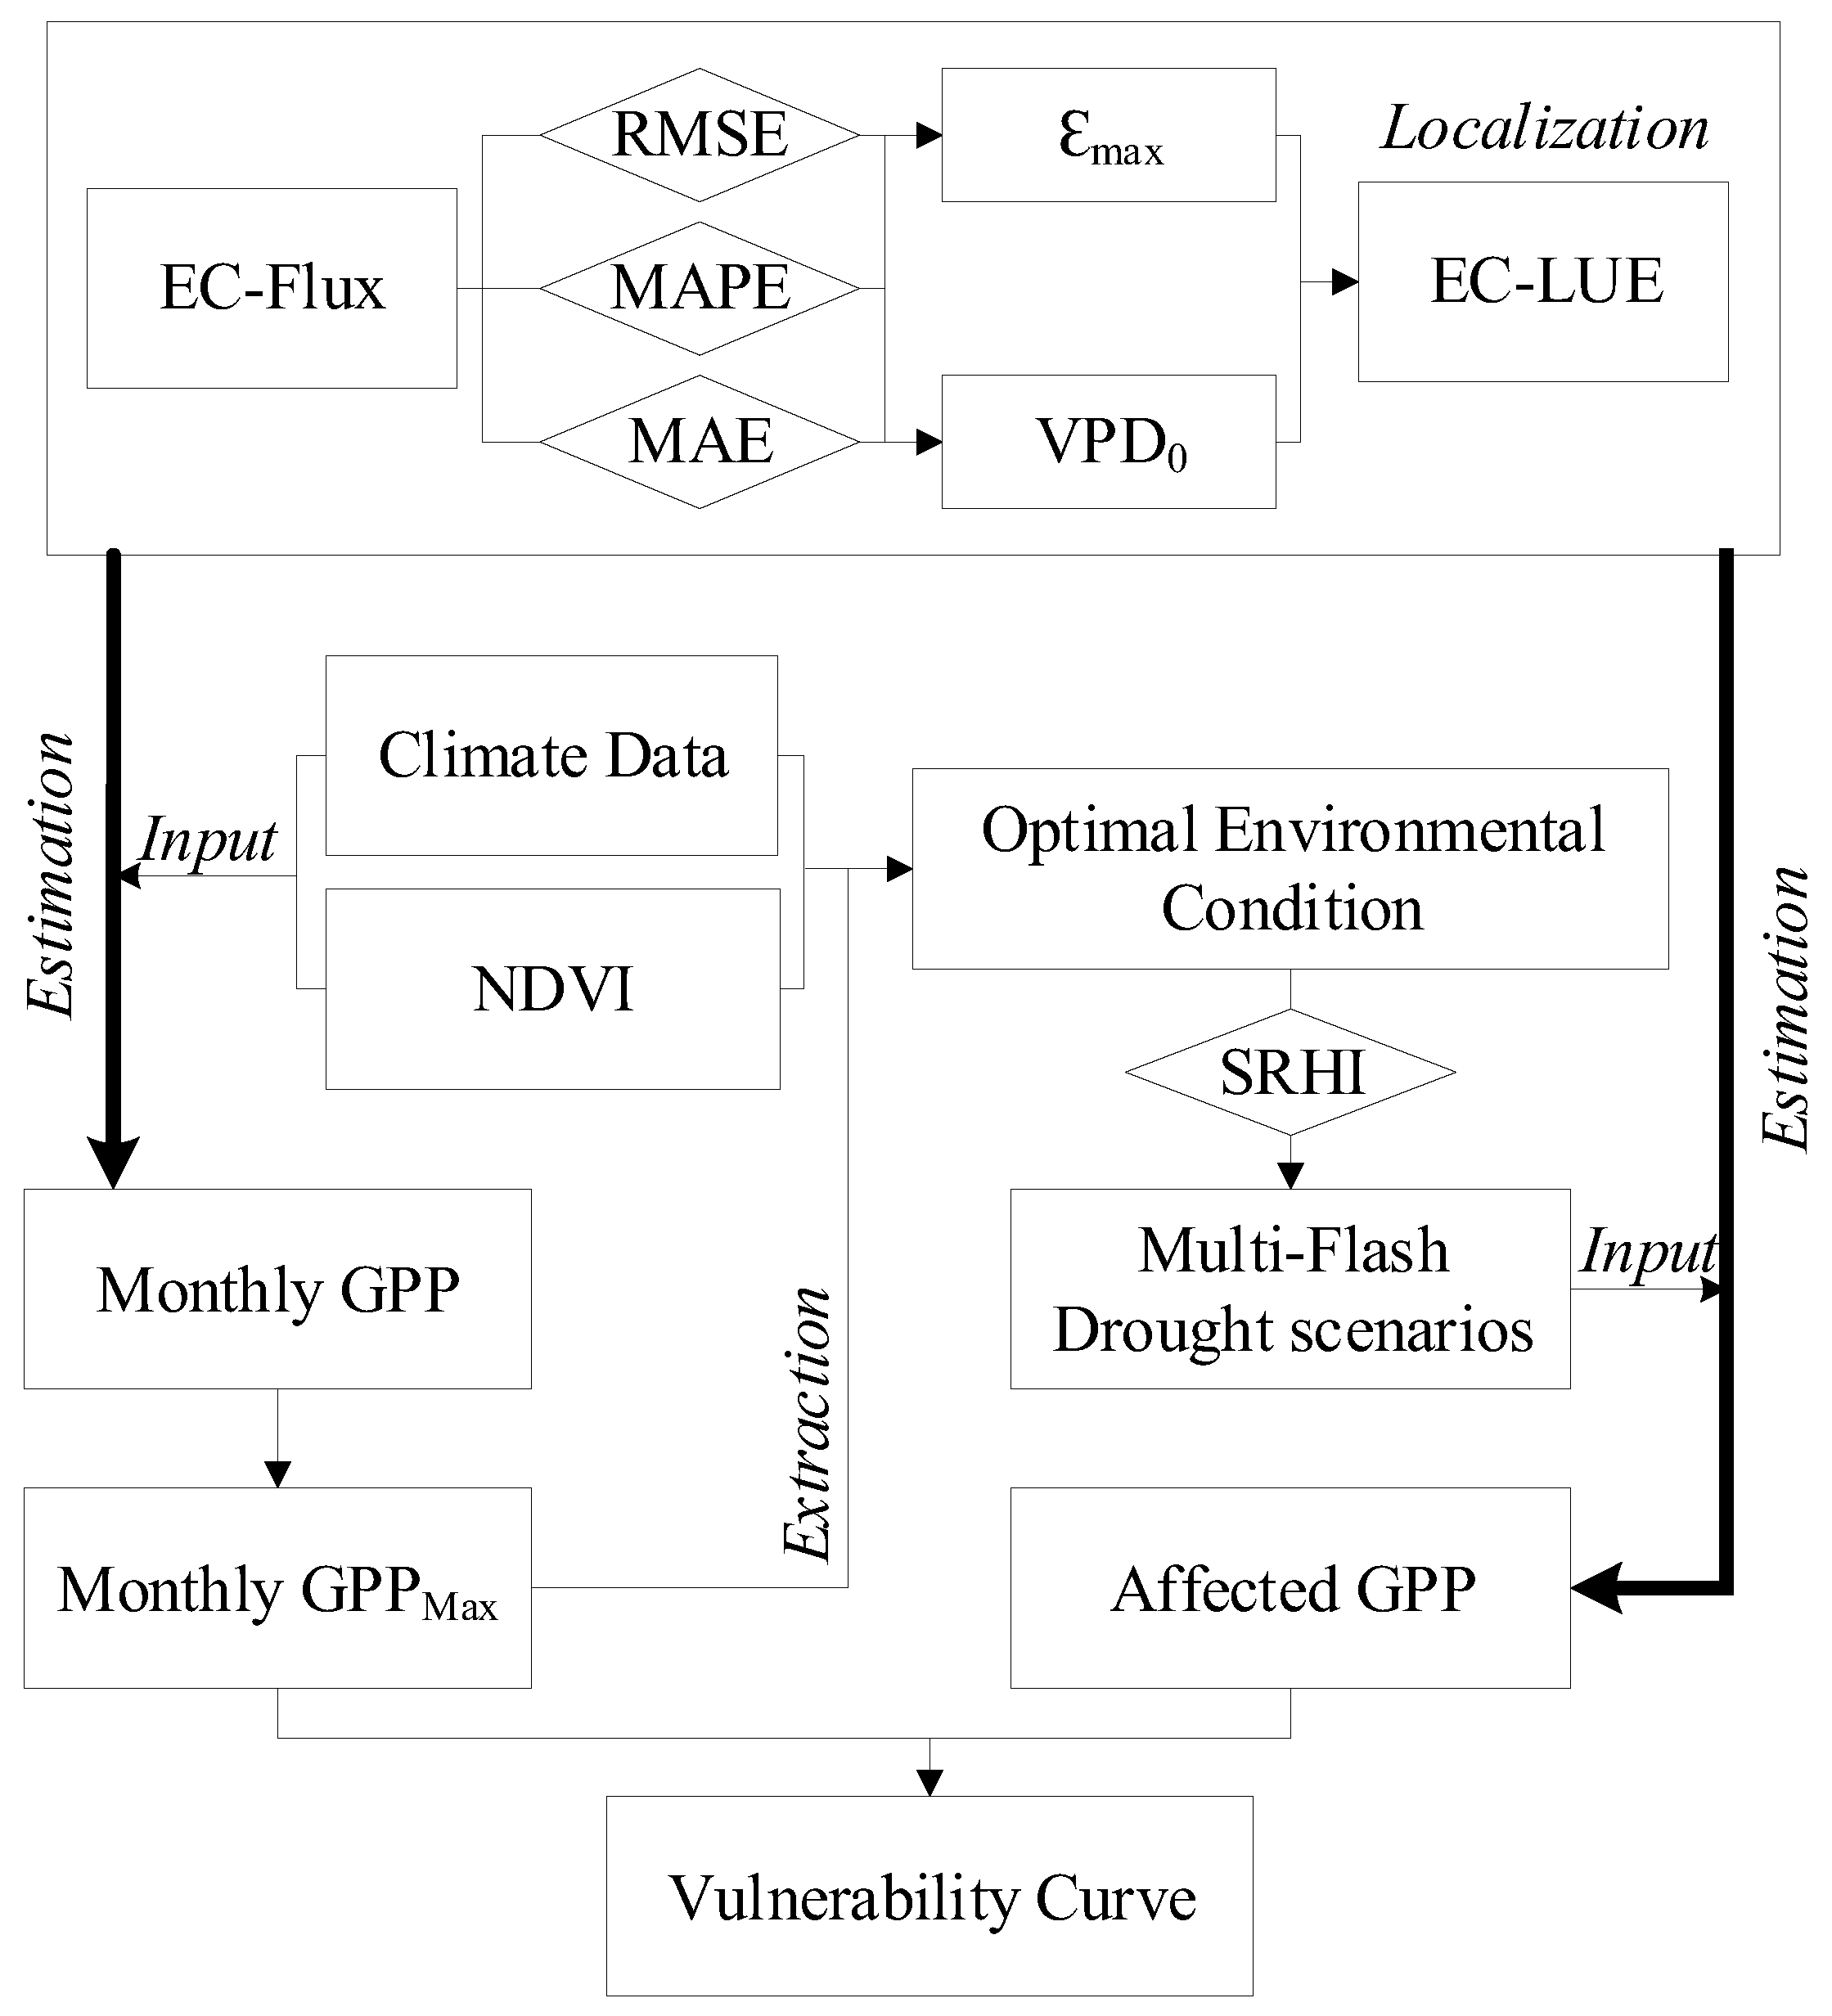
2.3.4. Study Process

Figure 2 shows the study flowchart. Step 1: An EC-LUE model suitable for the natural rubber plantation ecosystem in Hainan Island was localized by utilizing 10 years (2010–2019) of data observed at the Eddy Flux Tower set up in the rubber forest ecosystem to adjust the free parameters (VPD0 and εmax) of EC-LUE. This EC-LUE can be used to estimate GPP in a rubber forest ecosystem. Step 2: The spatial raster climatic data and RS data were used to estimate the monthly GPP of the rubber plantations on Hainan Island from 2001 to 2020 at 1-km resolution by the localized EC-LUE. Step 3: On the basis of step 2, we extracted the largest monthly GPP to make a new composite monthly cycle sequence (the largest January value from 2001 to 2020, the largest February value from 2001 to 2020, and so on), GPPmax. Climatic data from that month in that year corresponding to the maximum GPP were extracted to constitute the optimal climatic conditions for rubber growth in Hainan Island, pixel by pixel. Step 4: We replaced the relative humidity to construct multigradient drought scenarios with different intensity and occurring time (twelve occurring time from January to December multiply eight intensities) on the basis of optimal climatic data. Inputting the drought scenarios data into localized EC-LUE model, we obtained the GPPs corresponding to every drought scenario, and a vulnerability curve was drawn to show the differences between GPPs and GPPmax, pixel by pixel.

3. Results

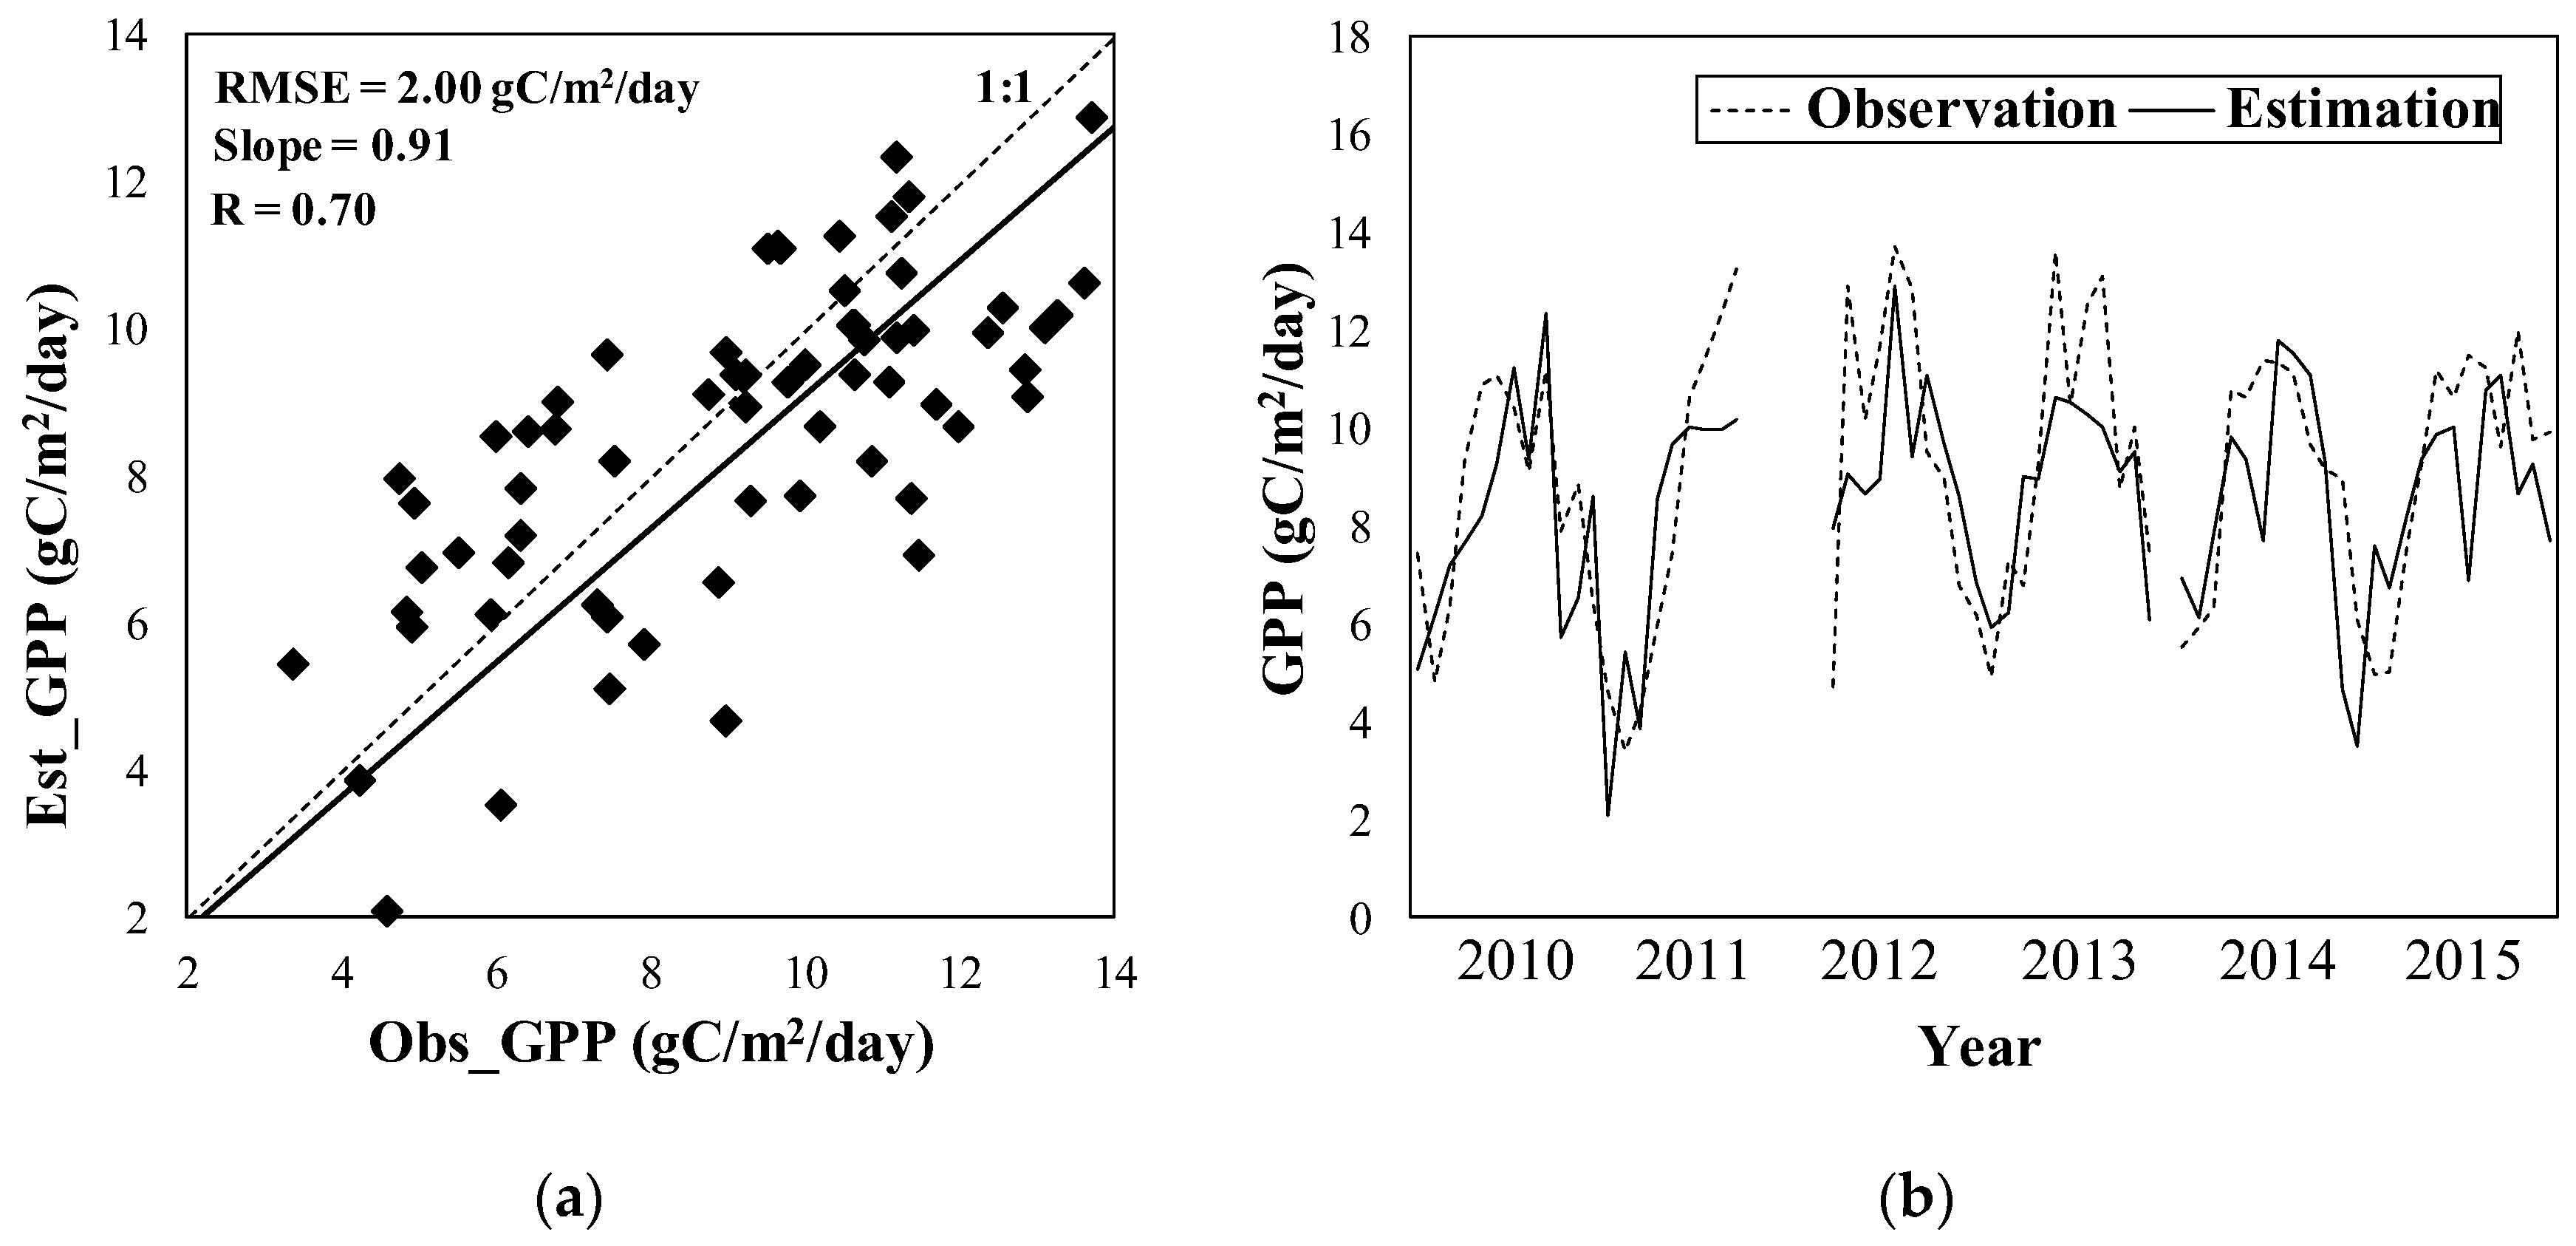
3.1. Model Validation and Parameter Optimization

Figure 3a shows the comparison of monthly GPP estimated by the EC-LUE model with the corresponding tower-based values of 72 months at the rubber ecosystem site. The coefficient of correlations (R) and root-mean-square error (RMSE) of the estimated monthly GPP were 0.70 and 2.00, respectively, indicating the ability of the EC-LUE model to capture variations in monthly GPP across different months. However, this model tended to underestimate high tower-based GPP to some extent during 2012 and 2013 (Figure 3b).
According to [53], we extended the range of two free parameters, VPD0 and εmax, 10% downward and upward, respectively, from the base range covered by all PFTs (Plant functional Types). EC-LUE was conducted by inputting all possible combinations of free parameters, with VPD0 taking a step of 0.01 kPa, and εmax having a 0.01 gC MJ−1 step. The estimated outputs were compared with the tower-based GPP using MAE (mean absolute error), MAPE (mean absolute percentage error), and RMSE; the optimal values were VPD0 = 0.34 kPa and εmax = 2.75 gC MJ−1 (see Figure S2 for detailed information).

3.2. Vulnerability Curves of Rubber Plantations’ GPP to STFDs

The relative loss rate of GPP increases with the intensification of drought, no matter in which month the drought occurs (Figure 4). If the drought occurrence month remains unchanged, the change rate of the GPP loss rate with the increase of drought intensity is most significant in May (–3.46%/SRHI), followed by April (–3.35%/SRHI), June (–3.03%/SRHI), and July (–2.68%/SRHI); the least sensitive one is when drought occurs in September (–1.56%/SRHI), followed by January (–1.96%/SRHI) and December (–1.97%/SRHI). Under the same drought intensity, the relative loss rate of GPP is highest in April, reaching almost 10%, followed by May and June. STFD occurring in September had the least impact on the rubber ecosystem GPP, only 3%. From the shape of the vulnerability curve, an asymmetric bimodal curve with two GPP losing peaks in April and November was formed. Overall, the relative loss of GPP was the highest in the late dry season and the early rainy season; that in the late rainy season and middle of the dry season was the lowest. The absolute loss rate and damaged GPP information can be found in the Supplementary Materials (Figure S4). The vulnerability curves of the two are similar to the relative loss rate vulnerability curve.

3.3. Spatial Pattern of Vulnerability of Rubber Plantation to STFDs

An assessment of the vulnerability of GPP in the Hainan Island rubber ecosystem to STFD indicates that the center of gravity of vulnerability shifts from the southwest to the northeast and then back to the southwest with the month when STFD occurs (natural year from January to December), from a dynamic spatial perspective (Figure 5). The spatial distribution of responses of the rubber ecosystem in Hainan Island to STFD in May to August is similar. The vulnerability of the rubber ecosystem to STFD in February and March moved westward as the drought intensity increased, while for the rest of the months, with the intensification of STFD, the center of gravity of the effects gradually moved southward (the first half of the year is biased to the southeast, and the second half of the year to the southwest).
The extreme and light STFDs occurring in April and September were chosen as example scenarios to analyze the spatial pattern of the vulnerability of rubber ecosystem GPP to STFD, since they are the months when STFD occurred and GPP loss was the greatest or least in terms of the overall numerical performance. The overall pattern (Figure 6) showed that rubber plantations in Northern Hainan Island are more vulnerable to STFD than in the southern part; rubber plantations in Western Hainan Island are more vulnerable to STFD than in the eastern part. The spatial distribution of rubber plantations’ GPP losses caused by STFDs of the same intensity occurring in different months was not consistent. The extreme drought in April had the most significant and spatially contiguous effect on the GPP of rubber plantations in northwestern Hainan Island; the drought of the same intensity that occurred in September had a more obvious effect on the GPP of rubber plantations in the northern part than in other parts of Hainan Island. The effect of the light drought in April on the GPP of rubber plantations in Hainan Island showed a decreasing pattern from northwest to southeast, while the vulnerability of rubber ecosystem GPP to a drought of the same intensity as the one from April but occurring in September had the distribution characteristics of increased vulnerability from northeast to southwest. The effect of STFD in April on the GPP of the rubber ecosystem was more concentrated in spatial pattern than the drought in September.
The GPP losses caused by the light drought in April and the extreme drought in September at rubber plantations in Hainan Island were relatively close in value (0.32 gC/m2/day light STFD in April vs. 0.36 gC/m2/day extreme STFD in September), but the spatial distribution of GPP loss behaved differently (Figure 6). The rubber ecosystem GPP in the northern part, especially the northwestern part, of Hainan Island showed relatively high vulnerability to the light drought in April, while the extreme drought that occurred in September had a greater impact on the central and eastern part of Hainan Island. For the spatial distribution of the vulnerability of the rubber ecosystem in Hainan Island with different STFD intensities and different timing, see the Supplementary Materials.

4. Discussion

4.1. Model Validation and Parameter Optimization

The two free parameters, VPD0 and ɛmax, in the EC-LUE model were selected using the exhaustive method. The exhaustive range is the minimum and maximum values of all PFTs in [53], extended by 10%. The optimal combination of the free parameters is when ɛmax (2.75 gC MJ−1) has a value between DBF (Deciduous broadleaf forest) (2.02 gC MJ−1) and EBF (Evergreen broadleaved forest) (3.92 gC MJ−1); and the VPD0 (0.34 kPa) is also between that of DBF (0.54 kPa) and EBF (0.29 kPa). Through the numerical analysis of two parameters and two PFTs, the characteristics of the rubber ecosystem are about 60% EBF and 40% DBF. Rubber originated from South America and belongs to EBF [56]. After being introduced to China, rubber showed obvious characteristics of deciduous and leaf-spreading phenology [57]; therefore, it is acceptable that the free parameter of rubber is between EBF and DBF. At the same time, compared with DBF, the deciduous period of rubber in Hainan Island is shorter than two months, and the characteristics of rubber are closer to EBF than DBF, so the values of the free parameters of the rubber ecosystem estimated by this study are very reasonable. On the basis of the optimized free parameters, the EC-CLUE performs well in prediction. Comparing with Observations, through F-test, the estimates by EC-LUE inputting flux tower data can reach the significance level of p < 0.01 with the 99% confidence interval for the regression coefficient of [0.85, 0.97]. It should be noted that the EC-LUE in this will slightly overestimate the GPP.

4.2. Vulnerability of Rubber Ecosystem GPP to STFD

STFD in April led to the highest relative loss in monthly GPP mainly because April is the early part of the rapid rubber-growing season on Hainan Island [57]. The vulnerability of the rubber ecosystem to drought is highest during this period because the trees need to regrow their leaves and the dry season has just ended, depleting the soil and requiring water replenishment [58], thus amplifying the effect of the lack of water. On the contrary, STFD in September causes a lower relative GPP loss, mainly because September is deep into the rainy season so the water shortage in the dry season has been effectively replenished. The water resources in September are extremely abundant and much higher than the available moisture, which is not a dominant limiting factor for rubber growth, even if the RH is much lower than the climatic average. It has also been confirmed by the research on water requirements of rubber trees that, from December to April, the requirements are always larger than the effective precipitation, and the cumulative difference between supply and demand is highest up to April. However, from May, the water demand begins to be less than the effective precipitation, and the difference between requirements and effective precipitation reaches the maximum in September [26]. The relatively low loss in January is mainly due to the fact that rubber in Hainan Island is in the deciduous period from December to January, not during the growing season, and the GPP is very low. Secondly, the fact that the air temperature is lower than the optimal temperature becomes the dominant limiting factor instead of water demand. Regarding on the spatial pattern of vulnerability, except for the earlier period of the dry season (November and December), the dry season is mainly dominated by east-west direction differences, while the rainy season is dominated by north-south differences. This is mainly due to the fact that there is less rainfall in the dry season, so the vulnerability is dominated by the precipitation pattern; while the rainfall in the rainy season is sufficient not a limiting factor, so it is mainly regulated by the temperature distribution pattern [59].
The vulnerability of GPP to STFD in the rubber ecosystem in this study was not severe on the whole; even under extreme SRHI conditions, only a 10% relative GPP loss was generated. The reasons are as follows: first, the limiting of radiation on GPP in the tropical region is more significant than that of moisture and temperature [60]; second, RH and Ta determine VPD jointly in the real world [53], but in this case study Ta was assumed to remain unchanged and only the atmospheric water demand changed, resulting in the interaction between temperature and moisture did not reflect. In EC-LUE, Ta and VPD are the direct limiting factors; the effect of drought from RH on GPP is simulated through VPD, which is also controlled by the unchanged Ta, since the influences of drought have been scaled. Last but not least, in this study, vulnerability was assessed by drought scenarios in which RH was controlled according to the optimal meteorological conditions, but the reduction in RH was calculated through the real value over a historical period. Therefore, using the optimal meteorological scenario as the basis input data for vulnerability assessment, the impact of drought would be lower than the true value, but the relative loss rate of GPP in each drought scenario would not be affected.

4.3. Relative Humidity as the Criterion for Assessing Drought

Soil moisture supply and atmospheric water demand are the dominant factors restricting ecosystem productivity [61]. The atmospheric water vapor content controls vegetation transpiration by regulating stomatal conductance, and it also directly affects the photosynthetic process [62]. Since the amount of rainfall in Hainan Island is sufficient in the rainy season even if the rainfall is much lower than the climatic average, resulting in a meteorological drought, it does not generally develop into an ecological drought. The evapotranspiration in Hainan Island is high throughout the year; the atmospheric water demand directly determines the transpiration rate of plants, which is the most direct cause of plants’ water loss and stomatal closure, leading to carbon starvation [63]. In addition, in the recent scientific debate on whether soil moisture or atmospheric water demand dominates terrestrial ecosystem drought, all agree that herbaceous functional types are more sensitive to soil moisture than woody plants, and low-latitude, wet regions are mainly affected by atmospheric water demand [44,45,46]. Therefore, for the present study, SRHI was selected as the index to measure drought events, and the EC-LUE, including VPD as the water-limiting factor, was selected as the research tool in order to draw more reliable conclusions than when using soil moisture or precipitation indexes. At the same time, SRHI has the same advantages as SPI which is widely used in drought monitoring because of its recognized advantages of simple calculation, flexible time scales [64]. In addition, drought assessment indexes utilizing rainfall, such as SPEI and SPI, may have some limitations in describing the detailed spatiotemporal distribution of drought due to the large temporal variability and spatial heterogeneity of precipitation data at ground-based observations [35]; while relative humidity has better performance in spatial continuity and temporal stability compared with precipitation, and earlier drought detection capacity [65].

4.4. The significant of Short-Term Flash Drought

64The “flash” in STFD refers to the sudden onset of the drought. Rainfall of Hainan Island is plentiful and frequent; just one rainfall event can provide enough water to relieve the water demand due to drought; Therefore, droughts on Hainan Island tend to build rapidly. Intense radiation and high temperature results in strong evapotranspiration, which easily leads to flash drought events. To date, the scientific community has not developed a generally accepted definition of “flash drought” [39,42,66]. According to the review by Lisonbee et al. (2021) [39], there are 20 papers that provided a measurable definition criteria for distinguishing flash drought from other types of drought, and 11 of which defined the flash drought consistent with the definition in this study as a rapid-onset event instead of a short-term [67] or short-lived, yet severe event [68]. In this study, the period before a drought event does not show any sign of drought development, and the RH decreases directly in the month when the drought occurred. Secondly, the “short-term” in STFD means that the drought only lasts for one month; due to the geographical location and climatic conditions, although there are long-term drought records, more short-term droughts occur in Hainan Island. Rubber plantations are mostly artificial economic forests; when drought occurs, management will be implemented and long-term drought will be prevented by irrigation and other measures. Therefore, the impacts of drought on rubber ecosystems are mainly caused by short-term events. Manual intervention, especially irrigation, can interrupt long-term drought events. With the development of agricultural water conservancy facilities, more than 10,000 reservoirs or cisterns have been constructed in Hainan Island. The ability to manage long-term slow-onset drought is getting stronger and stronger. No matter the duration of drought is shortened by human activities, or just natural short-term drought, they are all the targets of this study, because when droughts come to the end, it is the replenishment of water no matter what kind of drought types. Therefore, taking STFD as the research object means this study targets the vulnerability of rubber ecosystems to drought and has more practical significance in Hainan Island.

5. Conclusions

The vulnerability of rubber forest GPP to the same intensity of STFD in the dry season on Hainan Island was lower than that in the rainy season. On the one hand, the growth with higher photosynthesis (more GPP) was mainly concentrated in the rainy season. On the other hand, the temperature limitation control of plant photosynthesis is more difficult in the dry season than in the rainy season, which reduces the sensitivity of the rubber ecosystem to atmospheric water demand. The vulnerability of the rubber ecosystem to STFD is most significant at the beginning of the rainy season, and gradually decreases. The vulnerability of the rubber ecosystem to STFD in the northern part of Hainan Island is higher than that in the southern part, and that in the eastern part is lower than that in the western part, mainly due to the uneven spatial distribution of water resources. It is for the same aforementioned reason that the vulnerability of GPP of the rubber forest ecosystem in Hainan Island gradually increases southward with the intensification of STFD.
The drought scenarios in this study are all obtained by adjusting the optimal climatic conditions, and the results underestimate the vulnerability of GPP to STFD to a certain extent; At the same time, taking the 1-month-scale STFD as the research object will hard to identify the influence of shorter-duration and rapid onset rate drought. We suggest that controlling factors such as anthropogenic irrigation should also be considered in the related studies; it is more instructive for local production practice to carry out the dynamic vulnerability assessment for rubber plantations’ GPP to drought development process using mechanism process-based model with the temporal resolution of days or weeks. Finally, according to the spatiotemporal distribution pattern of the vulnerability of the GPP of rubber plantations to STFD over Hainan Island, at the macro level we suggest that it is better to give priority allocation of water resources to the rubber farmers in Northern part from later period of dry season to early period of wet season, so as to reduce the disaster risk of STFD caused by delay of wet season.

Supplementary Materials

The following supporting information can be downloaded at: https://www.mdpi.com/article/10.3390/f13060893/s1, Figure S1: The monthly averaged GPP and optimal GPP estimates for rubber plantation over Hainan Island from 2001 to 2020; Figure S2: Determination of the optimal parameters for rubber forest ecosystem (MAE: Mean Absolute Error, MAPE: Mean Absolute Percentage Error, RMSE: Root Mean Square Error); Figure S3: Rubber plantation’s annual GPP across different drought intensities under optimal environmental conditions in Hainan Island; Figure S4: Rubber plantation’s GPP loss across different drought intensities under optimal environmental conditions in Hainan Island; Figure S5: Spatial distribution of rubber plantation’s monthly optimal GPP in Hainan Island; Figure S6: Spatial distribution of rubber plantation’s monthly estimated GPP in Hainan Island; Figure S7: Spatial distribution of Rubber plantation’s GPP loss in January under the different drought intensities over Hainan Island; Figure S8: Spatial distribution of Rubber plantation’s GPP loss in February under the different drought intensities over Hainan Island; Figure S9: Spatial distribution of Rubber plantation’s GPP loss in March under the different drought intensities over Hainan Island; Figure S10: Spatial distribution of Rubber plantation’s GPP loss in April under the different drought intensities over Hainan Island; Figure S11: Spatial distribution of Rubber plantation’s GPP loss in May under the different drought intensities over Hainan Island; Figure S12: Spatial distribution of Rubber plantation’s GPP loss in June under the different drought intensities over Hainan Island; Figure S13: Spatial distribution of Rubber plantation’s GPP loss in July under the different drought intensities over Hainan Island; Figure S14: Spatial distribution of Rubber plantation’s GPP loss in August under the different drought intensities over Hainan Island; Figure S15: Spatial distribution of Rubber plantation’s GPP loss in September under the different drought intensities over Hainan Island; Figure S16: Spatial distribution of Rubber plantation’s GPP loss in October under the different drought intensities over Hainan Island; Figure S17: Spatial distribution of Rubber plantation’s GPP loss in November under the different drought intensities over Hainan Island; Figure S18: Spatial distribution of Rubber plantation’s GPP loss in December under the different drought intensities over Hainan Island.

Author Contributions

Conceptualization, W.C. and Z.S.; methodology, W.C. and Z.S.; software, W.C. and Z.S.; validation, L.W., W.C., Y.Z., J.Z., T.N. and Z.S.; formal analysis, L.W. and T.N.; investigation, J.Z. and Y.Z.; resources, L.W., J.Z. and Y.Z.; data curation, L.W., Y.Z., J.Z., T.N. and Z.S.; writing—original draft preparation, W.C.; writing—review and editing, Q.X., W.C., Y.Z., J.Z., T.N., L.W. and Z.S.; visualization, L.W.; supervision, Z.S.; project administration, Z.S.; funding acquisition, Z.S.. All authors have read and agreed to the published version of the manuscript.

Funding

This research was funded by (1) Youth Foundation of the Natural Science Foundation of Hainan Province of China, grant number 320QN202; (2) Fund for Less Developed Regions of the National Natural Science Foundation of China, grant number 32160320; (3) Youth Foundation of the National Natural Science Foundation of China, grant number 42101101.

Data Availability Statement

All data needed to evaluate the conclusions in the paper are present in the paper and/or the Supplementary Materials. Additional data related to this paper may be requested from the Corresponding Author.

Acknowledgments

Acknowledgement for the data of relative humidity, air temperature and DEM support from “National Earth System Science Data Center, National Science & Technology Infrastructure of China. (http://www.geodata.cn, accessed on 7 April 2022)”. This work used EC data acquired and shared by Danzhou Investigation & Experiment Station of Tropical Crops, Ministry of Agriculture, Rubber Research Institute, Chinese Academy of Tropical Agricultural Sciences. CarbonTracker CT2019B results provided by NOAA ESRL, Boulder, Colorado, USA from the website at http://carbontracker.noaa.gov (accessed on 7 April 2022). We also gratefully acknowledge NASA for allowing us to download MODIS NDVI products.

Conflicts of Interest

The authors declare that they have no competing interest.

References

  1. Chen, C.; Park, T.; Wang, X.; Piao, S.; Xu, B.; Chaturvedi, R.K.; Fuchs, R.; Brovkin, V.; Ciais, P.; Fensholt, R. China and India lead in greening of the world through land-use management. Nat. Sustain. 2019, 2, 122–129. [Google Scholar] [CrossRef] [PubMed]
  2. China Statistics Press. Hainan Statistical Yearbook 2021; China Statistics Press: Beijing, China, 2021; pp. 147–156.
  3. Zhou, W.; Zhu, J.; Ji, H.; Grace, J.; Sha, L.; Song, Q.; Liu, Y.; Bai, X.; Lin, Y.; Gao, J. Drivers of difference in CO2 and CH4 emissions between rubber plantation and tropical rainforest soils. Agric. For. Meteorol. 2021, 304, 108391. [Google Scholar] [CrossRef]
  4. Lin, H.; Wang, J.; Li, F.; Xie, Y.; Jiang, C.; Sun, L. Drought trends and the extreme drought frequency and characteristics under climate change based on SPI and HI in the upper and middle reaches of the Huai River Basin, China. Water 2020, 12, 1100. [Google Scholar] [CrossRef] [Green Version]
  5. Cook, E.R.; Seager, R.; Cane, M.A.; Stahle, D.W. North American drought: Reconstructions, causes, and consequences. Earth-Sci. Rev. 2007, 81, 93–134. [Google Scholar] [CrossRef]
  6. Grafton, R.Q.; Pittock, J.; Williams, J.; Jiang, Q.; Possingham, H.; Quiggin, J. Water planning and hydro-climatic change in the Murray-Darling Basin, Australia. Ambio 2014, 43, 1082–1092. [Google Scholar] [CrossRef] [Green Version]
  7. Guo, H.; Bao, A.; Ndayisaba, F.; Liu, T.; Jiapaer, G.; El-Tantawi, A.M.; De Maeyer, P. Space-time characterization of drought events and their impacts on vegetation in Central Asia. J. Hydrol. 2018, 564, 1165–1178. [Google Scholar] [CrossRef]
  8. Zongdao, H.; Yanqing, P. Rubber cultivation under climatic stresses in China. Nat. Rubber: Biol. Cultiv. Technol. 1992, 220–238. [Google Scholar]
  9. Wang, L.-f. Physiological and molecular responses to drought stress in rubber tree (Hevea brasiliensis Muell. Arg.). Plant Physiol. Biochem. 2014, 83, 243–249. [Google Scholar] [CrossRef]
  10. Chandrashekar, T.; Nazeer, M.; Marattukalam, J.; Prakash, G.; Annamalainathan, K.; Thomas, J. An analysis of growth and drought tolerance in rubber during the immature phase in a dry subhumid climate. Exp. Agric. 1998, 34, 287–300. [Google Scholar] [CrossRef]
  11. Falqueto, A.R.; da Silva Júnior, R.A.; Gomes, M.T.G.; Martins, J.P.R.; Silva, D.M.; Partelli, F.L. Effects of drought stress on chlorophyll a fluorescence in two rubber tree clones. Sci. Hortic. 2017, 224, 238–243. [Google Scholar] [CrossRef]
  12. Hailiang, L.; Shengpei, D.; Hongxia, L.; Shichi, L. Spatio-Temporal Change and Factor Analysis of Rubber Plantation Drought Based on Drought Index. J. Basic Sci. Eng. 2017, 25, 1114–1123. [Google Scholar]
  13. Li, H.; Dai, S.; Hu, S.; Tian, G.; Luo, H. Comprehensive monitoring model for agricultural drought and its application based on spatial information. Trans. Chin. Soc. Agric. Eng. (Trans. CSAE) 2012, 28, 181–188. [Google Scholar]
  14. Li, H.; Luo, W.; Li, S.; Liu, H. A Study on Potential Productivity of Natural Rubber in Hainan Province Based on a Net Primary Production Model. Resour. Sci. 2012, 34, 337–344. [Google Scholar]
  15. Clermont-Dauphin, C.; Dissataporn, C.; Suvannang, N.; Pongwichian, P.; Maeght, J.-L.; Hammecker, C.; Jourdan, C. Intercrops improve the drought resistance of young rubber trees. Agron. Sustain. Dev. 2018, 38, 1–10. [Google Scholar] [CrossRef] [Green Version]
  16. Liu, M.; Wang, L.; Ke, Y.; Xian, X.; Wang, J.; Wang, M.; Zhang, Y. Identification of HbHSP90 gene family and characterization HbHSP90. 1 as a candidate gene for stress response in rubber tree. Gene 2022, 146475. [Google Scholar] [CrossRef]
  17. Sopharat, J.; Sdoodee, S.; Tanavud, C.; Gay, F.; Thaler, P. A Simple Water Balance Model of Rubber Tree Plantations Under Different Evaporative Demand Regimes. Advanced Materials Research. 2014, pp. 20–23. Available online: https://ur.booksc.me/book/44402595/e25d0c (accessed on 7 April 2022).
  18. Wang, X.; Blanken, P.D.; Kasemsap, P.; Petchprayoon, P.; Thaler, P.; Nouvellon, Y.; Gay, F.; Chidthaisong, A.; Sanwangsri, M.; Chayawat, C. Carbon and water cycling in two rubber plantations and a natural forest in Mainland Southeast Asia. J. Geophys. Res. Biogeosciences 2022, e2022JG006840. [Google Scholar] [CrossRef]
  19. Hazir, M.H.M.; Kadir, R.A.; Abd Karim, Y. Projections on Future Impact and Vulnerability of Climate Change Towards Rubber Areas in Peninsular Malaysia. IOP Conference Series: Earth and Environmental Science. 2018, p. 012053. Available online: https://iopscience.iop.org/article/10.1088/1755-1315/169/1/012053 (accessed on 7 April 2022).
  20. Liu, X.; Wang, Y.; Peng, J.; Braimoh, A.K.; Yin, H. Assessing vulnerability to drought based on exposure, sensitivity and adaptive capacity: A case study in middle Inner Mongolia of China. Chin. Geogr. Sci. 2013, 23, 13–25. [Google Scholar] [CrossRef]
  21. Jackson, G.; McNamara, K.; Witt, B. A framework for disaster vulnerability in a small island in the Southwest Pacific: A case study of Emae Island, Vanuatu. Int. J. Disaster Risk Sci. 2017, 8, 358–373. [Google Scholar] [CrossRef]
  22. Sun, Z.; Zhang, J.; Zhang, Q.; Hu, Y.; Yan, D.; Wang, C. Integrated risk zoning of drought and waterlogging disasters based on fuzzy comprehensive evaluation in Anhui Province, China. Nat. Hazards 2014, 71, 1639–1657. [Google Scholar] [CrossRef]
  23. Sun, Z.; Zhang, J.; Yan, D.; Wu, L.; Guo, E. The impact of irrigation water supply rate on agricultural drought disaster risk: A case about maize based on EPIC in Baicheng City, China. Nat. Hazards 2015, 78, 23–40. [Google Scholar] [CrossRef]
  24. Hao, Z.; AghaKouchak, A.; Nakhjiri, N.; Farahmand, A. Global integrated drought monitoring and prediction system. Sci. Data 2014, 1, 1–10. [Google Scholar] [CrossRef] [PubMed]
  25. West, H.; Quinn, N.; Horswell, M. Remote sensing for drought monitoring & impact assessment: Progress, past challenges and future opportunities. Remote Sens. Environ. 2019, 232, 111291. [Google Scholar]
  26. Junru, T.; Feng, A.; Guishui, X. Water requirements of rubber trees estimated with CROPWAT model. J. Trop. Biol. 2022, 13, 48–56. [Google Scholar]
  27. Sun, Z.; Wang, X.; Zhang, X.; Tani, H.; Guo, E.; Yin, S.; Zhang, T. Evaluating and comparing remote sensing terrestrial GPP models for their response to climate variability and CO2 trends. Sci. Total Environ. 2019, 668, 696–713. [Google Scholar] [CrossRef]
  28. Yuan, W.; Liu, S.; Zhou, G.; Zhou, G.; Tieszen, L.L.; Baldocchi, D.; Bernhofer, C.; Gholz, H.; Goldstein, A.H.; Goulden, M.L. Deriving a light use efficiency model from eddy covariance flux data for predicting daily gross primary production across biomes. Agric. For. Meteorol. 2007, 143, 189–207. [Google Scholar] [CrossRef] [Green Version]
  29. Beer, C.; Reichstein, M.; Tomelleri, E.; Ciais, P.; Jung, M.; Carvalhais, N.; Rödenbeck, C.; Arain, M.A.; Baldocchi, D.; Bonan, G.B. Terrestrial gross carbon dioxide uptake: Global distribution and covariation with climate. Science 2010, 329, 834–838. [Google Scholar] [CrossRef] [Green Version]
  30. Doughty, C.E.; Metcalfe, D.; Girardin, C.; Amezquita, F.F.; Cabrera, D.G.; Huasco, W.H.; Silva-Espejo, J.; Araujo-Murakami, A.; Da Costa, M.; Rocha, W. Drought impact on forest carbon dynamics and fluxes in Amazonia. Nature 2015, 519, 78–82. [Google Scholar] [CrossRef] [Green Version]
  31. Zhang, Y.; Xiao, X.; Zhou, S.; Ciais, P.; McCarthy, H.; Luo, Y. Canopy and physiological controls of GPP during drought and heat wave. Geophys. Res. Lett. 2016, 43, 3325–3333. [Google Scholar] [CrossRef] [Green Version]
  32. Slette, I.J.; Post, A.K.; Awad, M.; Even, T.; Punzalan, A.; Williams, S.; Smith, M.D.; Knapp, A.K. How ecologists define drought, and why we should do better. Glob. Change Biol. 2019, 25, 3193–3200. [Google Scholar] [CrossRef]
  33. Guttman, N.B. Comparing the palmer drought index and the standardized precipitation index 1. JAWRA J. Am. Water Resour. Assoc. 1998, 34, 113–121. [Google Scholar] [CrossRef]
  34. Yang, J.; Chang, J.; Wang, Y.; Li, Y.; Hu, H.; Chen, Y.; Huang, Q.; Yao, J. Comprehensive drought characteristics analysis based on a nonlinear multivariate drought index. J. Hydrol. 2018, 557, 651–667. [Google Scholar] [CrossRef]
  35. Wu, X.; Wang, P.; Ma, Y.; Gong, Y.; Wu, D.; Yang, J.; Huo, Z. Standardized relative humidity index can be used to identify agricultural drought for summer maize in the Huang-Huai-Hai Plain, China. Ecol. Indic. 2021, 131, 108222. [Google Scholar] [CrossRef]
  36. Zhao, H.; Gao, G.; An, W.; Zou, X.; Li, H.; Hou, M. Timescale differences between SC-PDSI and SPEI for drought monitoring in China. Phys. Chem. Earth Parts A/B/C 2017, 102, 48–58. [Google Scholar] [CrossRef]
  37. Hayes, M.; Svoboda, M.; Le Comte, D.; Redmond, K.T.; Pasteris, P. Drought monitoring: New tools for the 21st century. Drought Water Cris. Sci. Technol. Manag. Issues 2005, 53, 69. [Google Scholar]
  38. Jiao, W.; Tian, C.; Chang, Q.; Novick, K.A.; Wang, L. A new multi-sensor integrated index for drought monitoring. Agric. For. Meteorol. 2019, 268, 74–85. [Google Scholar] [CrossRef] [Green Version]
  39. Lisonbee, J.; Woloszyn, M.; Skumanich, M. Making sense of flash drought: Definitions, indicators, and where we go from here. J. Appl. Serv. Clim. 2021, 2021, 1–19. [Google Scholar] [CrossRef]
  40. Chen, L.G.; Gottschalck, J.; Hartman, A.; Miskus, D.; Tinker, R.; Artusa, A. Flash drought characteristics based on US drought monitor. Atmosphere 2019, 10, 498. [Google Scholar] [CrossRef] [Green Version]
  41. Otkin, J.A.; Anderson, M.C.; Hain, C.; Svoboda, M.; Johnson, D.; Mueller, R.; Tadesse, T.; Wardlow, B.; Brown, J. Assessing the evolution of soil moisture and vegetation conditions during the 2012 United States flash drought. Agric. For. Meteorol. 2016, 218, 230–242. [Google Scholar] [CrossRef] [Green Version]
  42. Christian, J.I.; Basara, J.B.; Otkin, J.A.; Hunt, E.D.; Wakefield, R.A.; Flanagan, P.X.; Xiao, X. A methodology for flash drought identification: Application of flash drought frequency across the United States. J. Hydrometeorol. 2019, 20, 833–846. [Google Scholar] [CrossRef] [Green Version]
  43. Yuan, X.; Wang, L.; Wu, P.; Ji, P.; Sheffield, J.; Zhang, M. Anthropogenic shift towards higher risk of flash drought over China. Nat. Commun. 2019, 10, 1–8. [Google Scholar] [CrossRef] [Green Version]
  44. Liu, L.; Gudmundsson, L.; Hauser, M.; Qin, D.; Li, S.; Seneviratne, S.I. Soil moisture dominates dryness stress on ecosystem production globally. Nat. Commun. 2020, 11, 1–9. [Google Scholar] [CrossRef] [PubMed]
  45. Lu, H.; Qin, Z.; Lin, S.; Chen, X.; Chen, B.; He, B.; Wei, J.; Yuan, W. Large influence of atmospheric vapor pressure deficit on ecosystem production efficiency. Nat. Commun. 2022, 13, 1–4. [Google Scholar] [CrossRef] [PubMed]
  46. Liu, L.; Gudmundsson, L.; Hauser, M.; Seneviratne, S.I. Reply to: Large influence of atmospheric vapor pressure deficit on ecosystem production efficiency. Nat. Commun. 2022, 13, 1654. [Google Scholar] [CrossRef] [PubMed]
  47. Si-wen, G.; Zhi-xiang, W.; ChuanS, Y. Water Vapor Flux Exchange of Rubber Forest Stand in Hainan Danzhou and Its Response to Environmental Factors. J. Northwest For. Univ. 2014, 35, 2099. [Google Scholar]
  48. Jacobson, A.R.; Schuldt, K.N.; Miller, J.B.; Oda, T.; Tans, P.; Andrews, A.; Mund, J.; Ott, L.; Collatz, G.J.; Aalto, T.; et al. Global Monitoring Laboratory. Available online: https://gml.noaa.gov/ccgg/carbontracker/CT2019B/ (accessed on 7 April 2022).
  49. Liang, S.; Cheng, J.; Jia, K.; Jiang, B.; Liu, Q.; Xiao, Z.; Yao, Y.; Yuan, W.; Zhang, X.; Zhao, X. The global land surface satellite (GLASS) product suite. Bull. Am. Meteorol. Soc. 2021, 102, E323–E337. [Google Scholar] [CrossRef]
  50. Jing, W.; Yang, Y.; Yue, X.; Zhao, X. A spatial downscaling algorithm for satellite-based precipitation over the Tibetan plateau based on NDVI, DEM, and land surface temperature. Remote Sens. 2016, 8, 655. [Google Scholar] [CrossRef] [Green Version]
  51. LP DAAC—MOD13A2—USGS. Available online: https://lpdaac.usgs.gov/products/mod13a2v006/ (accessed on 7 April 2022).
  52. Farahmand, A.; AghaKouchak, A. A generalized framework for deriving nonparametric standardized drought indicators. Adv. Water Resour. 2015, 76, 140–145. [Google Scholar] [CrossRef]
  53. Yuan, W.; Zheng, Y.; Piao, S.; Ciais, P.; Lombardozzi, D.; Wang, Y.; Ryu, Y.; Chen, G.; Dong, W.; Hu, Z. Increased atmospheric vapor pressure deficit reduces global vegetation growth. Sci. Adv. 2019, 5, eaax1396. [Google Scholar] [CrossRef] [Green Version]
  54. Willett, K.; Williams, C., Jr.; Dunn, R.; Thorne, P.; Bell, S.; De Podesta, M.; Jones, P.; Parker, D. HadISDH: An updateable land surface specific humidity product for climate monitoring. Clim. Past 2013, 9, 657–677. [Google Scholar] [CrossRef] [Green Version]
  55. MERRA—NASA. Available online: https://gmao.gsfc.nasa.gov/reanalysis/MERRA/ (accessed on 7 April 2022).
  56. Deng, X.; Wang, J.; Li, Y.; Wu, S.; Yang, S.; Chao, J.; Chen, Y.; Zhang, S.; Shi, M.; Tian, W. Comparative transcriptome analysis reveals phytohormone signalings, heat shock module and ROS scavenger mediate the cold-tolerance of rubber tree. Sci. Rep. 2018, 8, 1–16. [Google Scholar] [CrossRef]
  57. Chen, B.; Li, X.; Xiao, X.; Zhao, B.; Dong, J.; Kou, W.; Qin, Y.; Yang, C.; Wu, Z.; Sun, R. Mapping tropical forests and deciduous rubber plantations in Hainan Island, China by integrating PALSAR 25-m and multi-temporal Landsat images. Int. J. Appl. Earth Obs. Geoinf. 2016, 50, 117–130. [Google Scholar] [CrossRef]
  58. Tan, Z.H.; Zhang, Y.P.; Song, Q.H.; Liu, W.J.; Deng, X.B.; Tang, J.W.; Deng, Y.; Zhou, W.J.; Yang, L.Y.; Yu, G.R. Rubber plantations act as water pumps in tropical China. Geophys. Res. Lett. 2011, 38. [Google Scholar] [CrossRef] [Green Version]
  59. Guo, P.; Zhao, X.; Shi, J.; Huang, J.; Tang, J.; Zhang, R.; Chen, J.; Wang, Q.; Zeng, J. The influence of temperature and precipitation on the vegetation dynamics of the tropical island of Hainan. Theor. Appl. Climatol. 2021, 143, 429–445. [Google Scholar] [CrossRef]
  60. Sun, Z.; Wang, X.; Yamamoto, H.; Tani, H.; Zhong, G.; Yin, S.; Guo, E. Spatial pattern of GPP variations in terrestrial ecosystems and its drivers: Climatic factors, CO2 concentration and land-cover change, 1982–2015. Ecol. Inform. 2018, 46, 156–165. [Google Scholar] [CrossRef]
  61. Madadgar, S.; AghaKouchak, A.; Farahmand, A.; Davis, S.J. Probabilistic estimates of drought impacts on agricultural production. Geophys. Res. Lett. 2017, 44, 7799–7807. [Google Scholar] [CrossRef]
  62. Oren, R.; Sperry, J.; Katul, G.; Pataki, D.; Ewers, B.; Phillips, N.; Schäfer, K. Survey and synthesis of intra-and interspecific variation in stomatal sensitivity to vapour pressure deficit. Plant Cell Environ. 1999, 22, 1515–1526. [Google Scholar] [CrossRef] [Green Version]
  63. Grossiord, C.; Buckley, T.N.; Cernusak, L.A.; Novick, K.A.; Poulter, B.; Siegwolf, R.T.; Sperry, J.S.; McDowell, N.G. Plant responses to rising vapor pressure deficit. New Phytol. 2020, 226, 1550–1566. [Google Scholar] [CrossRef] [Green Version]
  64. Sharafi, L.; Zarafshani, K.; Keshavarz, M.; Azadi, H.; Van Passel, S. Drought risk assessment: Towards drought early warning system and sustainable environment in western Iran. Ecol. Indic. 2020, 114, 106276. [Google Scholar] [CrossRef]
  65. Farahmand, A.; AghaKouchak, A.; Teixeira, J. A vantage from space can detect earlier drought onset: An approach using relative humidity. Sci. Rep. 2015, 5, 1–6. [Google Scholar] [CrossRef] [Green Version]
  66. Ford, T.W.; McRoberts, D.B.; Quiring, S.M.; Hall, R.E. On the utility of in situ soil moisture observations for flash drought early warning in Oklahoma, USA. Geophys. Res. Lett. 2015, 42, 9790–9798. [Google Scholar] [CrossRef]
  67. Hunt, E.D.; Hubbard, K.G.; Wilhite, D.A.; Arkebauer, T.J.; Dutcher, A.L. The development and evaluation of a soil moisture index. Int. J. Climatol. A J. R. Meteorol. Soc. 2009, 29, 747–759. [Google Scholar] [CrossRef]
  68. Senay, G.B.; Budde, M.; Brown, J.; Verdin, J. Mapping flash drought in the US: Southern Great Plains. In Proceedings of the 22nd Conference on Hydrology, 2008; Available online: https://ams.confex.com/ams/88Annual/techprogram/paper_134349.htm (accessed on 7 April 2022).
Figure 1. Study area (Study site: Danzhou Investigative and Experimental Station of Tropical Crops; The background topographic map sources: Esri, HERE, Garmin, Intermap, increment P Corp., GEBCO, USGS, FAO, NPS, NRCAN, GeoBase, IGN, Kadaster NL, Ordnance Survey, Esri Japan, METI, Esri China (Hong Kong), OpenStreetMap contributors, and the GIS User Community).
Forests 13 00893 g001
Figure 2. Study flowchart. RMSE: root mean square error; MAPE: mean absolute percentage error; MAE: mean absolute error. SRHI: standard relative humidity index; εmax: the maximum LUE; VPD0: the empirical coefficient of the water demand constraint equation; NDVI: normalized difference vegetation index.
Forests 13 00893 g002
Figure 3. Accuracy assessment of GPP: (a) Comparison between the estimated GPP and the GPP from Flux tower; (b) Time series of monthly estimated GPP and Flux tower GPP.
Forests 13 00893 g003
Figure 4. Vulnerability curves of rubber plantations’ GPP to different drought intensities and the month the drought occurs.
Forests 13 00893 g004
Figure 5. Spatial pattern changing tracks of rubber plantations’ GPP vulnerability with drought intensities and drought occurrence month over Hainan Island. Arrow represents the changing tracks of rubber plantations’ GPP vulnerability with SRHI from −0.25 to −2.00; Red means the dry season, and blue means the wet season.
Forests 13 00893 g005
Figure 6. The spatial distribution of a rubber plantation’s GPP loss for different drought months and intensities: (a) extreme drought in April; (b) light drought in April; (c) extreme drought in September; (d) light drought in September.
Forests 13 00893 g006
Publisher’s Note: MDPI stays neutral with regard to jurisdictional claims in published maps and institutional affiliations.

