Article

Mechanical Properties of Low-Stiffness Out-of-Grade Hybrid Pine—Effects of Knots, Resin and Pith

1
Centre for Future Materials, University of Southern Queensland, West Street, Toowoomba, QLD 4350, Australia
2
Hyne & Son Pty Ltd., Kent Street, Maryborough, QLD 4650, Australia
*
Author to whom correspondence should be addressed.
Forests 2022, 13(6), 927; https://doi.org/10.3390/f13060927
Submission received: 5 May 2022 / Revised: 31 May 2022 / Accepted: 1 June 2022 / Published: 13 June 2022
(This article belongs to the Special Issue Wood Conversion, Engineered Wood Products and Performance Testing)

Abstract

:
Out-of-grade pine timber is an abundant material resource that is underutilised because its mechanical properties are not well understood. Increasing trends toward shorter rotation times and fast-grown plantation pines around the world such as Pinus elliottii × P. caribaea var. hondurensis hybrid (PEE × PCH) mean low-stiffness corewood is becoming a larger portion of this out-of-grade population. This study characterised the modulus and strength properties in bending, compression parallel to grain (CParG) and compression perpendicular to grain (CPerpG), shear and tension strength of low-stiffness out-of-grade PEE × PCH. The effect of resin, knots and pith on these properties were also investigated. The results show that in clear wood, the MOE in bending, CParG, CPerpG and shear modulus are 6.9 GPa, 5.78 GPa, 0.27 GPa and 0.59 GPa, respectively, while strengths are 45.8 MPa, 29.4 MPa, 6.7 MPa, 5.7 MPa, respectively. The tensile strength is 32.4 MPa. Resin significantly increased density 45% higher than clear, but performed similar with the exception of CPerpG MOE and strength which were significantly different. Resin area ratio (RAR) has a moderate correlation with density with an R2 of 0.659 but low to no correlation for mechanical properties. Knots were significantly different to clear for all test types and within a range of 48% to 196%. Knots were high in CPerpG MOE and strength but lower for all other properties and had the largest negative impact on tensile strength. Knot area ratio (KAR) had low to moderate correlation with tension strength and CPerpG MOE with R2 of 0.48 and 0.35, respectively. Pith was within the range of 76% to 121% of non-pith samples for structural performance, some of which were significantly different, and pith samples were higher in density than non-pith. This new information is crucial for the effective establishment of grading rules, design optimisation and utilisation of low-stiffness out-of-grade PEE × PCH as a new material resource in civil engineering applications.

1. Introduction

The Pinus elliotti var. elliottii × P. caribaea var. hondurensis (PEE × PCH) hybrids are becoming an increasingly important fast-growing plantation softwood around the world. In Queensland, Australia, there are more than 90,000 ha already established [1]. As a relatively new taxa, these pines are showing promising results for growth and structural properties in Australia [2,3], Africa [2,4], China [5,6] and Central and South America [7,8]. Their high volume growth rate, good wind resistance, stem straightness and superior wood quality [3] ensure their future as a source of structural sawn timber for use in civil engineering and construction.
More than 97% of Australia’s softwood plantations are managed for sawlogs [9] and structural framing products for which machine-graded pine (MGP) is the base grading method. While MGP structural sawn pine is highly sought after, its out-of-grade counterpart is in low demand and large volumes are sold at a loss [10]. Out-of-grade in this study refers to sawn timber that has failed to meet the MGP structural framing requirements of AS1748 [11] and AS1720.1 [12] which specify minimum characteristic values of stiffness, strength and place limits on defects including resin shake, wane and distortion. There are significant volumes of out-of-grade timber produced around the world; nevertheless, perceived unfavourable characteristics can be overcome with a good understanding of their properties, and through targeted placement in manufacturing building systems and utilisation of building technologies [13]. In Australia, up to 50% of sawn production from softwood plantations is not achieving structural grade requirements [10]. A recent study from a group of 68 Australian-grown Southern Pine trees including the PEE × PCH hybrids showed that 77% of boards had MOE values less than 10 GPa [14]. This is not unique to the PEE × PCH with plantation growers around the world moving toward small-diameter and fast-grown plantation trees which produce high percentages of lower-performing corewood [15]. The lack of mature wood within a piece of timber can lead to reduced mechanical properties [16,17]. Nonetheless, despite the low bending MOE, some studies have found that juvenile and corewood can have some good properties and attributes including increased durability with respect to mechanical degradation, and transverse mechanical properties [18]. With the increasing supply of PEE × PCH hybrids around the world [2,3,4,5,6,7,8], there is a need to value add the low-stiffness out-of-grade component of this new material resource and look for repurposing opportunities such as engineered timber products.
As a relatively new hybrid, very few studies have looked at PEE × PCH hybrid pine as a material resource for engineered timber products. Those that have did not consider sawn timber but rather timber strands and veneers taken from young trees used in oriented strand board panels [19] and plywood [20] which gave low structural performance. Engineered timber products provide opportunity for additional utilisation of solid wood into the future, and are likely to be elements of composite systems [15]. Custom timber grades are often used for feedstock into engineered wood products such as glulam and CLT. Development of custom grades to extract suitable timber from the out of-grade population would optimise its use while providing a reliably performing product. Establishing grading rules and designing and modelling of engineered wood products requires the structural performance information of the feedstock.
This study provides an essential step toward maximising the use of out-of-grade PEE × PCH hybrid pine by characterising its important physical and mechanical properties. It will compare the ratios of structural performance and bending MOE to other PEE × PCH hybrid pines, young, low grade and average populations of similar pines to look for any high relative performance. It will contribute to knowledge and build on existing literature by evaluating the effects of resin, knots and pith on the bending, shear, tension and compression properties in pine. Correlations between resin, knots and density and structural performance will be evaluated. Existing models in the literature that predict structural performance based on change in density will be compared to actual change in performance. This information can be used in development and optimise custom grading rules and to inform design and modelling for various applications including development of engineered wood products, value adding to this new, emerging, and sustainable material resource.

2. Background

The grading report for the mill runs of PEE × PCH show low modulus of elasticity as the most significant reason for grade rejection. As common in other pines, longitudinal MOE reduces significantly the closer to the pith in PEE × PCH [14]. Visual inspections of sawn out-of-grade PEE × PCH timber revealed that the majority of pieces were from the middle of the tree and showed physical signs of the corewood zone. Corewood is considered to be the first 10 to 12 growth rings from the pith [21,22]. Wandering pith, needle trace, tight-radius growth rings, high content of early wood, heartwood deposits, resin shake, resin streaking and clustered conical shape knots were all common. An example of out-of-grade PEE × PCH hybrid timber is shown in Figure 1 and illustrates the extent of wandering pith and associated grain deviation which caused multiple changes in cross-sectional growth ring orientations along a length. This study will focus on clear, resinous, and knotted timber with and without pith to capture a large majority of this out-of-grade resource, and it will not include resin shakes or distortion, the effects of which can be investigated in future studies.
Knots are inherent in all timber and are more frequent and larger in out-of-grade timber compared to structural grade [23] but also have different characteristics when they occur in the core of the tree. Due to grain deviation and disruption, knots are well known to have significant impacts on some structural properties [24,25,26]. PEE × PCH hybrids were found to have more encased knots per board than its parent species [2] but their knots are small compared to those in radiata pine [27]. Knots in timber cut close to the core have different characteristics to those in more mature wood. They are often clustered, more conical shaped, are at high angles and have connections with the pith. Knots have been known to have improved properties such as perpendicular to grain and shear [13] and to better utilise this resource; the impact of these types of knots from the core of the tree need to be better understood.
Resin increases density of a piece of timber, but limited information is available on its impact on structural performance. PEE × PCH hybrids are prone to resin streaking [2,28,29,30] often developing from weak spots in corewood such as knots and pith [31] which are frequent in out-of-grade. The PEE × PCH hybrids have been found to have high overall resin content at tree level ranging between 2% and 17%, with resin content increasing radially from bark to pith and also with the age of the tree [14]. Extractives are known to provide reinforcement from within the cell walls and lumen to resist failure which occurs as buckling of the micro fibrils in the secondary cell wall causing out-of-plane bulging deformation followed by shear or kinked bands [32]. There is very little literature available on the impact of resin on structural performance, but some research has found it can provide slight increases in strength [33,34,35] but the magnitude of this increase compared to the increase in density needs to be known for optimisation and design purposes.
Thus, a detailed understanding on the important mechanical properties of out-of-grade sawn PEE × PCH and the effect of these commonly occurring characteristics of knots, resin and pith is essential to select, repurpose and optimise this timber resource into engineered timber products suitable for civil engineering and construction.

3. Materials and Methods

3.1. Design of Experiments

The out-of-grade timber used for this study is a common structural-grading size of 90 × 35 mm. The samples were collected over three shifts of a mill run of 31-year-old PEE × PCH hybrid pine harvested from Cowra, Queensland, Australia. Ideally, sample extraction would occur over many months of production to capture the variation seen in trees. However, under normal milling processes, identification and segregation of PEE × PCH from other Southern Yellow pines was not possible. This mill run was set up for research purposes and ensured only PEE × PCH was being processed and graded during the run. While the sample extraction occurred over a limited time, the mill data collected for the entire run showed it had a population average MOE and volume percentage of out-of-grade only slightly higher than that in previous mill runs of mixed Southern Yellow pines which included PEE × PCH. Therefore, it is reasonable to consider the sample representative of an average population.
Modern finger-jointing equipment enables quick and easy end joining of timber after the removal of any unwanted features and can achieve 90% of tensile strength of clear wood [36]. Thus, with a focus to provide information for development of grading rules and to understand the impact of specific features that could be removed and the piece finger jointed back together, rather than carrying out an in-grade study which would capture a population with random inclusion of a wide range of characteristics present in out-of-grade timber, small sample sizes containing specific commonly occurring characteristics previously discussed were adopted. The three sample types are presented in Table 1 and Figure 2.
  • Clear containing no obvious defects with the exception of pith;
  • Resin containing at least 25% of the cross-sectional area resinous timber and no obvious defects with the exception of pith;
  • Knots containing at least 25% knot area ratio (KAR) and may contain pith.
The majority of out-of-grade was found to be from the corewood zone off the tree and as pith is an inherent characteristic of corewood of pine, no separate sample set was obtained for pith, but quantities occurring within each sample type are included in Table 1. Studies have looked at the impact of the mechanical properties of extractives using intricate and time-consuming laboratory-based extraction methods to remove resin from cell walls and lumen [34,35] which is not feasible for industrial-scale milling. Resin area ratio (RAR) gives an opportunity to quickly and easily measure the area of timber with resin-filled lumen. It needs to be determined if RAR would be a useful indicator property. RAR is the sum of the cross-sectional area of resinous timber on both ends of the sample divided by the total cross sectional area of both ends. For the longer tension and bending samples, the RAR of the failed cross section is used. The determination of KAR is based on the method presented in AS2858 (Standards Australia, 2008a).
The results of each test will look at the failure behaviour of the samples, the structural performance and the ratio to bending MOE compared to other young, low-grade and average populations of similar pines as well as the correlation between density and MOE and strength. The analysis for the effect of resin, knots and pith are completed in the following ways:
1.
The clear and resin samples are compared for MOE and strength;
2.
The clear and knot samples are compared for MOE and strength;
3.
Pith and no pith are compared for MOE and strength in clear, resin and knot sample types.
This is repeated for all five test types: bending, compression parallel to grain (CParG), compression perpendicular to grain (CPerpG), longitudinal shear and tension, as set out in Table 1. On-flat rather than on-edge bending was used because it is closer aligned with the orientation most often used in engineered wood products such as glulam and CLT. Additionally, the smaller sample size enabled isolation of the characteristics in the different sample types of clear, resin and knots. Tension MOE parallel to grain is a difficult parameter to test [36,37,38] and is not tested in this study. Doyle and Markwardt [37] found that tensile MOE is closely aligned to the true MOE with good correlation (R2 0.898 to 0.971). Forest Products Laboratory [36] recommend an increase on bending MOE of 10% to achieve true MOE and this aligns with the findings of Baño et al. [38]. Therefore, it would be reasonable to use on-flat bending MOE as a slightly conservative estimate of tension MOE. Student t-tests with a significance level of 0.05 will be used to analyse the difference between sample type results.

3.2. Test Set-Up and Procedure

3.2.1. Bending

The four-point bending test configuration is shown in Figure 3. The bending MOE (Eb) and strength (fb) are calculated using Equations (1)–(3) as per AS4063.1 [39]. Equation (2) is used where failure occurred within the zone of constant bending while Equation (3) is used where failure occurred within the outer segments of the span.
E b = 23 108 L d 3 Δ F Δ e 1 b
where Δ F / Δ e is the linear elastic slope of the load–displacement graph, b is the width in mm, L is the length in mm and d is the depth in mm of the specimen.
f b = F ult L b d 2
where Fult is the applied load initiating failure in the test piece in Newtons (N).
f b = 3 F ult L 2 L v 2 b d 2
where Lv is the distance in mm from centre of test span to bending mode point of failure.
An MTS 100 kN universal testing machine was used with a load rate of 10 mm/min. Samples were tested on flat and knots were located mid span of the knot samples.

3.2.2. CParG

The CParG test configuration is shown in Figure 4. AS/NZS4063.1 [39] allows for a sub-set of shorter lengths. The compressive strain measurements were taken using an Imetrum DIC CAM026 and CParG MOE (ECParG) was calculated using Equation (4). The CParG strength (fc,0) was calculated according to AS/NZS4063.1 [39] using Equation (5). The samples were loaded at a rate of 3 mm/min using a SANS 2000 kN universal test machine. Glued on strain gauges were also used as a comparison to the DIC and to calculate Poisson’s ratio.
CParG MOE
E C P a r G = Δ F Δ e L b d
CParG strength
f c , 0 = F ult b d
Figure 4. CParG test configuration.
Forests 13 00927 g004

3.2.3. CPerpG

The CPerpG test configuration is shown in Figure 5 and are as per AS/NZS4063.1 [39]. The CPerpG MOE (Ec,90) and strength (fc,90) were calculated in accordance with AS/NZS4063.1 using Equation (6) and the lesser or Equation (7) or Equation (8). The equation for CPerpG MOE was multiplied by the depth of the sample to align with Hooke’s law. A load rate of 3 mm/min was applied using a SANS 2000 kN universal test machine. Two steel plates measuring 90 mm-wide and 100 mm-long with a 3 mm radius along the edge of contact were used to squeeze the sample.
CPerpG MOE
E c , 90 = Δ F Δ e d 90 b
CPerpG strength
f c , 90 = F 0.1 d 90 b
f c , 90 = F ult 90 b
where F0.1d is the load at deformation of 0.1d in N and, Fult is value of applied load at failure in N.
Figure 5. CPerpG test configuration.
Forests 13 00927 g005

3.2.4. Shear

The shear test configuration is shown in Figure 6 and is as per ISO 13910 [40]. The angle between shear plane and force direction was 14° and test samples were 90 mm-wide (d) and 200 mm-long (L). The wide faces of the samples were planed prior to gluing to the steel plates to achieve sufficient bond quality for the test. Samples were loaded for MOE testing using an MTS 100 kN universal testing machine at a rate of 1 mm/min and later broken on a SANS 2000 kN universal testing machine for shear strength. The shear strength (fv,0) was calculated according to ISO 13910 [40] using Equation (9). LVDTs were used to measure displacement of steel plates and longitudinal shear modulus (G0) was calculated using Equation (10).
f v , 0 = F ult c o s 14 ° Ld
G 0 = Δ F Δ e c o s 14 ° d Lb
where Fult is failure load in N.

3.2.5. Tension

The tension test configuration is shown in Figure 7. The length between the grips of the tension tester is 700 mm so that clear knot-free wood could be tested. Tension strength (ft,0) was calculated using Equation (11) from AS4063.1 [39].
f t , 0 = F ult bd
where Fult is the maximum load in N.

3.2.6. Density

The density at the time of test ( p t e s t ) for each sample was calculated using Equation (12) in accordance with AS4063.1 [39]. A&D-HV-60KGL scales were used to measure the mass of the samples. A Delmhorst-RDM-2 moisture metre was used to measure the moisture content.
p t e s t = m 10 9 L b d
where m is the mass of the sample in kg.

4. Results

The average and 5th percentile (5th %ile) MOE and strength in bending, CParG, CPerpG, longitudinal shear and strength in tension are listed in Table 2 along with average density and moisture content. The average Poisson’s ratio for the pooled clear and resin samples was calculated as 0.437 and is similar to the value published for one of its parent species slash pine of 0.418 [36]. Tension strength test for all clear and resin samples are based on samples that failed within the test span. Any tests that failed within the clamped region were excluded.

5. Discussions

This section discusses the mechanical properties and ratio to bending MOE as an indicator property and compares these to other PEE × PCH hybrid pines, other young, low-grade and population averages of similar pines. It also analyses the failure behaviour and difference between structural performance of clear, resin, knots and pith samples of out-of-grade PEE × PCH hybrid pine for each of the tests performed. Finally, it will establish the density relationship and the MOE and strength relationship for each test type.
A direct comparison between the relative performance of the out-of-grade PEE × PCH and other studies and similar species is presented in Table 3. Such comparisons can be misleading because of the variation between and within trees, so the portion of the population studied needs to be taken into consideration. This study looks at the out-of-grade portion of 31-year-old plantation-grown PEE × PCH trees which contains a high content of juvenile and corewood. Table 3 also contains data from studies on PEE × PCH hybrids, data from studies of comparable populations of juvenile or low-grade timber of similar pines and data from population averages of other similar pines not focused on juvenile wood or young trees.
A reduction in mechanical properties is generally accompanied by a reduction in bending MOE [36]. Bending MOE is often used as an indicator property to predict other properties of timber; so, a ratio between average properties and bending MOE can be used to give insight into relative performance between these different populations of timber. These ratios have been included in brackets in Table 3.

5.1. Bending

5.1.1. Failure Behaviour

All bending samples showed linear-elastic behaviour up to brittle failure and all but two specimens failed between the loading points. Figure 8 shows some typical failures whereby the majority of the cross section failed under tension after initial compression failures in the top of the sample. The majority of knot samples failed in deviated grain around the knot.

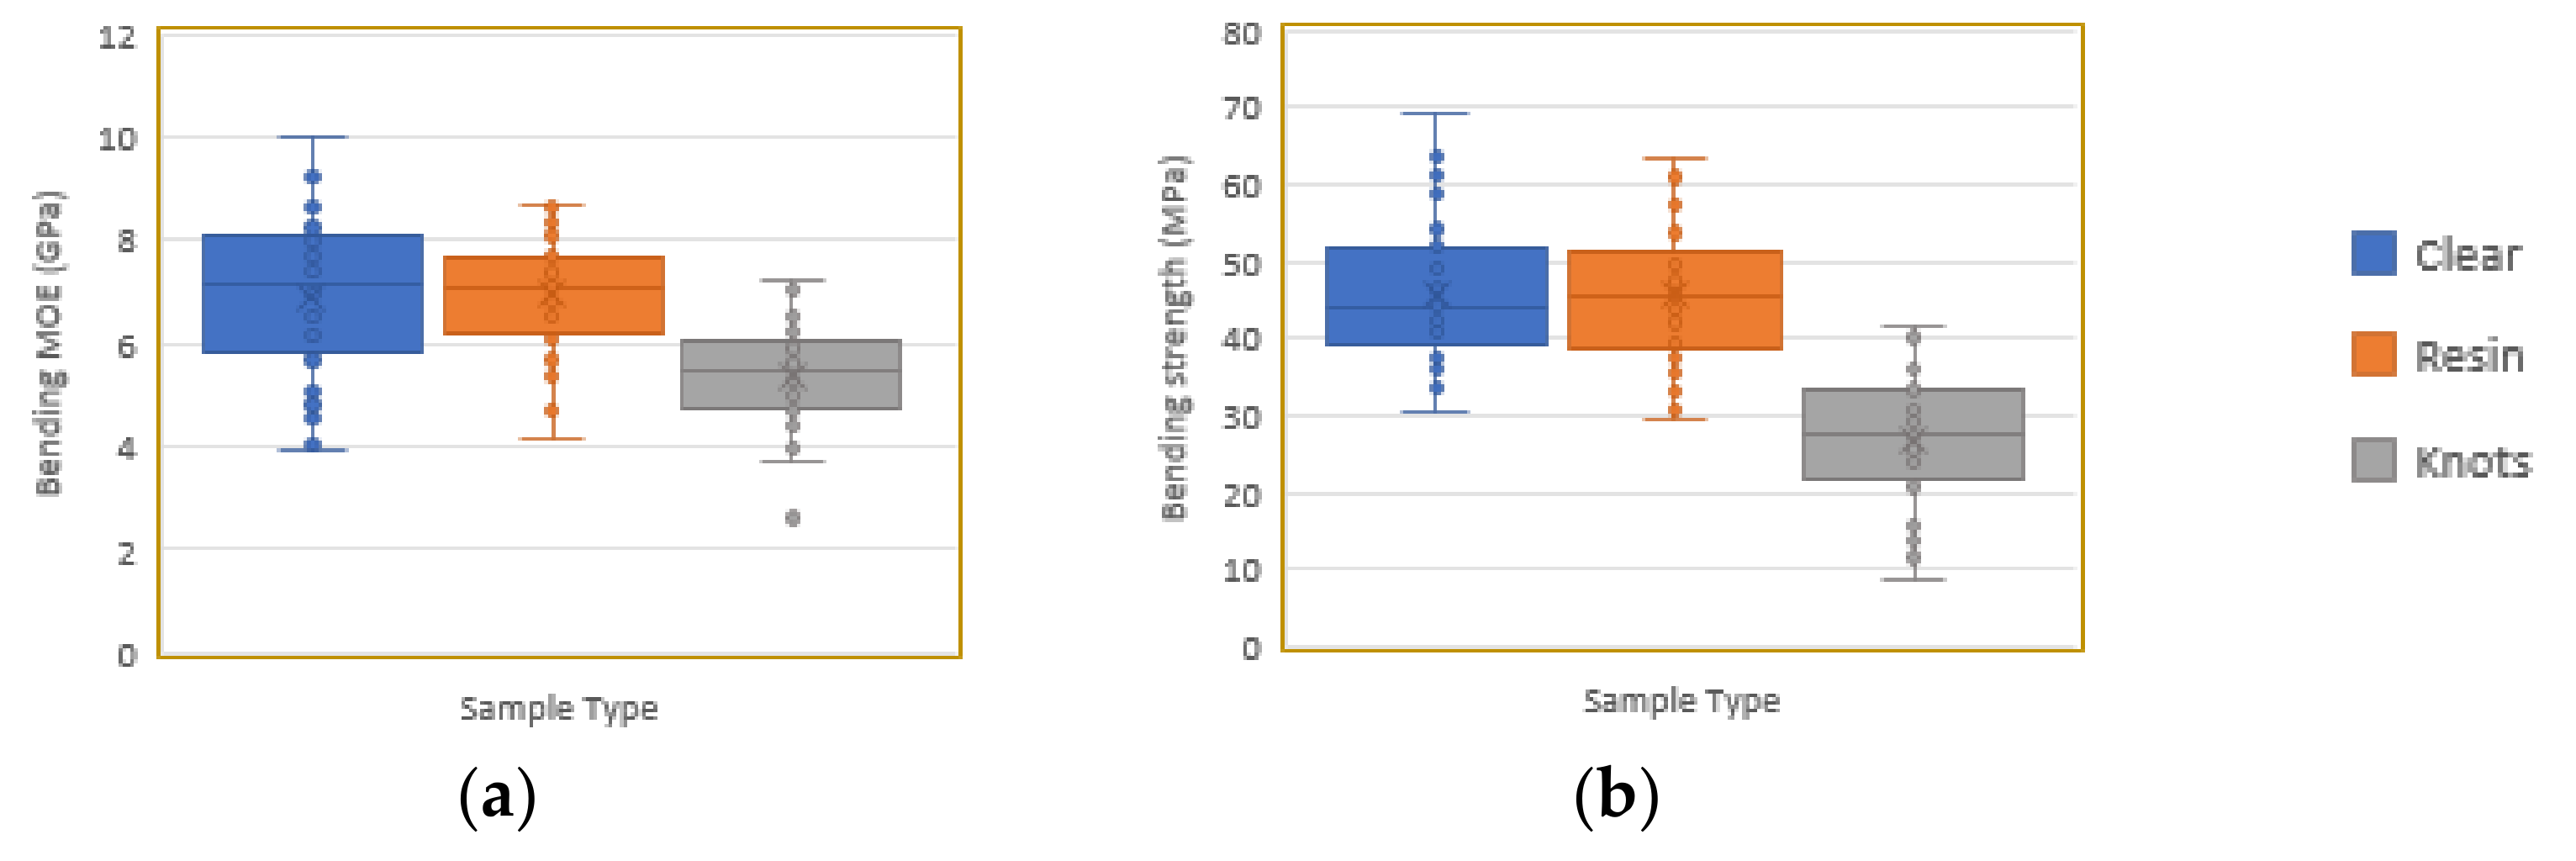
5.1.2. Structural Performance

The bending MOE of the clear samples is mid-range and within 10% of the average of other PEE × PCH hybrids and young or low-grade similar pines. At 39% lower than population averages of similar pine (Table 3), the bending MOE is within the expected ratio range of 0.45 to 0.75 of juvenile to mature wood [36]. The bending strength of clear samples is high and similar to many of the average populations of similar species but besides pith, these are defect-free and the knot samples performed poorly in comparison. Nel, et al. [2] found that boards cut from the core of the PEE × PCH hybrid had lower bending MOE and strength than their parent species and attributed this to both fast diameter growth and less density variation across the core. However, Moya, et al. [42] found the young wood in slash can have lower bending MOE performance. The grading process would have removed any higher-performing pieces from the population in this study keeping the structural properties low, but the results of Wessels, et al. [27] and Nel, et al. [2] demonstrate that these hybrids can have even lower performance in bending MOE and strength. This must be taken into consideration when looking to use this out-of-grade PEE × PCH hybrid in building systems. The results of the bending MOE and strength tests are reported in Table 2 and illustrated in Figure 9.
The MOR/bending MOE ratio for clear samples are high compared to other studies of young PEE × PCH hybrid at 31% more on average, but this can be explained by the lack of knots and other defects in the clear sample set. The knot samples still performed well and are within 2% of the average. On the other hand, the MOR/bending MOE ratio is low compared to young or low-grade and population averages and of other similar pines at 8% and 17% less, respectively. As PEE × PCH is limited by bending stiffness rather than strength in achieving grade [2,27,29], this low ratio for the PEE × PCH studies could be seen as a positive result because this indicates that the strength and stiffness are closer aligned with grading cut-offs. Conversely, it shows that that the young and out-of-grade population of these hybrids do not offer the advantage of high MOR compared to MOE performance compared to other pines.

5.1.3. Effect of Resin

Compared to clear samples, resin had little effect for bending performance with no significant differences for MOE (p = 0.89) or strength (p = 0.92). With an average RAR of 0.46 (0.45 median), the resins are on average 0.6% higher (−1.2% median) and 0.4% lower (+3.4% median) than clear bending MOE and strength, respectively. Studies on other species also found little to no difference between the bending performance of wood with and without extractives [35,46,47,48] with the exception of Garcia-Iruela, et al. [35], who reported a 14% higher bending strength for resinous wood. The bending failure behaviour of timber which is initiated by its low-relative-compression properties [49] indicates that an increase in compression properties would increase bending performance. While it is later shown that resinous timber did perform better slightly in CParG MOE than clear, its impact would depend on the location of the resin within the wood structure [35] and of the resinous wood in the cross section of the bending sample. All resin-bending samples had resinous wood extending across both the tensile and compressive sides of the sample cross section. Even the samples with very high resin content showed no superior bending performance and Figure 10 shows there is no clear trend or relationship between increasing RAR and bending MOE or strength.

5.1.4. Effect of Knots

Knots had an average KAR of 0.51 (0.5 median) and were significantly different to the clear samples for bending MOE (p < 0.001) and strength (p < 0.001) with averages of 22.5% (23.1% median) and 41.6% (39.4% median) less, respectively (Figure 9 and Table 2). This is similar to reductions for KAR of 0.5 on-flat bending seen in Samson and Blanchet [50] but less than that seen for on-edge bending [51,52] which is reasonable given others have found knots to have less impact in on-flat bending [50,53]. Figure 10 shows that there is a decreasing trend for MOE and strength with increasing KAR but KAR alone was not a strong indicator with low R2 values. The rate of change in MOE and strength with increasing KAR is low at around 45% and 20% less, respectively, than others in the literature [50,51,52]. This can be expected given these other studies looked at higher-longitudinal-stiffness timber which has a greater difference between longitudinal and transverse properties. Moreover, the knot type and shape near the pith are different to knots occurring in outer wood. They are more likely to be in combination with the grain deviating throughout multiple smaller conical-shaped and high-angled knots connecting with or near the pith rather than large grain deviations around large cylindrical-shaped single knots found in outer wood. Additional research is needed to obtain a more in-depth understanding of these unique characteristics and geometry of corewood knots, and to understand their impact on bending in more detail.

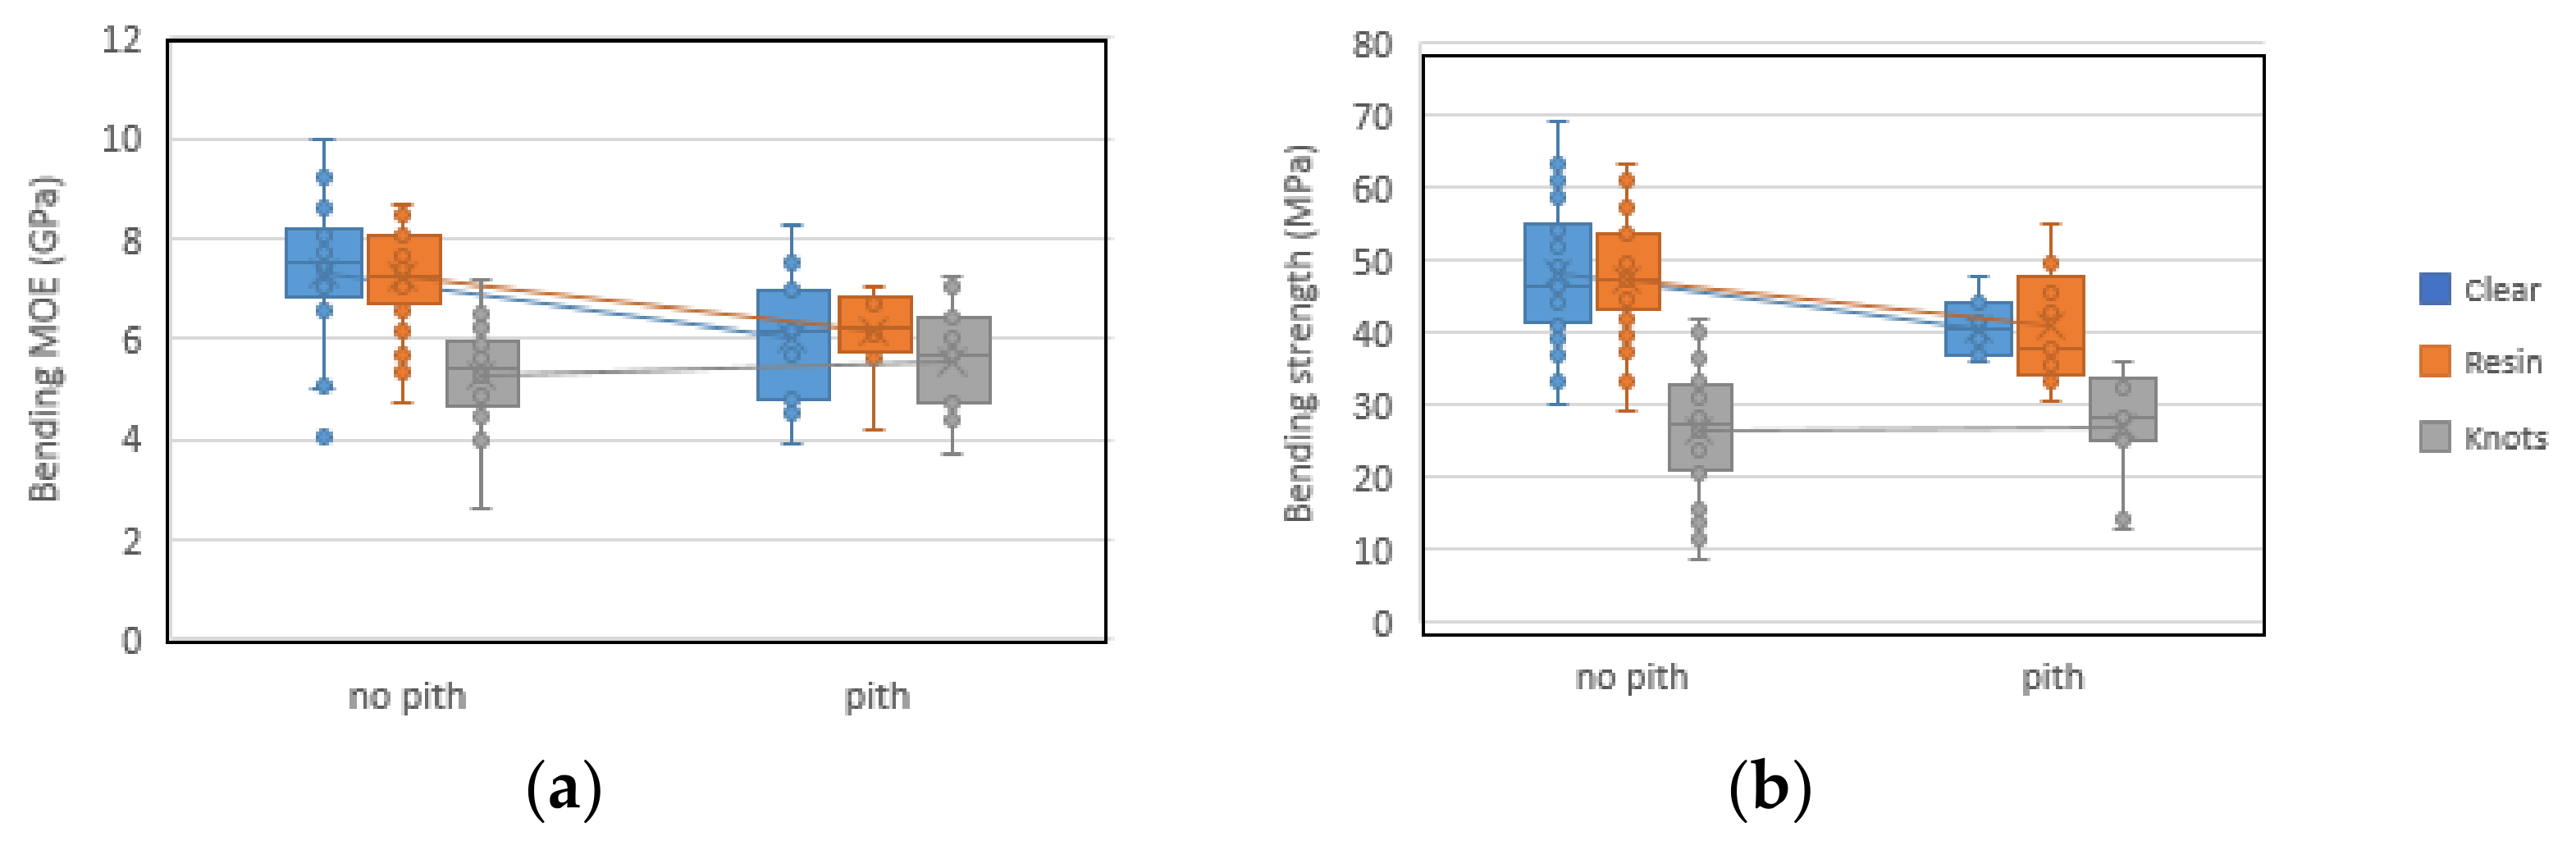
5.1.5. Effect of Pith

Separating the pith from the no-pith showed a significant difference for clear and resin samples in both MOE and strength but no significant difference for knot samples. Clear with pith is on average 17.7% (−18.5% median) lower in MOE (p = 0.018) and 12.4% (−15.4% median) lower in strength (p = 0.031). Resin with pith is on average 14.8% (−14.5% median) lower in MOE (p = 0.008) and 13.8% (−20.0% median) lower in strength (p = 0.043). Knots with pith are on average 4.0% (+5.8% median) higher in MOE (p = 0.575) and 1.8% (+4.3% median) in strength (p = 0.875) (Figure 11 and Table 2). This reduction in clear and resin samples can be expected given the change in cell structure the further from the pith, but it is interesting to see the sensitivity given all these samples were near the pith. The knots on the other hand had almost no difference, showing that knots are the governing factor for reduced structural performance in bending and have more negative impact on strength than MOE.

5.1.6. Relationship of Density and Bending Properties

There is no clear relationship between density and bending MOE or strength with all sample types having low R2 values (<0.1). At the average population level, the relationships presented by Doyle and Markwardt [54] were similar for clear samples but overpredicted the bending properties of resin and knots. Relationships given by Forest Products Laboratory [36] for bending MOE and MORE overestimated all sample types, showing that out-of-grade PEE × PCH has high density relative to bending performance. Moreover, the density to bending relationships for juvenile wood have proven to be different and more variable than mature wood in other studies [55]. The low stiffness and variability in juvenile wood, high density of compression wood and presence of resin would not have been accounted for in these models and would contribute to some of the difference.

5.1.7. Relationship of Bending MOE and Strength

Bending MOE is a good indicator for bending strength describing 63% of strength for all sample types combined. However, as can be seen in Figure 12, this relationship improved R2 to 71% when pith samples were removed. The results also show that this relationship is as good an indicator for knots as it is for clear timber but knots had strengths on average 24% lower for equivalent MOE. Comparing this to other research shows the R2 values are similar [17]. As expected, the clear and resin out-of-grade PEE × PCH being defect-free are strong in bending, achieving up to 40% higher strengths for the equivalent bending MOE values than southern yellow pine lumber in a study by Doyle and Markwardt [54], whereas the knots had a similar relationship.

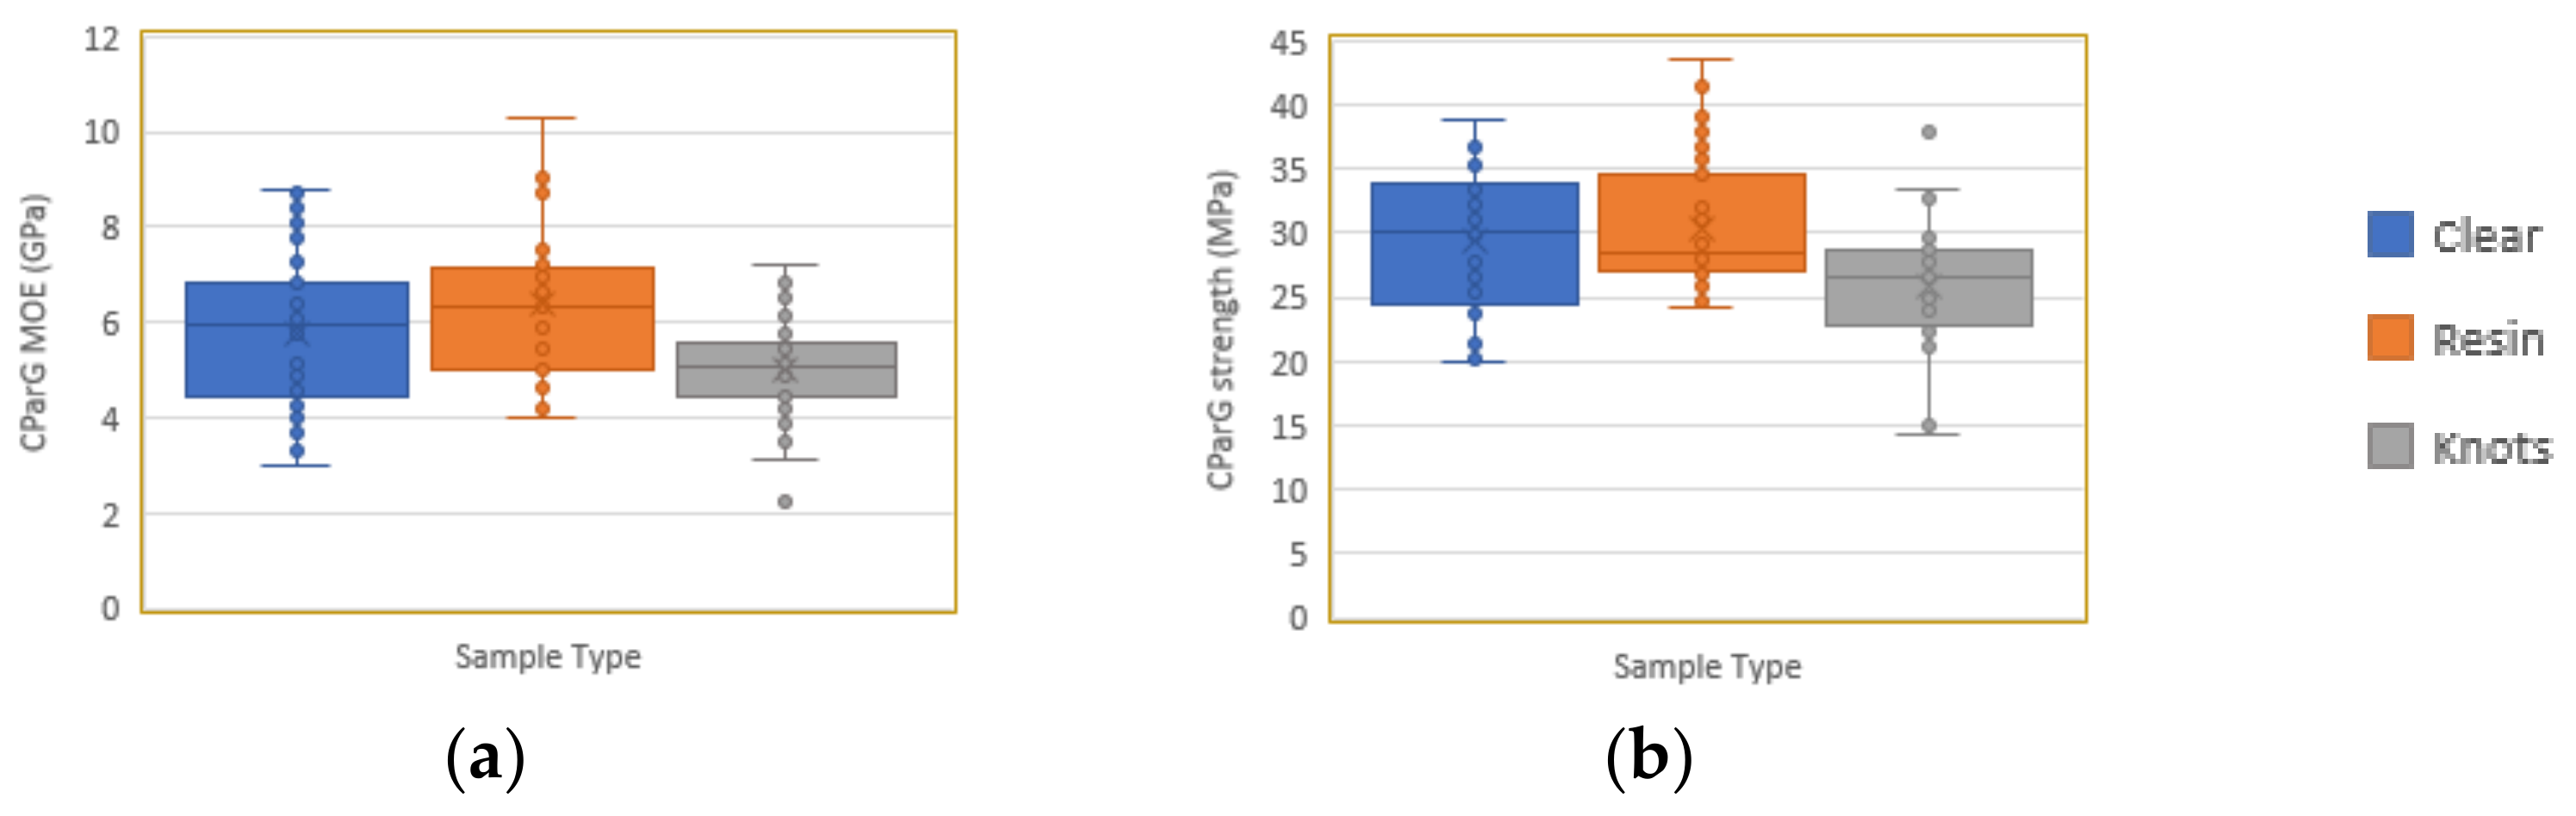
5.2. Compression Parallel to Grain

5.2.1. Failure Behaviour

CParG failures were ductile and showed a region of linear elastic behaviour followed by slowing and then reduction in load resistance. This aligns with the typical stages of failure described in the literature [56]. Shear failure was the most common failure type and knots typically failed in the deviated grain surrounding the knot (Figure 13).

5.2.2. Structural Performance

The CParG MOE is low compared to both low-grade and average populations of similar pines. The clear samples are 43% lower than Grade 3 southern yellow pines [54] and 45% lower than population averages of slash, loblolly and radiata [45]. CParG strength fell midrange with clear sample results within 3% of Grade 3 southern yellow pines [54] and 19% higher than 15-year-old slash and loblolly [42]; however, it was low compared to the population averages which were 37% higher on average (Table 3). The results of CParG MOE and strength test are reported in Table 2 and illustrated in Figure 14.
The CParG MOE/bending MOE ratios of clear are low compared to other young or low-grade and average populations of similar pines at 19% and 29% less, respectively, meaning they do not have high CParG MOE for their bending MOE. Knot samples are also low at 9% and 20% less, respectively. Being under parity shows that this resource does not comply with the common assumption that CParG MOE is equivalent to bending MOE [57] and confirms using bending MOE as tensile MOE is a conservative option. Investigation into other research revealed that CParG MOE for pines can be less than bending MOE [25,44,58] but not always [45,54,59]. The CParG strength/MOE ratios of clear are mid-range and within 1% of other young or low-grade and average populations of similar pines; however, knots sample are on average 15% higher. These results show that knots have more negative impact on bending MOE than they do on CParG strength and MOE which may be explained by the high compression wood content of juvenile wood and wood surrounding knots which is known to have higher CParG strengths than normal wood [60].

5.2.3. Effect of Resin

Compared to clear, resin samples showed an increase for MOE but minimal difference for strength and neither of these increases were significant (MOE p = 0.13, strength p = 0.41). With an average RAR of 0.65 (0.65 median), resin had the highest average performance achieving on average 10% (+6.4% median) and 3.6% (−5.2% median) higher CParG average MOE and strength than clear (Figure 14 and Table 2). Extractives provide reinforcement from within the cell walls and lumen and resist buckling failure which occurs in the secondary walls of the microfibrils causing out-of-plane bulging deformation followed by shear or kinked bands [32]; so, an increase in performance due to resin could reasonably be expected. Grabner, et al. [34] also found little difference for MOE or strength in larch and found no correlation between increasing CParG properties and extractive content, while others did find strength increased by 16% [35,47]. Ajuong and Breese [61] and Hernandez [62] found extractives within the cell wall rather than within the lumen provided the benefit. Contradicting this, Garcia-Iruela, et al. [35] proposed resin-filled cell lumen had the higher impact over cell wall and stated that the different resin location in the wood structure was the reason for discrepancies between studies. Despite the higher MOE values for resin samples, this higher performance due to resin-filled cell lumen is not evident in Figure 15, which shows no clear trend or correlation between increasing RAR and MOR or strength.

5.2.4. Effect of Knots

Knots had an average KAR of 0.42 (0.40 median) and were significantly different to the clear samples for CPar MOE (p < 0.027) and strength (p < 0.007) with on average 13.0% (−15.2% median) and 11.6% (−11.4% median) less, respectively (Figure 14 and Table 2). This difference is less than that found by As, et al. [51] for Scots pine at 24%. The grain deviation and disruption associated with knots causes a transition into perpendicular to grain and shear stresses for which timber has much lower performance. Benabou [56] found that shear yield strength and local fibre misalignment were the main influences on CParG strengths. The smaller impact of knots found in this study can be explained by the knot characteristics near the pith being in combination with grain deviating throughout the knot cluster offering more parallel to grain support, the smaller difference between longitudinal and transverse properties and the presence of resin streaking, which is later seen to improve perpendicular to grain performance. Figure 15 shows that KAR is a moderate indicator of the decreasing trend for MOE and strength with increasing KAR.

5.2.5. Effect of Pith

Separating the pith from no-pith samples showed no significant difference for MOE or strength for clear, resin or knots. As seen in Figure 16 and Table 2, clear with pith is 10.7% (−12.2% median) lower in MOE (p = 0.313) and 1.1% (−2.8% median) higher in strength (p = 0.885) than no pith. Resin with pith is on average 6.3% (−1.5%) lower in MOE (p = 2.079) and 0.1% (+3.3% median) lower in strength (p = 0.976) than no pith. Knots with pith are on average 3.5% (−1.1% median) lower in MOE (p = 0.534) and 2.1% (−3.1% median) than strength (p = 0.797) than no pith.

5.2.6. Relationship of Density and CParG

Density is a poor indicator of CParG properties with R2 values less than 0.23 and lowest for resin at less than 0.03. While clear showed an increasing trend, knots decreased and resin showed minimal change. Relationships between density and CParG properties published in the literature for softwoods [36,54] overpredicted the CParG MOE and strength for all sample types, showing this resource has high density relative to CParG properties which, as with bending properties, is likely linked to the presence of juvenile wood, compression wood and resin.

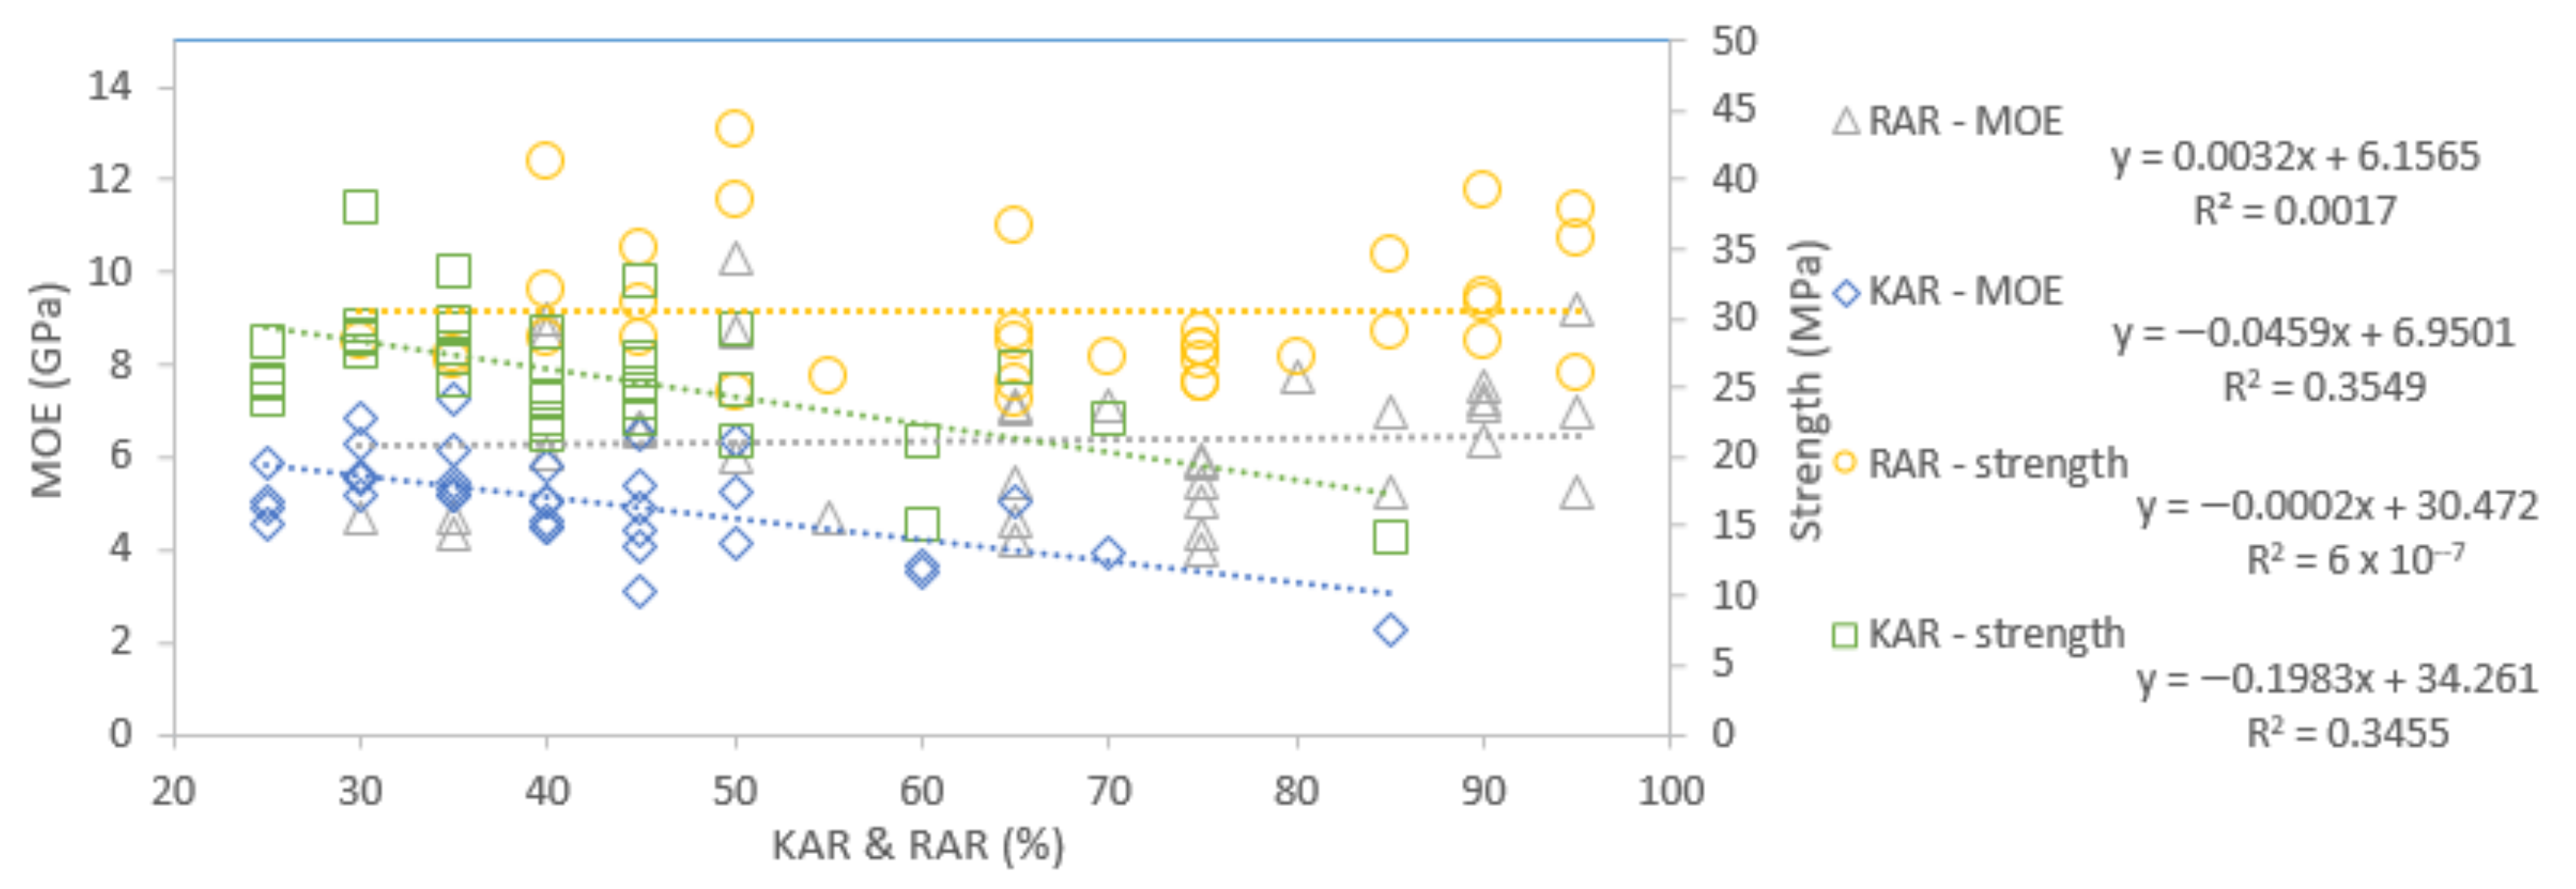
5.2.7. Relationship of CParG MOE and Strength

CParG MOE is a good indicator for CParG strength describing 70% of strength for all sample types combined, as can be seen in Figure 17. While this relationship is similar to Doyle and Markwardt [54] for small clears, it shows higher strengths for equivalent MOE compared to southern pine lumber. All sample types have similar trends in strength for equivalent MOE values.

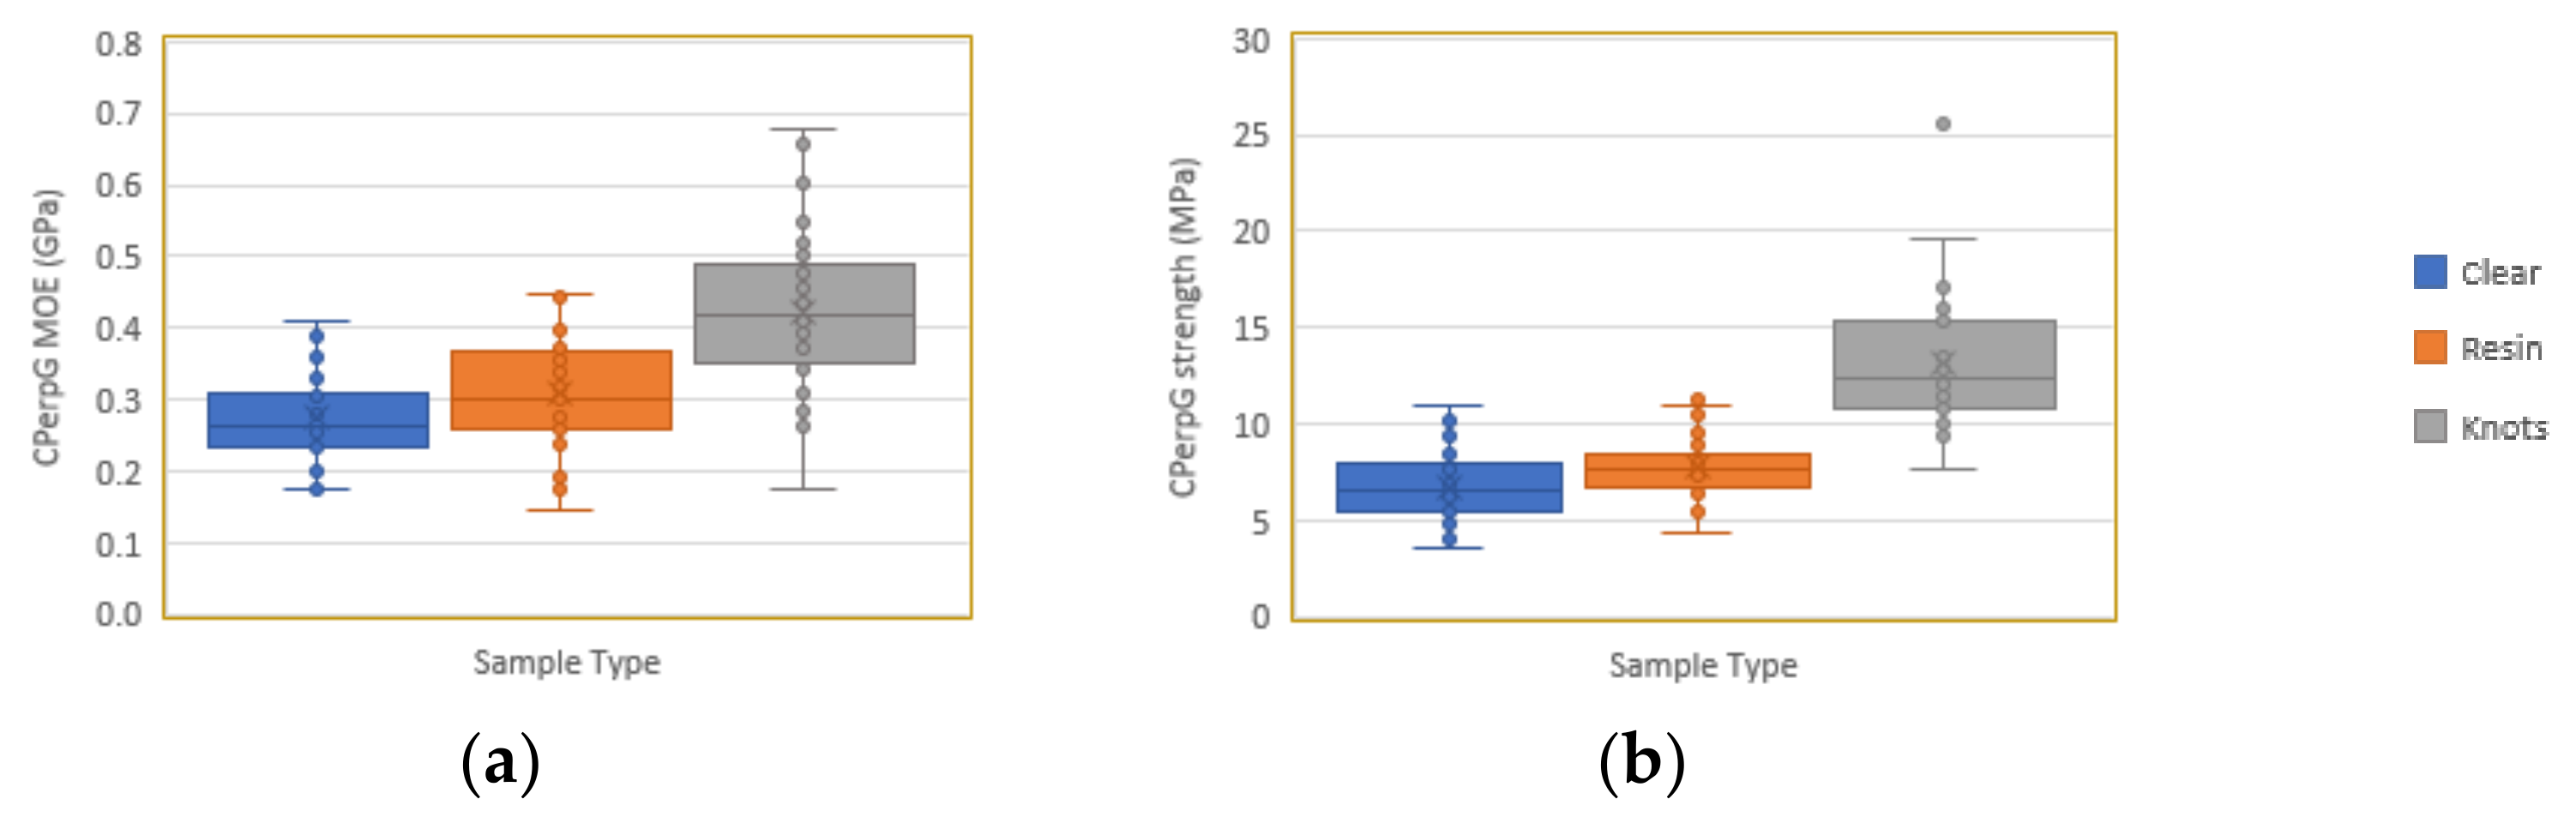
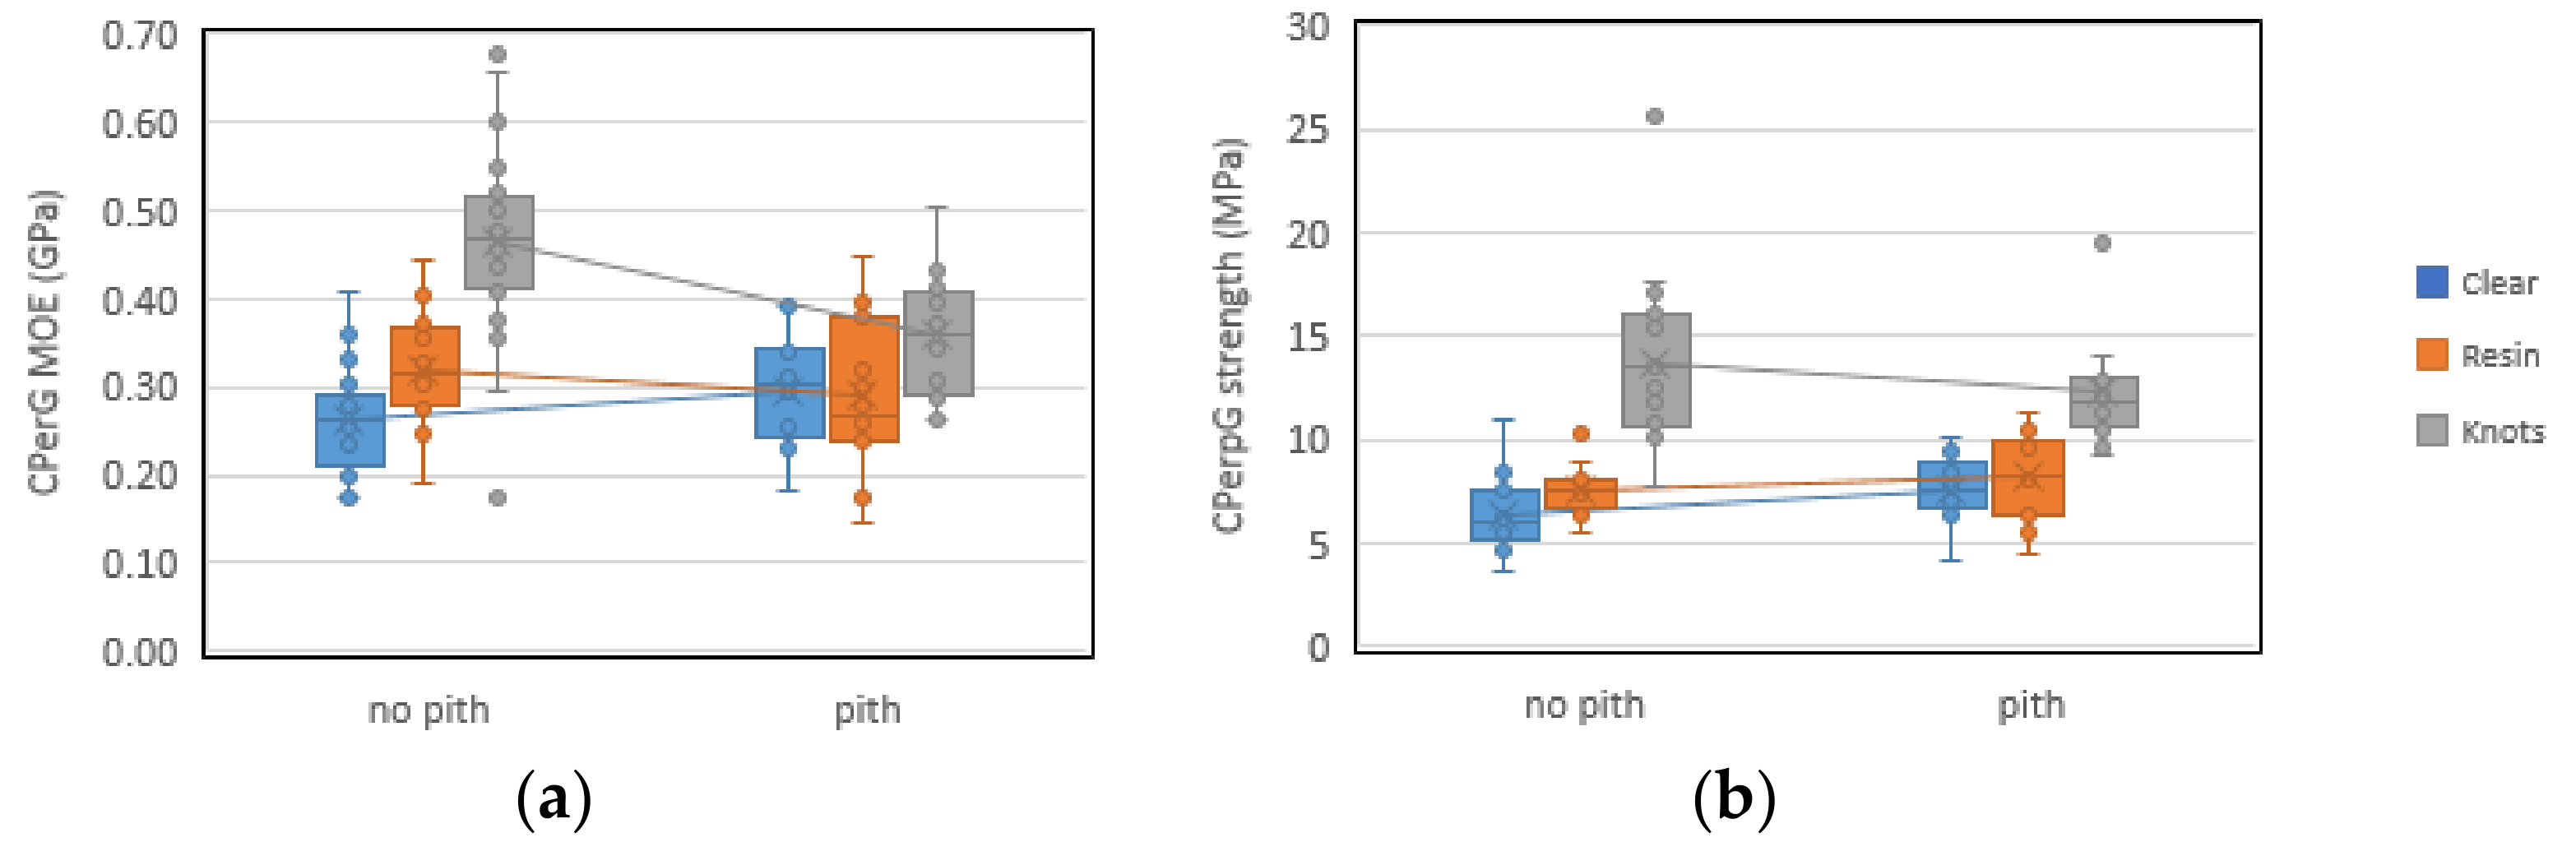
5.3. Compression Perpendicular to Grain

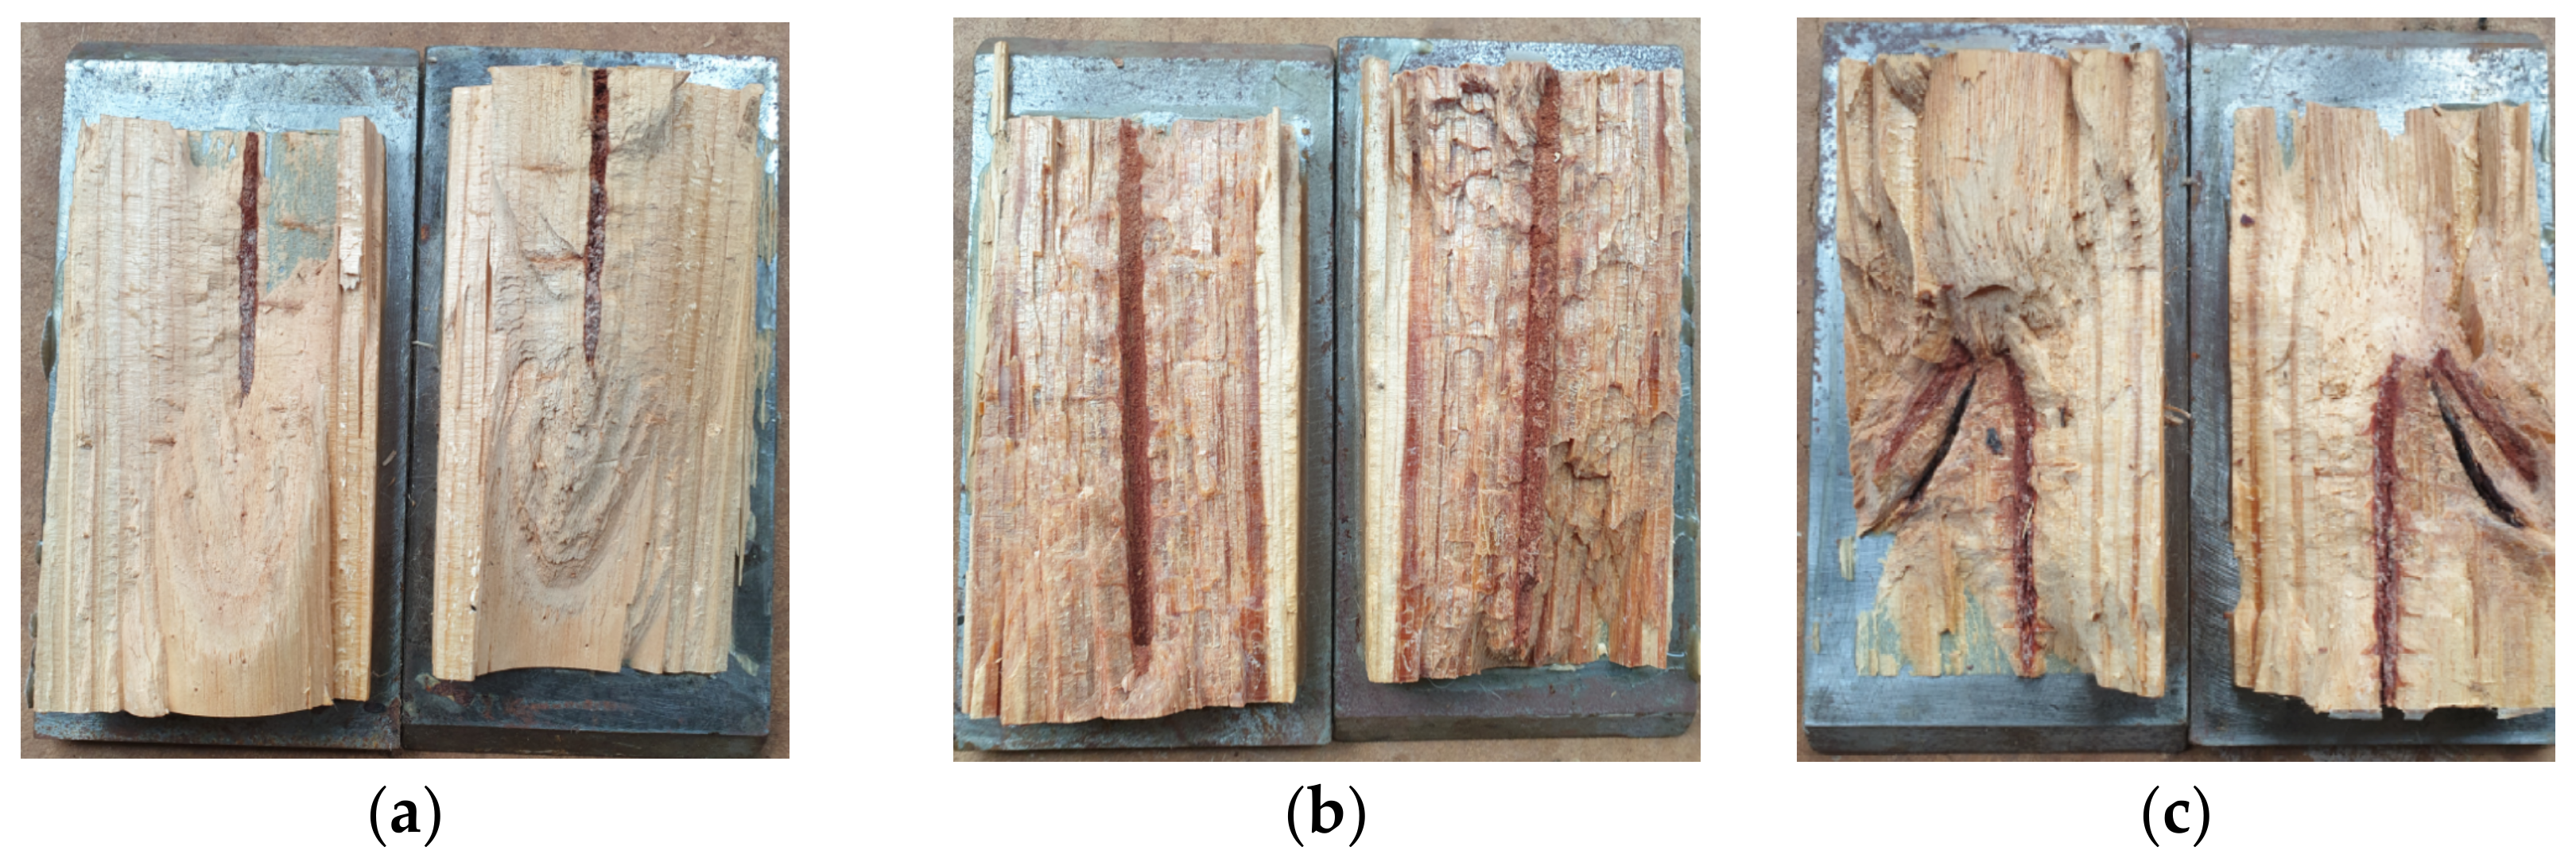
5.3.1. Failure Behaviour

CPerpG failures were typically ductile and showed a region of linear elastic behaviour followed by a slow but still increasing load resistance. Failure examples can be seen in Figure 18. Densification occurred under the load plates and shearing occurred in the cells along their edges. Longitudinal radial cracking was common and resin squeezed out of some knot and resin samples. All test samples failed for strength at 10% deformation before reaching ultimate failure load.

5.3.2. Structural Performance

The CPerpG MOE is low compared to other similar pines. Clear samples are on average 47% less in CPerpG MOE than low-grade radiata [44] and 67% lower than slash pine [45]. CPerpG strength of clear samples is low compared to other young and lo- grade and mid-range compared to average populations of similar pines (Table 3). Knot samples achieved the highest performance. Interestingly, the examples in Table 3 of young and low-grade in Section 3 performed as well as and better than the average populations of similar pines in Section 4 for CPerpG strength. The MOE and strength in CPerpG are reported in Table 2 and illustrated in Figure 19.
The CPerpG MOE/bending MOE ratios of clear samples are low compared to other young or low-grade and average populations of similar pines at 38% and 49% less, respectively, meaning this resource does not have good CPerpG MOE relative to its bending MOE. Knot samples on the other hand do have good performance with 22% and 1% higher, respectively. This higher knot performance can be explained by the deviated grain around knots and the branch wood providing some resistance in the direction of the load. There are limited data available in the literature for CPerpG MOE and an alternative is to use the relationship of CPerpG MOE/longitudinal MOE = 1/30 [63,64]. Longitudinal MOE is approximately 10% higher than bending MOE [36] and using this model, the clear samples in this study performed 8% higher in CPerpG MOE than the model predicted; however, comparing results of other studies, this model is consistently conservative.
The CPerpG strength/bending MOE ratio for clear samples is low compared to young or low-grade similar pines at 24% lower, but is mid-range and 16% higher than population averages of similar species. Knots with their deviated grain and branch wood offering support in the load direction were 91% and 190% higher, respectively. CPerpG strength ratio seen in this and other studies support the theory that the high microfibril angle of juvenile wood is important for transverse direction mechanical properties [18] with young and low-grade fibre showing better performance relative to bending MOE. It must be taken into consideration that some of these studies use different test methods for CPerpG property measurement and that these variations are known to give different results [44,65,66].

5.3.3. Effect of Resin

Comparing clear and resin samples shows a significant difference for both MOE (p = 0.04) and strength (p = 0.009). With an average RAR of 0.6 (0.6 median), resin achieved on average 12.2% (13.2% median) and 15.8% (17.4% median) higher CPerpG average MOE and strength than clear (Figure 19 and Table 2). This is less than that seen by Grabner, et al. [34] where performance reached as high as double that of extracted larch but their sample size was very small. Despite these higher MOE and strength values, Figure 20 shows no clear trend or correlation between increasing RAR and increasing MOE or strength. Extractives provide reinforcement from within the cell walls and lumen [35] to resist failure which initiates as cell wall buckling at the weakest cells with the thinnest walls and largest lumen [67]. Not all lumen are inundated with resin and Grabner, et al. [34] found that it was the empty tracheids that limited CPerpG strength implying the resin filled lumen provide more support, so without continuity of the resin-filled lumen, their benefit is diminished. Nonetheless, Hernandez [62] found that extractives within the cell lumen do not contribute to variation seen in CPerpG properties. The theory of empty tracheids limiting CPerpG strength would help explain the lack of relationship between RAR and CPerpG performance while cell wall resin providing resistance to crushing would explain the higher results in the resin samples; however, further studies are required.

5.3.4. Effect of Knots

Knots had an average KAR of 44% (40% median) and were significantly different to clear samples for MOE (p < 0.001) and strength (p < 0.001). Knots achieved high performance with 54.1% (58.0% median) and 94.9% (88.5% median) higher average MOE and strengths compared to clear (Figure 19 and Table 2). Figure 20 shows there is an increasing trend for MOE and strength with increasing KAR but the R2 values are low at less than 0.2. The variations in knot shapes and geometry would help explain this low correlation.

5.3.5. Effect of Pith

Separating the pith from no-pith samples in Figure 21 and Table 2 showed a mix of higher and lower performance. Clear samples with pith are on average 12.6% (+15.5% median) higher in MOE but not significantly different (p = 0.141.) and on average 21.2% (+24.2% median) higher in strength which is significantly different (p = 0.027). Resin samples with pith are on average 9.4% (−14.9% median) lower in MOE and 7.8% (+8.1% median) higher in strength, neither of which are significantly different (p = 0.231 MOE and p = 0.291 strength). There is much less latewood than earlywood in corewood, but with its smaller cell lumen and thicker cell walls, latewood resists buckling and crushing failure more than early wood [67]. The tighter radius growth rings in the pith samples contribute to the higher strength in clear and resin samples because the latewood acts as a pillar and protects the weaker earlywood from crushing [68] and from dependence on rolling shear properties which are weaker than CPerpG properties [36]. Kijidani, et al. [69] also found higher CPerpG strength values for pith samples in Sugi wood and although they could not conclude the reason, they did find correlations with high microfibril angle, increased density in the pith samples as well as cellular structure. The density for pith samples in this study is also consistently higher than non-pith samples (Table 2). Knots with pith are on average 23.1% (−22.7% median) less in MOE than without pith and significantly different (p = 0.003) and 10.8% (−12.6% median) less in strength and not significantly different (p = 0.217). This decrease in performance in knot samples with pith is potentially associated with the connection of the conical-shaped knot wood spearing into the weak pith.

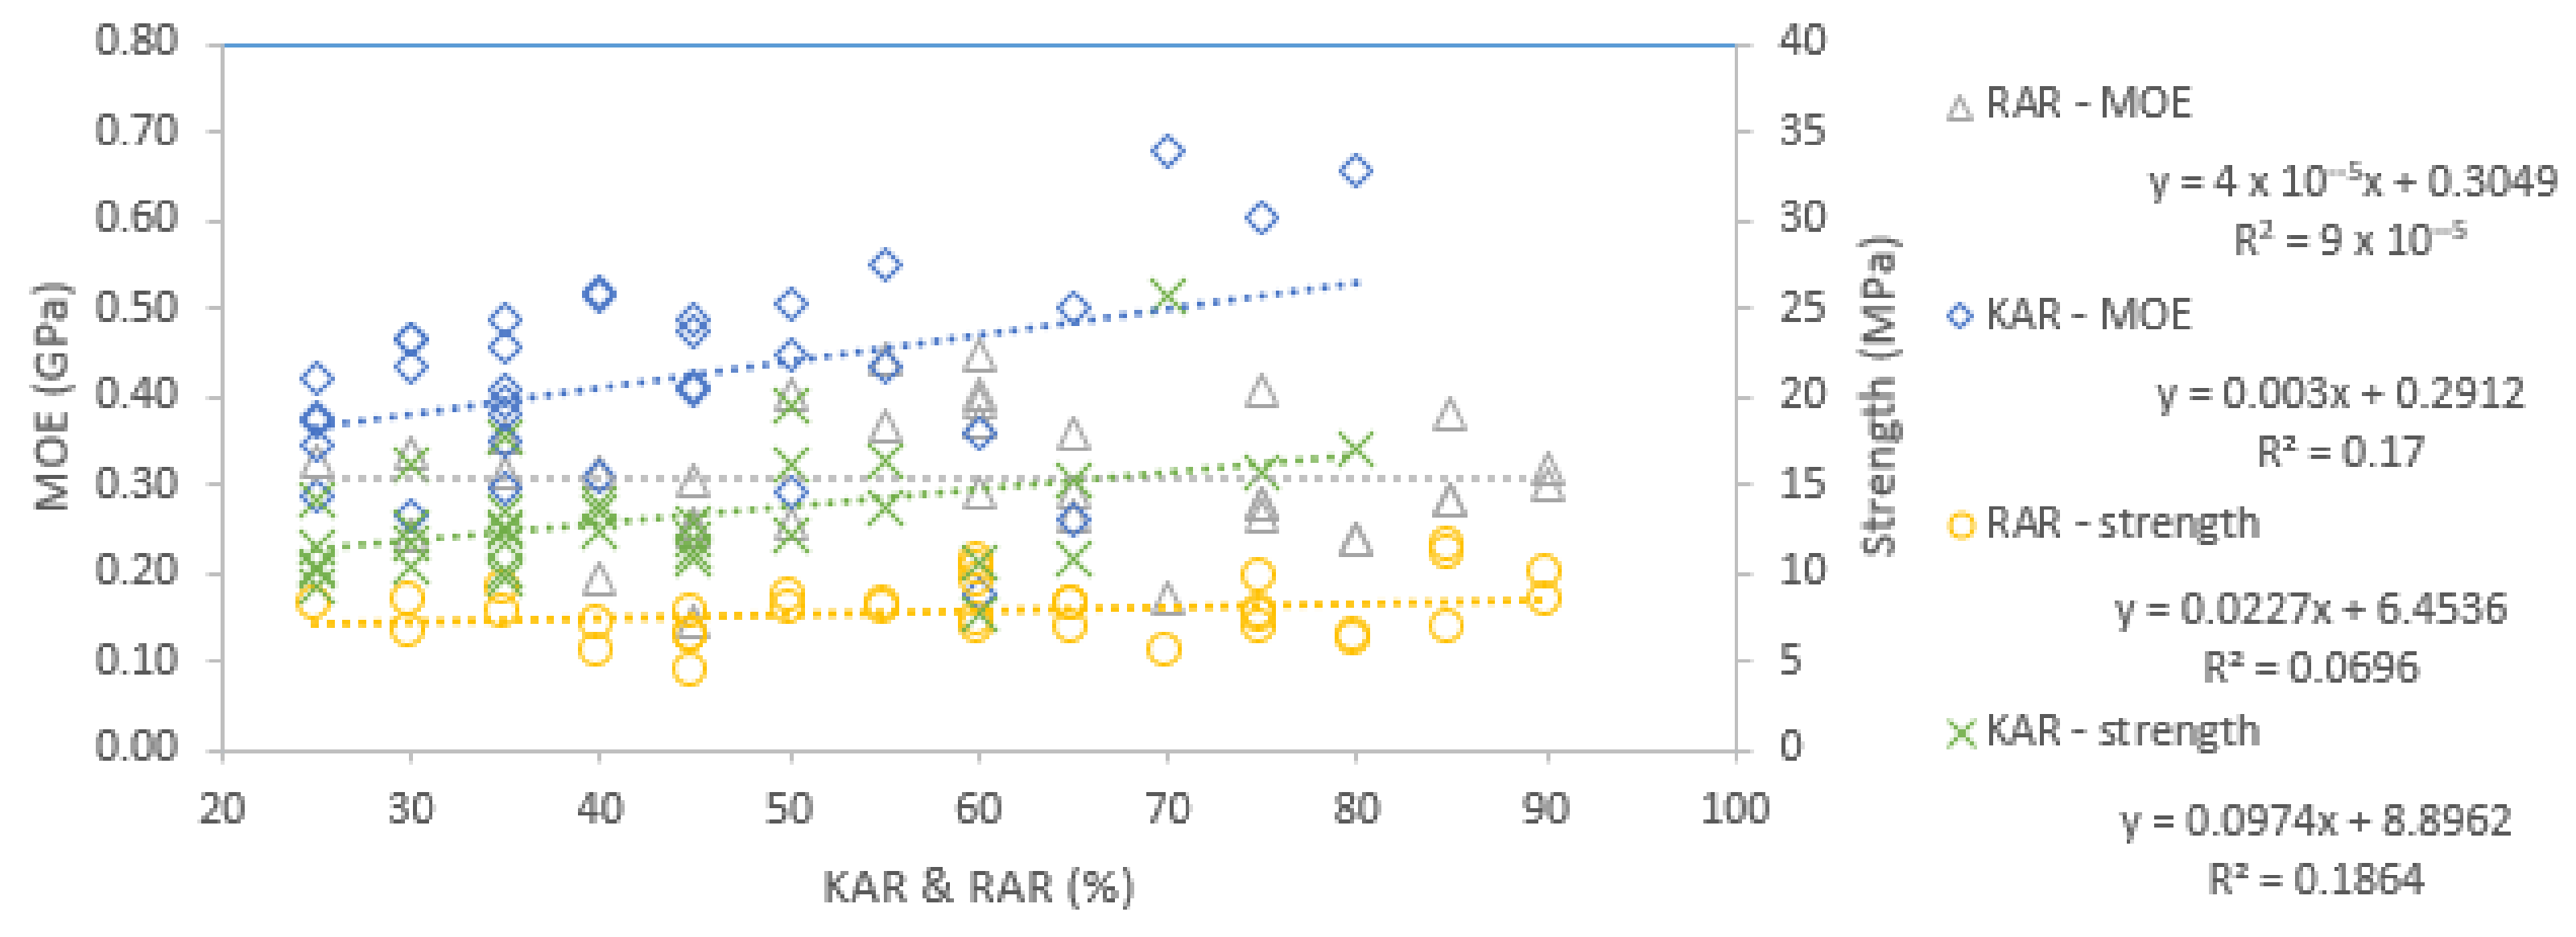
5.3.6. Relationship of Density and CPerpG

Density was a better indicator of increasing CPerpG strength than CPerpG MOE. When all sample types are combined, the R2 is 0.31 for strength while for clear, resin and knots individually, R2 values range between 0.17 and 0.22. The R2 for MOE are low and range between 0.002 and 0.19. The relationship between density and CPerpG strength for softwoods by Forest Products Laboratory [36] overpredicted the CPerpG strength for all sample types showing this resource has high density relative to CPerpG strength. There is an increasing trend in MOE with increased density for clear but no obvious trend can be seen in resin and knot samples, whereas all samples types show an increase in strength. At their average densities, clear and knot samples were 20% and 30% higher, respectively, in strength than the density/CPerpG strength relationships given by Forest Products Laboratory [36]. Resin was 20% lower.

5.3.7. Relationship of CPerpG MOE and Strength
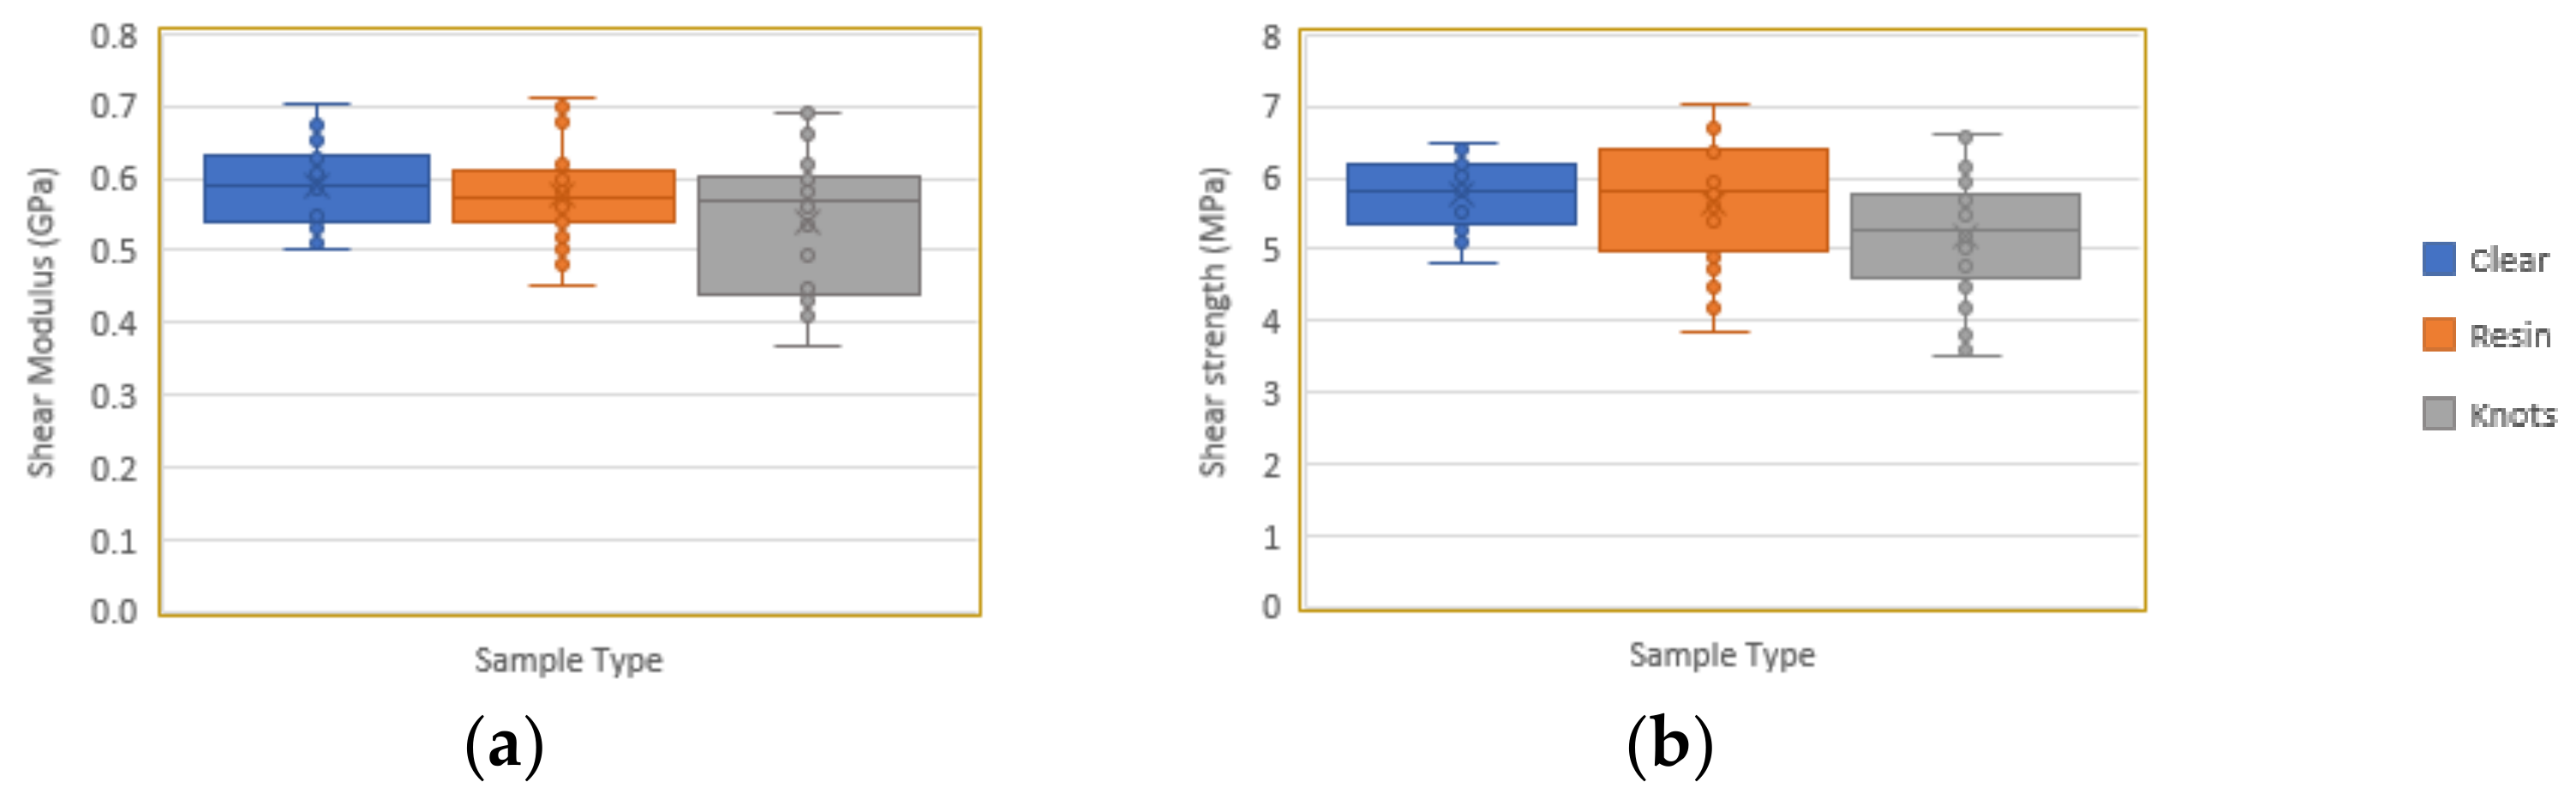
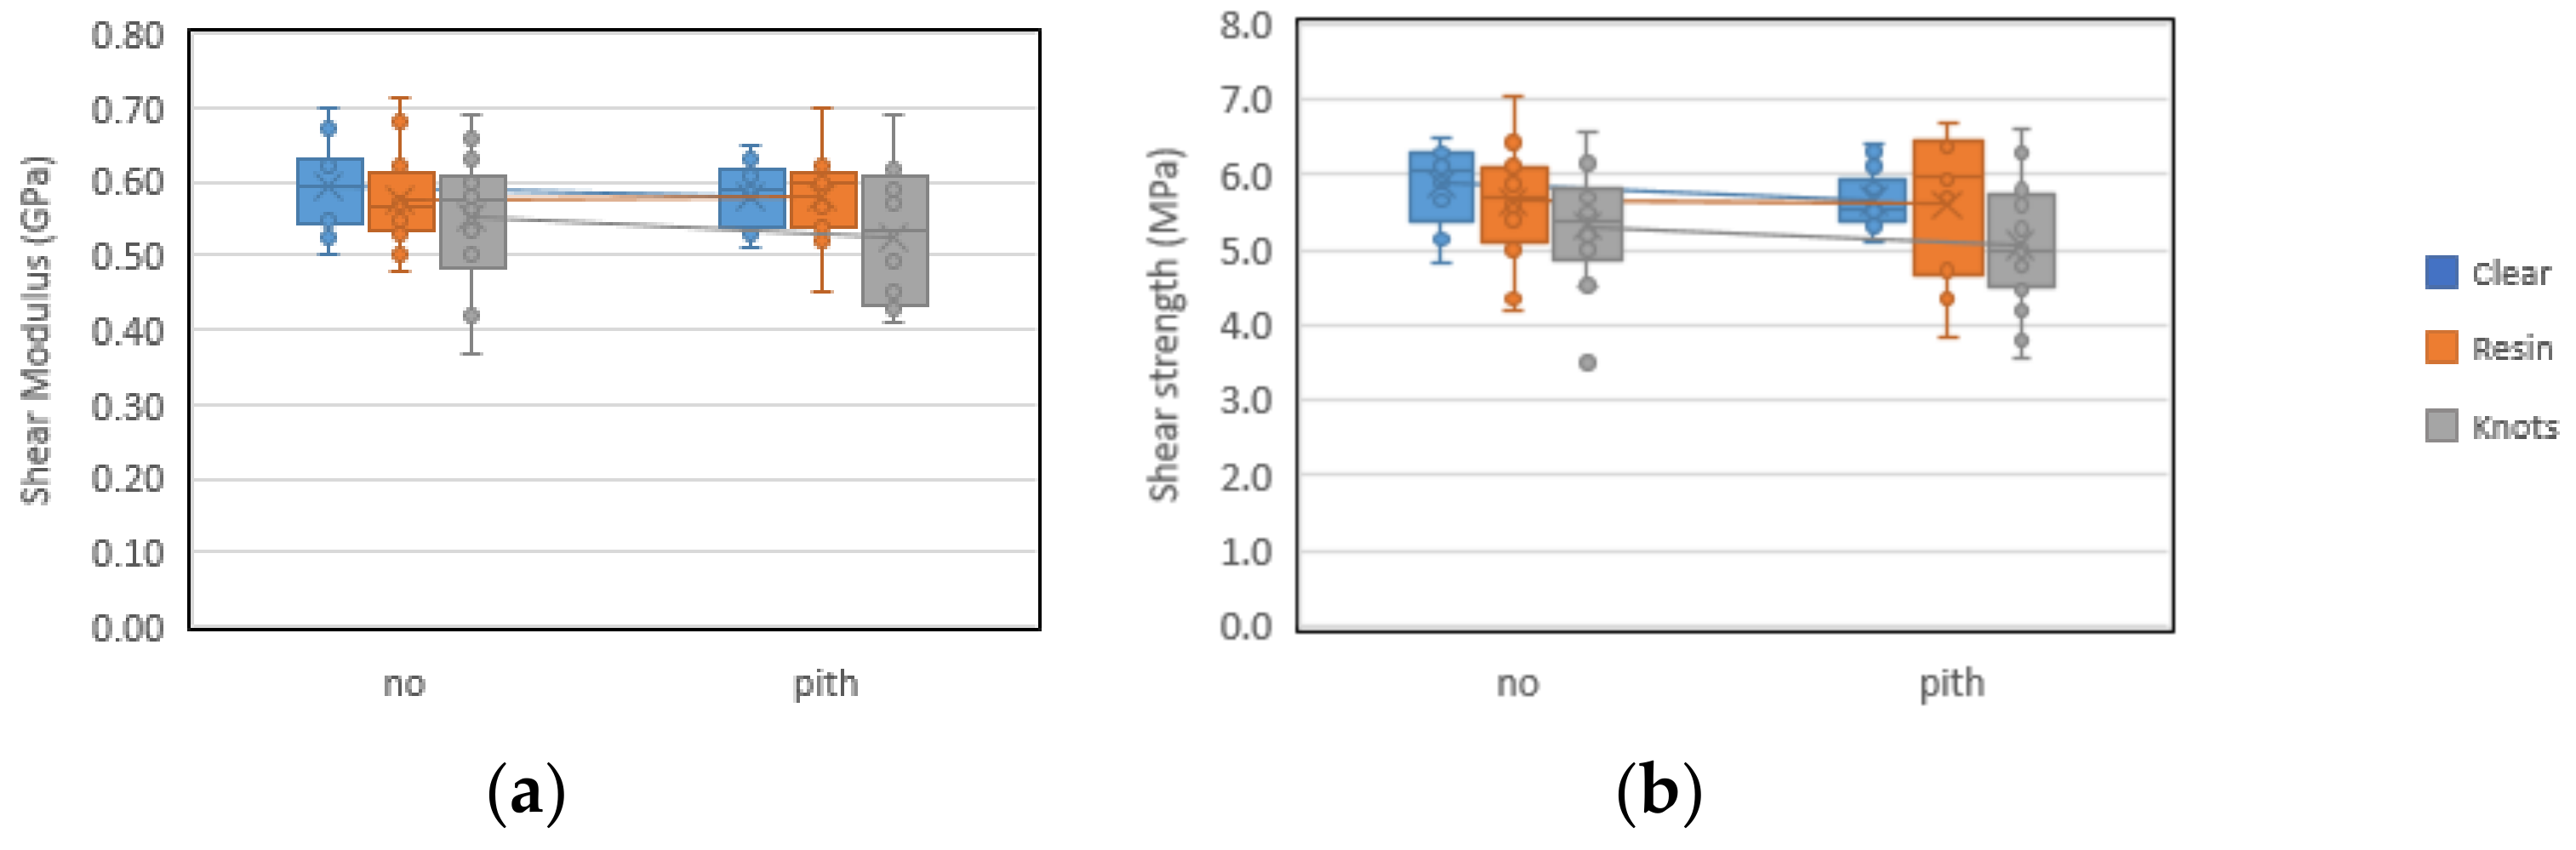
CPerpG MOE is a good indicator and describes 70% of CPerpG strength when all sample types are combined as can be seen in Figure 22. The no-pith samples have the strongest correlation between MOE and strength with R2 of 0.80. All sample types increase in CPerpG strength with increasing MOE.

5.4. Shear

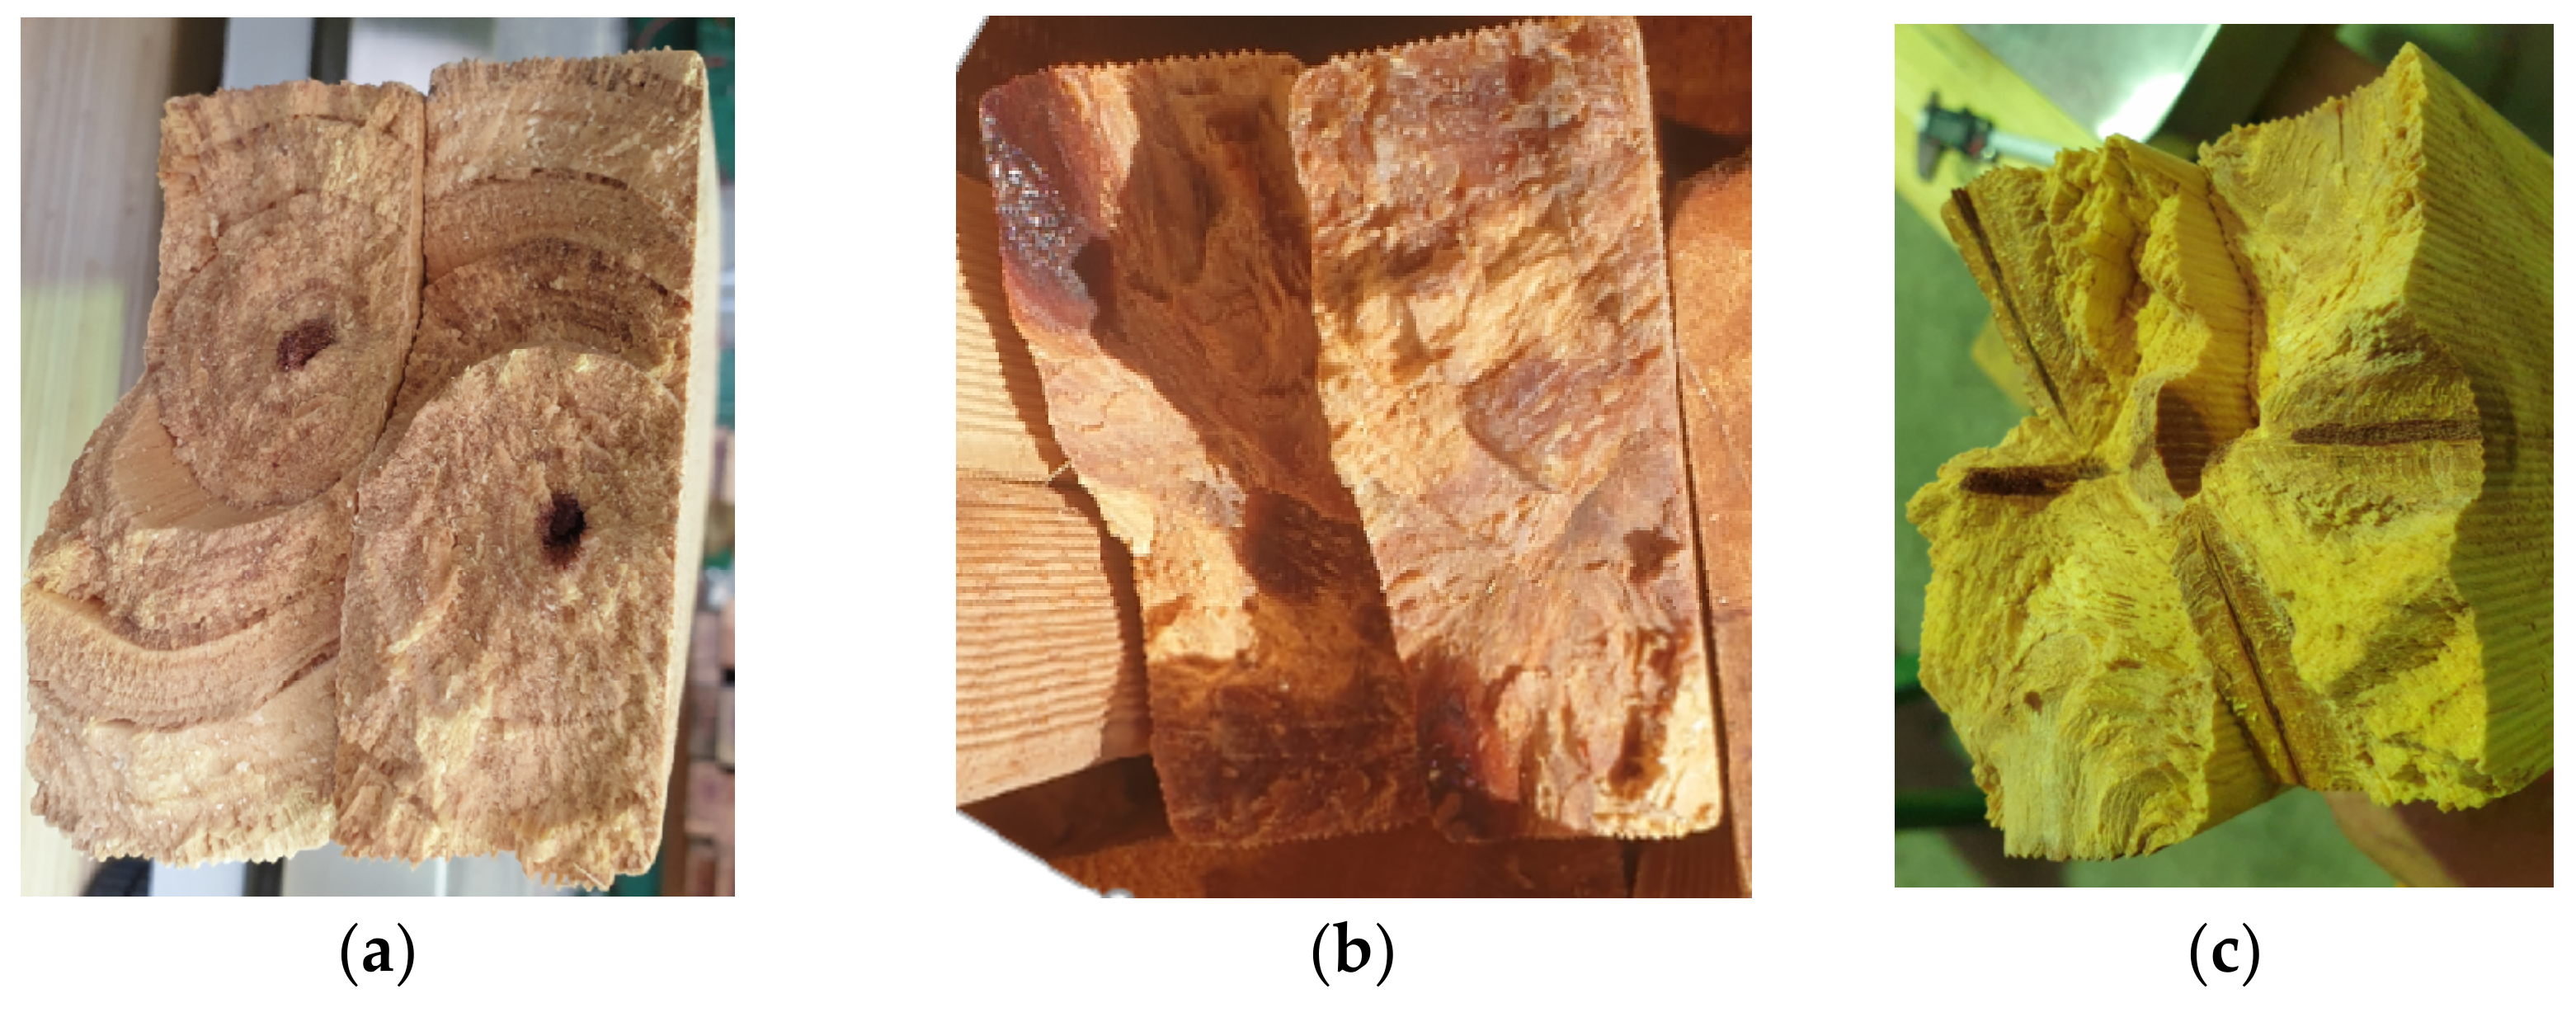
5.4.1. Failure Behaviour

The shear samples showed linear elastic behaviour up to brittle failure. Typical shear failures are shown in Figure 23. Separation at the transition between early and latewood was frequently observed. Li, et al. [70] also described this as one of the major failures for shear in Larix kaemferi. Pith was exposed in the shear failure plane of all samples that contained pith showing its poor strength in longitudinal shear. This may also be associated with the wood rays that radiate out from the pith and are known to be structural weak points [71].

5.4.2. Structural Performance

The shear modulus and shear strength are both low compared to young, low-grade and average populations of similar pines. Clear samples are on average 36% less than grade 3 Southern Yellow Pines [54] in shear modulus. Clear samples are 31% less on average than the young slash and loblolly [42] and 49% less on average that average populations of similar pines in shear strength (Table 3). The results of the shear modulus and shear strength tests are reported in Table 2 and illustrated in Figure 24.
The shear modulus/bending MOE ratio for clear samples is within the lower range compared to other similar pines at 9% lower than Grade 3 southern yellow pine found by Doyle and Markwardt [37], 27% less than the average population of slash but similar to the average loblolly population at 4.9% higher [36]. There are few data available for shear modulus of similar pines and an alternative option is to use the relationship of shear modulus/bending MOE = 1/15 [12]. Compared to this model, this resource is 26% higher in shear modulus relative to bending MOE and knots are 49% higher showing knots have a higher impact on bending MOE than shear modulus. The shear strength/bending MOE ratio of clear samples is low at 40% and 18% less than young and low-grade and population averages of similar species, respectively, but still within the range seen in these populations. Knots performed slightly better at 31% and 5% less, respectively. These results do not confirm those of Xavier, et al. [72] who found good shear modulus performance in the corewood zone and Muller, et al. [73] who found high MFA and compression wood in corewood increased shear modulus and shear strength.

5.4.3. Effect of Resin

Comparing clear and resin samples shows there were no significant differences for shear modulus (p = 0.467) or shear strength (p = 0.402). With an average RAR of 0.59 (0.58 median), resin is on average 1.8% (−2.6% median) less in shear modulus and 2.6% (+0.3% median) less in shear strength than clear. Figure 25 shows no clear trend or correlation between increasing RAR and increasing shear modulus or shear strength. Li, et al. [70] found shear strain occurred in the earlywood which led to a majority of shear failures within the earlywood zone. They found density, MFA and cell wall thickness were highly influential and that earlywood failed by the tearing of the cell walls in the direction of the microfibril angle, whereas latewood shear failure was between the cells. Keunecke, et al. [74] predicted that extractives would improve shear properties; however, the results of this study do not show this. Nevertheless, the lower 5th percentile and higher standard deviation (Table 2) of shear strength in resin samples compared to clear may indicate the presence of undetected damaged fibre in the form of shake within the samples. Shake is often associated with resin streaking and is well known to reduce shear performance [75].

5.4.4. Effect of Knots

Comparing clear and knot samples shows a significant difference for both shear modulus (p = 0.012) and shear strength (p = 0.001). Knots had an average KAR of 0.49 (0.45 median) and are on average 8.5% (−3.4% median) less and 10.3% (−9.3% median) less than clear shear moduli and shear strength, respectively. Figure 25 shows there is a decreasing trend between KAR and shear modulus and shear strength but the R2 values are low at less than 0.2. This low correlation may be attributed to the variation in knot characteristics. Doyle and Markwardt [37] found little difference in shear modulus between different grades containing various defects including knots. Chui [76], Gupta, et al. [77], Rajput, et al. [78] and Cao, et al. [79] all found knots could have a negative or positive impact on structural performance depending on the characteristics of the knot. Gupta, et al. [77] concluded that the difference in shear strength due to a knot is not significant. In these studies, sound knots tended to be higher and unsound knots lower in shear modulus and shear strength when compared to clear defect-free timber. These studies focused on through knots that had face-to-face branch wood which is a hard and brittle material which provides shear resistance through the sample [76]. The corewood researched in this study has conical-shaped knots often occurring as knot clusters and connecting to the pith within the samples at high angles (Figure 23). These characteristics would mean knots in corewood would not necessarily provide the benefit of this face-to-face continuity and shear support. Cao, et al. [79] found that branch wood pith was weak in shear and was often where cracks occurred. The high angle of the knots in this resource place the weak pith of branch wood as well as the branch to trunk transition zone closer aligned to that of the log pith and to the alignment with the shear plane. This resulted in frequent shear failure planes through the pith of the log, pith of the branch wood and at the connection of branch to pith as seen in Figure 23. This helps explain the lower performance of knots compared to clear samples seen in this study.

5.4.5. Effect of Pith

Separating the pith from the no-pith samples in Figure 26 showed no significant differences for clear (p = 0.870 shear modulus and p = 0.051 shear strength), resin (p = 0.727 shear modulus and p = 0.905 shear strength) or knots (p = 0.456 shear modulus and p = 0.405 shear strength). Clear with pith is on average 2.5% (−0.4% median) less and 3.8% (−8.6% median) less than clear without pith in shear modulus and shear strength, respectively. Resin with pith is on average 1.4% (+6.4% median) higher and 0.7% (+4.9% median) less in shear modulus and shear strength and knots with pith are on average 4.6% (−7.4% median) less and 4.8% (−8.0% median) less in shear modulus and shear strength, respectively, than without pith.

5.4.6. Relationship of Density and Shear

Density is a poor indicator of shear modulus and shear strength for all sample types separately and in combination with an R2 of less than 0.04. Muller, et al. [73] found adding density to regression equations increased the explained variability in shear modulus and shear strength in Larch but only by 10%. In this study, only the clear samples show any trend of increase in shear modulus and shear strength with increase in density, but this was small and the correlation is poor. The relationship of density to shear strength published in Forest Products Laboratory [36] over predict shear strength showing this resource has high density relative to its shear strength.

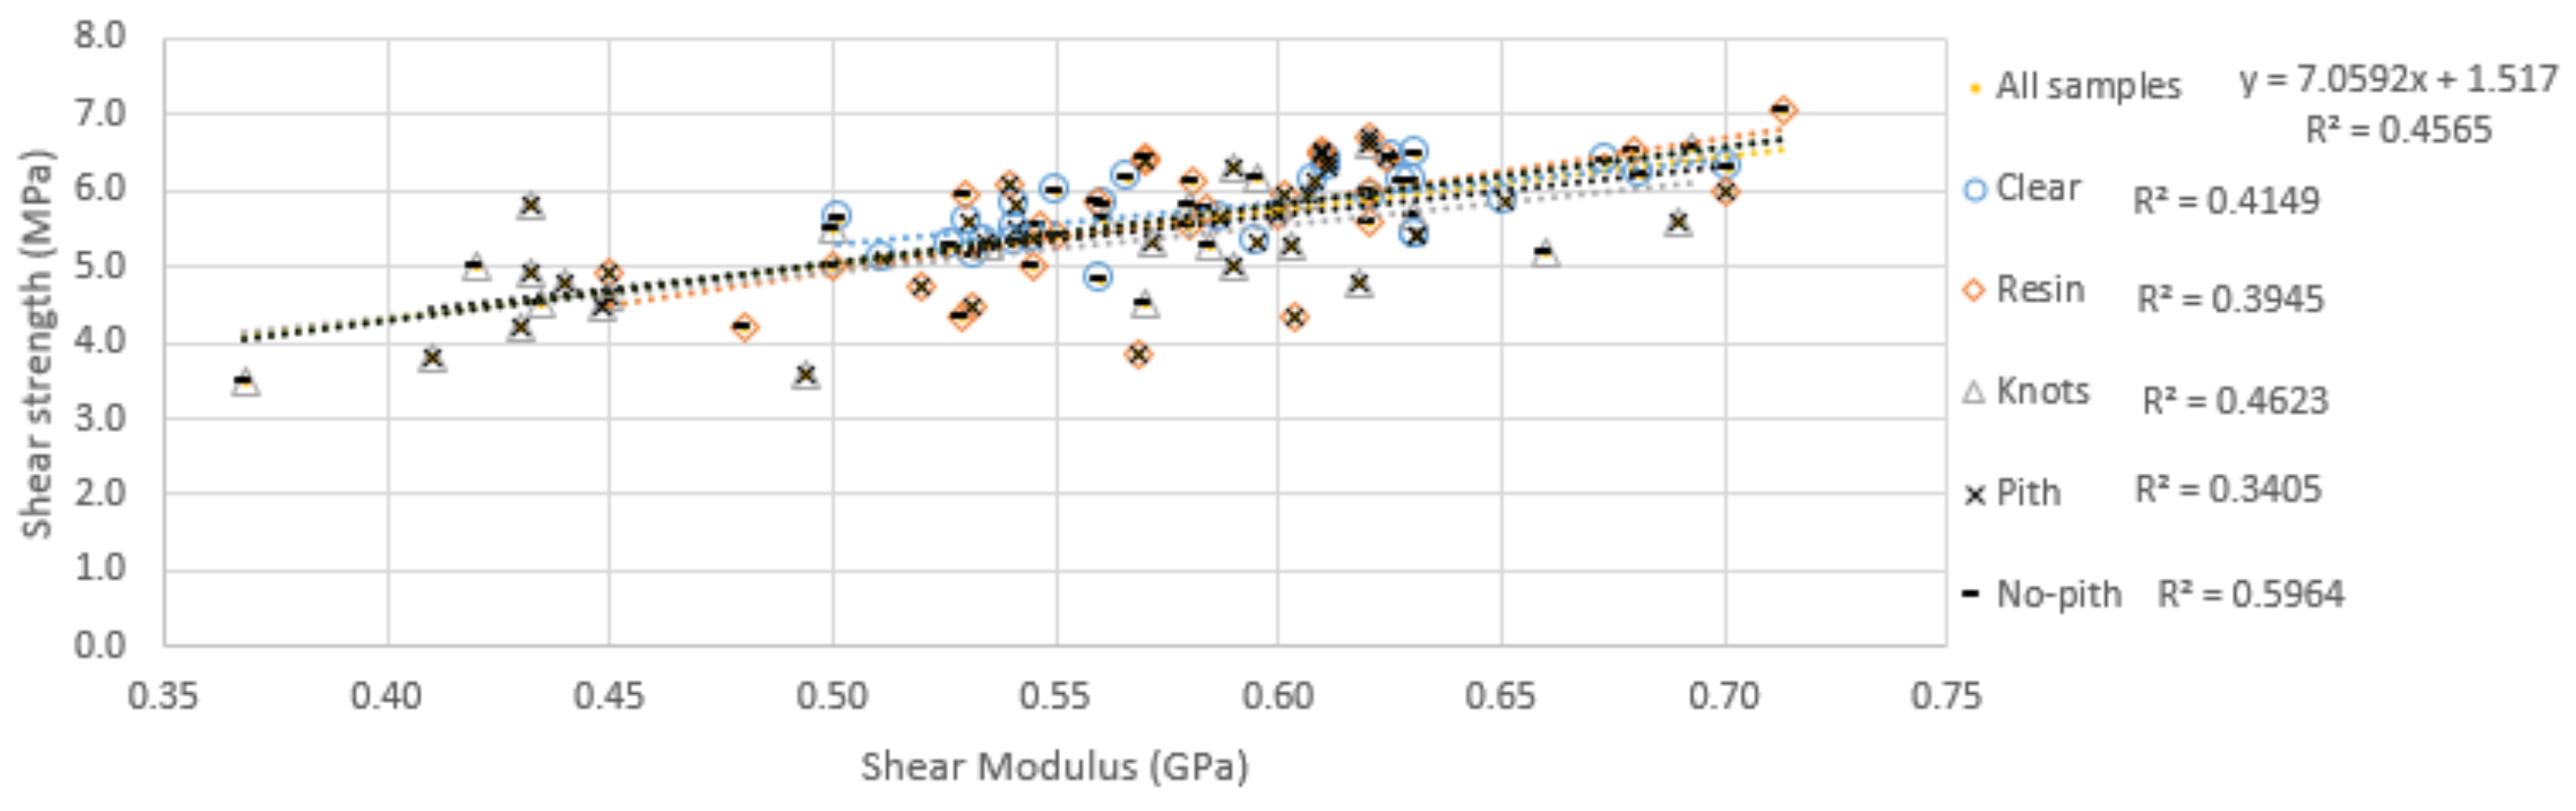
5.4.7. Relationship of Shear Modulus and Shear Strength

Shear modulus is a moderate indicator for shear strength describing 45.6% of shear strength for all samples types combined as can be seen in Figure 27. Muller, et al. [73] found a stronger relationship between shear modulus and shear strength for Larch with R2 of 0.73. The no-pith samples have a higher correlation than the pith sample type.

5.5. Tension

5.5.1. Failure Behaviour

All tension samples had brittle failure with clear and resin samples showing failure both transverse and along the grain directions with separation between early and latewood boundaries. Typical failures can be seen in Figure 28. Bodner, et al. [71] and Galicki and Czech [80] experienced the same types of failure in their testing including separation at the earlywood–latewood boundaries. Bodner, et al. [71] found that wood rays were structurally weak and were frequently the location of either initiation or discontinuity of fractures under tensile load. The knot samples failed in the deviated grain around the knots and frequently through the pith of the branch wood. The majority of clear and resin samples failed at defects within the clamped area rather than within the test span. This left only 11 clear and 10 resin samples that could be considered representative of the clear wood fibre.

5.5.2. Structural Performance

The tension strength of clear samples are on average 253% and 71% higher than slash and loblolly at 15 years and 19 years, respectively [42]. However, compared to the average population of loblolly [45] clear samples are 60% less in tension strength which is slightly lower than the ratio range of 0.5 to 0.95 of juvenile to mature wood for tension strength [36]. This higher performance compared to other young pines can be explained by the clear samples having no defects other than pith however the knot samples still performed on average 71% better than 15-year-old and only 17% less than 19-year-old loblolly (Table 3). The results of the 11 clear, 10 resin and 35 knot tension strength tests are reported in Table 2 and illustrated in Figure 29.
The tension strength/bending MOE ratio is high compared to young and low-grade similar species at 4 times that of grade 3 Southern Yellow Pine researched by Doyle and Markwardt [37] and 51% higher than juvenile wood in loblolly [43] showing it has good tension strength for equivalent bending MOE. Nonetheless, these studies were on timber containing defects such as knots but looking at the knot samples, they are still on average 225% higher than grade 3 southern pine but more aligned with the juvenile loblolly at 6% less. A comparison with clear wood from the average population of loblolly [36] shows the clear sample ratio is low at 28% less. Of all the ratios given, the knot samples ratio has the largest reduction at 37% lower than clear samples reiterating that knots have a larger negative impact on axial tension than on compression, bending [36,37] and shear.

5.5.3. Effect of Resin

Comparing the clear and resin samples shows that there is no significant difference (p = 0.893). With an RAR of 0.58 (0.57 median), resins are on average 0.6% (−2.9% median) higher than the clear samples (Table 2 and Figure 29). Zhao, et al. [48] found pine containing extractives was 23% stronger in tension than unextracted pine and they attribute this reduced performance to the reduction in density resulting from the extraction processes. Nevertheless, in their study the extraction processes removed not only extractives but also other components of the cell structure that would affect structural performance. Figure 30 shows a decreasing trend in tensile strength with increasing RAR but the correlation is low, and the sample number is small as only the 10 samples that failed within the test span were used for analysis.

5.5.4. Effect of Knots

Knots had an average KAR of 0.51 (0.50 median) and were significantly different to the clear samples (p ≤ 0.001) with average tension strength 51.6% less (−51.8% median). Mitsuhashi, et al. [81] and Nagai, et al. [82] had similar results with a reduction in tension strength on average for knots compared to clear wood of 56% and 53%, respectively. In this study, knots had a larger impact on axial tension strength than on CParG and bending which aligns with the literature [36,37]. Figure 30 shows that there is a decreasing trend in tensile strength with increasing KAR and that KAR is a moderate indicator of tensile strength.

5.5.5. Effect of Pith

Comparing pith and no-pith samples showed little effect for tension strength with no significant difference for clear (p = 0.769), resin (p = 0.649) or knots (p = 0.496). As seen in Table 2 and Figure 31, pith samples are on average 1.7% (+3.7% median) less, 3.8% (−2.0% median) more and 6.2% (−8.1% median) less for clear, resin and knots, respectively. Moody [83] found timber with pith to be 34% lower in tensile strength than timber without pith, although the non-pith samples also included mature wood which is known to be stronger than juvenile wood. Furthermore, Kretschmann and Bendtsen [43] found that the presence of juvenile wood rather than pith was an indicator of low-tensile-strength performance which aligns with the findings of this study in that samples with pith performed similar to those without and all samples would have contained juvenile wood given their close proximity to the pith.

5.5.6. Relationship of Density and Tension

Density is a poor indicator of tensile strength for all sample types separately and in combination with R2 of less than 0.06. There is a slight decreasing trend for increasing density for clear and resin samples which can be explained by the slightly lower tensile strength but increased density of pith samples. Doyle and Markwardt [54] also found low or no correlations. Nonetheless, Galicki and Czech [80] found tensile strength to be strongly dependent on density when loaded along the grain, however not at an angle to the grain. Krauss, et al. [84] found latewood increased in tensile properties the further from the pith and was correlated to wood density whereas earlywood tensile properties had little change and were not correlated with density. This out-of-grade PEE × PCH hybrid contains high content of earlywood as well as wandering pith and associated deviated grain, all of which help explain the lack of correlation between density and tensile strength seen in this study.

6. Overview

6.1. Structural Performance

Clear samples performed well in bending strength and tension strength, mid-range in bending MOE and CParG strength and low in all other properties when compared to other PEE × PCH hybrids and young and low-grade similar pines. In comparison to average populations of similar pines, bending strength and CPerpG were mid-range while all other properties were low. This is expected given the many characteristics of juvenile and corewood associated with low longitudinal properties [33] and that this resource was rejected during grading.
The ratios of structural properties to bending MOE are high for tensile strength, mid-range for bending and CParG strength and density but low for all other properties compared to other PEE × PCH and young and low-grade similar pines (Table 3). Compared to average populations of similar pines, the density to bending MOE ratio is high, shear modulus, CParG and CperpG are mid-range and all other properties are low. Knowing these structural properties and their relationships with an indicator property such as bending MOE allows for ease of grading in preparation for their design into building applications. This out-of-grade resource contains timber that would be a suitable substitute for the more expensive in-grade timber that exceeds the needs of low-stress structural applications such as internal layers in CLT. For example, inner layers in a five-layer CLT panel that experience low bending stresses.

6.2. Resin

With an overall average RAR of 0.58, resin was similar to clear for all test types and within a range of 98% to 116% of clear samples (Figure 32). The average density for resin samples is 727 kg/m3 which is 45% higher and is significantly different (p < 0.001) to the clear samples but only CPerpG MOE and strength performed significantly different in this study. Figure 33 illustrates the percentage differences in average density between clear and resin samples for each test type, the predicted percentage change in structural performance based on the relationships given by Forest Products Laboratory [36] where available and the actual percentage change in structural performance achieved. It is clear that density due to resin causes a large overestimation of structural performance in these predictive models, especially for CPerpG and CParG strength. There is moderate correlation between RAR and density with an R2 of 0.659 for all samples. It is important to consider this impact and remove density due to resin from these calculations or grade out resin where self-weight is critical. There are few data available in the literature on the impact of resin on structural properties of pine and how it affects predictive models.

6.3. Knots

All knot samples performed significantly different to clear samples for all test types and within a range of 48% to 196%. Knots performed higher in CPerpG MOE and strength and lower for all other test types (Figure 32). The increase in density of knot samples was nearly as high as the resin samples with an average of 703 kg/m3. Knot-associated resin streaking was common as seen by Nel, et al. [2] and this resin would have added to the density. Knots had the largest negative impact on tensile strength and largest positive impact on CPerpG strength.

6.4. Pith

Pith samples ranged between 76% and 121% of their non-pith counterparts (Figure 34) and not all were significantly different. CPerpG MOE was the only significantly different test type for pith versus non-pith knot samples, whereas bending MOE and bending strength were both significantly different for clear and resin. Additionally, CPerpG strength was significantly different for clear samples but not for resin or knots. Pith samples were consistently higher in density than non-pith samples.

6.5. Density

The average density for all clear samples in this study is 500 kg/m3 which is high compared to other research on PEE × PCH hybrids, young and low-grade and mid-range compared to average populations of similar pines (Table 3). Density is used as an indicator property to determine some strength values [36,64] and higher density is often associated with increased performance [55]. With the exception of CPerpG, change in density did not prove to be a good indicator for change in structural performance in this study for any sample type with all R2 values below 0.23. Moya, et al. [42], Mackes and Shepperd [85] and Missanjo and Matsumura [55] also found poor correlation between density and structural properties for juvenile wood.
The density/bending MOE ratio for clear samples is similar to other young PEE × PCH hybrid pines, on average 11% higher than other young and low-grade similar pines and 44% on average higher than other similar pines (Table 3) showing that this resource has high density for its bending MOE performance. High density relative to structural performance is not generally considered a positive outcome; however, it could provide benefit for applications where self-weight is not critical but acoustic performance is important.

7. Conclusions

This study evaluated the MOE and strength properties of out-of-grade PEE × PCH hybrid pine in bending, compression parallel to grain (CParG), compression perpendicular to grain (CPerG), shear and strength in tension. The structural performance and their ratio with bending MOE as an indicator property were compared to other PEE × PCH hybrids and young, out-of-grade and average populations of similar pines. The effect of resin, knots and pith on these mechanical properties and density were evaluated. Correlations between RAR, KAR, density and structural properties were established. Changes in density were used in published models to predict changes in structural properties and compared to actual results. From the extensive experimental tests and data analyses, the following conclusions can be drawn:
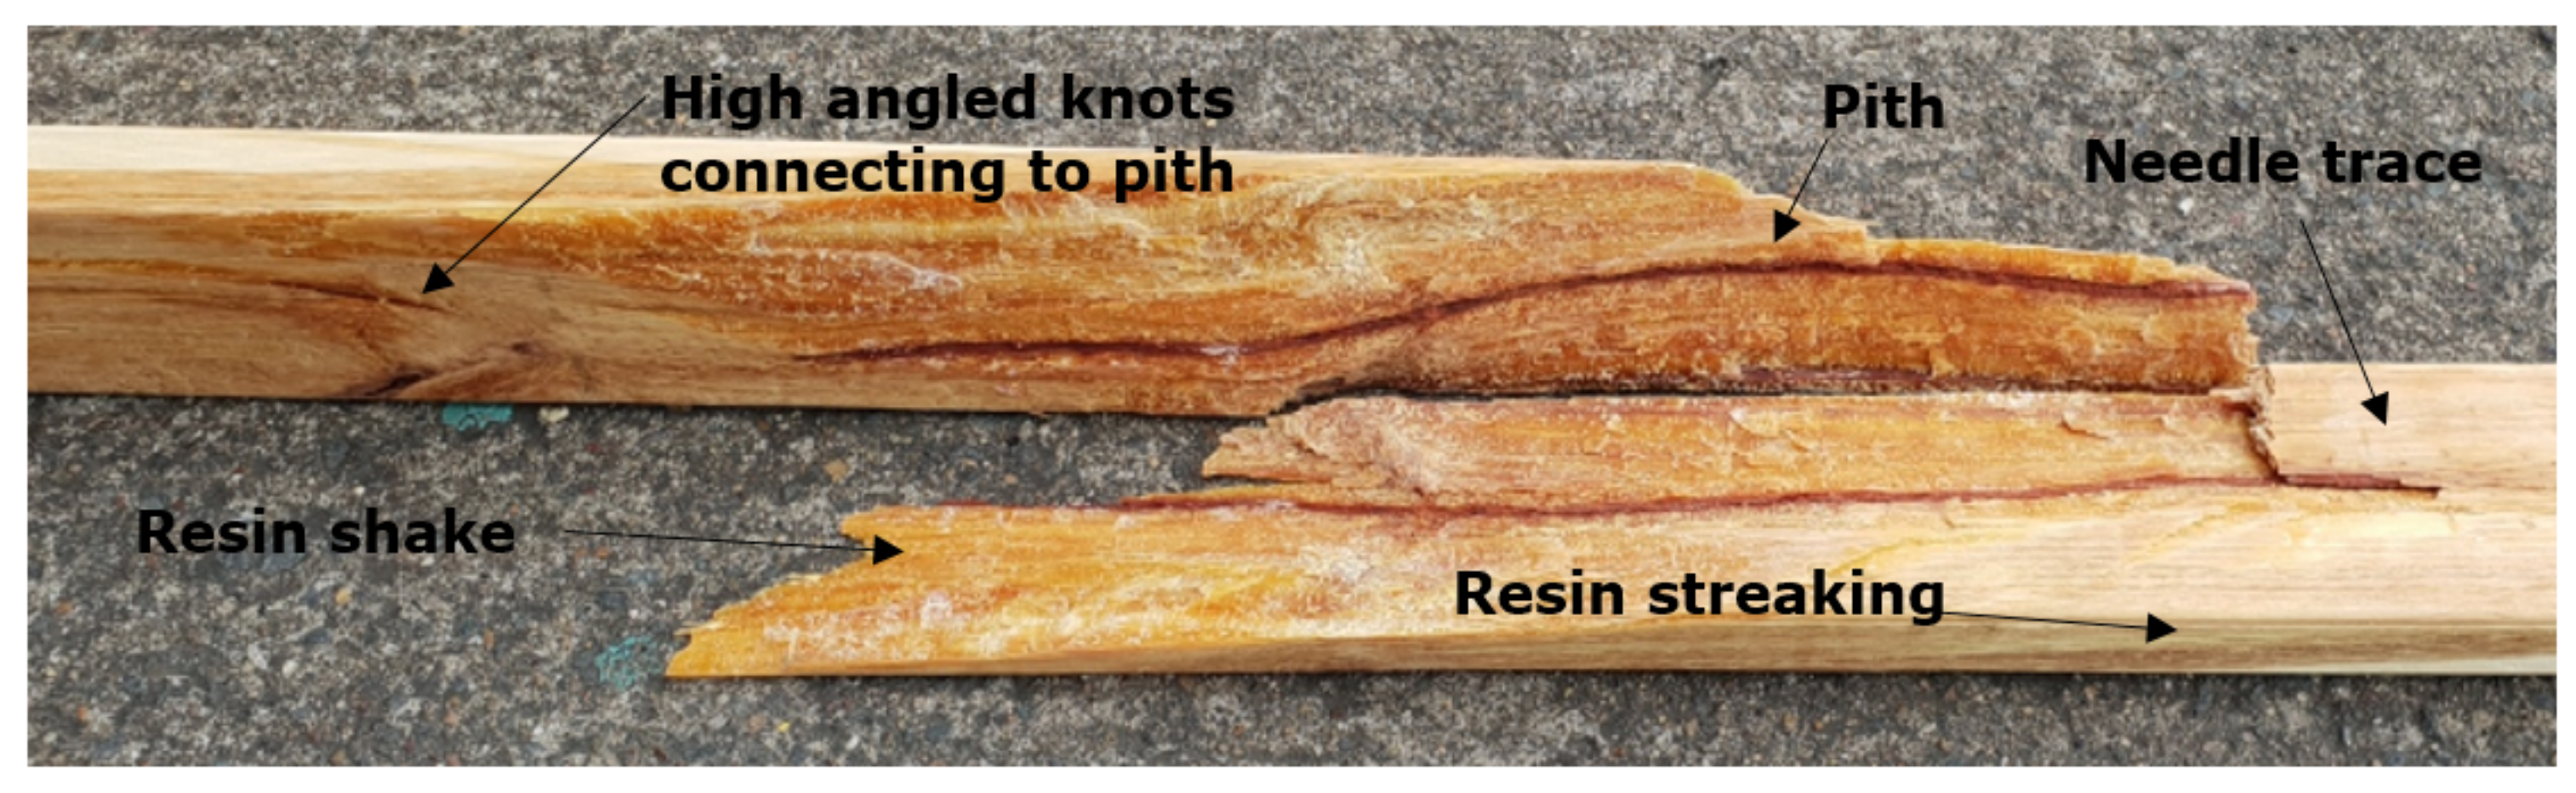
  • The out-of-grade PEE × PCH hybrids from the low-quality inner core of the tree are typically characterised with pith, high-angled clustered knots, resin streaking, resin shake, needle trace and tight-radius growth rings with high percentage of earlywood.
  • The clear timber in this resource performed well in bending strength (45.8 MPa) and tension strength (32.4 MPa), mid-range in bending MOE (6.9 GPa) and CParG strength (29.4 MPa) but poorly in CParG MOE (5.78 GPa), CPerpG MOE (0.27 GPa), CPerpG strength (6.7 MPa), shear modulus (0.59 GPa) and shear strength (5.7 MPa) compared to other PEE × PCH hybrids and young and low-grade similar pines. Bending strength and CPerpG strength were mid-range compared to average populations of similar pines, but all other structural properties were low which can be expected given the timber was out-of-grade and contains juvenile wood and pith.
  • The ratios of structural performance for clear samples to bending MOE revealed high tensile strength, mid-range bending and CParG strength, but all other structural properties were low relative to their bending MOE performance when compared to other PEE × PCH hybrids and young and low-grade similar pines. Shear modulus, CParG and CPerpG strengths were mid-range, and all other properties were low relative to their bending MOE performance when compared to average populations of similar pines.
  • The Poisson’s ratio of the pooled clear and resin samples was found to be 0.4365 which is similar to slash pines as one of its parent species.
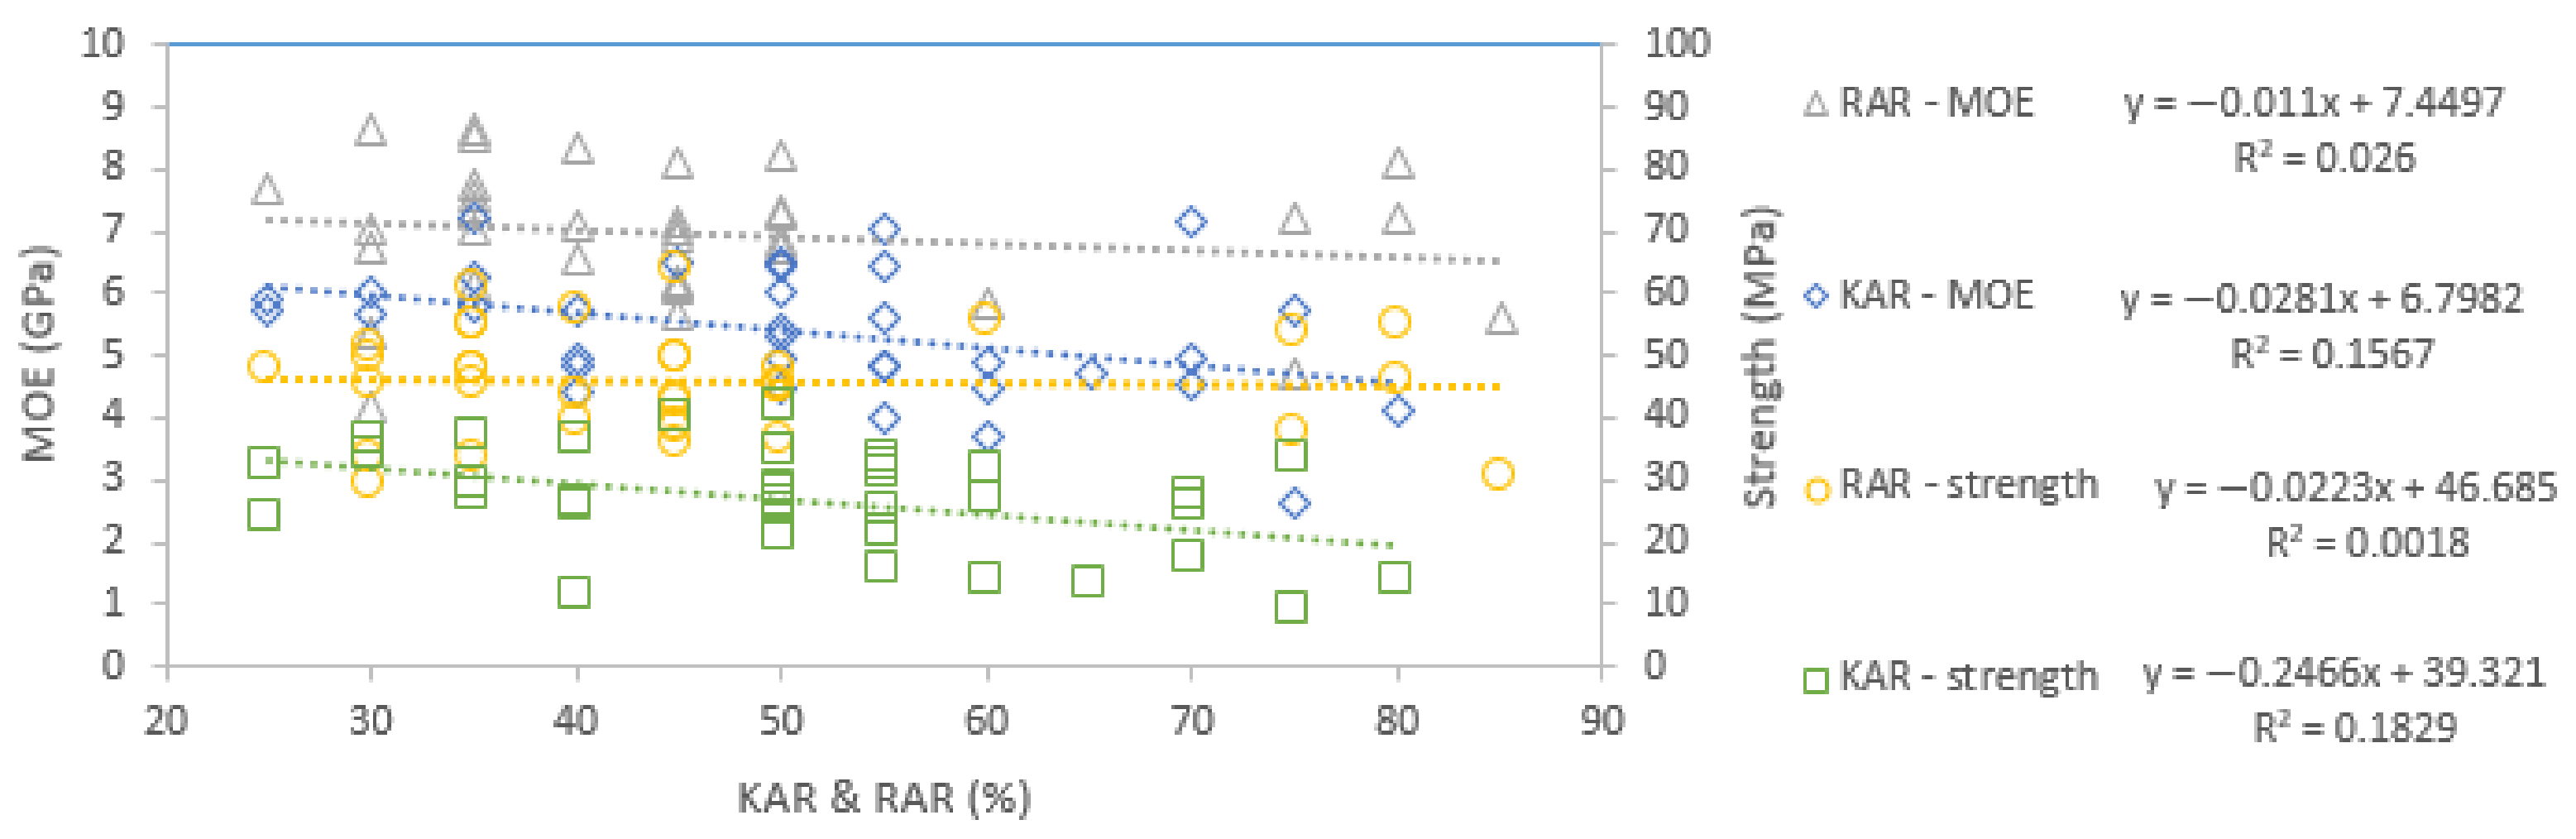
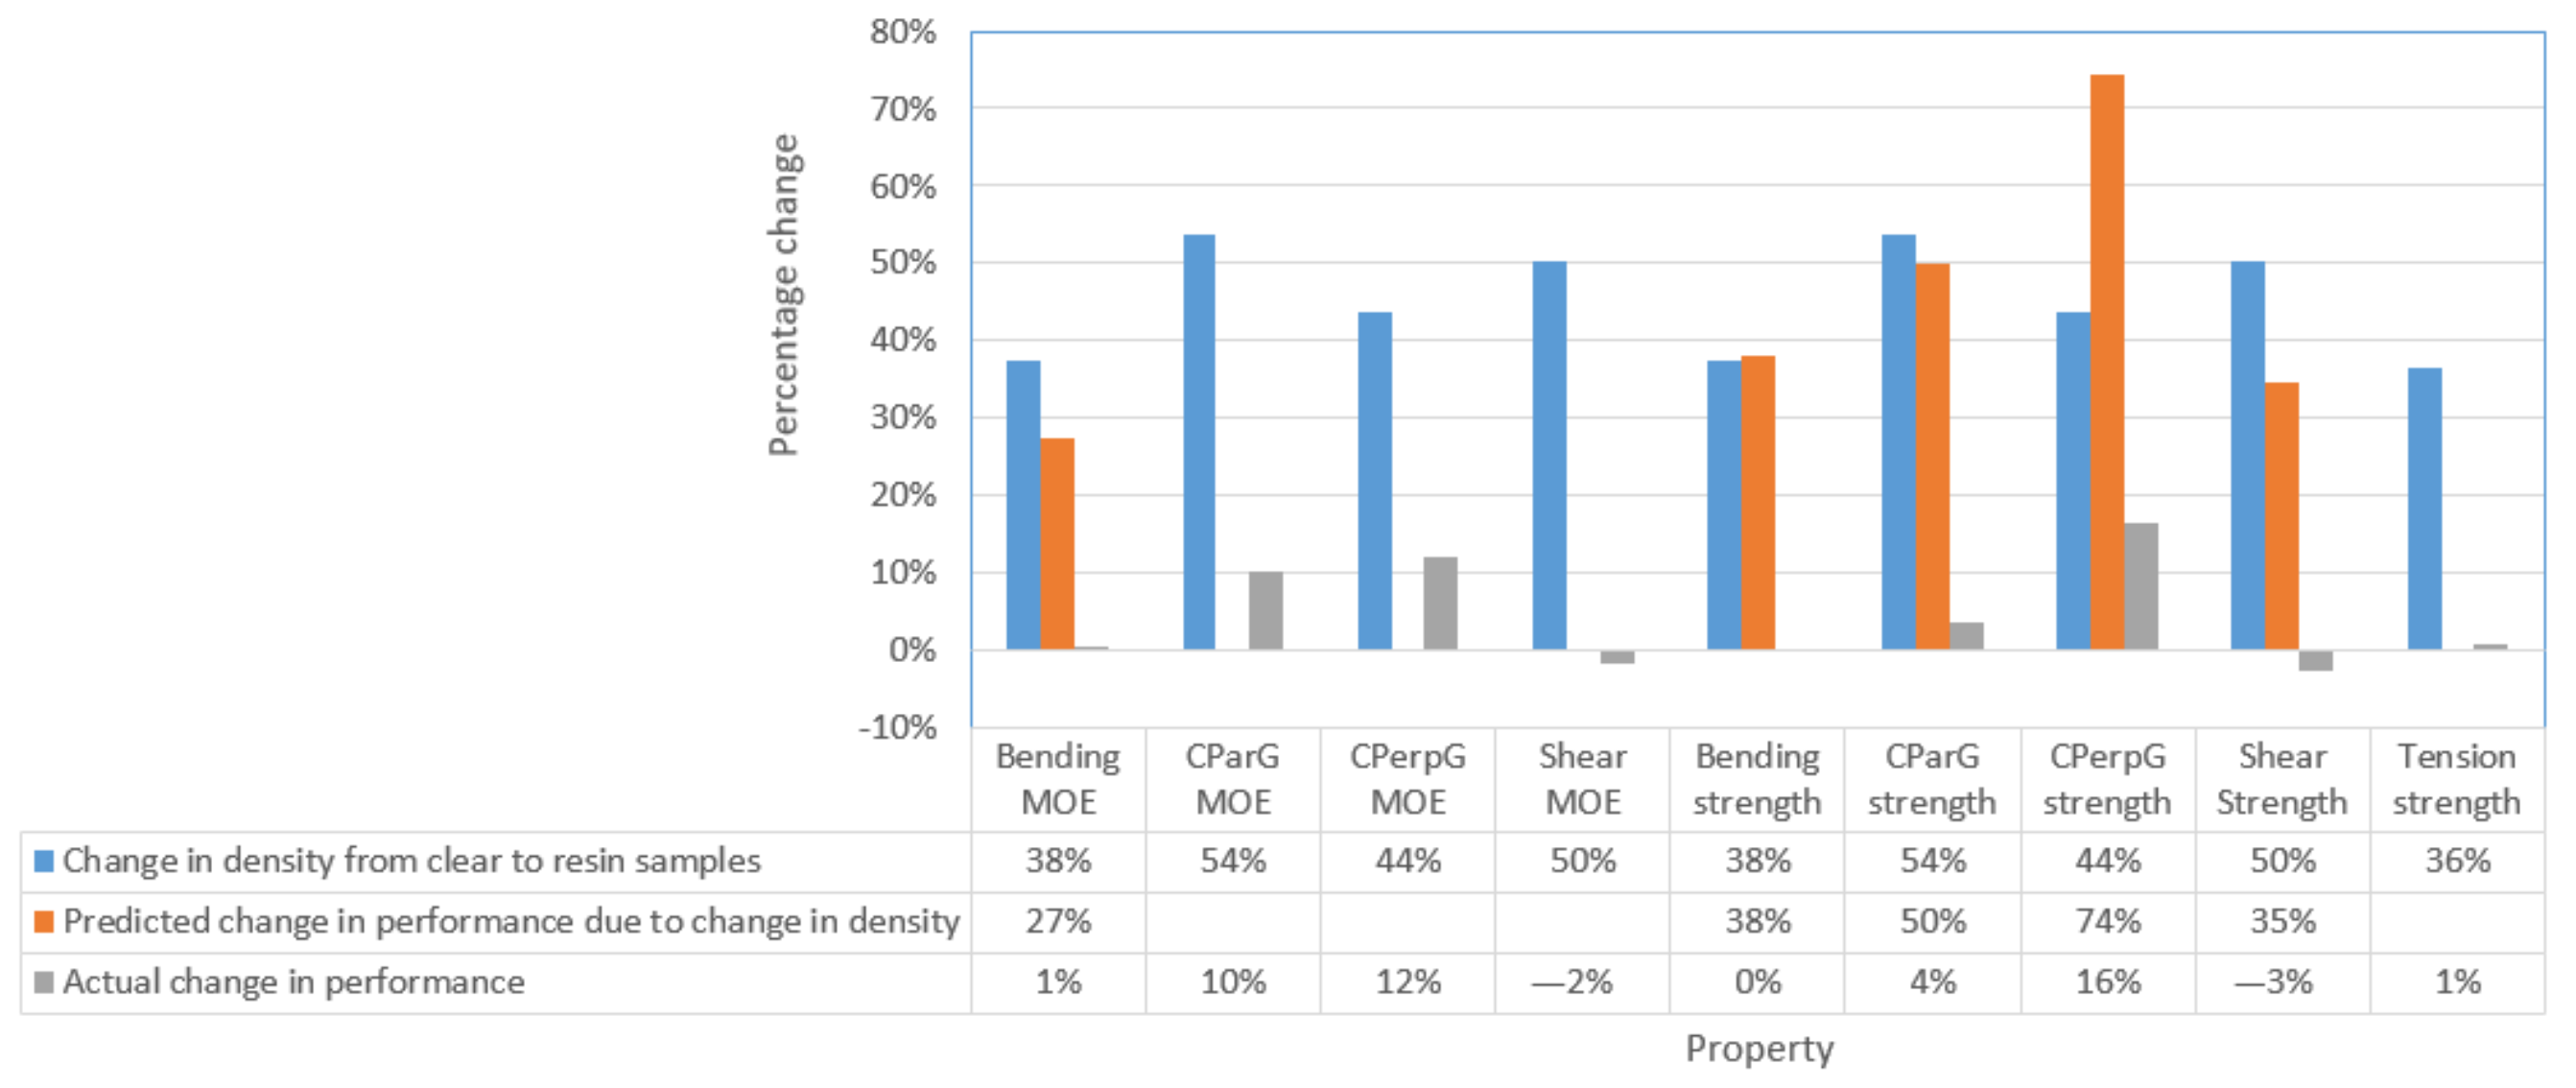
  • Resin samples performed similar to and within a range of 98% to 116% of the clear samples. Resin significantly increased the density at 45% higher than clear but only CPerpG MOE performed significantly different; however, no clear relationship was found between RAR and CPerpG MOE. The resin in cell walls rather than in cell lumen is believed to have provided the increased performance. The increase in density due to resin caused large errors in predictive models that were based on density and should be subtracted from these equations. RAR showed low correlation with all structural properties with R2 values all below 0.2 and moderate correlation with density with R2 of 0.659.
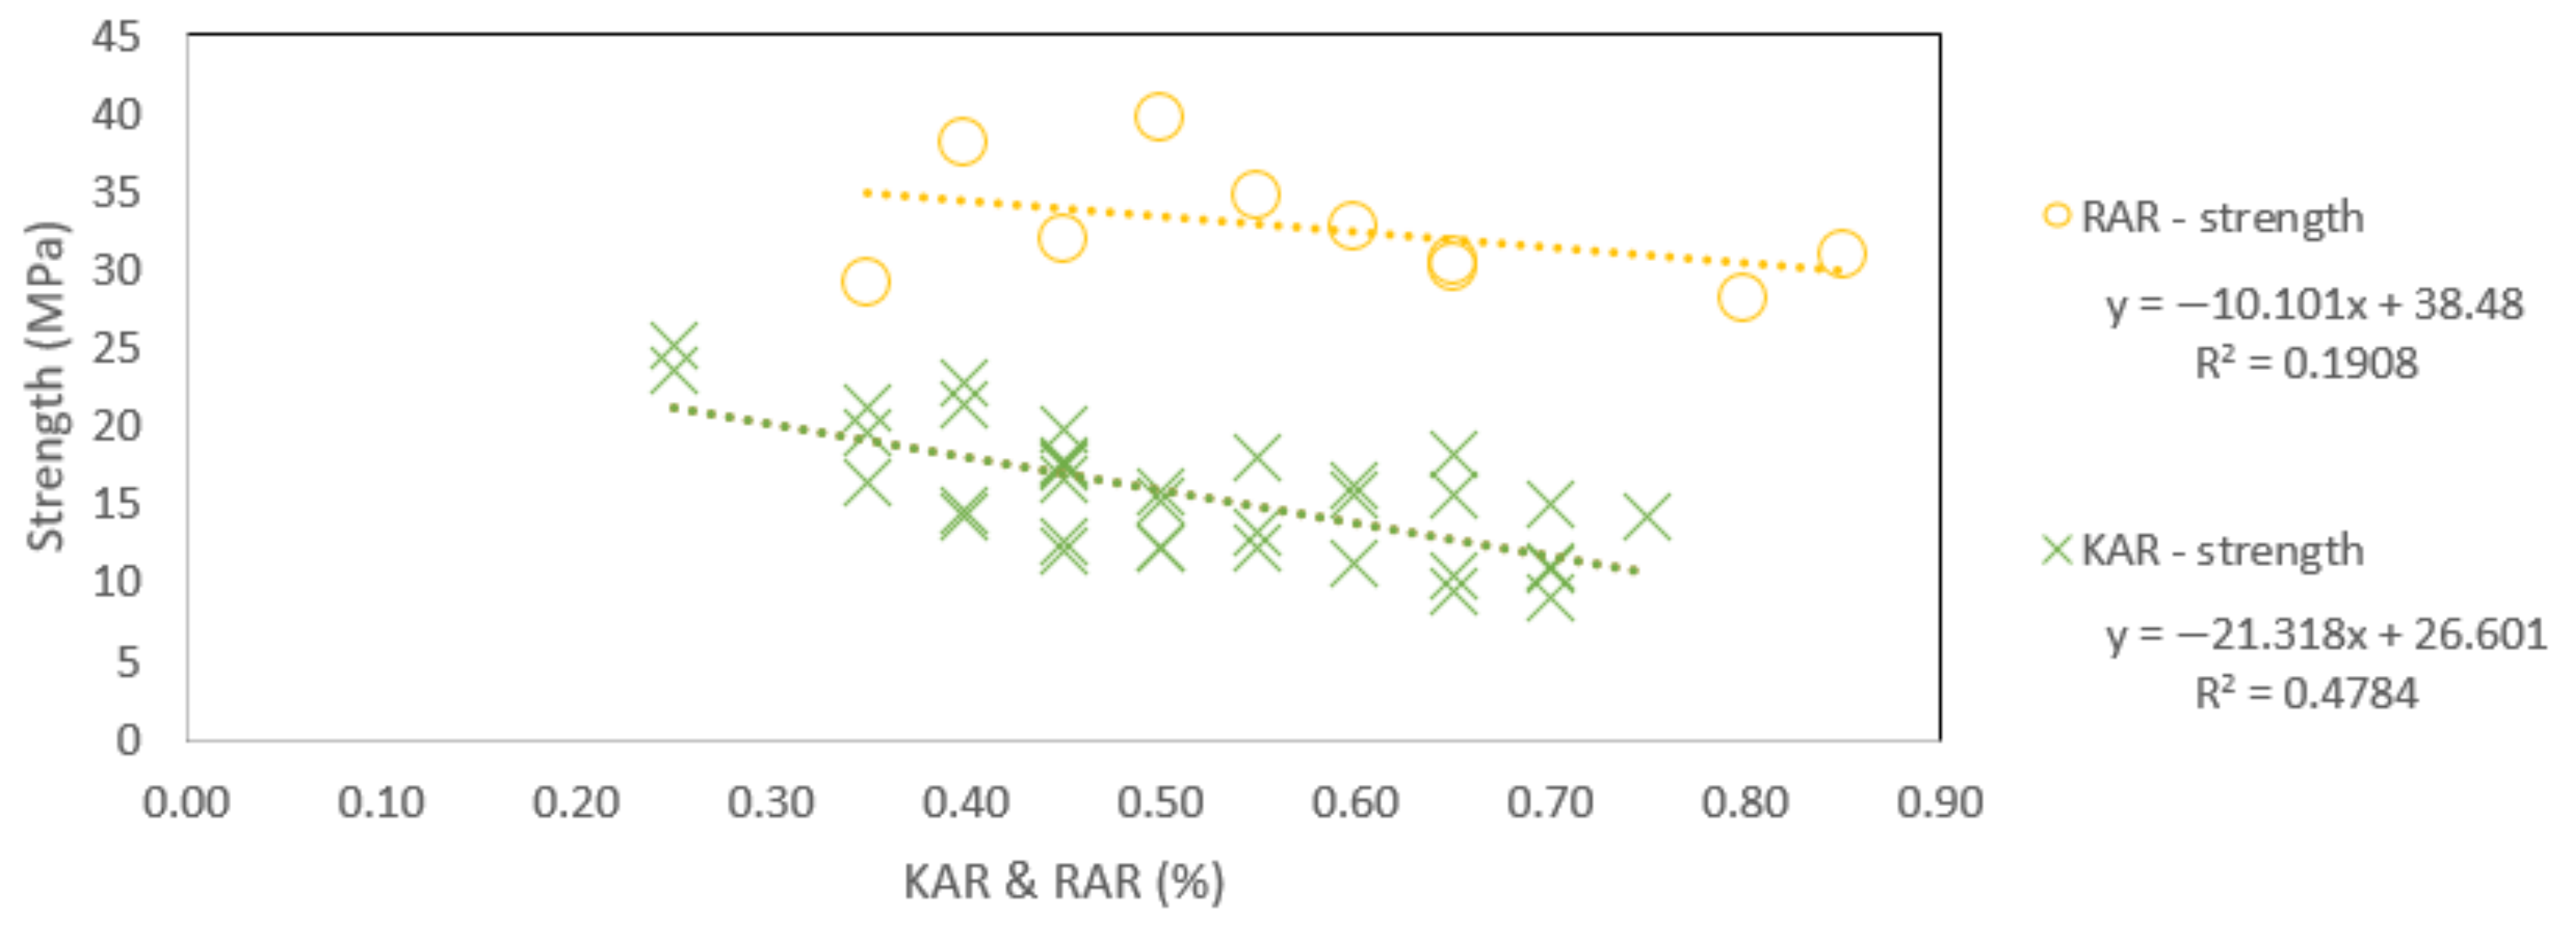
  • Knots performed significantly different to clear samples for all test types and within a range of 48% to 196%. Knots were high in CPerpG MOE and strength and lower for all other properties with the largest negative impact being on tensile strength followed by bending strength. The increase in density was similar to that for resin and knot-associated resin streaking was common which would have added to density. KAR was moderately correlated with tension strength and CParG MOE with R2 of 0.48 and 0.35, respectively. All other correlations were low or non-existent with R2 below 0.2.
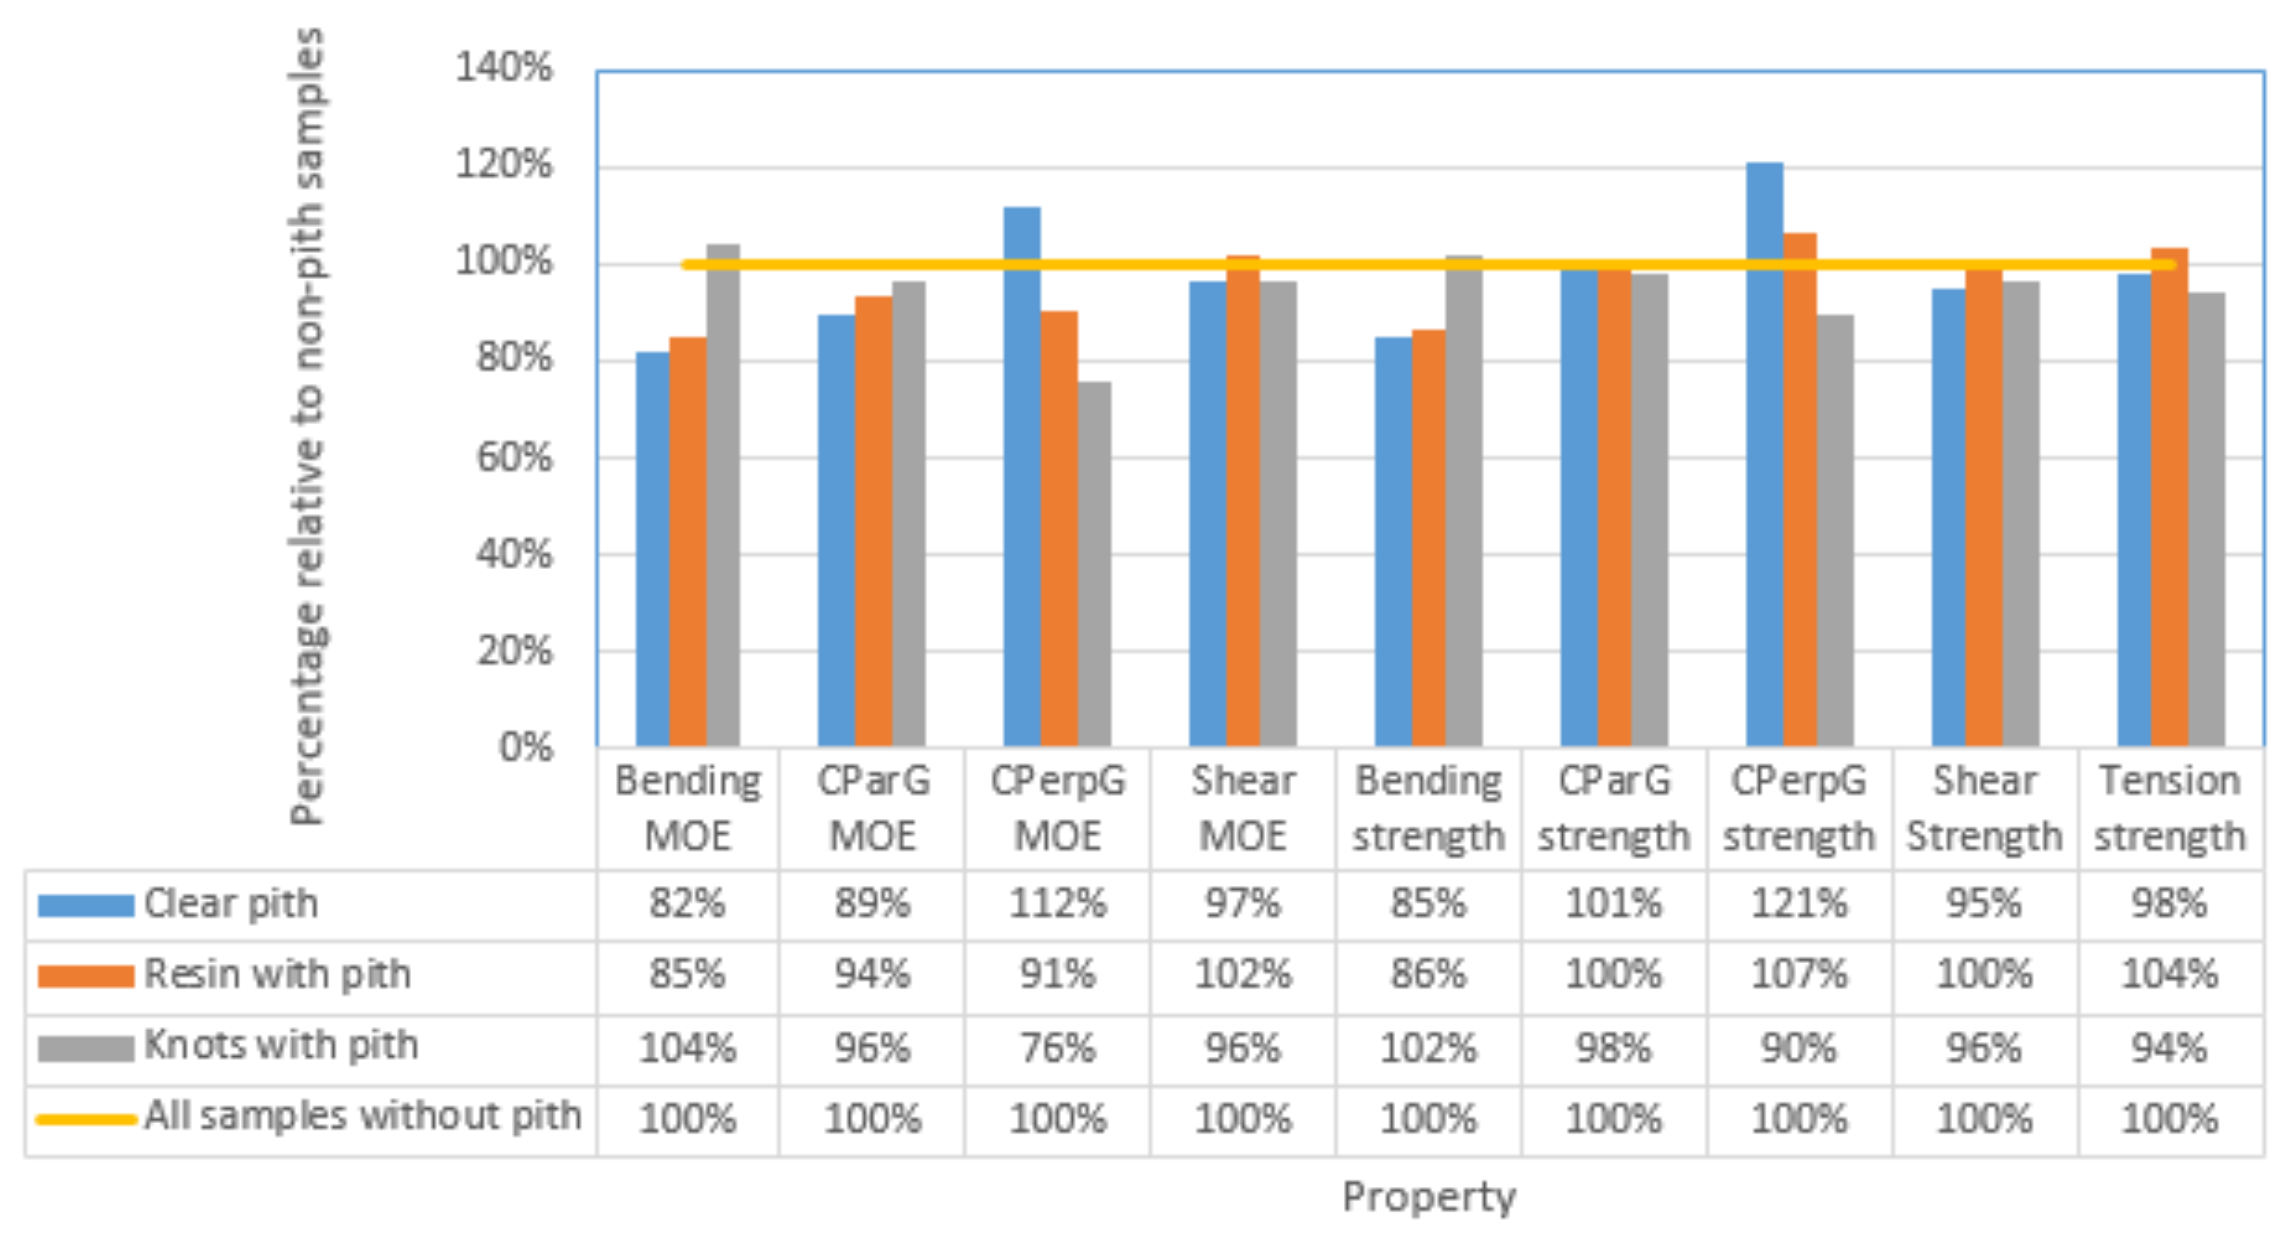
  • Pith samples were within the range of 76% to 121% of non-pith samples. Clear pith samples were significantly different and lower in bending MOE and strength and higher in CPerpG strength. Resin pith samples were significantly different and lower in bending MOE and strength. Knot pith samples were significantly different and lower in CPerpG MOE. Pith in knots for CPerpG strength had the third largest negative impact and is believed to be due to the discontinuity and connection of the conical-shaped knot wood spearing into the weak pith. Pith samples were higher in density than non-pith samples for clear, resin and knots in bending MOE and strength; knots had the largest negative impact, followed by pith for the clear and resin sample types, while resin had minimal impact and pith in knots increased performance.
  • In CparG MOE and strength, knots had the largest negative impact, followed by pith. Resin had a positive impact with increased performance.
  • In CPerpG MOE and strength, knots had the largest positive impact, followed by resin. Pith in clear samples also had a positive impact. Pith in resin reduced CPerpG MOE and increased strength while pith had the largest negative impact.
  • In shear modulus and strength, knots had the largest negative impact, followed by pith in knot and clear samples. Resin had a small negative impact while pith in resin increased performance slightly.
  • In tension strength, knots had the largest negative impact, followed by pith in knot and clear samples. Resin had little difference and pith in resin samples increased performance slightly.
  • The density of clear samples at 500 kg/m3 was high compared to other PEE × PCH hybrids and young and low-grade similar pines and mid-range compared to average populations of similar pines. The ratio of density to bending MOE was mid-range compared to other PEE × PCH hybrids and young and low-grade similar pines and high compared to average populations of similar pines.
While this resource has been rejected from grade, it still possesses some good mechanical properties that can be matched to structural applications that do not need high strength or stiffness values. It has high density which can be good for acoustics. However, additional research is needed on the impact on structural performance of the conical-shaped, clustered and high-angled knots found connecting with or near the pith as seen in this out-of-grade resource. This detailed information will provide an opportunity for the optimal design and use of this material resource in various civil engineering applications.

Author Contributions

Conceptualization, R.C., W.K. and A.M.; methodology, R.C.; validation, R.C.; formal analysis, R.C.; investigation, R.C.; resources, R.C.; data curation, R.C.; writing—original draft preparation, R.C., writing—review and editing, W.K. and A.M.; visualization, R.C.; supervision, W.K. and A.M. All authors have read and agreed to the published version of the manuscript.

Funding

The first author greatly acknowledges the funding support from the Queensland Government in the form of an Advance Queensland award, and USQ through a Research Training Program scholarship toward her PhD project.

Data Availability Statement

The data from this study are available from the authors upon request.

Acknowledgments

The authors thank Hyne Timber for in-kind contribution of timber for testing and use of testing facilities.

Conflicts of Interest

Rebecca Cherry is an employee of Hyne Timber.

References

  1. Lopez, J.; Abt, R.; Dovorak, W.; Hodge, G.; Phillips, R. Tree breeding model to assess financial performance of pine hybrids and pure species: Deterministic and stochastic approaches for South Africa. New For. 2018, 49, 123–142. [Google Scholar] [CrossRef]
  2. Nel, A.; Malan, F.; Braunstein, R.; Wessels, C.B.; Kanzler, A. Sawn-timber and kraft pulp properties of Pinus elliotti x Pinus caribaea var. hondurensis and Pinus patula x Pinus tecunumanii hybrid and their parent species. South. For. J. For. Sci. 2017, 80, 159–168. [Google Scholar]
  3. Dieters, M.; Brawner, J. Productivity of Pinus elliottii, P. caribaea and their F1 and F2 hybrids to 15 years in Queensland, Australia. Ann. For. Sci 2007, 64, 691–698. [Google Scholar] [CrossRef] [Green Version]
  4. Stanger, T.K.; Shaw, M.J.P.; Braunstein, R.; Nikles, D.G. A Comparison of the kraft pulp properties of P. elliottii and the P. elliotti x P. caribaea var. hondurensis hybrid grown in Queensland, Australia. South. Afr. For. J. 1999, 186, 9–14. [Google Scholar]
  5. Lv, C.; Huang, B. Stem Tissue Culture of Pinus elliottii x Pinus caribaea. In Proceedings of the International Conference on Biomedical Engineering and Biotechnology, Macao, China, 28–30 May 2012. [Google Scholar]
  6. Yang, H.; Luo, R.; Zhao, F.; Liu, T.; Liu, C.; Huang, S. Constructing genetic linkage maps for Pinus elliotti var. elliotti and Pinus caribaea var. hondurensis using SRAP, SSR, EST and ISSR markers. Trees 2013, 27, 1429–1442. [Google Scholar] [CrossRef]
  7. Cappa, E.P.; Marco, M.; Nikles, D.G.; Last, I.S. Performance of Pinus elliottii, Pinus caribaea, their F1, F2 and backcross hybrids and Pinus taeda to 10 years in the Mesopotamia region, Argentina. New For. 2012, 44, 197–218. [Google Scholar] [CrossRef]
  8. Gauchar, M.; Belaber, E.; Vera Bravo, C.; Gonzalez, P. Integrating vegetative propagation into conifer improvement programs in Mesopotamia Region, Argentina. In Proceedings of the 4th International Conference of the IUFRO, Buenos Aires, Argentina, 28 December 2016. [Google Scholar]
  9. ABARES, Australian Plantation Statistics 2016. Australian Bureau of Agricultural Resource Economics and Sciences, Ed. Canberra. 2016. Available online: https://data.gov.au/data/dataset/pb_aplnsd9abfe20160816 (accessed on 1 February 2022).
  10. Dewbury, M. Improving Thermal Efficiency in Lightweight Construction: Mass Timber as Thermal Mass; Project number: PNA289-1213a; Forest & Wood Products Australia: Melbourne, Australia, 2016. [Google Scholar]
  11. AS/NZS 1748.1 c. Timber-Solid-Stress-graded for structural purposes-General Requirements. Available online: https://www.standards.govt.nz/shop/asnzs-1748-12011/ (accessed on 1 February 2022).
  12. AS 1720.1—2010; Australian Standard, Timber Structures, Part 1: Design Methods. SAI Global Limited: Sydney, Australia, 2010.
  13. Cherry, R.; Manalo, A.; Karunasena, W.; Stringer, G. Out-of-grade sawn pine: A state-of-the-art review on challenges and new opportunities in Cross Laminated Timber (CLT). Const. Build. Mater. 2019, 211, 858–868. [Google Scholar] [CrossRef]
  14. Bailleres, H.; Lee, D.; Kumar, C.; Psaltis, S.; Hopewell, G.; Brancheriau, L. Improving Returns from Southern Pine Plantations through Innovative Resource Characterization; PNC361-1415; Forest & Wood Products Australia Limited: Melbourne, Australia, 2019. [Google Scholar]
  15. Fridley, K. Wood and wood-based materials: Current status and future of a structural material. J. Mater. Civ. Eng. 2002, 14, 91–96. [Google Scholar] [CrossRef]
  16. Dahlen, J.; Jones, P.D.; Seale, R.D.; Shulsky, R. Bending strength and stiffness of wide dimension southern pine No. 2 lumber. Eur. J. Wood Wood Prod. 2014, 72, 759–768. [Google Scholar] [CrossRef]
  17. Steffan, A.; Johansson, C.; Wormuth, E. Study of the relationship between flatwise and edgewise moduli of elasticity of sawn timber as a means to improve mechanical strength grading technology. Holz Roh Werkst. 1997, 55, 245–253. [Google Scholar] [CrossRef]
  18. Ramage, M.; Burridge, H.; Busse-Wicher, M.; Fereday, G.; REynolds, T.; Shah, D.; Wu, G.; Yu, L.; Fleming, P.; Densley-Tingley, D.; et al. The wood from the trees: The use of timber in construction. Renew. Sustain. Energy Rev. 2017, 68, 333–359. [Google Scholar] [CrossRef]
  19. Surdi, P.G.; Junior, G.B.; Mendes, R.F.; Almeida, N.F. Use of hybrid Pinus elliotti var. elliotti x Pinus caribaea var. hondurensis and Pinus taeda L. in the production of OSB panels. For. Sci. 2015, 43, 763–772. [Google Scholar] [CrossRef] [Green Version]
  20. De Almeida, N.F.; Junior, G.B.; Mendes, R.F.; Surdi, P.G. Evaluation of Pinus elliotti var. elliotti x Pinus caribaea var. hondurensis wood for plywood production. For. Sci. 2012, 40, 435–443. [Google Scholar]
  21. Burdon, R.; Kibblewhite, R.; Walker, J.; Megraw, R.; Evans, R.; Cown, D. Juvenile versus mature wood: A new concept orthogonal to corewood versus outerwood, with special reference to Pinus radiata and P. taeda. For. Sci. 2004, 50, 399–415. [Google Scholar]
  22. Malan, F. Corewood in South African pine: Necessity and opportunities for improvement. South. For. J. For. Sci. 2010, 72, 99–105. [Google Scholar] [CrossRef]
  23. Takeda, T.; Hashizue, T. Differences of tensile strength distribution between mechanically high-grade and low-grade Japanese larch lumber II: Effect of knots on tensile strength distribution. J. Wood Sci. 1999, 45, 207–212. [Google Scholar] [CrossRef]
  24. Phillips, G.; Bodig, J.; Goodman, J. Flow-grain analogy. Wood Sci. 1981, 14, 55–64. [Google Scholar]
  25. Guindos, P.; Guaita, M. The analytical influence of all types of knots on bending. Wood Sci. Technol. 2014, 48, 533–552. [Google Scholar] [CrossRef]
  26. Guindos, P.; Guaita, M. A three-dimensional wood material model to simulate the behavior of wood with any type of knot at the macro-scale. Wood Sci. Technol. 2013, 47, 585–599. [Google Scholar] [CrossRef]
  27. Wessels, C.B.; Dowse, G.P.; Smit, H.C. The flexural properties of young Pinus elliotti x Pinus caribaea var. hondurensis timber from the Southern Cape and their prediction from acoustic measurements. South. For. J. For. Sci. 2011, 73, 137–147. [Google Scholar] [CrossRef]
  28. Malan, F.S. The Basic Wood Properties and Sawtimber Quality of South African Grown Pinus elliottii x Pinus caribaea. S. Afr. For. J. 1995, 173, 35–41. [Google Scholar]
  29. Harding, K.; Copley, T.; Peters, R.; Dieters, M.J.; Nester, M.R.; Keys, M.; Toon, P. Selecting hybrid pine clones for deployment—The pointy end of wood quality improvement. N. Z. J. For. Sci. 2008, 38, 120–131. [Google Scholar]
  30. Leggate, W.; Shirmohammadi, M.; McGavin, R.L.; Chandra, K.; Knackstedt, M.; Knuefing, L.; Turner, M. Influence of Wood’s Anatomical and Resin Traits on the Radial Permeability of the Hybrid Pine (Pinus elliottii x Pinus caribaea) Wood in Australia. BioResources 2020, 15, 6851–6873. [Google Scholar] [CrossRef]
  31. Malan, F. The wood quality of the South African timber resource for high-value solid wood products and its role in sustainable forestry. South Afr. For. J. 2003, 198, 53–62. [Google Scholar] [CrossRef]
  32. Adusumalli, R.-B.; Raghavan, R.; Ghisleni, R.; Zimmermann, T.; Michler, J. Deformation and failure mechanism of secondary cell wall in Spruce late wood. Appl. Phys. A Mater. Sci. Process. 2010, 100, 447–452. [Google Scholar] [CrossRef]
  33. Koch, P. Utilization of the Southern Pines—Volume 1; Agricultural Handbook SFES-AH-420; U.S. Dept. of Agriculture Forest Service, Southern Forest Experiment Station: Washington, DC, USA, 1972.
  34. Grabner, M.; Muller, U.; Gierlinger, N.; Wimmer, R. Effects of heartwood extractives on mechanical properties of larch. Int. Assoc. Wood Anatom. 2005, 26, 211–220. [Google Scholar] [CrossRef]
  35. Garcia-Iruela, A.; Esteban, L.G.; de Palacios, P.; Francisisco Garcia-Fernandez, A.d.M.T.; Iriarte, E.V.; Simon, C. Resinous wood of Pinus pinaster Ait.: Physico-mechanical properties. BioResources 2016, 11, 5230–5241. [Google Scholar] [CrossRef] [Green Version]
  36. Forest Products Laboratory. Wood Handbook—Wood as an Engineering Material; General Technical Report FPL-GTR-190; Department of Agriculture, Forest Service, Forest Products Laboratory: Madison WI, USA, 2010.
  37. Doyle, D.V.; Markwardt, L.J. Tension Parallel-to-Grain Properties of Southern Pine Dimension Lumber; U.S. Forest Service Research Paper FPL84; US Department of Agriculture Forest Service: Madison, WI, USA, 1967.
  38. Baño, V.; Arguelles-Bustillo, R.; Regueira, R.; Guaita, M. Determination of the stress-strain curve in specimens of Scots pine for numerical simulation of defect free beams. Mater. Constr. 2012, 62, 269–284. [Google Scholar] [CrossRef] [Green Version]
  39. AS/NZS 4063.1: 2010; Characterization of Structural Timber: Part 1: Test Methods. 2010. Retrieved from Standards On-line Premium database. Standards Australia: Sydney, Australia, 2010.
  40. ISO 13910; International Standard: Timber Structures—Strength Graded Timber—Test Methods for Structural Properties. International Organization for Standardization: Geneva, Switzerland, 2014.
  41. Harding, K. Review of Wood Quality Studies in Queensland and Northern New South Wales Exotic Pine Plantations: Report for PN06.3016 Resource Characterisation of Slash Pine Plantation Wood Quality; Forest and Wood Products Australia Limited: Melbourne, Australia, 2008. [Google Scholar]
  42. Moya, L.; Laguarda, M.; Cagno, M.; Cardoso, A.; Gatto, F.; O’Neill, H. Physical and Mechanical Properties of Loblolly and Slash Pine Wood from Uruguayan Plantations. For. Prod. J. 2013, 63, 128–137. [Google Scholar] [CrossRef]
  43. Kretschmann, D.E.; Bendtsen, B.A. Ultimiate tensile stress and modulus of elasticity of fast-grown plantation loblolly pine lumber. Wood Fiber Sci. 1992, 24, 189–203. [Google Scholar]
  44. Franke, S.; Quenneville, P. Compression behavior and material parameters of radiata pine at different orientations to the grain. J. Mater. Civ. Eng. 2013, 25, 1514–1523. [Google Scholar] [CrossRef]
  45. Bolza, E.; Kloot, N.H. The Mechanical Properties of 174 Australian Timbers; Commonwealth Scientific and Industrial Research Organization: Melbourne, Australia, 1963. [Google Scholar]
  46. Arganbright, D.G. Influence of extractives on bending strength of redwood (Sequoia sempervirens). Wood Fiber Sci. 1971, 2, 367–372. [Google Scholar]
  47. Luxford, R.F. Effect of extractives on the strength of wood. J. Agric. Res. 1931, 42, 801–826. [Google Scholar]
  48. Zhao, D.; Yu, H.; Bao, X.; Liu, J.; Yuan, H.; Wang, Y.; Xue, Z. Effects of removal of extractives on the chemical composition and mechanical properties of wood. Bioresources 2020, 15, 8631–8647. [Google Scholar] [CrossRef]
  49. Green, D.W. Wood: Strength and Stiffness, 2nd ed.; Elsevier Science Ltd.: Oxford, UK, 2001; pp. 9732–9736. [Google Scholar]
  50. Samson, M.; Blanchet, L. Effect of knots on the flatwise bending stiffness of lumber members. Eur. J. Wood Wood Prod. 1992, 50, 148–152. [Google Scholar] [CrossRef]
  51. As, N.; Goker, Y.; Dundar, T. Effect of knots on the physical and machanical properties of scots pine (Pinus sylvestris L.). Wood Res. 2006, 51, 51–58. [Google Scholar]
  52. Grant, D.J.; Anton, A.; Lind, P. Bending Strength, Stiffness, and Stress-grade of Structural Pinus Radiata. N. Z. J. For. Sci. 1984, 14, 331–348. [Google Scholar]
  53. Stringer, J.; Dakin, A.; Fernando, D. The use of flatwise structural properties in the design of timber-framed residential buildings. In Proceedings of the World Conference on Timber Engineering 2016, Vienna, Austria, 22–25 August 2016. [Google Scholar]
  54. Doyle, D.V.; Markwardt, L.J. Properties of Southern Pine in Relation to Strength Grading of Dimension Lumber; U.S. Department of Agriculture Forest Service and Forest Products Laboratory: Madison, WI, USA, 1966.
  55. Missanjo, E.; Matsumura, J. Wood density and mechanical properties of Pinus kesiya Royle ex Gordon in Malawi. Forests 2016, 7, 135–145. [Google Scholar] [CrossRef] [Green Version]
  56. Benabou, L. Kink band formation in wood species under compressive loading. Exp. Mech. 2008, 48, 647–656. [Google Scholar] [CrossRef]
  57. Dinwoodie, J.M. Timber: Its Nature and Behaviour, 2nd ed.; Taylor & Francis: New York, NY, USA, 2002. [Google Scholar]
  58. Shim, K.-B.; Kim, K.-M.; Park, J.-S. Improvement of prediction accuracy of glulam modulus of elasticity by considering neutral axis shift in bending. Wood Fiber Sci. 2009, 41, 90–96. [Google Scholar]
  59. Conners, T.E.; Medvecz, P.J. Wood as a bimodular material. Wood Fiber Sci. 1992, 24, 413–423. [Google Scholar]
  60. Hakkila, P. Utilization of Residual Forest Biomass; Springer: Berlin/Heigelberg, Germany, 2012. [Google Scholar]
  61. Ajuong, E.-M.A.; Breese, M.C. Role of extractives on short-term creep in compression parallel to the grain of pai wood. Wood Fiber Sci. 1997, 29, 161–170. [Google Scholar]
  62. Hernandez, R.E. Influence of accessory substances, wood density and interlocking grain on the compressive properties of hardwoods. Wood Sci. Technol. 2007, 41, 249–265. [Google Scholar] [CrossRef]
  63. Gagnon, S.; Popovski, M. Chapter 3: Structural design of cross-laminated timber elements. In FPInnovations CLT Handbook; FPInnovations and Binational Softwood Lumber Council: Quebec, QC, Canada, 2011. [Google Scholar]
  64. Porteous, J.; Kermani, A. Structural Timber Design to Eurocode 5; Blackwell Publishing Ltd.: Oxford, UK, 2007. [Google Scholar]
  65. Franke, S.; Quenneville, P. Compression strength perpendicular to the grain of New Zealand Radiata Pine lumber. Aust. J. Struct. Eng. 2010, 12, 23–34. [Google Scholar]
  66. Basta, C.; Gupta, R.; Leichti, R.; Sinha, A. Applications of perpendicular-to-grain compression behaviour in real wood construction assemblies. Wood Fiber Sci. 2012, 44, 155–167. [Google Scholar]
  67. Ando, K.; Onda, H. Mechanism for deformation of wood as a honeycomb structure I: Effect of anatomy on the initial deformation process during redial compression. J. Wood Sci. 1999, 45, 120–126. [Google Scholar] [CrossRef]
  68. Ido, H.; Nagao, H.; Kato, H.; Miyatake, A.; Hiramatsu, Y. Strength properties of laminated veneer lumber in compression perpendicular to its grain. J. Wood Sci. 2010, 56, 422–428. [Google Scholar] [CrossRef]
  69. Kijidani, Y.; Morita, H.; Aratake, S.; Tsuyama, T.; Arima, T. Partial compression strength of sugi (Japanese cedar, Cryptomeria japonica) wood near the pith perpendicular to the grain. J. Wood Sci. 2019, 65, 16. [Google Scholar] [CrossRef]
  70. Li, M.; Zhang, S.; Wang, Y.; Ren, H. Effect of Microstructures on the Shear Strength of Larix kaempferi. Forests 2021, 12, 830. [Google Scholar] [CrossRef]
  71. Bodner, J.; Schlag, M.G.; Grull, G. Fracture Initiation and Progress in Wood Specimens Stressed in Tension. Part III. Clear Wood Specimens with Various Slopes of Grain. Holzforsch. Int. J. Biol. Chem. Phys. Technol. Wood 1998, 52, 95–101. [Google Scholar] [CrossRef]
  72. Xavier, J.; Avril, S.; Pierron, F.; Morais, J. Variation of transverse and shear stiffness properties of wood in a tree. Compos. Part A 2009, 40, 1953–1960. [Google Scholar] [CrossRef]
  73. Muller, U.; Sretenovic, A.; Gindl, W.; Teischinger, A. Longitudinal shear properties of European larch wood related to cell-wall structure. Wood Fiber Sci. 2004, 36, 143–151. [Google Scholar]
  74. Keunecke, D.; Songeregger, W.; Pereteanu, K.; Luthi, T.; Niemz, P. Determiniation of Young’s and shear moduli of common yew and Norway spruce by means of ultrasonic waves. Wood Sci. Technol. 2007, 41, 309–327. [Google Scholar] [CrossRef] [Green Version]
  75. Laveielle, L.; Gibier, O.; Stringer, G. A shear strength assessment of resin shakes in Australian grown slash pine. In Proceedings of the 25th Forests Products Research Conference, Victoria, Australia, 18–21 November 1996; Volume 1. [Google Scholar]
  76. Chui, Y.H. Simultaneous evaluation of bending and shear moduli of wood and the influence of knots on these parameters. Wood Sci. Technol. 1991, 25, 125–134. [Google Scholar] [CrossRef]
  77. Gupta, R.; Basta, C.; Kent, S.M. Effect of knots on longitudinal shear strength of Douglas-fir using shear blocks. For. Prod. J. 2004, 54, 77–83. [Google Scholar]
  78. Rajput, S.S.; Gupta, V.K.; Lohani, R.C. A study of effect of knot on the strength of timber. J. Indian Acad. Wood Sci. 1980, 11, 8–15. [Google Scholar]
  79. Cao, Y.; Street, J.; Mitchell, B.; To, F.; DuBien, J.; Seale, R.D.; Shmulsky, R. Effect of Knots on Horizontal Shear Strength in Southern Yellow Pine. Bioresources 2018, 13, 4509–4520. [Google Scholar] [CrossRef] [Green Version]
  80. Galicki, J.; Czech, M. Tensile strength of softwood in LR orthotropy plane. Mech. Mater. 2005, 37, 677–686. [Google Scholar] [CrossRef]
  81. Mitsuhashi, K.; Poussa, M.; Puttonen, J. Method for predicting tension capacity of sawn timber considering slope of grain around knots. J. Wood Sci. 2008, 54, 189–195. [Google Scholar] [CrossRef]
  82. Nagai, H.; Murata, K.; Nakano, T. Strain analysis of lumber containing a knot during tensile failure. J. Wood Sci. 2011, 57, 114–118. [Google Scholar] [CrossRef]
  83. Moody, R.C. Ultimate Tensile Stress of Finger Joints in Pith-Associated and Nonpith-Associated Southern Pine Lumber; Research paper FPL 138; U.S. Department of Agriculture Forest Service and Forest Products Laboratory: Madison, WI, USA, 1970.
  84. Krauss, A.; Moliński, W.; Kúdela, J.; Čunderlík, I. Differences in the mechanical properties of early and latewood within individual annual rings in dominant pine tree (Pinus sylvestris L.). Wood Res. 2011, 56, 1–12. [Google Scholar]
  85. Mackes, K.; Shepperd, W. Evaluating the bending properties of clear wood specimens produced from small-diameter ponderosa pine trees. For. Prod. J. 2005, 55, 72–80. [Google Scholar]
Figure 1. Example of out-of-grade PEE × PCH and its features.
Forests 13 00927 g001
Figure 2. Examples of clear and resin samples and of a typical knot sample.
Forests 13 00927 g002
Figure 3. Four-point bending test configuration.
Forests 13 00927 g003
Figure 6. Shear test configuration.
Forests 13 00927 g006
Figure 7. Tension test configuration.
Forests 13 00927 g007
Figure 8. Some typical bending failure examples in (a) clear, (b) resin and (c) knots.
Forests 13 00927 g008
Figure 9. Box plots of (a) Bending MOE and (b) bending strength.
Forests 13 00927 g009
Figure 10. KAR and RAR vs. bending MOE and strength.
Forests 13 00927 g010
Figure 11. Box plots of bending properties with and without pith—(a) MOE and (b) strength.
Forests 13 00927 g011
Figure 12. Relationship of bending MOE and strength.
Forests 13 00927 g012
Figure 13. Some typical CParG failure examples in (a) clear, (b) resin and (c) knots.
Forests 13 00927 g013
Figure 14. Box plots of CParG properties (a) MOE and (b) strength.
Forests 13 00927 g014
Figure 15. KAR and RAR vs. CParG MOE and strength.
Forests 13 00927 g015
Figure 16. Box plots of CParG properties with and without pith—(a) MOE and (b) strength.
Forests 13 00927 g016
Figure 17. Relationship of CParG MOE and strength.
Forests 13 00927 g017
Figure 18. Some typical CPerpG failures in (a) clear, (b) resin and (c) knots (d) shows shearing failure at edge of plates.
Forests 13 00927 g018
Figure 19. Box Plots of (a) CPerpG MOE and (b) CPerpG strength.
Forests 13 00927 g019
Figure 20. KAR and RAR vs. CPerpG MOE and strength.
Forests 13 00927 g020
Figure 21. Box plots of CPerpG properties with and without pith—(a) MOE and (b) strength.
Forests 13 00927 g021
Figure 22. Relationship of CPerpG MOE and strength.
Forests 13 00927 g022
Figure 23. Some typical shear failures in (a) clear, (b) resin and (c) knots.
Forests 13 00927 g023
Figure 24. Box plots of (a) Shear modulus and (b) shear strength.
Forests 13 00927 g024
Figure 25. KAR and RAR vs. Shear Modulus and shear strength.
Forests 13 00927 g025
Figure 26. Box plots of shear properties with and without pith—(a) shear modulus and (b) shear strength.
Forests 13 00927 g026
Figure 27. Relationship of shear modulus and shear strength.
Forests 13 00927 g027
Figure 28. Some typical tension failures in (a) clear, (b) resin and (c) knots.
Forests 13 00927 g028
Figure 29. Tension strength.
Forests 13 00927 g029
Figure 30. KAR and RAR vs. tensile strength.
Forests 13 00927 g030
Figure 31. Box plot of tension strength—with and without pith.
Forests 13 00927 g031
Figure 32. Summary of structural performance of resin and knot samples relative to clear.
Forests 13 00927 g032
Figure 33. Change in density for resin samples, predicted and actual change in structural performance.
Forests 13 00927 g033
Figure 34. Summary of pith sample structural performance relative to non-pith samples.
Forests 13 00927 g034
Table 1. Test samples with cross section of 90 × 35 mm.
Test Type
BendingCParGCPerpGShearTensionTotal
Sample Length700 mm140 mm210 mm200 mm1800 mm
Clear35 (11)35 (10)35 (12)30 (14)35 (20)170 (67)
Resin35 (9)35 (18)35 (15)30 (14)35 (20)170 (76)
Knots35 (11)35 (14)35 (14)30 (16)35 (22)170 (77)
Total105 (31)105 (42)105 (41)90 (44)105 (62)510 (220)
Values in () are number of samples containing pith in the sample set.
Table 2. Summary of test results.
TypeAverage
MOE
(GPa)
MOE
(5th %ile)
Average Strength
(Mpa)
Strength
(5th %ile)
Average Density
(kg/m3)
Average Moisture Content (%)
Bending
  Clear6.90 (1.53)4.1645.8 (9.1)35.2510 (50)13.1 (1.8)
    Pith6.01 (1.27)4.2440.8 (3.9)36.3509 (60)12.6 (1.9)
    No Pith7.31 (1.49)4.3048.2 (9.8)34.0510 (46)13.4 (1.8)
  Resin6.94 (1.08)5.1645.7 (8.4)32.4701 (83)13.3 (1.8)
    Pith6.14 (0.90)4.7340.8 (8.1)31.6711 (83)13.9 (2.0)
    No Pith7.22 (1.01)5.4347.3 (8.0)34.5697 (84)13.1 (1.7)
  Knots5.37 (1.03)3.9026.7 (8.4)12.6661 (113)12.8 (2.1)
    Pith5.51 (1.12)4.0427.1 (7.6)13.5728 (114)11.4 (2.1)
    No Pith5.29 (1.00)4.0126.6 (8.8)11.8630 (100)13.5 (1.8)
CParG
  Clear5.78 (1.67)3.5629.4 (5.7)21.1490 (42)12.4 (1.7)
    Pith5.33 (1.64)3.5629.63 (5.96)22.93503 (48)11.2 (1.1)
    No Pith5.97 (1.67)3.7129.32 (5.66)20.49485 (39)12.8 (1.6)
  Resin6.37 (1.58)4.3030.5 (5.1)25.1753 (94)12.1 (1.4)
    Pith6.24 (0.88)4.7130.4 (4.2)25.3768 (94)11.8 (1.4)
    No Pith6.66 (2.07)4.3030.5 (6.2)24.6730 (91)12.3 (1.5)
  Knots5.04 (1.04)3.3826.0 (4.6)19.4746 (117)11.6 (1.7)
    Pith4.89 (0.73)3.7925.7 (2.7)21.9771 (115)10.7 (1.7)
    No Pith5.07 (1.21)3.5026.3 (5.4)15.4734 (118)12.3 (1.4)
CPerpG
  Clear0.27 (0.06)0.186.7 (1.7)4.5494 (30)11.9 (1.6)
    Pith0.29 (0.06)0.217.61 (1.6)5.3498 (32)10.7 (1.3)
    No Pith0.26 (0.06)0.176.28 (1.6)4.6491 (29)12.6 (1.3)
  Resin0.31 (0.07)0.197.8 (1.6)5.5710 (89)11.3 (1.5)
    Pith0.29 (0.09)0.168.1 (2.1)5.1764 (96)11.2 (1.6)
    No Pith0.32 (0.06)0.247.6 (1.0)6.4668 (57)11.3 (1.5)
  Knots0.42 (0.11)0.2713.1 (3.4)9.5718 (116)11.7 (1.8)
    Pith0.35 (0.07)0.2612.3 (2.5)9.5758 (104)11.7 (2.1)
    No Pith0.46 (0.11)0.2913.7 (3.9)10.0690 (117)11.7 (1.6)
Shear
  Clear0.59 (0.06)0.515.7 (0.5)5.1499 (23)12.9 (1.3)
    Pith0.58 (0.05)0.515.6 (0.4)5.1499 (25)12.7 (1.4)
    No Pith0.60 (0.06)0.525.9 (0.5)5.1499 (22)13.0 (1.3)
  Resin0.58 (0.06)0.495.6 (0.8)4.3750 (86)13.0 (1.0)
    Pith0.58 (0.06)0.505.6 (1.0)4.2758 (92)13.0 (1.0)
    No Pith0.57 (0.06)0.505.6 (0.8)4.3742 (83)13.0 (1.0)
  Knots0.54 (0.09)0.415.2 (0.8)3.7720 (78)12.6 (1.3)
    Pith0.53 (0.09)0.435.1 (0.9)3.7741 (61)12.7 (1.3)
    No Pith0.55 (0.09)0.405.3 (0.8)4.1696 (89)12.6 (1.5)
Tension
  Clear 32.4 (2.7)28.1528 (54)11.9 (1.6)
    Pith 32.1 (2.6)28.5549 (39)11.4 (1.8)
    No Pith 32.7 (3.0)29.3511 (62)12.4 (1.4)
  Resin 32.6 (3.8)28.6720 (66)11.9 (1.2)
    Pith 33.1 (4.7)28.7724 (50)11.8 (1.4)
    No Pith 31.9 (2.4)29.4715 (93)12.1 (1.1)
  Knots 15.7 (4.1)10.1635 (95)12.1 (1.6)
    Pith 15.4 (4.3)9.5636 (95)12.1 (1.6)
    No Pith 16.4 (3.7)11.6634 (98)12.1 (1.6)
Note: Values in () are standard deviation.
Table 3. Average properties for similar species of pines and their ratios to bending MOE.
Bending MOE
Eb
(Gpa)
CParG MOE
EC,0
(Gpa)
CPerpG MOE
Ec,90
(Gpa)
Shear Modulus
G0
(Gpa)
Bending Strength
fb
(Mpa)
CParG Strength
fc,0
(Mpa)
CPerpG Strength
fc,90
(Mpa)
Shear Strength
fv,0
(Mpa)
Tensile Strength
ft,0
(Mpa)
Density
(kg/m3)
Comment
1. This Study—PEE × PCH
Clear6.905.78
(0.8377)
0.274
(0.0397)
0.590
(0.0855)
45.8
(0.0066)
29.4
(0.0043)
6.7
(0.0010)
5.7
(0.0008)
32.4
(0.0047)
498
(0.0722)
Resin6.946.37
(0.9232)
0.307
(0.0445)
0.580
(0.0841)
45.7
(0.0066)
30.5
(0.0044)
7.8
(0.0011)
5.6
(0.0008)
32.6
(0.0047)
721
(0.1045)
Knots5.375.04
(0.9385)
0.422
(0.0786)
0.535
(0.0996)
26.7
(0.0050)
26.0
(0.0048)
13.1
(0.0024)
5.2
(0.0010)
15.7
(0.0029)
708
(0.1320)
2. Other studies—PEE × PCH Hybrid
Bragg, 1990 [41]8.17 33.10
(0.0041)
497.00 (0.0609)19 years—70 × 35 mm
Harding et al., 2008 [41]7.26 42.36
(0.0058)
6.8 years—70 × 35 mm
Nel et al., 2017 [2]5.65 30.00
(0.0053)
479.00 (0.0847)15 to 19 years—38 × 152 mm
Wessels, Dowse, and Smit, 2011 [27]4.04 13.4
5th %ile
386.50 (0.0958)10 years 35 × 110 mm
3. Other similar pines—similar timber characteristics
Slash and Loblolly
Moya et al., 2013 [42]
7.20 62.40
(0.0087)
33.70
(0.0047)
9.70
(0.0013)
9.00
(0.0013)
477.00 (0.0663)25 years old
Slash and Loblolly Moya et al., 2013 [42]4.95 44.50
(0.0090)
24.60
(0.0050)
7.10
(0.0014)
7.60
(0.0015)
393.00 (0.0793)15 years old
Loblolly
Kretschmann and Bendtsen, 1992 [43]
6.15 18.90
(0.0031)
Juvenile wood
Southern Yellow Pines
Doyle and Markwardt, 1967 [37]
9.8310.18
(1.0356)
0.920
(0.0939)
39.00
(0.0040)
28.68
(0.0029)
11.90
(0.0012)
9.17
(0.0009)
520.00 (0.0529)50 × 100 mm Grade 3
Radiata
Franke and Quenneville, 2013 [44]
8.00 0.52
(0.0644)
9.90
(0.0012)
496.00 (0.0620)MSG8 Grade
4. Other similar pines—average values for species population
Caribbea
Forest Products Laboratory, 2010 [36]
15.40 115.10
(0.0075)
58.90
(0.0038)
14.40
(0.0009)
680.00 (0.0442)average population
Slash
Bolza and Kloot, 1963 [45]
9.4511.79
(1.2481)
75.15
(0.0080)
41.58
(0.0044)
10.10
(0.0011)
9.79
(0.0010)
506.00 (0.0536)average population
Slash
Forest Products Laboratory, 2010 [36]
13.70 0.82
(0.0595)
(1.19)112.00
(0.0082)
56.00
(0.0041)
7.00
(0.0005)
11.60
(0.0008)
590.00 (0.0431)average population
Loblolly
Forest Products Laboratory, 2010 [36]
12.30 1.17
(0.0955)
(0.81)88.00
(0.0072)
49.20
(0.0040)
5.40
(0.0004)
80.00 (0.0065)510.00 (0.0415)average population
Loblolly
Bolza and Kloot, 1963 [45]
7.248.48
(1.1716)
64.60
(0.0089)
35.70
(0.0049)
8.68
(0.0012)
9.48
(0.0013)
482.00 (0.0666)average population
Radiata
Bolza and Kloot, 1963 [45]
10.2011.38
(1.1149)
80.70
(0.0079)
41.92
(0.0041)
9.93
(0.0010)
11.03
(0.0011)
525.00 (0.0515)average population
Note: Values in () are ratio of average of property to average bending MOE.
Publisher’s Note: MDPI stays neutral with regard to jurisdictional claims in published maps and institutional affiliations.

