Abstract
Fruit quality is known to be regulated by the balance between leaf number/area and fruit number, but less is known about the effects of fruit–bearing branch agronomic traits, particularly for walnuts (Juglans regia L.). We assessed nut quality, physiological and biochemical indexes of leaves, and microstructure of leaves and fruit stalks at various leaf–to–fruit ratios to gain insight into the relationships between branch agronomic traits and nut quality, to identify those traits that made a better contribution to nut quality and to find out the range of the leaf–to–fruit ratio and the object of fruit to be removed for thinning. We found that the top fruit on the fruit stalk had a higher longitudinal diameter and kernel weight than the bottom at the low leaf–to–fruit level, and branches with more pinnate compound leaves had a better capacity for carbohydrate assimilation and transportation to produce better quality fruits. Specifically, with the increasing leaf number, the branch diameter, total leaf area, net photosynthetic rate, chlorophyll content, fruit weight, fruit diameters, and kernel protein content also increased. Moreover, at the microscopic level, the fruit stalk vascular bundle, leaf thickness, palisade mesophyll thickness, and ratios of palisade mesophyll to spongy mesophyll thickness in the leaf also showed the same trend. Therefore, when the ratio of leaf area to the fruit number was less than 181.5 square centimeters per fruit on the branches, reducing the fruit number could improve the size and the crude fat content of fruits. While the ratio was more than 247.8 square centimeters per fruit, the fruit number had no significant effect on fruit quality, but increasing leaf area and branch diameter could improve the fruit size and yield.
1. Introduction
With the rapid development of the woody and oil industry, the walnut has become an economically important tree species that can promote farmers’ incomes. To increase rural revenue, researchers’ efforts in the research of pest control, irrigation, and fertilization systems have made positive contributions to the healthy development of the walnut industry by focusing on the scientific problem of how to improve the yield and quality of walnut nuts. However, in agricultural production, the problem still exists that uneven fruit size plays a negative role in the commercialization of fruits. The source–sink relationship is one of the most important physiological aspects of cultivation for improved crop quality [1]. We supposed that this may be related to the factor that the fruit farmers only pay attention to soil loosening, weeding, watering, fertilization, and pest control in the orchard management mode, and ignore fruit load control. Thus, a better understanding of the source–sink relationship is important for improving walnut fruit quality and promoting the healthy development of the walnut industry.
To balance the nutrition and reproductive growth of crops, researchers have used a wide range of source–sink adjustment methods for annual crops and fruit trees to investigate mechanisms of carbohydrate assimilation, transport, and distribution [2,3]. To balance crop yield and quality, reductions in sources and sinks can be used as an adjustment method to produce a reasonable crop load and avoid the effect of source–sink imbalance on crop quality. Although the source provides carbohydrates to the sink [4], the sink provides feedback to the source [5]. Therefore, the balance between source and sink affects the transport of photosynthetic products from one to the other [6]. For example, a larger storage capacity can increase the carbohydrate synthesis capacity of leaves [7], but it can also reduce the fruit quality by limiting fruit carbohydrate supply [8,9,10]. On the other hand, higher numbers of sources can promote fruit development [11]. Furthermore, saturated fruit carbohydrate demand and low storage capacity result in excess accumulation of carbohydrates in leaves [12]. This, in turn, reduces leaf photosynthetic performance [13] by increasing the diffusion resistance of CO2 [14], inhibiting the activity and gene expression of photosynthesis–related enzymes [15], and altering leaf photoinhibition and photoprotective mechanisms [16].
A large number of studies have reported the effects of leaf and fruit number on fruit quality in fruit trees. First, the leaf–to–fruit ratio affects fruit ripening through its effects on fruit color, firmness, soluble solid content, and sugar–to–acid ratio. For example, a low leaf–to–fruit ratio delays the coloring of sweet cherry fruit (Cerasus avium L.) [8] and European grape (Vitis vinifera L.) [17]. It reduces fruit soluble solid content and delays fruit ripening compared with a high leaf–to–fruit ratio [17]. Second, the leaf–to–fruit ratio affects fruit quality and size. For example, the fresh weight, dry weight, and diameter length of blueberry (Vaccinium spp.) fruits are lower at a low leaf–to–fruit ratio and show allometric growth with an increasing leaf–to–fruit ratio [10]. Finally, a leaf–to–fruit ratio also affects fruit metabolism by changing fruit carbohydrate composition. For example, a low leaf–to–fruit ratio reduces the fresh weight and diameter of citrus fruit (Citrus deliciosa Ten.) [18]. It simultaneously changes sugar and organic acid metabolism to reduce fruit acidity and sucrose content and increase glucose and hexose content during fruit growth and development [18]. On the contrary, some studies have shown that the source–sink relationship does not have a significant impact on fruit quality. For example, a stem girdling experiment showed that when the fruit–bearing branches were not girdled, differences in leaf–to–fruit ratio did not significantly affect the growth and sugar content of kiwi (Actinidia chinensis cv.) [19] and olive (Olea europaea L.) [20] fruits. By contrast, differences in the leaf-to-fruit ratio of the branches girdled significantly affected fruit growth and sugar content. The reason for this difference may be related to the blocking of material exchange between above and belowground plant parts by girdling, which allowed more carbohydrates to flow to the fruits. At the same time, this study pointed out that short shoots with a lower shoot wood to leaf biomass ratio had an earlier and greater carbon export ability than long ones, which can better support fruit growth [4]. Therefore, the agronomic traits of fruit–bearing branches may mediate source–sink effects on fruit development. However, most research currently focuses on the influence of leaf and fruit number on fruit quality, and less attention has been paid to the influence of agronomic traits of the fruit–bearing branches. Therefore, this study will explore the effects of fruit–bearing branch agronomic traits on fruit quality using an experimental system in which fruit–bearing branches differ in their numbers of pinnately compound leaves and fruits.
Walnut produces one of the four largest nuts in the world and is an economically important tree species for oilseed production. Several on the source–sink dynamics of walnuts have been published. These studies have reported that differences in leaf–to–fruit ratios affect the chlorophyll fluorescence of walnut leaves [21,22], fruit quality, and tree nutritional development [23]. However, studies have not yet investigated the relationship between leaf–to–fruit ratio and nut quality under more realistic agricultural conditions based on a wider range of leaf–to–fruit ratios. We have therefore designed a source–sink experimental system at the branch level using fruit–bearing branches of walnut with different numbers of pinnately compound leaves and fruits. We asked whether the agronomic traits of the fruit–bearing branches affected walnut nut quality, which range of leaf–to–fruit ratio was suitable for agricultural production, and which fruit should be preserved on the fruit stalk. The specific purposes of this study were (i) to find out the range of leaf–to–fruit ratios in line with agricultural production by assessing the correlation between the differences in physical and chemical quality of fruits with different leaf to fruit ratios and the agronomic traits of fruit–bearing branches, (ii) to determine important target agronomic traits affecting fruit quality by quantifying the weight relationship between the effects of different the traits on fruit quality, (iii) to analyze the main performance of carbohydrate assimilation and transportation ability on fruit quality by investigating the effects of leaf–to–fruit ratio on leaf and fruit stalk development through physiological and microscopic investigation, and (iv) to make certain the position of fruits to be preferentially removed by comparative analysis of fruit quality differences at different positions on the fruit stalk. We tested four specific hypotheses: (i) that source–sink affect nut quality are affected by the agronomic traits of the fruit–bearing branches; (ii) which is regulated by the combined effects of carbohydrate supply, transport, and utilization capacity; (iii) carbohydrate supply has the most important effect on fruit quality than the others; and (iv) there are differences in the quality of the fruits growing on the same fruit stalk.
2. Materials and Methods
2.1. Experimental Site and Plant Materials
The experimental site was located in a walnut (Juglans regia ‘Xinxin2’) orchard in southern Xinjiang, China (41°19′29.36″ N, 80°19′36.84″ E, 1187 m in altitude). The region has a warm temperate continental arid climate with an average rainfall of 80.4 mm, average evaporation of 1948 mm, and a mean annual temperature of 10.8 °C. The walnut was bred from the progeny of the seedling line by the Research Institute of Forestry, Xinjiang Academy of Forestry, and is a late–maturing cultivar with cross–pollination and high yield. During the annual management of fruit trees, according to increasing the number of flowers, promoting fruit expansion and improving tree growth, soil loosening, weeding, ditching and fertilization, and flooding irrigation were carried out in late March, early June, mid–July, and mid–October. Fruit trees grow well in loamy soils, and without pests or natural disasters, reduced yields. Fruit–bearing branches with different numbers of pinnately compound leaves and fruits growing on the south side of the periphery at the bottom of the canopy were selected on five healthy, 13–15–year–old trees with good light exposure (Figure 1a). The trees were growing in a 1 ha orchard and were planted in east–west rows at a spacing of 5 × 6 m. Tree height was about 5.3 m, and trunk diameter varied from 15 to 22 cm. Since walnut fruits grow at the top of the fruit–bearing branches, we could not prune the branches to standardize their lengths. We, therefore, selected fruit–bearing branches with the same numbers of pinnate compound leaves and fruits to serve as replicates for statistical analysis (Figure 1b). At fruit maturity, the peel color gradually turns yellow and cracks, after we measured the agronomic traits of each fruit–bearing branch (Table S1) and photosynthesis in leaves, and we then collected leaves and all the fruits on three replicate fruit–bearing branches with nine different leaf–to–fruit ratios and recorded biochemical indices of fruit and leaf.
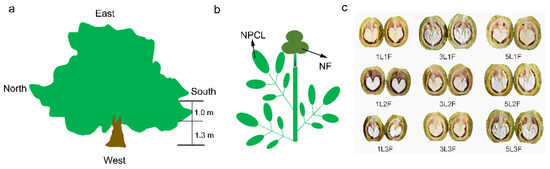
Figure 1.
(a) Lateral view of the canopy. (b) Schematic diagram of a fruit bearing branch with a leaf–to–fruit ratio of 3:3 (3NPCL: 3NF). (c) Representative walnut fruits from branches with 9 different leaf–to–fruit ratios. NPCL, number of pinnately compound leaves (1, 3, and 5). NF, number of fruits (1, 2, and 3).
2.2. Determination of Fruit Physical Indices
We used an electronic balance and vernier caliper to measure the fruit dry weight, kernel dry weight, and longitudinal and transverse diameters of the fruit.
2.3. Leaf Area Calculation
We obtained predictive models of parietal and compound leaf area (R2 > 97%) by performing regression analysis on observed and fitted leaf area values. The two models were then used to predict the leaf areas of the parietal and compound walnut leaves (Figure S1). The total leaf area (TLA) of the fruit-bearing branches was calculated using Equations (1) and (2).
where LACC is the leaf area correction coefficient, LA is the leaf area, BL is the blade length, BW is the blade width, N is the number of pinnately compound leaves on the fruit–bearing branch (an integer ranging from 1 to 5), LA1 is the leaf area of the upper leaflet of pinnately compound leaf, and LA2 is the leaf area of the opposite leaflet closest to the upper leaflet.
2.4. Chemical Indices Measurements of Kernel
The pericarp, nutshell, and kernel of clean fruit were inactivated at 105 °C for 30 min to inactivate various enzymes in the plant, then dried to constant weight at 80 °C for measurement of quality indices. For determination of the crude fat content, one gram of ground kernel was soaked in an extraction cup equipped with 80 mL petroleum ether to extract at 60 °C for 5 h by Soxhlet extractor (Hanon SOX406, Haineng Future Technology Group Co., Ltd., Jinan, China), and after the extraction cup dried at 80 °C for 1.5 h, the weight of the object obtained was the crude fat content in the sample [24]. Fifty milligrams of the ground kernel residue after extracting crude fat and used for determination of soluble protein content were extracted with 10 mL 0.1 M NaOH, of which 50 μL extract was mixed with 0.95 mL 0.1 M NaOH and 5 mL Coomassie bright blue solution, and then determined by ultraviolet spectrophotometer (UV1800PC, Shanghai Jinghua Science and Technology Instrument Co., Ltd., Shanghai, China) at 595 nm [25]. A centrifuge tube containing about 50 mg of the fully ground kernel and 2 mL of 80% ethanol was heated in an 80 °C water bath for 40 min, centrifuged at 5000 rpm for 5 min, then collected 1 mL supernatant in a new centrifuge tube with 0.1 g activated carbon and continue to add 1 mL 80% alcohol to the centrifuge tube containing the sample (repeat 3 times). A centrifuge tube with 4 mL supernatant was decolorized at 80 °C for 30 min, centrifuged at 5000 rpm for 5 min, and then the supernatant was collected, of which 0.15 mL and 0.2 mL of supernatant were used for determination of soluble sugar and sucrose content by photometric determination at 625 and 480 nm, respectively. The contents of soluble sugar and sucrose were determined by using anthrone sulfuric acid and resorcinol colorimetry, respectively [26]. The residue was dissolved in a mixture of 1.5 mL distilled water and 200 μL 9.2 M perchloric acid and extracted with boiling water for 15 min, centrifuged at 5000 rpm for 10 min, and then collected the supernatant, of which 100 μL supernatant was mixed with 5 mL anthrone sulfuric acid solution for starch content determination at 625 nm by using spectrophotometer [27]. The contents of soluble protein, soluble sugar, starch, and sucrose were calculated by standard curves and Equation (3), and starch content needs to be multiplied by 0.9.
where C1 (mg·g−1) represents the contents of soluble protein, sucrose, soluble sugar, and starch in–unit tissue; M1 (mg) is the reading of soluble protein, sucrose, soluble sugar, and starch on the standard curve; V1 (mL) is the total volume of the extract; V2 (mL) is the amount of extract required for determination; M2 (g) is the mass of tissue.
2.5. Chemical Indices Measurements of Leaf
Fresh leaf (200 mg) was quickly ground to homogenate in a mortar containing silica, calcium carbonate, and 1 mL 80% acetone, and then filtered into a 10 mL brown volumetric flask and added to 10 mL with 80% acetone. The mixed solution composition of 1 mL extract and 4 mL 80% acetone was determined at 470 nm, 646.8 nm, and 663.2 nm by ultraviolet spectrophotometer. The pigment contents in the extract were calculated according to Lichtenthaler [28]. The pigment contents in–unit tissues were calculated by Equation (4). The contents of sucrose, soluble sugar and starch in leaves were determined and calculated in the same way as in kernels. The volumes of extracts used for the determination of soluble sugar, sucrose, and starch were 150 μL, 200 μL, and 100 μL, respectively.
where C2 (mg·g−1) represents the contents of chlorophyll a, chlorophyll b, and carotenoids in–unit tissue; M1 (mg) is the reading of chlorophyll a, chlorophyll b, and carotenoids in the extract; V1 (mL) is the total volume of the extract; V2 (mL) is the amount of extract required for determination; and M2 (g) is the mass of tissue.
2.6. Determination of Photosynthetic Indices
Leaf gas exchange determination was worked by using a portable Li–6800 photosynthesis apparatus (LI–COR Biosciences Inc., Lincoln, NE, USA) from 11:30 a.m. to 1:30 p.m. before the samples were harvested. The apparatus was equipped with 2 × 3 cm2 apertures and 6800–02P red and blue light (red:blue = 9:1). Gas exchange parameters were set as follows: Light intensity, CO2 concentration, flow, temperature, fan speed, and relative humidity were 1300 μmol·m−2·s−1, 400 μmol·mol−1, 500 μmol·s−1, 30 °C, and 50%, respectively.
2.7. Microscopy Observations
Positions of the center of the upper leaflet and fruit stalk were taken at fruit maturity for the observation of the anatomical structure of the leaf and fruit stalk. The sampled leaf area was 1 × 0.5 cm, and the sampled length of the fruit stalk was 1 cm. After fixing in formalin acetic alcohol (Formalin 40%:Glacial acetic acid:Alcohol 70% 5:5:90) solution. Dehydration was worked by soaking the samples in an alcohol series (respectively, 30%, 50%, 70%, 80%, 90%, 95%, 100%, and 100%) for 2 h. Hyalinization was done by immersing the samples in a xylene series (respectively, alcohol: xylol with a ratio of 1:1, 100%, and 100%) for 2 h. The sample was immersed in a paraffin series (respectively, paraffin:xylol with a ratio of 1:1 at 40 °C for 3 d, 100%, and 100% at 60 °C for 3 d) and finally embedded in paraffin. Sectioning, photography, and measurement were performed with a rotary slicer (rm2265, CMS GmbH, Germany) and a DFC495 digital camera (Leica, Germany). The microscopic observation thicknesses of the leaves and stalk were 8–10 μm and 25–30 μm, respectively. All samples were dyed with safranin O–fast green staining. The anatomical structures observed included the main vein, palisade mesophyll, spongy mesophyll, vascular bundles, xylem, phloem, and pith ray.
2.8. Statistical Analysis
Data on fruit–bearing branch agronomic traits and fruit quality indices from branches with 9 leaf–to–fruit ratios passed the Shapiro–Wilk test for normality and the Bartlett test for homogeneity of variance. We, therefore, used the pairwise t-tests in R (version 4.0.2, R Core Team, https://www.r-project.org/, accessed on 23 June 2022) to perform one–way multiple comparisons, and the data were expressed as mean. We calculated the mean values of all agronomic traits and nut quality indicators on 27 fruit–bearing branches with 9 different leaf–to–fruit ratios. We then established models for the effect of the explanatory variables on each quantitative response variable. The explanatory variables included fruit stalk length, fruit stalk diameter, fruit–bearing branch length, fruit–bearing branch diameter, number of pinnately compound leaves, and number of fruits. The response variables included the fruit dry weight, kernel dry weight, longitudinal diameter, transverse diameter, crude fat content, soluble protein content, starch content, and soluble sugar content. We selected the model with the largest adjusted R2 value to explain the relationship between branch traits and fruit quality indices, and we tested the normal distribution of the residuals, performed the Durbin Watson test for independence of the errors, and tested for homogeneity of variance of the dependent variable residuals. After calculating the explanatory degree of each predictor variable, three variables with the highest relative weights were used to draw response surface graphs using a two-dimensional quadratic function (f[x] = x + y + x2 + y2) between the explanatory and response variables. We used the principal components analysis and correlation plot in Origin (version 2021, OriginLab Corp., Northampton, MA, USA) to perform principal components analysis and correlation analysis.
Since the amount of fruit set on each fruit–bearing branch was different, the total fruit dry weight was calculated as the sum of the dry weights of all fruits on the branch, and the fruit quality indices were the average value of all fruit quality indices on the fruit–bearing branch. Excel (version 2016, Microsoft Corp., Redmond, WA, USA) software was used for data entry and sorting, R4.0.2 was used for statistical analysis, and Origin2021 was used for drawing.
3. Results
3.1. Effects of the Source–Sink Relationship on the Physical and Chemical Quality of Fruit
The physical and chemical qualities of walnut fruit were influenced by the source–sink relationship (Figure 2). In terms of fruit physical quality, under the high level of pinnately compound leaf treatment (5NPCL), the average dry weight, longitudinal diameter, transverse diameter, and kernel dry weight of walnut fruits had the highest values; these values were not significantly (p > 0.05) affected by the number of fruits, and ranged from 15.1–15.8 g, 55.3–58.1 mm, 46.4–47.8 mm, and 6.9–7.0 g, respectively. However, the lowest values were found under the low level pinnately compound leaf treatment (1NPCL), and these values were significantly (p < 0.05) affected by the number of fruits, ranging from 9.2 to 11.1 g, 44.3–55.1 mm, 38.2–42.3 mm and 3.7–5.6 g, respectively (Figure 2A–D). For fruit chemical quality, when the number of pinnately compound leaves for three and five, the number of fruits did not significantly (p > 0.05) affect the crude fat content, sucrose content, soluble sugar content, and starch content in the kernel. When the number of pinnately compound leaves to one, increasing the number of fruits significantly improved the sucrose content, soluble carbon content, and starch content in the kernel, but reduced the crude fat content (Figure 2F–I).
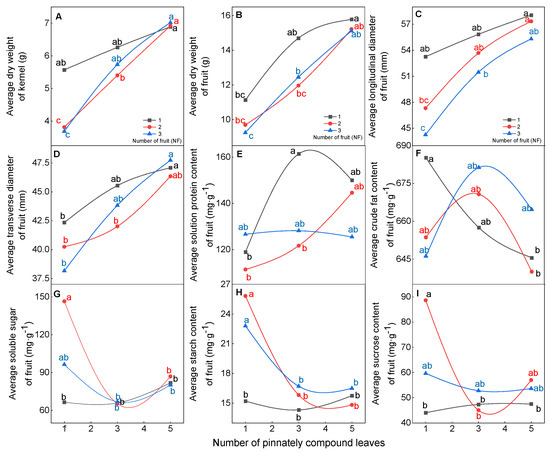
Figure 2.
Effect of the source–sink relationship on the physical and chemical quality of fruit. Different lowercase letters indicate significant (p < 0.05) differences between branches with different leaf-to-fruit ratios.
With the increasing number of pinnately compound leaves, the effects of leaf to fruit ratio on fruit physical quality at different positions on the fruit stalk had the same trend as the average physical quality of fruit (Table S2). When the position of fruits on the fruit stalk and the number of fruits were the same, the longitudinal diameter and kernel weight of fruits with the higher number of leaves were significantly higher than the lower (p < 0.05), but there was no significant (p > 0.05) difference among fruits on the same stalks, and fruit stalk with two and three fruits had the same trend. In terms of the physical quality of the fruit, compared with the higher number of leaves, the fruit stalk with the lower had a large range in fruit diameter and the longitudinal diameter of the top fruit was higher than the bottom. On the one hand, it may indicate the lower leaf–to–fruit ratio was one of the reasons for the uneven size of the fruit; on the other hand, it may show carbohydrates may preferentially supply the fruit developed at the top when the leaf fruit was relatively low.
3.2. Correlations between Fruit-Bearing Branch Traits and Nut Quality
The numbers of pinnately compound leaves and fruits on fruit–bearing branches affected the physical and chemical quality of fruits, but the question remains to be further analyzed whether the changes in fruit physical quality and chemical quality were affected by other agronomic traits of fruit–bearing branches. PCA was analyzed to detect similarities between variables and samples (Figure 3a). The first principal component (PC1) accounted for 42.1% of the total variance and the second principal component (PC2) accounted for 18.7% of the total variance. PC1 showed the differences between the agronomic traits and physical quality of fruit among the fruit–bearing branches with different pinnately compound leaves. Samples with NPCL of five, located on the right figure, were primarily presented with the highest length and thickness of fruit–bearing branches, fruit stalk diameter, the ratio of total leaf area to the number of fruits, average dry weight, longitudinal diameter, transverse diameter, and kernel dry weight of fruits than the samples with NPCL of one and three (All load angles between these indexes were less than 90°, indicating that there was a positive correlation between these indexes). Correlation analysis also showed that the average dry weight, longitudinal diameter, transverse diameter, and kernel dry weight of fruit were significantly positively correlated with the ratio of total leaf area to fruit number, fruit stalk diameter, fruit stalk length, and diameter of fruit–bearing branches (Figure 3b, p < 0.05). PC2 exhibited the differences between the agronomic traits and chemical quality of fruit among the fruit–bearing branches with different pinnately compound leaves. Samples with NPCL of three, located on the bottom figure, were primarily presented with the highest contents of crude fat and soluble protein in the kernel than the samples with NPCL of one and five. However, the contents of sucrose, soluble sugar, fructose, and starch in the kernel were the lowest (All load angles between these indexes were less than 90°, indicating that there was a positive correlation between these indexes). Correlation analysis also showed that the crude fat content in the kernel was significantly negatively correlated with soluble protein content (p < 0.01), and the positive correlation between soluble sugar content, sucrose content, and fructose content (p < 0.01).
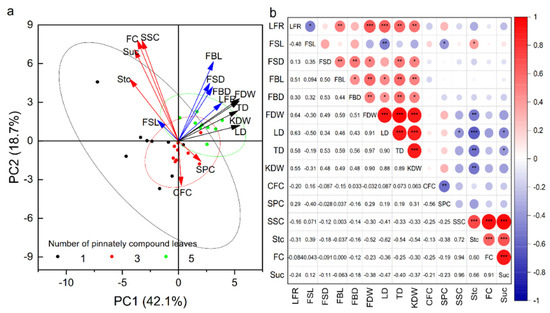
Figure 3.
Fruit quality is associated with the agronomic traits of fruit-bearing branches. (a) PCA shows the distribution of agronomic traits and fruit quality indicators for different leaf–to–fruit ratios. (b) Heatmap of Pearson correlation coefficients between branch traits and fruit quality indices. Abbreviations: FSL, fruit stalk length; FSD, fruit stalk diameter; FBL, fruit–bearing branch length; FBD, fruit–bearing branch diameter; FDW, fruit dry weight; KDW, kernel dry weight; LD, longitudinal diameter; TD transverse diameter; CFC, crude fat content; SPC, soluble protein content; LFR, the ratio of total leaf area to the number of fruits. * p < 0.05; ** p < 0.01; *** p < 0.001.
3.3. Relative Weights Analysis of the Effects of Branch Traits on Nut Quality
Determining which fruit–bearing branch traits have the greatest effect on fruit quality is important, as these traits can then be manipulated to improve fruit quality. Six models satisfying the regression hypothesis were determined by establishing the multiple regression relationships between the agronomic traits of fruit–bearing branches and each quality of fruits respectively (Figure S2a–f). The relative R2 contribution rates of different explanatory variables to the physical and chemical quality of fruits indicated that the number of pinnately compound leaves had the greatest relative weighted sum (277.8%) for fruit quality, followed by the number of fruits (110.8%), and finally, by fruit stalk diameter (100.6%) (Table S3). The response surface plots of the binary quadratic model showed that increasing NPCL and decreasing NF can increase average dry weight, longitudinal diameter, transverse diameter, kernel dry weight of fruits, and soluble protein content in the kernel, and decrease starch content (Figure 4a–f). Increasing NPCL and FSD can increase average dry weight, transverse diameter, and kernel dry weight of fruits (Figure 4g–j). Decreasing NPCL and increasing FSD can increase starch content in the kernel (Figure 4l). Decreasing NF and increasing FSD can increase average dry weight, longitudinal diameter, transverse diameter, kernel dry weight of fruits, and soluble protein content in the kernel (Figure 4m–q). Increasing NF and FSD can decrease starch content in the kernel (Figure 4r).
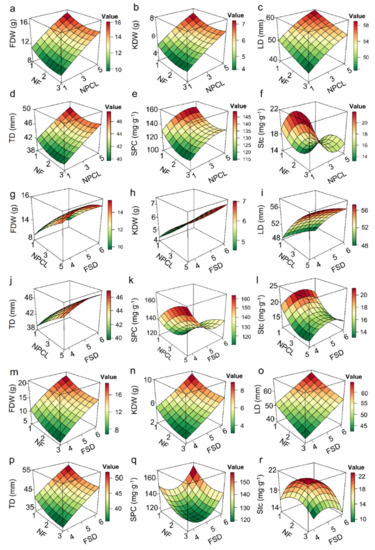
Figure 4.
Response surface diagrams of binary quadratic models of the effects of two main target traits on fruit dry weight, longitudinal diameter, crude fat yield, and soluble protein yield. (a–r) The two agronomic traits in panels (a–f) are fruit number and leaf number, the two traits in panels (g–l) are leaf number and fruit stalk diameter, and the two traits in panels (m–r) are the leaf number and diameter of fruit–bearing breaches.
3.4. Effects of the Source–Sink Relationship on Leaves
Leaves are the basis for ensuring high quality and high yield of fruits. Therefore, studying the effect of the source–sink relationship on leaf physiological characteristics could better reveal the mechanism of the source–sink relationship on fruit. The difference in the numbers of pinnately compound leaves (NPCL) and fruits (NF) on fruit–bearing branches can affect the physiological characteristics of leaves. In terms of photosynthetic and chlorophyll characteristics of leaves, an increasing number of pinnately compound leaves and decreasing number of fruits on fruit–bearing branches increased the net photosynthetic rate, chlorophyll content, and stomatal conductance of leaves (Figure 5A–C). The net photosynthetic rate of 3NPCL: 1NF and 5NPCL: 1NF was significantly higher than that of 1NPCL: (2NF–3NF) and 3NPCL: (2NF–3NF) (Figure 5A, p < 0.05). The chlorophyll content of 5NPCL: 1NF was significantly higher than that of 1NPCL: (1NF–3NF), 3NPCL: (2NF–3NF) and 5NPCL: (2NF–3NF) (Figure 5B, p < 0.05). The stomatal conductance of 5NPCL: (1NF–3NF) was significantly higher than that of 1NPCL: 3NF and 3NPCL: 3NF (Figure 5C, p < 0.05). In terms of the carbohydrates content in leaves, the source–sink relationship significantly affected the contents of soluble sugar and nonstructural carbohydrate in leaves (Figure 5D,E, p < 0.05), but starch content did not reach a significant difference (Figure 5F, p > 0.05). When the number of fruits was one and two, increasing NPCL increased the contents of soluble sugar and nonstructural carbohydrate of leaves, and 5NPCL: 1NF was significantly higher than 1NPCL: 1NF. While the number of fruits was three, there was no significant difference (p > 0.05) in the contents of soluble sugar and nonstructural carbohydrate among the treatments with the change of NPCL.
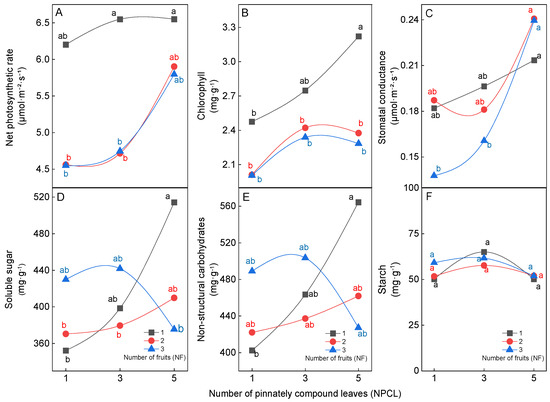
Figure 5.
Effects of the source–sink relationship on walnut leaves. Different lowercase letters indicate significant (p < 0.05) differences between branches with different leaf-to-fruit ratios.
3.5. Effects of Source–Sink Relationship on Leaf Anatomical Structure
The leaf anatomical structure has a relation to photosynthetic. The difference in the numbers of pinnately compound leaves and fruits on fruit–bearing branches can affect the anatomy of the leaf (Figure 6). First, branches with more pinnately compound leaves and fruits had higher leaf thickness and palisade mesophyll thickness than branches with fewer (Figure 6S,T). There was no significant difference among 5NPCL: (1NF–3NF), 3NPCL: (1NF–3NF) and 1NPCL: (2NF–3NF), and they were significantly higher than 1NPCL: 1NF (p < 0.05). Secondly, the ratio of palisade to spongy mesophyll, spongy mesophyll thickness, and size of mesophyll vascular bundles were the smallest in leaves of branches with the lowest numbers of pinnate compound leaves and fruits (1NPCL: 1NF, Figure 6U–X). There was no significant difference in the ratio of palisade to spongy mesophyll thickness among different treatments (p > 0.05), and (1–5) NPCL: 3NF and 1NPCL: 2NF were significantly higher than 1NPCL: 1NF (Figure 6U, p < 0.05). Finally, the branches with more pinnate compound leaves had less influence on the anatomical structure of leaves by the number of fruits. The coefficients of variation for all indicators of the leaf anatomy of 5NPCL: (1NF–3NF), 3NPCL: (1NF–3NF), and 1NPCL: (1NF–3NF) ranged from 7.7% to 20.4%, 11.3%–23.5%, and 12.2%–27.3%, respectively.
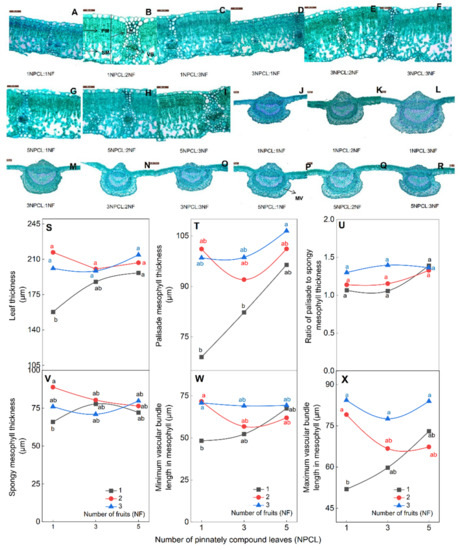
Figure 6.
Effects of the source–sink relationship on leaf anatomical structure. Shown (A–I) are the development diagrams under the 40× objective lens field of view. Shown (J–R) are the development diagrams of the main veins of leaves under the 2.5× objective lens. MV, main vein; VB, vascular bundle; PM, palisade mesophyll; SM, spongy mesophyll. Different lowercase letters indicate significant (p < 0.05) differences between branches with different leaf-to-fruit ratios.
3.6. Effects of Source–Sink Relationship on Fruit Stalk Anatomical Structure
The fruit stalk is the only channel through which carbohydrates are transported from the leaf to the fruit. The correlation analysis showed that there was a significant positive correlation between fruit stalk diameter and fruit physical indexes (Figure 3b, p < 0.05). Therefore, exploring the microstructures development of fruit stalks under different leaf–to–fruit ratios will help to deepen the mechanism of how the ratio regulates fruit development from the perspective of carbohydrate transport. The source–sink relationship affected the development of fruit stalks. The fruit stalk diameters of fruit–bearing branches with more pinnate compound leaves or fruits were larger; 5NPCL:3NF (5.7 mm) was significantly higher than 1NPCL:1NF (4.1 mm) (Table S1, p < 0.05). The lengths of the xylem and vascular bundle in the cross–section of fruit stalks also showed the same trend (Figure 7). However, the number and length of vascular bundle distributions had differences affected by the number of pith rays in the cross–section of fruit stalk under different leaf–to–fruit ratios. When the number of the pinnate compound leaf was one, three fruits had the largest numbers of pith rays and vascular bundles, and the smallest cross–sectional length of a single vascular bundle (respectively, 28, 27, and 113.0 μm), but two fruits were the opposite (respectively, 16, 15, and 282.3 μm). Whereas the leaves number was three, three fruits had the highest numbers of pith rays and vascular bundles, and the smallest cross–sectional length of a single vascular bundle (respectively, 31, 30, and 196.2 μm), one fruit had the lowest numbers of pith rays and vascular bundles (respectively, 12 and 11), and two fruits had the largest cross–sectional length of a single vascular bundle (263.0 μm). While the number of pinnate compound leaves was five, three fruits had the highest numbers of pith rays and vascular bundles, and the largest cross–sectional length of a single vascular bundle (respectively, 22, 21, and 369.9 μm), but one fruit had the lowest numbers of pith rays and vascular bundles (respectively, 12 and 11), and two fruits had the smallest cross–sectional length of a single vascular bundle (157.4 μm).
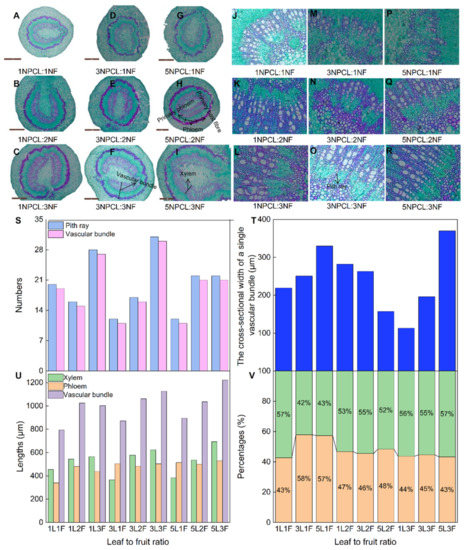
Figure 7.
Effects of the source–sink relationship on fruit stalk anatomical structure. Shown (A–I) are the development diagrams under the 2.5× objective lens field of view. Shown (J–R) are the development diagrams under the 20× objective lens.
4. Discussion
4.1. Agronomic Traits of Fruit-Bearing Branches Affect Nut Quality
The data presented here suggest that source–sink effects on nut quality are affected by the agronomic traits of the fruit–bearing branches (hypothesis 1). Variance, Principal component analysis, and correlation coefficients showed that nut quality was higher on branches with large leaf areas and diameters (Figure 2 and Figure 3). For example, the fruit dry weight, longitudinal diameter, transverse diameter, and kernel dry weight of fruits on branches with bigger leaf numbers (5NPCL: 1NF, 5NPCL: 2NF, and 5NPCL: 3NF) were higher than on branches with lower leaf numbers (1NPCL: 3NF) (Figure 2A–D), but soluble sugar content and starch content in the kernel were the opposite (Figure 2G,H). At the same time, the accumulation of carbohydrates in the fruit is related to the comprehensive influence of both the source–sink relationship and the saturation of carbohydrate demand on the fruit itself, which is regulated by carbohydrate supply capacity [11,29]. For instance, the number of fruits did not significantly affect the dry matter accumulation of fruits at the level of 3NPCL and 5NPCL and had significant differences at the level of 1NPCL (Figure 2A). In addition, when the number of fruits is the same, the longitudinal diameter of the fruit showed an allometric growth trend with an increasing leaf–to–fruit ratio (Figure 2C), increasing rapidly at first and then gradually flattening. Therefore, we concluded that lower fruits could not fully maximize crop yield, whereas the higher cannot itself produce high-quality fruits. The impact of the source–sink relationship on fruit quality has been reported in many tree species, including blueberry [8], apricot (Prunus armeniaca L.) [30], citrus, kiwifruit, and others. However, some studies have shown that the source–sink relationship does not affect fruit quality [19,20]. The different results of this study may be related to the growth of plants and the threshold of plant demand for carbohydrates. First, there are differences in the supply and demand of carbohydrates in fruit trees, so the division of sources and sinks may not reach the critical value at which carbohydrates affect fruit development. For example, the optimal leaf–to–fruit ratio of mango (Mangifera indica L.) is 60:1 [31], but that of plum (Prunus salicina Lindl.) is only 10:1 [32]. Second, when fruit trees meet their own growth needs, fruit trees can then call upon stored carbon in their tissues to meet the demand for carbohydrates, making up for the lack of carbohydrates produced by the source, at least to some extent [33]. Next, this difference may be related to the idea that those carbohydrates are involved in the morphological construction of organs. Like other green plants, fruit trees compete for carbohydrates among different organs [34], 50%–80% of photosynthates in source leaves are supplied to sink organs such as roots, stems, flowers, and fruits through phloem transport [35,36], to reduce the transport of carbohydrates from leaves to fruits. This reason was not fully considered both in this study and in other relevant research reports. Then, the productivity of trees can be involved by carbohydrate capture and environmental factors [37]. This study selected fruit–bearing branches with good light exposure at fruit maturity in the orchard with the same management level, which could, to some extent, avoid the measurement error caused by environmental differences. However, this paper ignored the influence of external environmental factors on the fruit’s annual growth and development process, including light, temperature, soil moisture, and soil nutrients, and whether the results apply to other years. Afterward, the formation of fruit chemical quality involves complex sugar metabolism and material transformation [38], and the influence of the source–sink relationship on fruit physical quality is often greater than its influence on fruit chemical quality [39]. Finally, the cultivation and management of fruit trees also affect the output of carbohydrates from source to sink and the effect of fruit load on contents of nonstructural carbohydrates and nitrogen in leaves has a greater impact on leaf photosynthesis than the relationship between light and source and sink [3]. Previous researchers have considered the influence of the source–sink relationship on fruit quality from the perspectives of fruit tree load, leaf–to–fruit ratio, and girdling, but less attention has been paid to the correlation between fruit–bearing branch traits and fruit quality. The carbohydrate transport capacity from leaf to fruit is also affected by branch traits [4]. In the present study, we did not consider that the number of fruits on the tree as whole affected fruit quality, and whether the effect of branch traits on fruit quality is affected by the total fruit load will be required further study. In addition, this study preliminarily determined the leaf–to–fruit ratio threshold (1NPCL: 2NF and 1NPCL: 3NF) that significantly affected the physical quality of walnut nuts, and analyzed the differences between fruits on the same fruit stalk. The results showed that the fruit quality on the top of the fruit stalk was better than on the bottom (Table S2), especially in 1NPCL:(2–3) NF (hypothesis 4), which provided a theoretical reference for artificial fruit thinning. However, there was a lack of investigation on the influence that leaf–to–fruit ratio effects on fruit annual development, which could not provide theoretical guidance for the determination of early fruit thinning time. How to determine the thinning time and improve the physical quality of fruit need to be further researched.
4.2. Relationships between Branch Traits and Nut Quality Indices
Based on the principle of the maximum R2 and minimum standard deviation of residual error, multiple models of fruit quality indices and branch traits were constructed, of which models characterized by physical quality satisfied the regression hypothesis. Their explanatory degree reached more than 72%, indicating that branch traits are one of the relevant factors affecting fruit quality under conditions of similar field management and microenvironment. Compared with previous studies, we found that branch diameter had a positive effect on fruit quality. Since the carbohydrate output of short branches is higher and occurs earlier than that of long shoots, higher yields can be harvested [4]. In addition, the explanatory degree of models of fruit physical quality was higher than that of models of chemical quality. This result may be related to the regulation of carbohydrate transport and carbohydrate metabolism in fruit by the agronomic traits of short fruiting branches [40]. There have also been reports on the molecular mechanisms by which source and sink changes regulate fruit quality [41,42]. In this study, the fruit size, crude fat content, and soluble protein content of kernels treated with a lower leaf–fruit ratio were smaller than other leaf–fruit ratios, but soluble sugar content, starch content, and sucrose sugar content of the kernels were higher. Recent research shows that the biosynthesis of nutrients in walnut kernels is regulated by molecular mechanisms and physiological metabolism [43]. However, little is known about how sources and sinks change the molecular mechanisms and physiological metabolism responsible for fruit quality. Therefore, further studies on the mechanism by which branch traits influence fruit quality from metabolic, transcriptomic, and proteomic perspectives will be helpful for establishing a link between carbohydrate synthesis, transport, and utilization.
4.3. Relative Weights Relationships between Branch Traits and Nut Quality
Identifying branch traits that affect fruit quality and determining how to regulate fruit quality by manipulating these traits are relevant for walnut production. Based on the R2 contribution rates of branch traits to fruit quality indices, we found that the three most important explanatory variables for each dependent variable were the number of pinnately compound leaves, number of fruits, and fruit stalk diameter, respectively (Table S3). The number of leaves and fruit stalk diameter promoted fruit quality, whereas the number of fruits did not (Figure 4). However, the fruit number significantly reduced the physical quality of fruit only when the number of leaves was low, not high. Since, when the number of pinnately compound leaves was higher, the leaf area on fruiting branches was larger and the photosynthetic performance of leaves (net photosynthetic rate, stomatal conductance, and chlorophyll content) was also higher (Figure 5). The microstructure of leaves showed that branches with higher NPCL and NF had more densely distributed laterally and more widely distributed longitudinally palisade tissue in the mesophyll (Figure 6). Therefore, a higher number of pinnately compound leaves can produce more carbohydrates flowing to the fruit, which may indicate that the capacity of carbohydrate supply to fruit is a limiting factor affecting fruit physical quality (hypothesis 3). Furthermore, a previous study has found that plant carbohydrate transport capacity is regulated by the supply and utilization of carbohydrates [44]. In this report, the microstructure of leaves showed that branches with a higher number of leaves and number of fruits had better–developed transport tissue between the main vein and the mesophyll (Figure 6), the cross–sectional microstructure of the fruit stalk also showed that there were more and better developed vascular bundles in the fruit stalk and a larger area of the phloem and xylem in the stalk when the numbers of leaves and fruits were higher (Figure 7), and fruit physical quality was better when the number of leaves, fruit stalk diameter, and the number of fruits was higher (Figure 3). The data presented here suggest that the regulation of carbohydrate transport capacity by the source and sink may be related to the carbohydrate supply capacity of the leaves and the carbohydrate utilization capacity of the fruits (hypothesis 2), and provided further evidence that carbohydrate transportability was regulated by the source–sink ratio. Studies have found that efficient carbohydrate transports from source to sink can prevent large numbers of nonstructural carbohydrates from blocking the sieve tube [45], thus reducing the inhibition of C metabolism and the destruction of chloroplasts [46], improving photosynthetic capacity [47], and delaying leaf senescence [48]. Zhang et al. [22] showed that the inhibition of leaf growth and the accumulation of starch content in leaves were the reasons for the decrease in the net photosynthetic rate of 1NPCL: (1–3) NF and 5NPCL: (1–3) NF, respectively. This study found that the starch content in the leaves of 1NPCL: (1–3) NF was not the highest, but the net photosynthetic rate and chlorophyll content were the lowest, and the starch content in the leaves of 3NPCL: (1–3) NF was the highest, but the net photosynthetic rate and chlorophyll content were not the lowest, and the starch content in the leaves of 5NPCL: (1–3) NF was at a low level, but the net photosynthetic rate, chlorophyll content and nonstructural carbohydrates were at a high level. These data further support that starch accumulation in leaves and leaf senescence may be reasons for reducing photosynthetic rate, which seems to indicate that the regulation mechanism of the leaf to fruit ratio photosynthesis depends on the supply capacity of carbohydrates. When collecting samples in the field, we found that the fruits with a lower leaf–to–fruit ratio showed precocity compared with higher, and the phenomenon of peel cracking and discoloration was more obvious, these findings may indicate that fruit precocious is another factor in reducing the leaf photosynthesis. Although this study analyzed the effect of leaf–to–fruit ratio on fruit quality in terms of agronomic traits of fruit–bearing branches during the fruit ripening stage, there was a lack of data obtained at different stages of fruit growth and development and did not have a more comprehensive understanding of the effects of carbohydrate assimilation, transport, and utilization on fruit quality on the time scale. Therefore, the effect of the leaf–to–fruit ratio on fruit quality regulation on a time scale needs to be further studied. At the same time, the carbohydrate supply capacity of the source leaf, the carbohydrate transport capacity of the transport tissue, and the carbohydrate utilization capacity of the sink organs all affect long–distance transport in the phloem [49,50]. However, the integrity of the transport of carbohydrates and other nutrients from source to sink depends on active and passive transport, which is regulated by complex physiological processes, cell structures, and molecular mechanisms [49,51]. The phloem structure and function models have suggested that the flow of carbohydrates from source to sink is determined by the cross–sectional area of the sieve plate, the phloem sap concentration, the hydraulic conductivity of the sieve tube, and the hydrostatic pressure difference between the source and the reservoir [52]. Furthermore, transporter proteins involved in the transport of specific substances are also limiting factors that affect the long–distance transport of carbohydrates [53]. For example, overexpression of exogenous invertase [54] and downregulation of a sucrose transporter [55] in tomato leaves inhibited the transfer and transport of carbohydrates, thereby affecting plant growth. In future research, it will be important to determine how to connect structure and function based on the regulation of complex biological activities such as plant physiology, cell structure, and molecular mechanisms to study the processes that regulate carbohydrate synthesis, transport, and distribution. Such research will enrich our understanding of the mechanisms by which the source–sink relationship regulates fruit growth and development.
5. Conclusions
In terms of proposed questions, the study results allow us to state that fruit–bearing branch agronomic traits regulate walnut nut quality, and that uneven fruit size is associated with source–sink imbalance. On the one hand, the main target agronomic characters affecting fruit and the range of leaf fruit ratio in line with agriculture is determined, which provides basic data for improving fruit quality from the aspect of optimizing agronomic characters. On the other hand, supporting the hypothesis that fruit quality is comprehensively regulated by carbohydrate assimilation, transport, and distribution, offers insights into the reasons why source–sink affects walnut fruit quality. Firstly, the photosynthetic capacity, carbohydrate transport capacity, and fruit quality of branches with more leaves and fruits were better than those with fewer. However, the regulation of leaf–to–fruit ratio on leaf photosynthetic capacity cannot be explained by the feedback hypothesis caused by the accumulation of nonstructural carbohydrates in leaves, and that may be related to the fruit senescence and the regulation strategy of carbohydrate transport to the fruit with the growth period. Therefore, the regulation mechanism of leaf nonstructural carbohydrates with fruit development on a time scale needs to be further ascertained. Secondly, only when the number of leaves was fewer did the variation in the fruit number significantly affect the interindividual variability of the fruit, and the fruit located at the top of the fruit stalk was better than the middle and bottom. Finally, among the three important agronomic traits affecting the fruit, the number of leaves and the diameter of the fruit stalk promoted the fruit quality, but the fruit number significantly reduced the fruit quality (especially when the number of leaves is low). Therefore, in agricultural production, an optimal range of leaf–to–fruit ratio should be encouraged if the walnut cultivation is to improve. It appears that the physical quality of the fruit can be optimized by improving the agronomic traits of the fruiting shoots, thereby maximizing the transport of carbohydrates from the leaf to the fruit. In light of this, when the branches with one pinnate compound leaves, we considered increasing the leaf area and retaining the fruit at the top of the stalk to improve the nut quality; with three and five, increasing the leaf area and branch diameter seems to help improve both fruit yield and quality.
Supplementary Materials
The following are available online at https://www.mdpi.com/article/10.3390/f13071034/s1, Figure S1: The relationship between predicted and measured values of leaf area for (a) the upper leaflet and (b) the opposite leaflet closest to the upper leaflet of pinnately compound leaf in walnut, Figure S2: Multiple regression analyses between fruit dry weight (a), kernel dry weight (b), longitudinal diameter (c), transverse diameter (d), soluble protein content (e), starch content (f), soluble sugar content (g), and crude fat content (h) and agronomic traits of fruit-bearing branches, based on the selection of models with the highest R2 values, Table S1: Agronomic traits of fruit-bearing branches, Table S2: Nut quality at different positions on the fruit stalk, Table S3: Influence of explanatory variables on response variables in models with the highest adjr2.
Author Contributions
S.Z.: Formal analysis, Investigation, Writing—Original Draft, Visualization, and Writing—Review and Editing. C.P.: Conceptualization and Writing—Review and Editing. H.C.: Conceptualization, Writing—Review and Editing, Supervision, and Funding acquisition. All authors have read and agreed to the published version of the manuscript.
Funding
This research was funded by the National Natural Science Foundation of China (Grant No. 31960325 and 31760219), 2021 Tianshan Talent Plan of Autonomous Region (3rd period), Xinjiang Agricultural University Postdoctoral Fund, and Xinjiang Agricultural University Postdoctoral Station.
Institutional Review Board Statement
Not applicable.
Informed Consent Statement
Not applicable.
Data Availability Statement
Data are contained within the article or Supplementary Materials.
Acknowledgments
We sincerely thank everyone who contributed their time and effort to the manuscript. We thank Hesong Wang, Guanghui Zhou, and Wei Lv, who were involved in collecting the data.
Conflicts of Interest
The authors declare that they have no conflict of interest. The funder had no role in the study design, data collection, and analysis; decision to publish; or preparation of the manuscript.
References
- Smith, M.R.; Rao, I.M.; Merchant, A. Source-Sink Relationships in Crop Plants and Their Influence on Yield Development and Nutritional Quality. Front. Plant Sci. 2018, 9, 1889–1899. [Google Scholar] [CrossRef]
- Pawar, R.; Rana, V. Manipulation of Source-Sink Relationship in Pertinence to Better Fruit Quality and Yield in Fruit Crops: A Review. Agric. Rev. 2019, 40, 200–207. [Google Scholar] [CrossRef]
- Ngao, J.; Martinez, S.; Marquier, A.; Bluy, S.; Saint-Joanis, B.; Costes, E.; Pallas, B. Spatial variability in carbon and nitrogen related traits in apple trees: The effects of the light environment and crop load. J. Exp. Bot. 2020, 72, 559–590. [Google Scholar] [CrossRef]
- Rosati, A.; Paoletti, A.; Hariri, R.A.; Famiani, F. Fruit production and branching density affect shoot and whole-tree wood to leaf biomass ratio in olive. Tree Physiol. 2018, 38, 1278–1285. [Google Scholar] [CrossRef]
- Paul, M.J.; Foyer, C.H. Sink regulation of photosynthesis. J. Exp. Bot. 2001, 52, 1383–1400. [Google Scholar] [CrossRef]
- Génard, M.; Dauzat, J.; Franck, N.; Lescourret, F.; Moitrier, N.; Vaast, P.; Vercambre, G. Carbon allocation in fruit trees: From theory to modelling. Trees 2008, 22, 269–282. [Google Scholar] [CrossRef]
- Campany, C.E.; Medlyn, B.E.; Duursma, R.A. Reduced growth due to belowground sink limitation is not fully explained by reduced photosynthesis. Tree Physiol. 2017, 37, 1042–1054. [Google Scholar] [CrossRef]
- Usenik, V.; Orazem, P.; Stampar, F. Low leaf to fruit ratio delays fruit maturity of ‘Lapins’ sweet cherry on Gisela 5. Sci. Hortic. 2010, 126, 33–36. [Google Scholar] [CrossRef]
- Jorquera-Fontena, E.; Alberdi, M.; Franck, N. Pruning severity affects yield, fruit load and fruit and leaf traits of ‘Brigitta’ blueberry. J. Soil Sci. Plant Nut. 2014, 14, 855–868. [Google Scholar] [CrossRef]
- Jorquera-Fontena, E.; Pastenes, C.; Meriño-Gergichevich, C.; Franck, N. Effect of source/sink ratio on leaf and fruit traits of blueberry fruiting canes in the field. Sci. Hortic. 2018, 241, 51–56. [Google Scholar] [CrossRef]
- Minchin, P.E.H.; Snelgar, W.P.; Blattmann, P.; Hall, A.J. Competition between fruit and vegetative growth in Hayward kiwifruit. J. Crop Hortic. Sci. 2010, 38, 101–112. [Google Scholar] [CrossRef]
- Chacko, E.K.; Reddy, Y.T.N.; Ananthanarayanan, T.V. Studies on the relationship between leaf number and area and fruit development in mango (Mangifera indica L.). J. Hortic. Sci. 1982, 57, 483–492. [Google Scholar] [CrossRef]
- Cheng, J.S.; Fan, P.G.; Liang, Z.C.; Wang, Y.Q.; Li, S.H. Accumulation of end products in source leaves affects photosynthetic rate in peach via alteration of stomatal conductance and photosynthetic efficiency. J. Am. Soc. Hortic. Sci. 2009, 134, 667–676. [Google Scholar] [CrossRef]
- Nafziger, E.D.; Koller, H.R. Influence of Leaf Starch Concentration on CO2 Assimilation in Soybean. Plant Physiol. 1976, 57, 560–563. [Google Scholar] [CrossRef]
- Rolland, F.; Baena-Gonzalez, E.; Sheen, J. Sugar sensing and signaling in plants: Conserved and novel mechanisms. Annu. Rev. Plant Biol. 2006, 57, 675–709. [Google Scholar] [CrossRef]
- Duan, W.; Fan, P.G.; Wang, L.J.; Li, W.D.; Yan, S.T.; Li, S.H. Photosynthetic response to low sink demand after fruit removal in relation to photoinhibition and photoprotection in peach trees. Tree Physiol. 2008, 28, 123–132. [Google Scholar] [CrossRef]
- Parker, A.K.; Hofmann, R.W.; Leeuwen, C.V.; McLachlan, A.R.G.; Trought, M.C.T. Leaf area to fruit mass ratio determines the time of veraison in Sauvignon Blanc and Pinot Noir grapevines. Aust. J. Grape Wine Res. 2014, 20, 422–431. [Google Scholar] [CrossRef]
- Antoine, S.; Pailly, O.; Gibon, Y.; Luro, F.; Santini, J.; Giannettini, J.; Berti, L. Short-and long-term effects of carbohydrate limitation on sugar and organic acid accumulation during mandarin fruit growth. J. Sci. Food Agric. 2016, 96, 3906–3914. [Google Scholar] [CrossRef]
- Famiani, F.; Antognozzi, E.; Boco, M.; Tombesi, A.; Battistelli, A.; Moscatello, S.; Spaccino, L. Effects of altered source-sink relationships on fruit development and quality in actinidia deliciosa. Acta Hortic. 1997, 1, 355–360. [Google Scholar] [CrossRef]
- Proietti, P.; Nasini, L.; Famiani, F. Effect of different leaf-to-fruit ratios on photosynthesis and fruit growth in olive (Olea europaea L.). Photosynthetica 2006, 44, 275–285. [Google Scholar] [CrossRef]
- Zhang, C.F.; Pan, C.D.; Chen, H. Effects of leaf-to-fruit ratio on chlorophyll fluorescence parameters of walnut (Juglans regia L.) leaves. Photosynthetica 2018, 56, 1429–1436. [Google Scholar] [CrossRef]
- Zhang, C.F.; Pan, C.D.; Chen, H. The long-term response of photosynthesis in walnut (Juglans regia L.) leaf to a leaf-to-fruit ratio. Photosynthetica 2019, 57, 762–771. [Google Scholar] [CrossRef]
- Ning, W.J.; Zhang, Q.; Huang, M.M.; Liu, X.L. Effects of loading capacity on tree nutrition, growth and fruit quality of Xinxin 2 walnut. Int. J. Fruit Sci. 2021, 38, 1550–1556. [Google Scholar] [CrossRef]
- Brown, R.H.; Mueller-Harvey, I. Evaluation of the novel soxflo technique for rapid extraction of crude fat in foods and animal feeds. J. AOAC Int. 1999, 82, 1369–1374. [Google Scholar] [CrossRef]
- Mao, X.Y.; Zhu, X.R.; Wan, Y.S.; Tian, H.L.; Zhan, P.; Wang, D.D. The composition analyses of walnut protein and optimization of extraction process. J. Chin. Inst. Food Sci. Technol. 2019, 19, 195–205. [Google Scholar] [CrossRef]
- Zhang, Z.L.; Qu, W.Q. The Experimental Guide for Plant Physiology, 3rd ed.; Higher Education Press: Beijing, China, 2003; pp. 127–129. ISBN 7-04-012168-9. [Google Scholar]
- Viles, F.J.; Silverman, L. Determination of starch and cellulose with anthrone. Anal. Chem. 1949, 21, 950–953. [Google Scholar] [CrossRef]
- Lichtenthaler, H.K. Chlorophylls and carotenoids: Pigments of photosynthetic biomembranes. Methods Enzymol. 1987, 148, 350–382. [Google Scholar] [CrossRef]
- Fernandez, F.J.; Ladux, J.L.; Searles, P.S. Dynamics of shoot and fruit growth following fruit thinning in olive trees: Same season and subsequent season responses. Sci. Hortic. 2015, 192, 320–330. [Google Scholar] [CrossRef]
- Roussos, P.A.; Sefferou, V.; Denaxa, N.K.; Tsantili, E.; Stathis, V. Apricot (Prunus armeniaca L.) fruit quality attributes and phytochemicals under different crop load. Sci. Hortic. 2011, 122, 472–478. [Google Scholar] [CrossRef]
- Simmons, S.L.; Hofman, P.J.; Whiley, A.W.; Hetherington, S.E. Effects of leaf to fruit ratios on mango (Mangifera indica L. ‘Kensington’) fruit growth, nutrition and quality. Acta Hortic. 1998, 464, 47–52. [Google Scholar] [CrossRef]
- Maage, F. Fruit development of victoria plims in relation to leaf number. Acta Hortic. 1994, 359, 190–194. [Google Scholar] [CrossRef]
- Körner, C. Carbon limitation in trees. J. Ecol. 2010, 91, 4–17. [Google Scholar] [CrossRef]
- Dann, I.R.; Wildes, R.A.; Chalmers, D.J. Effects of limb girdling on growth and development of competing fruit and vegetative tissues of peach trees. Aust. J. Plant Physiol. 1984, 11, 49–58. [Google Scholar] [CrossRef]
- Ainsworth, E.A.; Bush, D.R. Carbohydrate export from the leaf: A highly regulated process and target to enhance photosynthesis and productivity. Plant Physiol. 2011, 155, 64–69. [Google Scholar] [CrossRef]
- Ryan, M.G.; Oren, R.; Waring, R.H. Fruiting and sink competition. Tree Physiol. 2018, 38, 1261–1266. [Google Scholar] [CrossRef]
- Pinkard, E.A.; Eyles, A.; O’grady, A.P. Are gas exchange responses to resource limitation and defoliation linked to source:sink relationships? Plant Cell Environ. 2011, 34, 1652–1665. [Google Scholar] [CrossRef]
- Alem, H.; Torregrosa, L.; Rigou, P.; Schneider, R.; Ojeda, H. Effect of the plant sink/source balance on the metabolic content of the Vitis vinifera L. red grape. Eur. J. Agron. 2021, 122, 126168. [Google Scholar] [CrossRef]
- Xie, P.; Guo, S.J. Effect of leaf-to-husk ratios on carbohydrate, yield and quality in chinese chestnut (Castanea mollissima Bl). J. Food Sci. Technol. 2013, 5, 955–959. [Google Scholar] [CrossRef]
- Nebauer, S.G.; Renau-Morata, B.; Guardiola, J.L.; Molina, R.V. Photosynthesis down-regulation precedes carbohydrate accumulation under sink limitation in Citrus. Tree Physiol. 2011, 31, 169–177. [Google Scholar] [CrossRef]
- Wu, B.H.; Ning, N.; Li, J.H.; Li, S.H. Leaf: Fruit ratio affects the proteomic profile of grape berry skins. J. Am. Soc. Hortic. Sci. 2013, 138, 416–427. [Google Scholar] [CrossRef]
- Silva, A.; Noronha, H.; Dai, Z.W.; Delrot, S.; Gerós, H. Low source–sink ratio reduces reserve starch in grapevine woody canes and modulates sugar transport and metabolism at transcriptional and enzyme activity levels. Planta Int. J. Plant Biol. 2017, 246, 525–535. [Google Scholar] [CrossRef]
- Wang, H.; Asker, K.; Zhan, C.; Wang, N. Transcriptomic and metabolic analysis of fruit development and identification of genes involved in raffinose and hydrolysable tannin biosynthesis in walnuts. J. Agric. Food Chem. 2021, 69, 8050–8062. [Google Scholar] [CrossRef]
- Salmerón, V.L.; Cho, H.; Tonn, N.; Greb, T. The phloem as a mediator of plant growth plasticity. Curr. Biol. 2019, 29, 173–181. [Google Scholar] [CrossRef]
- Sjolund, R.D. The Phloem Sieve Element: A river runs through it. Plant Cell 1997, 9, 1137–1146. [Google Scholar] [CrossRef]
- Delucia, E.H.; Sasek, T.W.; Strain, B.R. Photosynthetic inhibition after long-term exposure to elevated levels of atmospheric carbon dioxide. Photosynth. Res. 1985, 7, 175–184. [Google Scholar] [CrossRef] [PubMed]
- Krapp, A.; Quick, W.P.; Stitt, M. Ribulose-1,5-bisphosphate carboxylase-oxygenase, other Calvin-cycle enzymes, and chlorophyll decrease when glucose is supplied to mature spinach leaves via the transpiration stream. Planta 1991, 186, 58–69. [Google Scholar] [CrossRef] [PubMed]
- Pourtau, N.; Jennings, R.; Pelzer, E.; Pallas, J.; Wingler, A. Effect of sugar-induced senescence on gene expression and implications for the regulation of senescence in Arabidopsis. Planta 2006, 224, 556–568. [Google Scholar] [CrossRef] [PubMed]
- Lucas, W.J.; Groover, A.; Lichtenberger, R.; Furuta, K.; Yadav, S.R.; Helariutta, Y.; He, X.Q.; Fukuda, H.; Kang, J.L.; Brady, S.M.; et al. The plant vascular system: Evolution, development and functions. J. Integr. Plant Biol. 2013, 55, 294–388. [Google Scholar] [CrossRef]
- Liesche, J. Phloem: Methods and Protocols; Humana New York: New York, NY, USA, 2019; pp. 223–233. ISBN 978-1-4939-9562-2. [Google Scholar]
- Knoblauch, M.; Knoblauch, J.; Mullendore, D.L.; Savage, J.A.; Babst, B.A.; Beecher, S.D.; Dodgen, A.C.; Jensen, K.H.; Holbrook, N.M. Testing the münch hypothesis of long distance phloem transport in plants. eLife 2016, 5, e15341. [Google Scholar] [CrossRef]
- Lalonde, S.; Tegeder, M.; Throne-Holst, M.; Frommer, W.B.; Patrick, J.W. Phloem loading and unloading of sugars and amino acids. Plant Cell. Environ. 2003, 26, 37–56. [Google Scholar] [CrossRef]
- Chen, L.Q. SWEET sugar transporters for phloem transport and pathogen nutrition. New Phytol. 2014, 201, 1150–1155. [Google Scholar] [CrossRef]
- Dickinson, C.D.; Altabella, T.; Chrispeels, M. Slow-growth phenotype of transgenic tomato expressing apoplastic invertase. Plant Physiol. 1991, 95, 420–425. [Google Scholar] [CrossRef]
- Riesmeier, J.W.; Willmitzer, L.; Frommer, W.B. Evidence for an essential role of the sucrose transporter in phloem loading and assimilate partitioning. EMBO J. 1994, 13, 1–7. [Google Scholar] [CrossRef]


Publisher’s Note: MDPI stays neutral with regard to jurisdictional claims in published maps and institutional affiliations. |
© 2022 by the authors. Licensee MDPI, Basel, Switzerland. This article is an open access article distributed under the terms and conditions of the Creative Commons Attribution (CC BY) license (https://creativecommons.org/licenses/by/4.0/).