Article

Predicting Climate Change Impacts on the Rare and Endangered Horsfieldia tetratepala in China

1
School of Advanced Study, Taizhou University, Taizhou 318000, China
2
Zhejiang Provincial Key Laboratory of Plant Evolutionary Ecology and Conservation, Taizhou University, Taizhou 318000, China
3
Plant Phylogenetics and Conservation Group, Center for Integrative Conservation, Xishuangbanna Tropical Botanical Garden, Chinese Academy of Sciences, Kunming 650223, China
4
University of Chinese Academy of Sciences, Beijing 100049, China
5
Taizhou Research Institute, Southern University of Science and Technology, Taizhou 318000, China
*
Author to whom correspondence should be addressed.
Forests 2022, 13(7), 1051; https://doi.org/10.3390/f13071051
Submission received: 20 May 2022 / Revised: 23 June 2022 / Accepted: 28 June 2022 / Published: 3 July 2022
(This article belongs to the Special Issue Forest Species Distribution and Diversity under Climate Change)

Abstract

:
Global climate change has become a major threat to biodiversity, posing severe challenges to species conservation. This is particularly true for species such as Horsfieldia tetratepala that have extremely small populations in the wild. Little is known about the species distribution of H. tetratepala in the current climate, as well as how that will change with potential future climates. The key environmental factors that influence its expansion, especially its habitat sustainability and its potential to adapt to climate change, are also unknown, though such information is vital for the protection of this endangered species. Based on six climate factors and 25 species distribution points, this study used the maximum entropy model (MaxEnt) to simulate the potential distribution for H. tetratepala in three periods (current, 2050s, and 2070s), and to investigate the changes in distribution patterns and the main environmental factors affecting species distribution. The modeling results show that the most important bioclimatic variables affecting H. tetratepala were precipitation of the warmest quarter (Bio_18) and temperature seasonality (Bio_4). The suitable areas for H. tetratepala will gradually be lost in Yunnan but will be generally offset in the northeastward direction, expanding in Hainan, Guangzhou, and Taiwan provinces under the future climate conditions. Therefore, we recommend protecting the habitats of H. tetratepala in Yunnan and strengthening the in-depth species investigation and monitoring in areas (Hainan, Guangzhou, and Taiwan) where no related reports of H. tetratepala have been reported. The results improve our understanding of this species’ response under the changing climate and benefit strategies for its conservation.

1. Introduction

With the progress and development of human society and science and technology, the global climate is constantly changing, posing a serious threat to many endangered species and biodiversity on earth [1]. Biodiversity is vital to human well-being but has been declining throughout human history due to human disturbances, even driving the sixth mass extinction in Earth’s history [2,3,4]. Loss of biodiversity not only affects the function of natural ecosystems but threatens the well-being of human beings [3]. Biodiversity conservation has become a global strategy, and countries are actively carrying out biodiversity conservation. The current threats to the world’s species suggest that the rate of species extinction is likely to have risen fivefold over the past few years and is continuing to increase, so it is particularly important and urgent to formulate a reasonable and efficient conservation plan [3,5]. China is a recognized biodiversity hotspot and one of the main global priority conservation areas in the world, as stated by the International Biodiversity Conservation Organization [6]. Therefore, the protection of biodiversity in China is important, not only for China but also for the entire world. However, due to factors such as rapid population growth, rapid economic and sustained growth, and insufficient social awareness, biodiversity conservation in China still faces serious threats [1,7].
Rapid climate change and human-driven land-use change have become the greatest drivers threatening biodiversity [8,9,10]. Climate change affects the current and future distribution of many species, influencing ecosystems and biotas worldwide [11,12,13,14,15,16]. Global warming has caused significant changes in spatial and temporal environmental patterns, affecting efforts to conserve biodiversity [17,18,19,20,21]. Rapidly changing climates have continued to result in the serious degradation or loss of species habitats, causing declines in population sizes or even the extinction of endangered species [22,23,24,25,26,27,28,29]. Predicting the potential distribution of endangered species can alert scientists and policymakers to the potential risks that future climate change will pose on their environments to help them propose positive coping strategies to mitigate these impacts [30,31].
One of the most important challenges for the conservation of endangered species is to resolve uncertainty surrounding species distribution [32]. In recent decades, the development of species distribution models (SDMs) has contributed to solving this challenge [33]. Utilizing SDMs to predict the potential geographical distribution of species is a hotspot in biodiversity conservation research, and has great significance for developing effective biodiversity conservation strategies [14,15,34]. Based on current species occurrence data and environmental variables, SDMs have been widely used to evaluate the potential distribution of species without biodiversity observations [28,35,36,37,38]. Subsequently, many methods have been proposed for the construction of SDMs, such as random forests (RF) [39], maximum entropy models (MaxEnt) [40], and generalized linear models (GLM) [41]. Among these SDMs, MaxEnt modeling integrates machine learning and maximum entropy principles to predict the potential distribution areas of species, and have become the most powerful and extensively used models owing to their operation simplicity, faster operational capability, and high accuracy, even with minimal occurrence data points [40,42,43,44,45,46,47]. For endangered species that have few observational occurrences and live in areas where it is difficult to collect occurrence data, the MaxEnt model provides an ideal model to predict their potential distributions under global climate change [14,15,34,36].
Horsfieldia tetratepala C. Y. Wu, a plant species with extremely small populations (PSESP), belongs to the genus Horsfieldia of Myristicaceae [10,48]. The distribution area of H. tetratepala is mainly affected by the tropical monsoon climate, in which the average annual temperature is 20~25 °C and the average annual rainfall is 1500~3500 m [49]. Research has shown that the seeds of this species are mainly dispersed by frugivorous birds, mammals, some reptiles and gravity dispersal [50,51]. During a field survey in 2018, the species was found to be disappearing due to the expansion of banana and rubber cultivation and tourism development. Furthermore, H. tetratepala have high economic value, e.g., their trunks can be used for redwood furniture and high-end decorative woodwork, and their oily seeds are an ideal source of biodiesel [52,53,54]. Combined with field observations, H. tetratepala is growing in the tropical monsoon forest and is now scattered in the dense limestone karst forests of Yunnan and Guangxi province on latosol soils, with only a few hundred wild individuals remaining [55]. Previous studies on this plant have focused on breeding technology [56], phytochemistry [57], taxonomy [58], community characteristics [53], vegetative characteristics [59], and the genetic diversity and population structure of H. tetratepala [55,59]. Little information is available about the potential distribution of H. tetratepala in the current climate, as well as how those patterns will change in potential future climates; especially, little is known about its habitat sustainability and its potential to adapt to climate change, which is vital for the protection of this endangered species.
In this study, we used the MaxEnt 3.4.1 (American Museum of Natural History, New York, USA) model to simulate the potential distribution areas of H. tetratepala under different climatic backgrounds (Current, 2041–2060 and 2061–2080). This study examined what the main climatic factors affecting the distribution of H. tetratepala are, how the potential distribution pattern of the species changes under different climate change backgrounds, and where areas are that will be suitable for potential conservation translocations for the species in the future. Here, we will test the hypothesis that the species distribution of H. tetratepala would perform a northward shift to track the climatic niche in temperature and precipitation, and the suitable habitat areas will shrink under climate warming. These results could provide a robust and effective theoretical basis for the preservation, management, development, and implementation of germplasm resources for H. tetratepala.

2. Materials and Methods

2.1. Current Species Data

The current distribution data for H. tetratepala was obtained from the Global Biodiversity Information Facility (GBIF, https//www.gbif.org, accessed on 1 March 2017), National Specimen Information Infrastructure (NSII; http://www.nsii.org.cn, accessed on 1 March 2017), the Chinese Virtual Herbarium (CVH; http://www.cvh.org.cn, accessed on 1 March 2017), the Plant Photo Bank of China (PPBC; http://ppbc.iplant.cn, accessed on 1 March 2017), and from field investigations on this species around its distribution range (149 individuals, samples from Yunnan and Guangxi province) in 2018. The total records were also filtered at a resolution of 2.5 arcminutes. Records without longitude or latitude and those that were repetitive were removed [60,61]. A total of 25 distribution points for H. tetratepala were obtained for final analysis and were employed to generate the potential distribution based on the MaxEnt model (Figure 1; Table S1).

2.2. Environmental Variables

The 19 bioclimatic variables from the current periods were extracted from the WorldClim database (http://www.worldclim.org, accessed on 10 March 2021) with a 2.5 arcminutes resolution. To avoid overfitting the prediction results from species distribution models, the Pearson correlation coefficient was performed for the 19 bioclimatic variables in R-3.6.3 software (eliminate Pearson correlation coefficient |r| > 0.8 and the bioclimatic variables with low contribution, accessed on 15 March 2021) [62,63,64].
To predict the potential distribution of H. tetratepala under future climate conditions, future bioclimatic variable data (2041–2060 and 2061–2080) were downloaded from the WorldClim dataset (http://www.worldclim.org, accessed on 10 March 2021) with two global climatic models (BCC-CSM2-MR, Beijing Climate Center Climate System Model; and MIROC6, Model for Interdisciplinary Research on Climate) and four emission scenarios of the shared socioeconomic pathways (SSPs) (SSP1-2.6, SSP2-4.5, SSP3-7.0, and SSP5-8.5) provided by the CMIP6 of the sixth assessment report (AR6) of the Intergovernmental Panel on Climate Change (IPCC). Four SSPs (SSP1-2.6, SSP2-4.5, SSP3-7.0, and SSP5-8.5) represent net radiative forcing of 2.6, 4.5, 7.0, and 8.5 W/m2 at the end of the year 2100, and represent a green development pathway, a middle development pathway, a rocky development pathway, and a high development pathway, respectively [65,66].

2.3. Habitat Suitability Modeling

MaxEnt v3.4.1 (http://Biodiversityinformatics.amnh.org/open_source/maxent/, accessed on 10 March 2021) was used with 30 replicates and the Bootstrap method to model the suitable habitat distributions of H. tetratepala based on occurrence records and climate variables [40,45,67,68]. The MaxEnt model was run with a convergence threshold of 10−5, maximum 500 iterations, 10,000 maximum background points [42], a regularization parameter value of 1 [69], an auto-feature option, and the logistic output format. Other settings used the default values in [44]. A total of 90% of the database was used as training data, and 10% of the total database was used as test data to evaluate the accuracy and quality of the model predictions. Following this, the area under curve (AUC) of the receiver operating characteristic (ROC) as implemented in MaxEnt [37] was used to evaluate the model accuracy. The AUC can vary from 0.5 to 1, and, according to its value, the model performance can be categorized as insufficient (0.5–0.6), poor (0.6–0.7), average (0.7–0.8), good (0.8–0.9), or excellent (0.9–1) [64,70].

2.4. Predicting the Suitable Areas of Plants under Global Climate Change

ArcGIS 10.2 software (ESRI Inc., Redlands, CA, USA) with an add-in SDM toolbox [71] was used to quantify the habitat suitability of H. tetratepala from the MaxEnt output results. The habitat suitability maps produced by the MaxEnt model varied from 0 to 1. Jenks’ Natural Breaks method available in ArcGIS layer properties was used to reclassify the potential distribution areas of the species based on 10 percentile training presence Logistic threshold (marginal value) in the MaxEnt results. Suitable areas for the species were divided into four levels: unsuitable (<marginal value), marginally suitable (marginal value—0.6), medium suitable (0.6–0.8), and optimal (0.8–1.0). The raster calculator in ArcGIS 10.2 software (ESRI Inc., Redlands, CA, USA) was then used to calculate the potential geographical distribution area of H. tetratepala.

3. Results

3.1. Model Performance and Contributions of the Variables

Based on the AUC values of the models developed, the accuracy of the predicted result was evaluated. The results showed that the AUC values of all climate conditions were significantly higher than 0.9, indicating a high accuracy of the MaxEnt model to predict the potential distribution of H. tetratepala.
Six of the bioclimatic variables used for H. tetratepala prediction were the mean diurnal range (Bio_2), temperature seasonality (Bio_4), mean temperature of coldest quarter (Bio_11), precipitation seasonality (Bio_15), precipitation of driest quarter (Bio_17), and precipitation of warmest quarter (Bio_18) (Table 1; Figure 2). Among them, precipitation in the warmest quarter (Bio_18) was determined to be the most important bioclimatic variable, followed by temperature seasonality (Bio_4).

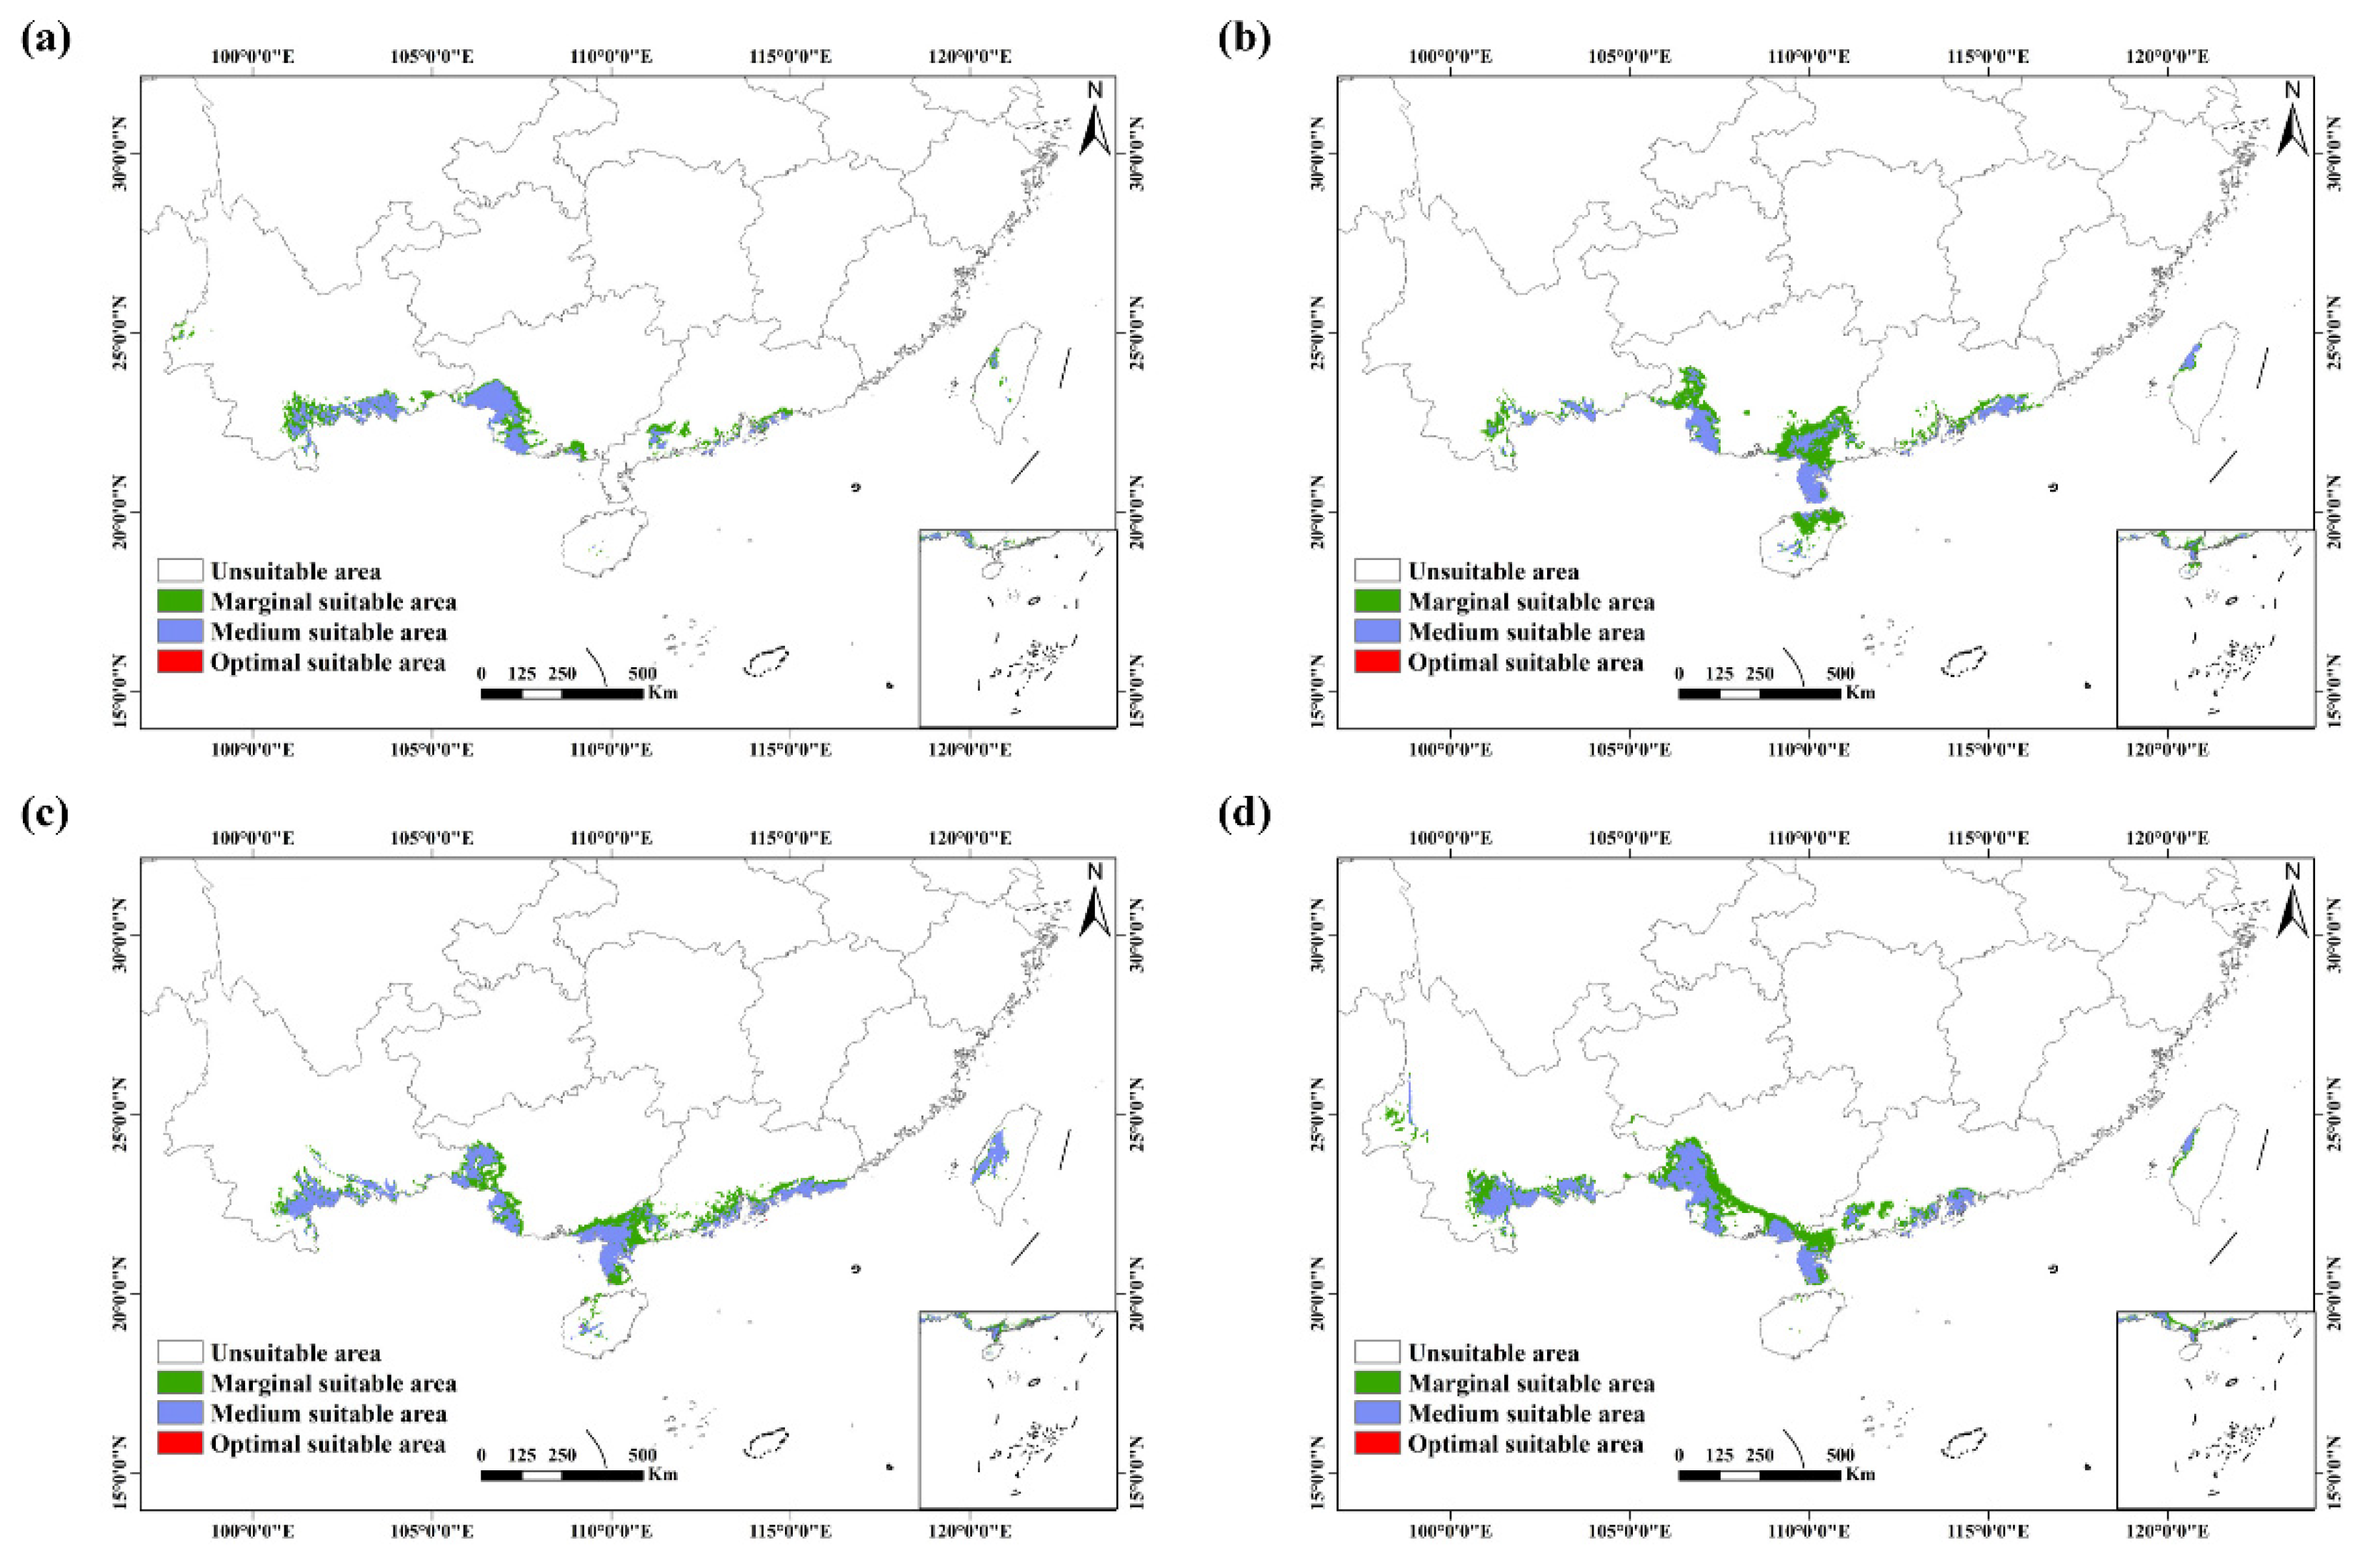
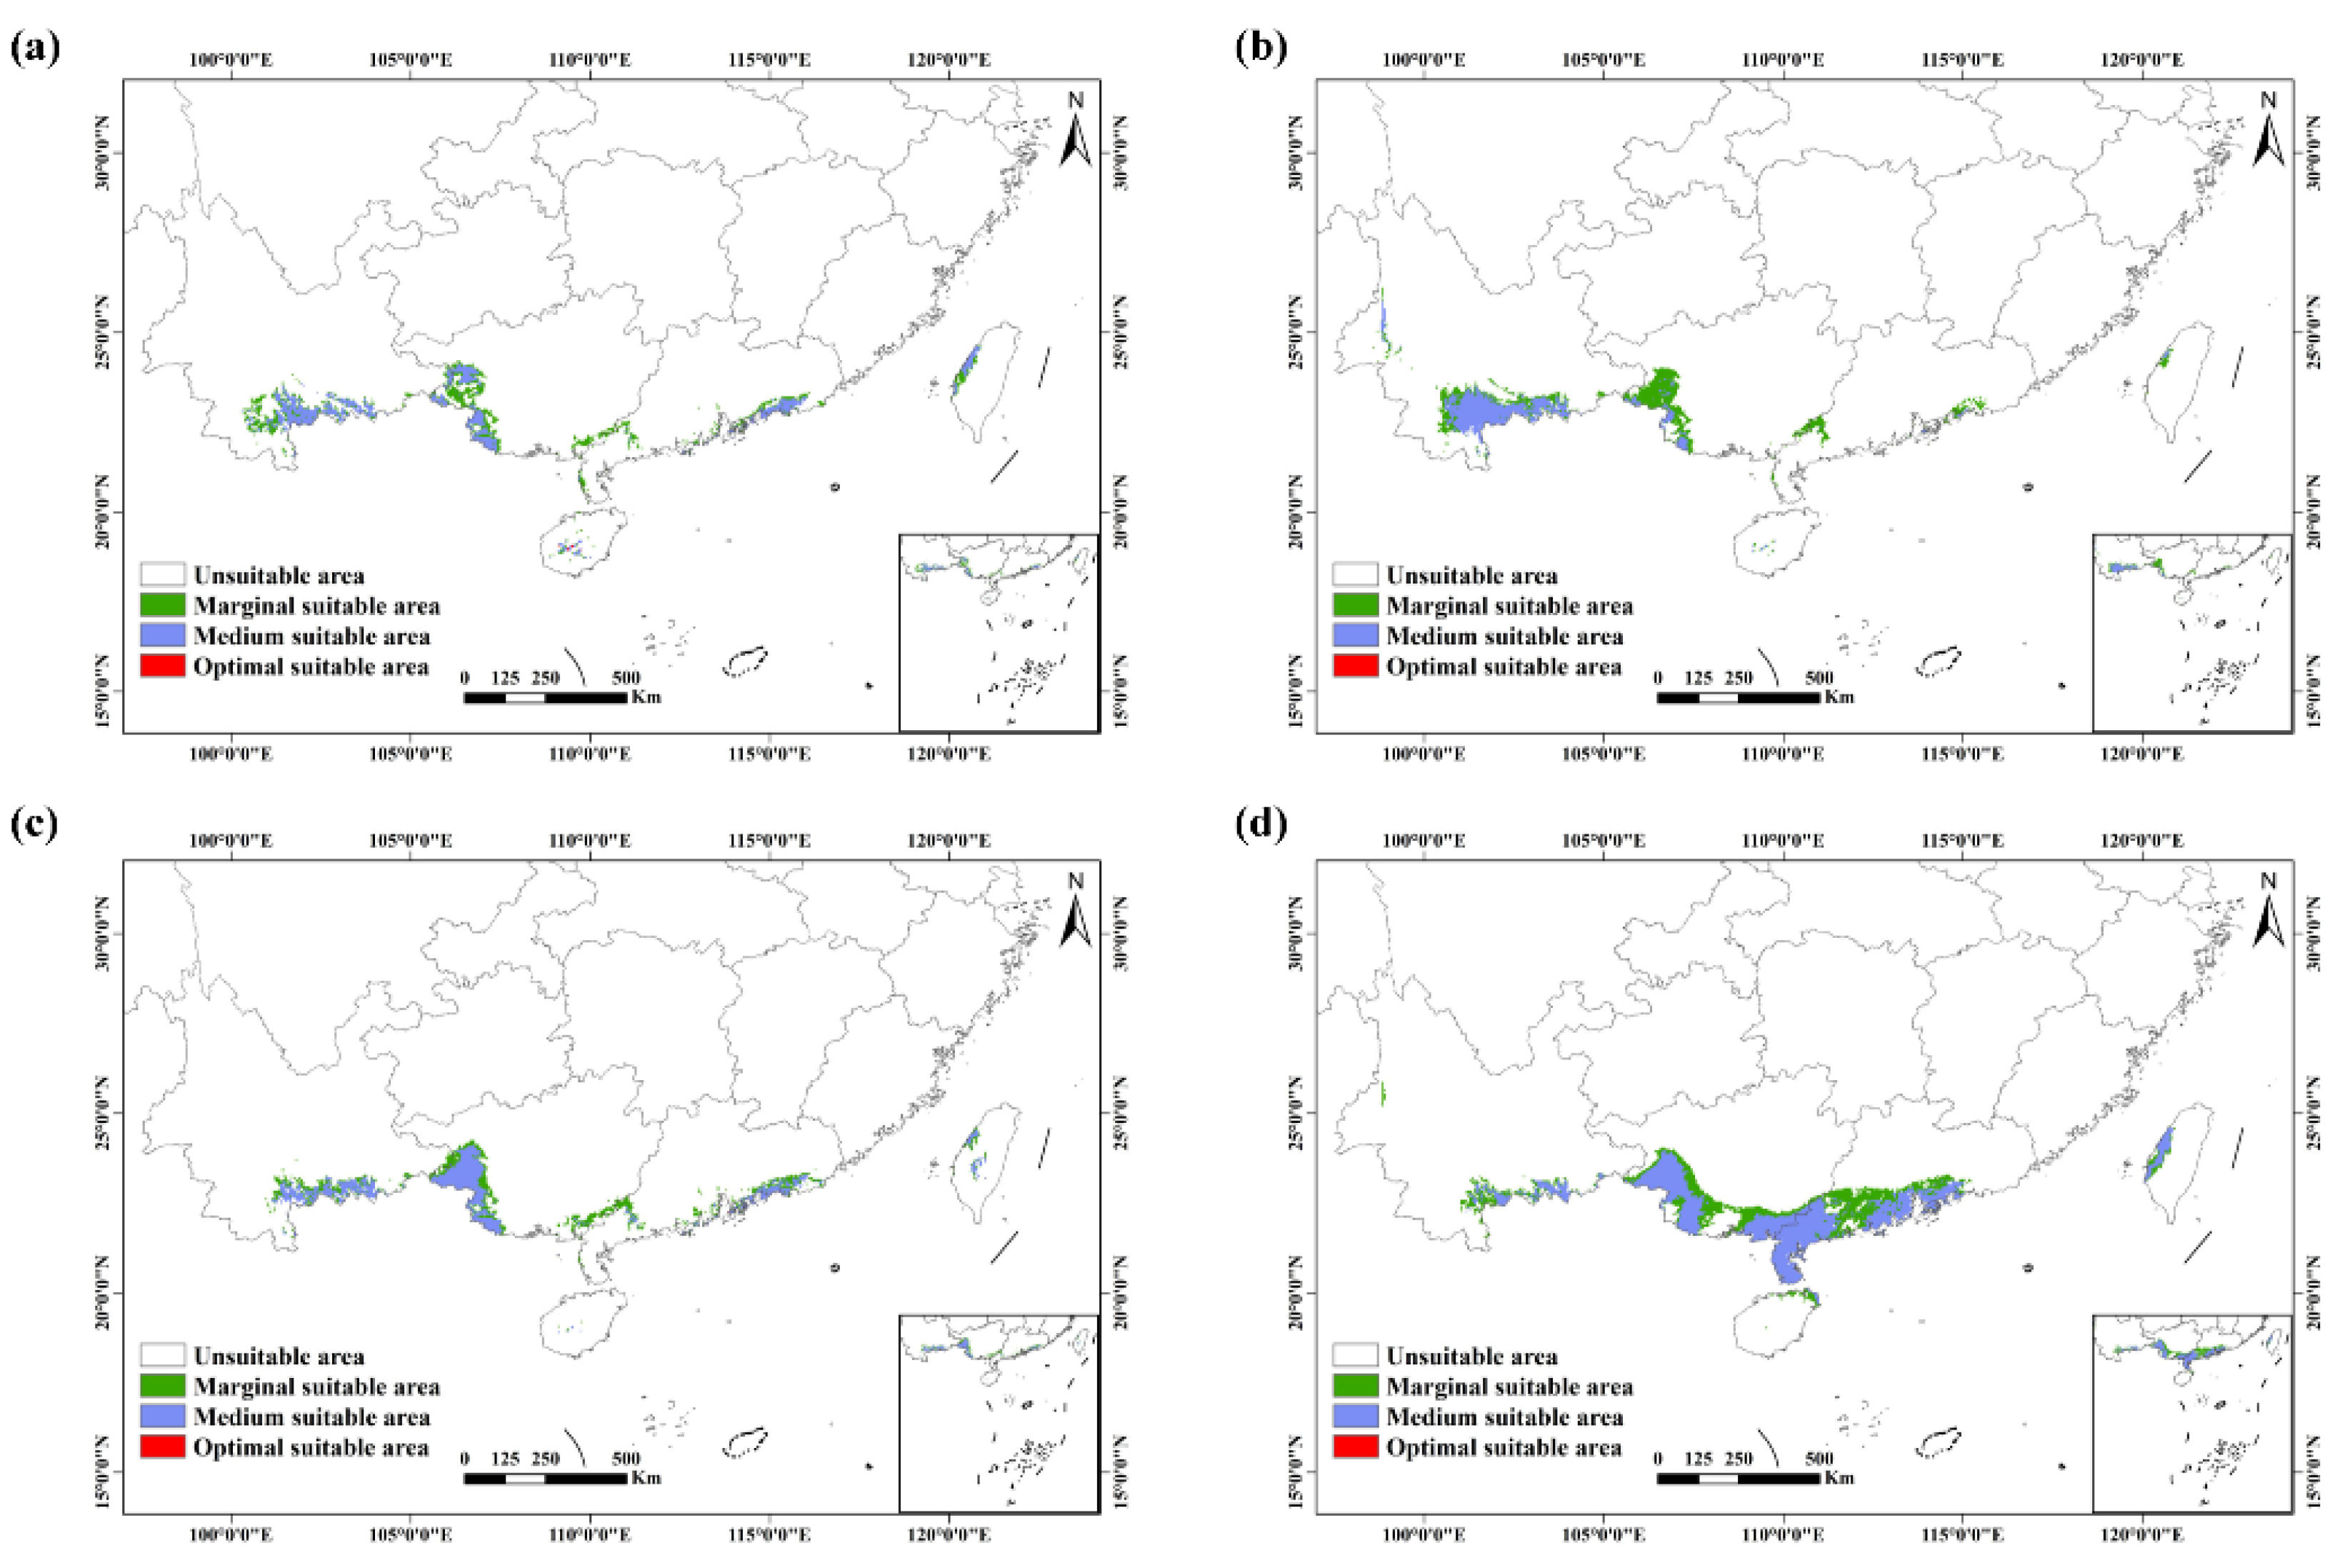
3.2. Potential Distribution under Future Climate Conditions

The predictions of suitable areas for H. tetratepala in 2041–2060 (2050s) and 2061–2080 (2070s) according to BCC-CSM2-MR (Beijing Climate Center Climate System Model) and MIROC6 (Model for Interdisciplinary Research on Climate) climate data under SSP1-2.6, SSP2-4.5, SSP3-7.0, and SSP5-8.5 are shown in Figure 3, Figure 4, Figure 5 and Figure 6. In the future climate conditions (2050s and 2070s), under two CMIP6 climate scenarios, including SSP1-2.6, SSP2-4.5, SSP3-7.0, and SSP5-8.5, the prediction area suitability for the distribution of H. tetratepala in China was basically unchanged (Figure 3, Figure 4, Figure 5 and Figure 6). Compared with the high emission scenario, the global suitability of H. tetratepala under the low emission scenario is expected to lower. The model predicted the suitable area was the highest under the SSP5-8.5 scenario with both model and future climate conditions (Table S2).
An analysis of the prediction of BCC-CSM2-MR under different SSPs revealed that the maximum threshold of suitable areas was attained under SSP5-8.5, and the minimum under SSP1-2.6. Compared to the prediction of current conditions, the optimal and medium suitable areas increased dramatically under SSP2-4.5 (2070s) and SSP3-7.0 (2050s), respectively. Through observations and comparisons (Figure 3 and Figure 4), it was found that the suitable zones were primarily located in the Yunnan, Guangxi, Guangzhou, and Hainan Provinces. Furthermore, optimal zones were significantly reduced or even disappeared in the 2050s and 2070s, except under the SSP2-4.5 (2070s), where they had an approximate increase of 350% compared to the current number of highly suitable areas.
Conversely, the prediction of the MIROC6 model under different SSPs revealed that the total suitable areas attaining a maximum under SSP2-4.5 (2050s) and SSP5-8.5 (2070s) and reaching a minimum under SSP1-2.6 (2050s and 2070s) was the same as that from the prediction of the BCC-CSM2-MR model (Table S2). Under SSP1-2.6 (2050s), the total suitable zone was the smallest, whereas the optimal zone was the largest. For the 2070s, SSP3-7.0 attained a maximum suitable area in total, and optimal areas had an approximate increase of 275.01% compared to the current highly suitable areas. Through observations and comparisons (Figure 5 and Figure 6), it was found that the suitable zones of H. tetratepala under this model were the same as the prediction of the BCC-CSM2-MR model (Figure 3 and Figure 4).

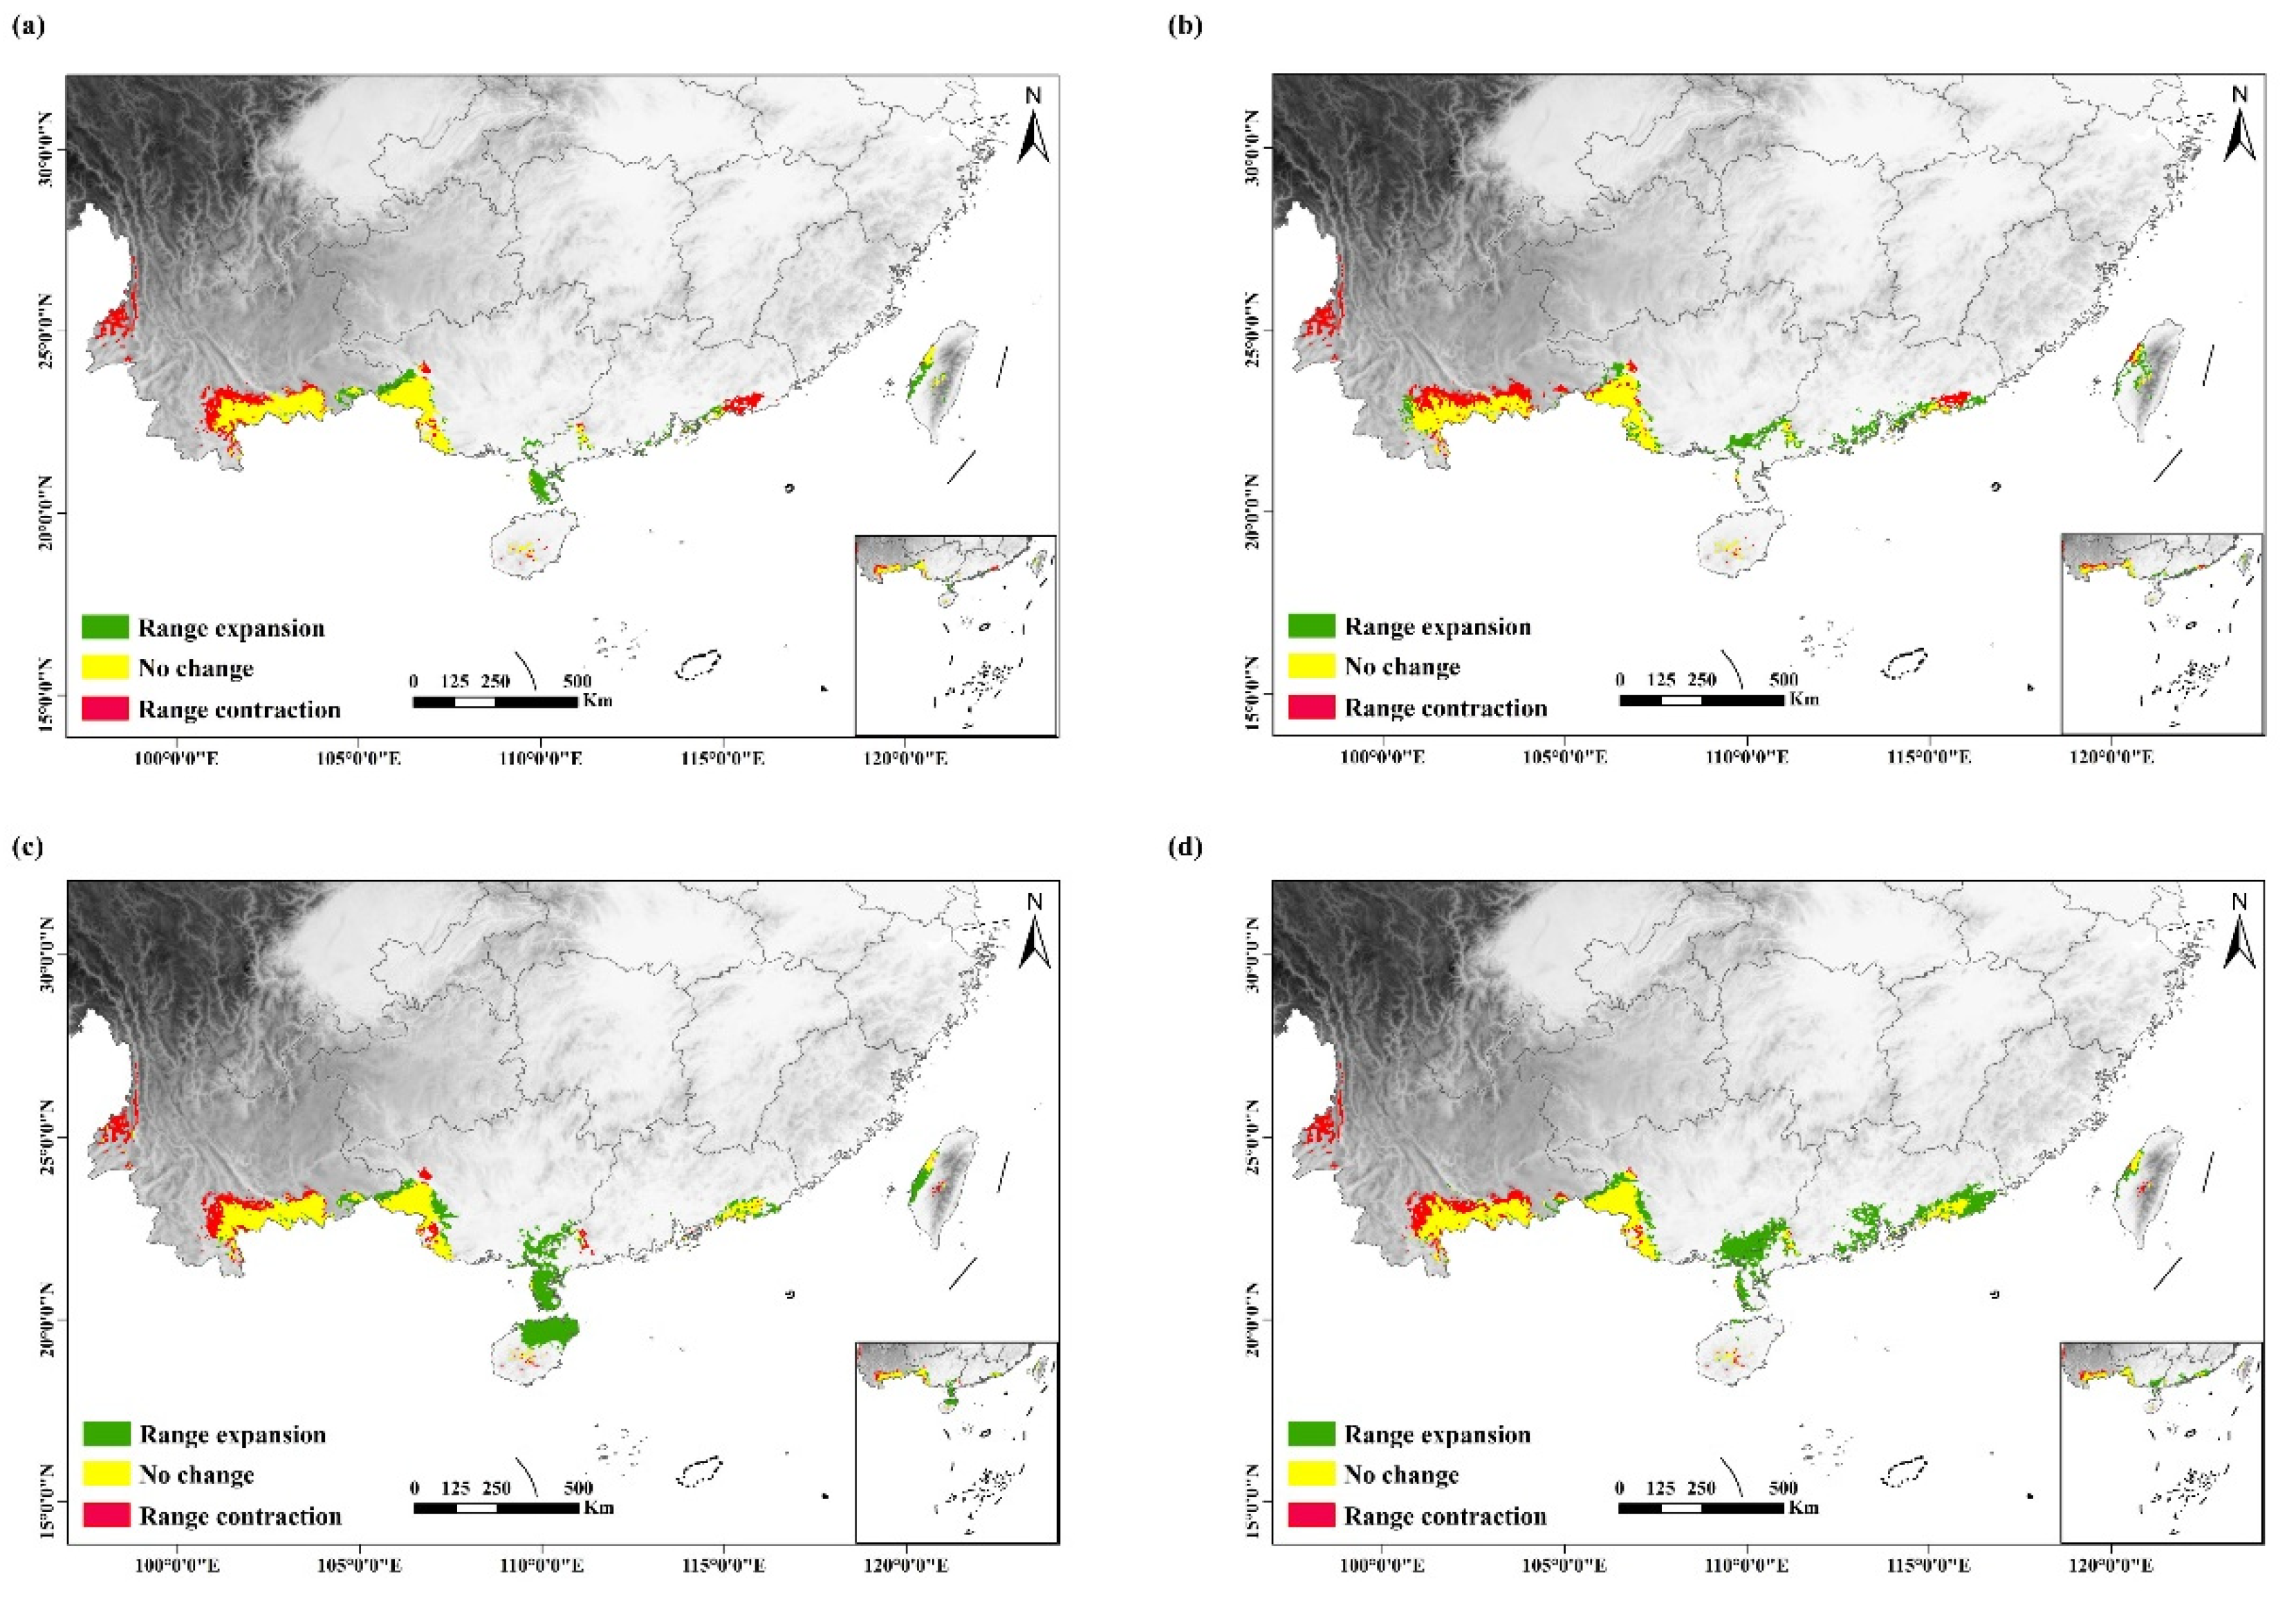
3.3. Future Changes in Suitable Habitats

Figure 7 and Figure 8 show the future changes in suitable habitats in the 2050s and 2070s under climate scenarios of the MIROC6 models. In the 2050s, compared with current conditions, the prediction results indicated that the largest contraction of suitable habitat areas of H. tetratepala was under the SSP5-8.5 scenario of the MIROC6 models, (32,771.72 km2); the gained area was also the largest (94,031.77 km2) (Table 2). The lost area was primarily located in Yunnan, where there was a medium suitable area for H. tetratepala (Figure S1). The gained area was mainly concentrated in Guangxi, Guangzhou, Taiwan, as well as North Hainan, which became a medium suitable area for H. tetratepala (Figure 5 and Figure 7). Furthermore, the prediction of the MIROC6 model under SSP1-2.6 showed that there were 17,589.77 km2 of suitable areas lost and 13,762.6 km2 gained, which was the lowest contraction of suitable habitat areas of H. tetratepala out of all four scenarios (Table 2).
In the 2070s, compared with current conditions, the prediction results indicated that the largest gained area was also under the SSP5-8.5 scenario (44,101.15 km2); the contraction area was also near the lowest value (20,453.81 km2) (Figure 8 and Table 2). The lost area was primarily located in Yunnan, and the gained area was mainly concentrated in Guangxi, Guangzhou, and Taiwan (Figure 8). In general, this indicates that temperature increases may be beneficial to the survival of H. tetratepala and show a trend toward distribution moving to the northeast.

4. Discussion

Here, the MaxEnt model was used to evaluate potentially suitable H. tetratepala habitat distribution based on two global future climate models. The results showed a highly effective and accurate method for predicting the potential suitable areas of H. tetratepala, despite the fact that the use of AUC value to estimate the predictive accuracy of the MaxEnt model is controversial [72,73,74]. At large spatial and temporal scales, climate was the primary determining factor in regulating species distribution [16,75]. This study revealed that the most important bioclimatic variables affecting the presence of H. tetratepala were precipitation during the warmest quarter (Bio_18), followed by temperature seasonality (Bio_4).
It was found that prediction results varied when analyzing the different models under the same scenario. For example, under the SSP1-2.6 scenario, the predicted results of the BCC-CSM2-MR and MIROC6 models in both the 2050s and 2070s showed that the unsuitable area for H. tetratepala will increase in the future, but the optimal suitable area in the 2050s increased only under MIROC6 modeling. In the SSP5-8.5 scenario, the prediction results of the two models were consistent in their predicted changes of the unsuitable area, marginally suitable area, and moderately suitable area (increase or decrease), but the optimal suitable area in the 2070s increased only under MIROC6, while in others it was predicted to absolutely disappear (Table S2). Studies have shown that the prediction of multiple models can avoid the single model’s uncertainty and show trends that are more likely to be accurate [36,37,76]. In the SSP scenario with higher radiative forcing (SSP5-8.5), the increase in marginal and medium suitable areas was larger, while under the SSP scenario with lower radiative forcing (SSP1-2.6), the increased areas of unsuitable habitat was larger (Table S2). The reason behind the trend between different SSP scenarios may be due to societies with different development pathways in the future. For example, SSP1-2.6 represents the sustainable development of society with low challenges to mitigation and adaptation, whereas SSP5-8.5 represents the fossil-fueled development of society, with high challenges to mitigation and low challenges to adaptation [66].
The potential habitats of H. tetratepala can be concluded to be restricted to Yunnan, Guangxi, Hainan, Guangzhou, and Taiwan provinces (Figure 3, Figure 4, Figure 5 and Figure 6; Figure S1). Currently, there are no relevant reports on H. tetratepala in Hainan, Guangzhou, and Taiwan provinces [10,55]; therefore, researchers need to strengthen in-depth species investigation and monitoring in those areas in the future. The model projections from this study indicated that in response to the warming climate, the suitable survival areas for H. tetratepala exhibited a trend of northeastward migration compared to current habitats; in the Yunnan area, its habitats appeared to be severely threatened, which is consistent with field observations. Future climate change is mainly reflected in the escalating temperature increase caused by greenhouse gases, which will promote species migration to the boreal forests [77]. At large spatial and temporal scales, climate was the primary determining factor in regulating species distribution [16,75]. This study revealed that the most important bioclimatic variables affecting the presence of H. tetratepala were precipitation during the warmest quarter (Bio_18), followed by temperature seasonality (Bio_4). H. tetratepala is a subtropical species that prefers warmth and humidity; therefore, in the highest greenhouse gas emissions scenario, high-latitude regions will provide greater space for H. tetratepala distribution.
Although the fast-changing climate will pose a threat to the survival of endangered species, H. tetratepala has been reported to be highly adaptable towards a changing climate and other environmental conditions [55]. However, owing to anthropogenic activities, the rapid expansion of agricultural/developed lands and economic development, H. tetratepala has been listed as an “Endangered species” and PSESP [48,78] This study provides vital information for developing viable conservation strategies for policymakers. The results indicated that H. tetratepala will face a high risk of habitat loss in Yunnan area in response to climate change during the 21st century, particularly under the SSP1-2.6 scenario (both in the 2050s and 2070s) based on the MIROC6 model (Figure 5 and Figure 6; Table S2). Yunnan Province is a biodiversity hotspot in China and forms a major part of the Indo-Burma biodiversity hotspot [6]. Previous studies have revealed Yunnan lineage with the high genetic diversity of H. tetratepala [55], which was consistent with this study’s result that the Yunnan area is a suitable distribution area for H. tetratepala. Combing genetic background and species distribution models of H. tetratepala is important to protect the shrinking habitats of H. tetratepala in those areas and strengthen in-depth species investigation and monitoring outside of its current known distribution.
Previous studies showed that low seed set, few seedlings and saplings, excessive human-induced disturbance, and ongoing habitat fragmentation were the main factors accounting for the endangered status of H. tetratepala [49,55]. Future projections from this study suggested that the H. tetratepala range of climate-suitable habitats would expand to Guangdong, Hainan, and Taiwan provinces. Therefore, it can potentially offer massive benefits to entire ecosystems and these regions should be examined as priority areas for species introduction and cultivation, such as through establishing protected areas and conservation botanical gardens [4,79]. Knowing that habitats in the Yunnan area are severely threatened, adaptive measures are recommended close to the in situ conservation sites to ensure that native habitats are stable and protected, including establishing protected areas, periodic scientific monitoring, and strengthening the publicity of species protection [80,81,82]. In summary, a combination of multiple approaches is advocated to develop effective protection and restoration management strategies for H. tetratepala.

5. Conclusions

In this study, the potential future suitable growth areas of H. tetratepala were first preliminarily predicted using the MaxEnt model based on two global climatic models under different scenarios in two future periods. Due to insufficient sample sizes, the actual distribution area of H. tetratepala may be smaller than the predicted results; however, maximum entropy is highly reliable despite the small sample sizes, and the model estimations matched current observations of H. tetratepala distribution. Because of this, we can be confident that the model correctly predicted the potential habitats of H. tetratepala within the context of climate warming. The results show that precipitation in the warmest quarter (Bio_18) and temperature seasonality (Bio_4) are the most important bioclimatic variables affecting H. tetratepala. Under the future climate conditions, the suitable areas for H. tetratepala are predicted to decrease continually under the SSP1-2.6 scenario and become restricted to Yunnan, Guangxi, Hainan, Guangzhou, and Taiwan provinces. In response to climate warming, the suitable survival area of H. tetratepala is predicted to shift considerably northeastward, with noticeable changes in the Yunnan area which contains high genetic diversity. These results will be useful for policymakers and governments to initiate appropriate strategies to protect suitable habitats for H. tetratepala during future global warming.

Supplementary Materials

The following supporting information can be downloaded at: https://www.mdpi.com/article/10.3390/f13071051/s1, Figure S1: Projected potential distribution maps of H. tetratepala under the current conditions; Table S1: The geographic coordinates used to generate the potential distribution models of H. tetratepala.; Table S2: Area of Horsfieldia tetratepala under different suitability classes (km2) under current and future periods (2050s and 2070s) in MIROC6 and BCC-CSM2-MR models.

Author Contributions

Conceptualization, methodology, software, investigation, formal analysis, writing—original draft, writing—review and editing, C.C.; software, writing—review and editing, X.Z.; software, writing—review and editing, J.Z.; project administration, funding acquisition, writing—review and editing, J.L. (Jie Li); funding acquisition, writing—review and editing, J.L. (Junmin Li). All authors have read and agreed to the published version of the manuscript.

Funding

This research was funded by the Science and Technology Basic Resources Investigation Program of China: Survey and Germplasm Conservation of Plant Species with Extremely Small Populations in South-west China, grant number 2017FY100100, and the National Natural Science Foundation of China, grant number 30800133.

Institutional Review Board Statement

Not applicable.

Informed Consent Statement

Not applicable.

Data Availability Statement

Geographic coordinate data and climate data have been described in Section 2.1 and Section 2.2 of the articles.

Acknowledgments

We thank the forestry departments and nature reserves from the provinces and municipalities of Guangxi and Yunnan for their support and coordination of the fieldwork. We also thank Qinxi Hou, Canyu Zhang, Jianlin Hu and Zhiyi Liu for their assistance with the field sampling.

Conflicts of Interest

The authors declare no conflict of interest.

References

  1. Meng, H.H.; Zhou, S.S.; Li, L.; Tan, Y.H.; Li, J.W.; Li, J. Conflict between biodiversity conservation and economic growth: Insight into rare plants in tropical China. Biodivers. Conserv. 2019, 28, 523–537. [Google Scholar] [CrossRef]
  2. Isbel, F.; Gonzalez, A.; Loreau, M.; Cowles, J.; Diaz, S.; Hector, A.; Mace, M.M.; Wardle, D.A.; O’Connor, M.I.; Duffy, J.M.; et al. Linking the influence and dependence of people on biodiversity across scales. Nature 2017, 546, 65–72. [Google Scholar] [CrossRef] [PubMed] [Green Version]
  3. Johnson, C.N.; Balmford, A.; Brook, B.W.; Buettel, J.C.; Galetti, M.; Lei, G.; Wilmshurst, J.M. Biodiversity losses and conservation responses in the Anthropocene. Science 2017, 356, 270–275. [Google Scholar] [CrossRef]
  4. Meng, H.H.; Gao, X.Y.; Song, Y.G.; Cao, G.L.; Li, J. Biodiversity arks in the Anthropocene. Reg. Sustain. 2021, 2, 109–115. [Google Scholar] [CrossRef]
  5. Lawton, J.H.; May, R.M. Extinction Rates; Oxford University Press: Oxford, UK, 1995. [Google Scholar]
  6. Myers, N.; Mittermeier, R.A.; Mittermeier, C.G.; da Fonseca, G.A.B.; Kent, J. Biodiversity hotspots for conservation priorities. Nature 2000, 403, 853–858. [Google Scholar] [CrossRef] [PubMed]
  7. Ma, K.P.; Shen, X.L.; Grumbine, R.; Corlett, R. China’s biodiversity conservation research in progress. Biol. Conserv. 2017, 210, 1–2. [Google Scholar] [CrossRef]
  8. Parmesan, C. Climate and species’ range. Nature 1996, 382, 765–766. [Google Scholar] [CrossRef]
  9. Leach, K.; Zalat, S.; Gilbert, F. Egypt’s protected area network under future climate change. Biol. Conserv. 2013, 159, 490–500. [Google Scholar] [CrossRef]
  10. Li, B.; Wilson, T.K. Myristicaceae. In Flora of China; Wu, Z.Y., Raven, P.H., Eds.; Science Press: Beijing, China; Missouri Botanical Garden Press: St Louis, MO, USA, 2008; Volume 7, pp. 99–101. [Google Scholar]
  11. Bosso, L.; Luchi, N.; Maresi, G.; Cristinzio, G.; Smeraldo, S.; Russo, D. Predicting current and future disease outbreaks of Diplodia sapinea shoot blight in Italy: Species distribution models as a tool for forest management planning. For. Ecol. Manag. 2017, 400, 655–664. [Google Scholar] [CrossRef]
  12. Zhang, K.; Yao, L.; Meng, J.; Tao, J. Maxent modeling for predicting the potential geographical distribution of two peony species under climate change. Sci. Total Environ. 2018, 634, 1326–1334. [Google Scholar] [CrossRef]
  13. Wang, D.; Cui, B.C.; Duan, S.S.; Chen, J.J.; Fan, H.; Lu, B.B.; Zheng, J.H. Moving north in China: The habitat of Pedicularis kansuensis in the context of climate change. Sci. Total Environ. 2019, 697, 133979. [Google Scholar] [CrossRef]
  14. Ye, P.C.; Zhang, G.F.; Zhao, X.; Chen, H.; Si, Q.; Wu, J.Y. Potential geographical distribution and environmental explanations of rare and endangered plant species through combined modeling: A case study of Northwest Yunnan, China. Ecol. Evol. 2021, 11, 13052–13067. [Google Scholar] [CrossRef]
  15. Tang, S.L.; Song, Y.B.; Zeng, B.; Dong, M. Potential distribution of the extremely endangered species Ostrya rehderiana (Betulaceae) in China under future climate change. Environ. Sci. Pollut. Res. 2022, 29, 7782–7792. [Google Scholar] [CrossRef] [PubMed]
  16. Feng, L.; Sun, J.J.; El-Kassaby, Y.A.; Yang, X.Y.; Tian, X.N.; Wang, T.L. Predicting potential habitat of a plant species with small populations under climate change: Ostrya rehderiana. Forests 2022, 13, 129. [Google Scholar] [CrossRef]
  17. Sala, O.E.; Chapin, F.S.; Armesto, J.J.; Berlow, E.; Bloomfield, J.; Dirzo, R.; Huber-Sanwald, E.; Huenneke, L.F.; Jackson, R.B.; Kinzig, A.; et al. Global biodiversity scenarios for the year 2100. Science 2000, 287, 1770–1774. [Google Scholar] [CrossRef] [PubMed]
  18. Bellard, C.; Bertelsmeier, C.; Leadley, P.; Thuiller, W.; Courchamp, F. Impacts of climate change on the future of biodiversity. Ecol. Lett. 2012, 15, 365–377. [Google Scholar] [CrossRef] [Green Version]
  19. Vegas-Vilarrúbia, T.; Nogué, S.; Rull, V. Global warming, habitat shifts and potential refugia for biodiversity conservation in the neotropical Guayana Highlands. Biol. Conserv. 2012, 152, 159–168. [Google Scholar] [CrossRef]
  20. Fung, E.; Imbach, P.; Corrales, L.; Vilchez, S.; Zamora, N.; Argotty, F.; Hannah, L.; Ramos, A. Mapping conservation priorities and connectivity pathways under climate change for tropical ecosystems. Clim. Change 2017, 141, 77–92. [Google Scholar] [CrossRef]
  21. Weiskopf, S.R.; Rubenstein, M.A.; Crozier, L.G.; Gaichas, S.; Griffis, R.; Halofsky, J.E.; Hyde, K.J.W.; Morelli, T.L.; Morisette, J.T.; Muñoz, R.C.; et al. Climate Change Effects on Biodiversity, Ecosystems, Ecosystem Services, and Natural Resource Management in the United States. Sci. Total Environ. 2020, 733, 137782. [Google Scholar] [CrossRef]
  22. Walther, G.R.; Post, E.; Convey, P.; Menzel, A.; Parmesan, C.; Beebee, T.J.C.; Fromentin, J.; Hoegh-Guldberg, O.; Bairlein, F. Ecological responses to recent climate change. Nature 2002, 416, 389–395. [Google Scholar] [CrossRef]
  23. Root, T.L.; Price, J.T.; Hall, K.R.; Schneider, S.H.; Rosenzweig, C.; Pounds, J.A. Fingerprints of global warming on wild animals and plants. Nature 2003, 421, 57–60. [Google Scholar] [CrossRef] [PubMed]
  24. Mawdsley, J.R.; O’Malley, R.; Ojima, D.S. A review of climate-change adaptation strategies for wildlife management and biodiversity conservation. Conserv. Biol. 2009, 23, 1080–1089. [Google Scholar] [CrossRef]
  25. Chen, I.C.; Hill, J.K.; Ohlemuller, R.; Roy, D.B.; Thomas, C.D. Rapid range shifts of species associated with high levels of climate warming. Science 2011, 333, 1024–1026. [Google Scholar] [CrossRef] [PubMed]
  26. Feeley, K.J.; Hurtado, J.; Saatchi, S.; Silman, M.R.; Clark, D.B. Compositional shifts in Costa Rican forests due to climate-driven species migrations. Glob. Change Biol. 2013, 19, 3472–3480. [Google Scholar] [CrossRef] [PubMed]
  27. Prieto-Torres, D.A.; Navarro-Siguenza, A.G.; Santiago-Alarcon, D.; Rojas-Soto, O.R. Response of the endangered tropical dry forests to climate change and the role of Mexican Protected Areas for their conservation. Glob. Change Biol. 2016, 22, 364–379. [Google Scholar] [CrossRef] [PubMed]
  28. Song, Y.G.; Petitpierre, B.; Deng, M.; Wu, J.P.; Kozlowski, G. Predicting climate change impacts on the threatened Quercus arbutifolia in montane cloud forests in southern China and Vietnam: Conservation implications. For. Ecol. Manag. 2019, 444, 269–279. [Google Scholar] [CrossRef] [Green Version]
  29. Zhao, Z.X.; Wang, Y.; Zang, Z.H.; Deng, S.Y.; Lan, T.Y.; Xie, Z.Q.; Xiong, G.M.; Li, J.Q.; Shen, G.Z. Climate warming has changed phenology and compressed the climatically suitable habitat of Metasequoia glyptostroboides over the last half century. Glob. Ecol. Conserv. 2020, 23, e01140. [Google Scholar] [CrossRef]
  30. Lawler, J.J.; Shafer, S.L.; White, D.; Kareiva, P.; Maurer, E.P.; Blaustein, A.R.; Bartlein, P.J. Projected climate-induced faunal change in the Western Hemisphere. Ecology 2009, 90, 588–597. [Google Scholar] [CrossRef] [Green Version]
  31. Guillera-Arroita, G.; Lahoz-Monfort, J.J.; Elith, J.; Gordon, A.; Kujala, H.; Lentini, P.E.; McCarthy, M.A.; Tingley, R.; Wintle, B.A. Is my species distribution model fit for purpose? Matching data and models to applications. Glob. Ecol. Biogeogr. 2015, 24, 276–292. [Google Scholar] [CrossRef]
  32. Eyre, A.C.; Briscoe, N.J.; Harley, D.K.P.; Lumsden, L.F.; McComb, L.B.; Lentini, P.E. Using species distribution models and decision tools to direct surveys and identify potential translocation sites for a critically endangered species. Divers. Distrib. 2022, 28, 700–711. [Google Scholar] [CrossRef]
  33. Franklin, J. Species distribution models in conservation biogeography: Developments and challenges. Divers. Distrib. 2013, 19, 1217–1223. [Google Scholar] [CrossRef]
  34. Sun, J.J.; Feng, L.; Wang, T.L.; Tian, X.N.; He, X.; Xia, H.; Wang, W.F. Predicting the potential habitat of three endangered species of Carpinus genus under climate change and human activity. Forests 2021, 12, 1216. [Google Scholar] [CrossRef]
  35. Guisan, A.; Thuiller, W. Predicting species distribution: Offering more than simple habitat models. Ecol. Lett. 2005, 8, 993–1009. [Google Scholar] [CrossRef] [PubMed]
  36. Tulloch, A.I.T.; Sutcliffe, P.; Naujokaitis-Lewis, I.; Tingley, R.; Brotons, L.; Ferraz, K.; Possingham, H.; Guisan, A.; Rhodes, J.R. Conservation planners tend to ignore improved accuracy of modelled species distributions to focus on multiple threats and ecological processes. Biol. Conserv. 2016, 199, 157–171. [Google Scholar] [CrossRef] [Green Version]
  37. Li, J.Y.; Chang, H.; Liu, T.; Zhang, C. The potential geographical distribution of Haloxylon across Central Asia under climate change in the 21st century. Agric. For. Meteorol. 2019, 275, 243–254. [Google Scholar] [CrossRef]
  38. Ramasamy, M.; Das, B.; Ramesh, R. Predicting climate change impacts on potential worldwide distribution of fall armyworm based on CMIP6 projections. J. Pest Sci. 2022, 95, 841–854. [Google Scholar] [CrossRef]
  39. Evans, J.S.; Murphy, M.A.; Holden, Z.A.; Cushman, S.A. Modeling Species distribution and change using random forest. In Predictive Species and Habitat Modeling in Landscape Ecology; Drew, C., Wiersma, Y., Huettmann, F., Eds.; Springer: New York, NY, USA, 2011. [Google Scholar]
  40. Phillips, S.J.; Anderson, R.P.; Schapire, R.E. Maximum entropy modeling of species geographic distributions. Ecol. Model. 2006, 190, 231–259. [Google Scholar] [CrossRef] [Green Version]
  41. Guisan, A.; Edwards, T.C.; Hastie, T. Generalized linear and generalized additive models in studies of species distributions: Setting the scene. Ecol. Model. 2002, 157, 89–100. [Google Scholar] [CrossRef] [Green Version]
  42. Phillips, S.J.; Dudík, M. Modeling of species distributions with Maxent: New extensions and a comprehensive evaluation. Ecography 2008, 31, 161–175. [Google Scholar] [CrossRef]
  43. Elith, J.; Phillips, S.J.; Hastie, T.; Dudík, M.; Chee, Y.E.; Yates, C.J. A statistical explanation of MaxEnt for ecologists. Divers. Distrib. 2011, 17, 43–57. [Google Scholar] [CrossRef]
  44. Merow, C.; Smith, M.J.; Silander, J.A. A practical guide to MaxEnt for modeling species’ distributions: What it does, and why inputs and settings matter. Ecography 2013, 36, 1058–1069. [Google Scholar] [CrossRef]
  45. Phillips, S.J.; Anderson, R.P.; Dudík, M.; Schapire, R.E.; Blair, M.E. Opening the black box: An open-source release of Maxent. Ecography 2017, 40, 887–893. [Google Scholar] [CrossRef]
  46. Jayasinghe, S.L.; Kumar, L. Modeling the climate suitability of tea [Camellia sinensis (L.) O. Kuntze] in Sri Lanka in response to current and future climate change scenarios. Agric. For. Meteorol. 2019, 272, 102–117. [Google Scholar] [CrossRef]
  47. Ab Lah, N.Z.; Yusop, Z.; Hashim, M.; Mohd Salim, J.; Numata, S. Predicting the habitat suitability of Melaleuca cajuputi based on the MaxEnt species distribution model. Forests 2021, 12, 1449. [Google Scholar] [CrossRef]
  48. State Forestry Administration of China. The Implementation Plan of Rescuing and Conserving China’s PSESP (2011–2015) (Nonpublic Publication); State Forestry Administration of China: Beijing, China, 2012. [Google Scholar]
  49. Jiang, Y.H. Ecological Characteristics and Endangered Reason Analysis of Horsfeldia hainanensis Merr. as an Extremely Small Population. Ph.D. Thesis, Central South University of Forestry and Technology, Changsha, China, 2018. [Google Scholar]
  50. Jiang, Y.H.; Liu, X.S.; Xiang, W.H.; Jiang, Y.; He, Y.H. Genetic diversity and structure analysis of the endangered plant species Horsfieldia hainanensis Merr. in China. Biotechnol. Biotechnol. Equip. 2018, 32, 95–101. [Google Scholar] [CrossRef] [Green Version]
  51. Kitamura, S.; Poonswad, P. Nutmeg-vertebrate interactions in the Asia-Pacific region: Importance of frugivores for seed dispersal in Myristicaceae. Trop Conserv. Sci. 2013, 6, 608–636. [Google Scholar] [CrossRef] [Green Version]
  52. Xu, Y.L.; Cai, N.H.; Wu, Y.; Duan, A.A. Fatty acid composition of several plants of Horsfieldia. China Oils Fats 2012, 37, 80–82. [Google Scholar]
  53. Jiang, Y.H.; Xiang, W.H.; Jiang, Y.; He, Y.H.; Lin, J.Y. Floristic composition, structure and phytogeographic characteristics of Horsfieldia hainanensis Merr. community in Guangxi. J. Beijing For. Univ. 2016, 381, 74–82. [Google Scholar]
  54. National Forestry and Grassland Administration. List of National Key Protected Wild Plants in China; National Forestry and Grassland Administration: Beijing, China, 2021. [Google Scholar]
  55. Cai, C.N.; Xiao, J.H.; Ci, X.Q.; Conran, J.G.; Li, J. Genetic diversity of Horsfieldia tetratepala (Myristicaceae), an endangered Plant Species with Extremely Small Populations to China: Implications for its conservation. Plant Syst. Evol. 2021, 307, 50. [Google Scholar] [CrossRef]
  56. He, G.Z.; Cai, L.; Liang, G.; Shi, Q.; Chen, L.W. Sowing and breeding technique of Horsfieldia hainanensis Merr. Pract. For. Technol. 2013, 6, 35–37. [Google Scholar]
  57. Ma, Q.; Zhan, R.; Chen, Y.G. Chemical constituents and biological activity of Horsfieldia plants. Guangzhou Chem. Ind. 2014, 42, 11–13. [Google Scholar]
  58. Wu, Y.; Mao, C.L.; Zhang, F.L.; Yang, X.L.; Zeng, J.S.; Duan, A.A. Taxonomic position of Horsfieldia pandurifolia Hu. (Myristicaceae). Bull. Bot. Res. 2015, 35, 652–659. [Google Scholar]
  59. Jiang, Y.H.; Liu, X.S.; Jiang, Y.; He, Y.H.; Xiang, W.H. Anatomical structure characteristics of vegetative organs of endangered plant Horsfieldia hainanensis. Guihaia 2018, 38, 843–850. [Google Scholar]
  60. Warren, D.L.; Glor, R.E.; Turelli, M. ENMTools: A toolbox for comparative studies of environmental niche models. Ecography 2010, 33, 607–611. [Google Scholar] [CrossRef]
  61. Wang, C.J.; Wan, J.Z. Assessing the habitat suitability of 10 serious weed species in global croplands. Glob. Ecol. Conserv. 2020, 23, e01142. [Google Scholar] [CrossRef]
  62. Du, J.J.; Chen, Z.W. Method of path analysis with SPSS linear regression. Bull. Biol. 2010, 45, 4–6. [Google Scholar]
  63. Dormann, C.F.; Elith, J.; Bacher, S.; Buchmann, C.; Carl, G.; Carré, G.; Marquéz, J.R.G.; Gruber, B.; Lafourcade, B.; Leitão, P.J.; et al. Collinearity: A review of methods to deal with it and a simulation study evaluating their performance. Ecography 2013, 36, 27–46. [Google Scholar] [CrossRef]
  64. Yi, Y.J.; Cheng, X.; Yang, Z.F.; Zhang, S.H. Maxent modeling for predicting the potential distribution of endangered medicinal plant (H. riparia Lour) in Yunnan, China. Ecol. Eng. 2016, 92, 260–269. [Google Scholar] [CrossRef]
  65. O’Neill, B.C.; Kriegler, E.; Ebi, K.L.; Kemp-Benedict, E.; Riahi, K.; Rothman, D.S.; van Ruijven, B.J.; van Vuuren, D.P.; Birkmann, J.; Kok, K.; et al. The roads ahead: Narratives for shared socioeconomic pathways describing world futures in the 21st century. Glob. Environ. Change 2017, 42, 169–180. [Google Scholar] [CrossRef] [Green Version]
  66. Riahi, K.; van Vuuren, D.P.; Kriegler, E.; Edmonds, J.; O’Neill, B.C.; Fujimori, S.; Bauer, N.; Calvin, K.; Dellink, R.; Fricko, O.; et al. The shared socioeconomic pathways and their energy, land use, and greenhouse gas emissions implications: An overview. Global Environ. Change 2017, 42, 153–168. [Google Scholar] [CrossRef] [Green Version]
  67. Efron, B. Bootstrap method: Another look at the jackknife. Ann. Stat. 1979, 7, 1–26. [Google Scholar] [CrossRef]
  68. Evangelista, P.H.; Kumar, S.; Stohlgren, T.J.; Young, N.E. Assessing forest vulnerability and the potential distribution of pine beetles under current and future climate scenarios in the interior west of the US. For. Ecol. Manag. 2011, 262, 307–316. [Google Scholar] [CrossRef]
  69. Radosavljevic, A.; Anderson, R.P. Making better Maxent models of species distributions: Complexity, overfitting and evaluation. J. Biogeogr. 2013, 41, 629–643. [Google Scholar] [CrossRef]
  70. Swets, J.A. Measuring the accuracy of diagnostic systems. Science 1988, 240, 1285–1293. [Google Scholar] [CrossRef] [Green Version]
  71. Brown, J.L.; Bennett, J.R.; French, C.M. SDMtoolbox 2.0: The next generation Python-based GIS toolkit for landscape genetic, biogeographic and species distribution model analyses. PeerJ 2017, 5, e4095. [Google Scholar] [CrossRef] [Green Version]
  72. Hughes, G.; Madden, L.V. Evaluating predictive models with application in regulatory policy for invasive weeds. Agric. Syst. 2003, 76, 755–774. [Google Scholar] [CrossRef]
  73. Lobo, J.M.; Jiménez-Valverde, A.; Real, R. AUC: A misleading measure of the performance of predictive distribution models. Glob. Ecol. Biogeogr. 2008, 17, 145–151. [Google Scholar] [CrossRef]
  74. Peterson, A.T.; Papeş, M.; Soberón, J. Rethinking receiver operating characteristic analysis applications in ecological niche modeling. Ecol. Model. 2008, 213, 63–72. [Google Scholar] [CrossRef]
  75. Jiang, Y.; Wang, T.; De Bie, C.; Skidmore, A.; Liu, X.; Song, S.; Zhang, L.; Wang, J.; Shao, X. Satellite-derived vegetation indices contribute significantly to the prediction of epiphyllous liverworts. Ecol. Indic. 2014, 38, 72–80. [Google Scholar] [CrossRef]
  76. Zhou, Y.; Zhang, Z.; Zhu, B.; Cheng, X.; Yang, L.; Gao, M.; Kong, R. MaxEnt Modeling Based on CMIP6 Models to Project Potential Suitable Zones for Cunninghamia lanceolata in China. Forests 2021, 12, 752. [Google Scholar] [CrossRef]
  77. Boisvert-Marsh, L.; de Blois, S. Unravelling potential northward migration pathways for tree species under climate change. J. Biogeogr. 2021, 48, 1088–1100. [Google Scholar] [CrossRef]
  78. Mehta, P.; Sekar, K.C.; Bhatt, D.; Tewari, A.; Bisht, K.; Upadhyay, S.; Negi, V.S.; Soragi, B. Conservation and prioritization of threatened plants in Indian Himalayan Region. Biodivers. Conserv. 2020, 29, 1723–1745. [Google Scholar] [CrossRef]
  79. Martin, T.G.; Kehoe, L.; Mantyka-Pringle, C.; Chades, I.; Wilson, S.; Bloom, R.G.; Davis, S.K.; Fisher, R.; Keith, J.; Mehl, K. Prioritizing recovery funding to maximize conservation of endangered species. Conserv. Lett. 2018, 11, e12604. [Google Scholar] [CrossRef]
  80. Fos, S.; Laguna, E.; Jimenez, J.; Angel Gomez-Serrano, M. Plant micro-reserves in Valencia (E. Spain): A model to preserve threatened fora in China? Plant Divers. 2017, 39, 383–389. [Google Scholar] [CrossRef] [PubMed]
  81. Yang, W.Z.; Zhang, S.S.; Wang, W.B.; Kang, H.M.; Ma, N. A sophisticated species conservation strategy for Nyssa yunnanensis, a species with extremely small populations in China. Biol. Conserv. 2017, 26, 967–981. [Google Scholar] [CrossRef]
  82. Yang, J.; Cai, L.; Liu, D.T.; Chen, G.; Gratzfeld, J.; Sun, W.B. China’s conservation program on Plant Species with Extremely Small Populations (PSESP): Progress and perspectives. Biol. Conserv. 2020, 244, 108535. [Google Scholar] [CrossRef]
Figure 1. Map of localities where samples of the Horsfieldia tetratepala were employed for this study.
Forests 13 01051 g001
Figure 2. Pearson’s correlation analysis of 19 environmental variables. Correlation coefficients ranges between −1 and 1. Positive correlations are represented in blue, while negative correlations are represented in red. The bigger and darker the circle is, the greater the correlation is.
Forests 13 01051 g002
Figure 3. Projected potential distribution maps of H. tetratepala under future periods (2050s) in BCC-CSM2-MR models: (a) SSP 2.6, (b) SSP 4.5, (c) SSP 7.0, and (d) SSP 8.5.
Forests 13 01051 g003
Figure 4. Projected potential distribution maps of H. tetratepala under future periods (2070s) in BCC-CSM2-MR models: (a) SSP 2.6, (b) SSP 4.5, (c) SSP 7.0, and (d) SSP 8.5.
Forests 13 01051 g004
Figure 5. Projected potential distribution maps of H. tetratepala under future periods (2050s) in MIROC6 models: (a) SSP 2.6, (b) SSP 4.5, (c) SSP 7.0, and (d) SSP 8.5.
Forests 13 01051 g005
Figure 6. Projected potential distribution maps of H. tetratepala under future periods (2070s) in MIROC6 models: (a) SSP 2.6, (b) SSP 4.5, (c) SSP 7.0, and (d) SSP 8.5.
Forests 13 01051 g006
Figure 7. Habitat suitability changes from the current conditions to the future climate (2050s) under climate scenarios in MIROC6 models: (a) SSP 2.6, (b) SSP 4.5, (c) SSP 7.0, and (d) SSP 8.5. Green area marks the total expansion of habitat suitability from unsuitable to suitable habitat. Yellow area indicates habitat suitability prediction remained the same. Red area marks the contraction of suitable habitat to unsuitable.
Forests 13 01051 g007
Figure 8. Habitat suitability changes from the current conditions to the future climate (2070s) under climate scenarios in MIROC6 models: (a) SSP 2.6, (b) SSP 4.5, (c) SSP 7.0, and (d) SSP 8.5. Green area marks the total expansion of habitat suitability from unsuitable to suitable habitat. Yellow area indicates habitat suitability prediction remained the same. Red area marks the contraction of suitable habitat to unsuitable.
Forests 13 01051 g008
Table 1. Environmental variables used for modeling and their permutation importance.
Environmental VariablesCodePercent Contribution
Mean diurnal rangeBio_20.3
Temperature seasonalityBio_413.4
Mean temperature of coldest quarterBio_113.2
Precipitation seasonalityBio_155.9
Precipitation of driest quarterBio_173.7
Precipitation of warmest quarterBio_1873.6
Table 2. Habitat suitability changes from the current conditions to the future climate (2050s and 2070s) under climate scenarios in MIROC6 models: SSP 2.6, SSP 4.5, SSP 7.0, and SSP 8.5.
Periods Area of Suitability Changes (km2)
SSP 2.6SSP 4.5SSP 7.0SSP 8.5
Current vs. 2050Expansion19,110.513,762.619,921.5694,031.77
Unchanged35,027.4745,773.9638,651.8730,592.01
Contraction28,336.2617,589.7724,711.8532,771.72
Current vs. 2070Expansion15,334.0222,532.1440,679.5144,101.15
Unchanged40,426.0639,032.0543,061.9942,909.91
Contraction22,937.6724,331.6720,301.7420,453.81
Publisher’s Note: MDPI stays neutral with regard to jurisdictional claims in published maps and institutional affiliations.

