Article

Spring and Autumn Phenology in Sessile Oak (Quercus petraea) Near the Eastern Limit of Its Distribution Range

by
Ioana Maria Gafenco (Pleșca)
1,2,
Bogdan Ionuț Pleșca
2,*,
Ecaterina Nicoleta Apostol
2 and
Neculae Șofletea
1
1
Faculty of Silviculture and Forest Engineering, Transilvania University of Brasov, 1 Ludwig van Beethoven Street, 500123 Brașov, Romania
2
National Institute for Research and Development in Forestry (INCDS) “Marin Drăcea”, 128 Eroilor Boulevard, 077190 Voluntari, Romania
*
Author to whom correspondence should be addressed.
Forests 2022, 13(7), 1125; https://doi.org/10.3390/f13071125
Submission received: 13 June 2022 / Revised: 12 July 2022 / Accepted: 15 July 2022 / Published: 17 July 2022
(This article belongs to the Section Forest Ecology and Management)

Abstract

:
Due to the visible and predictable influence of climate change on species’ spatial distributions, the conservation of marginal peripheral populations has become topical in forestry research. This study aimed to assess the spring (budburst, leaf development, and flowering) and autumn (leaf senescence) phenology of sessile oak (Quercus petraea), a species widespread across European forests close to its ranges’ eastern limit. This study was performed in Romania between spring 2017 and 2020, and it included a transect with three low-altitude populations, a reference population from its inner range, and a sessile oak comparative trial. The temperature was recorded to relate changes to phenophase dynamics. We identified small variations between the reference and peripheral populations associated with climatic conditions. In the peripheral populations, budburst timing had day-of-year (DOY) values <100, suggesting that sessile oak may be more susceptible to late spring frost. Furthermore, we found spring phenophase timing to be more constant than autumn senescence. Moreover, budburst in the sessile oak comparative trial had obvious longitudinal tendencies, with an east to west delay of 0.5–1.4 days per degree. In addition, budburst timing influenced leaf development and flowering, but not the onset of leaf senescence. These findings improve our understanding of the relationship between spring and autumn phenophase dynamics and enhance conservation strategies regarding sessile oak genetic resources.

1. Introduction

Plant phenology is generally defined as the scientific study of periodic biological events and how they are affected by seasonal climatic and weather conditions [1,2,3,4,5,6]. The period of phenological events, including budburst, leaf development, flowering, and leaf senescence, are recognised as having increased sensitivity to climate change [7,8,9,10,11].
Monitoring phenophases is relatively simple and, in some cases, long series of data records exist due to many forestry studies being performed to assess or model the phenological variability of forest vegetation [12,13,14,15,16,17,18]. Additionally, phenology is considered a key determinant of tree spatial distributions [19]. Consequently, it is frequently used to predict future shifts in species’ geographical ranges in response to climate change [20].
There is a rapidly expanding body of evidence indicating that environmental changes are a growing threat to the persistence and sustainability of forests [21], with peripheral populations considered among the ecosystems most vulnerable to these phenomena [22,23,24,25,26,27]. In this context, peripheral populations play an important role in preserving biodiversity [28] and estimating species evolution [29,30]. Unlike central populations in a species’ range, peripheral populations mainly exist in adverse climatic environments [31]. Moreover, they are usually characterised by isolated and small population sizes [32,33], leading to reduced genetic variation [34] associated with an increased risk of extinction [35,36,37]. However, peripheral populations, particularly those found at the lower natural range limits, are viewed as better adapted to stressful conditions, and consequently are likely to display valuable adaptations [38,39,40,41].
In this study, we focused on sessile oak (Quercus petraea [Matt.] Liebl.), a species widespread across European forests that is included in numerous phenological investigations [42,43,44,45,46,47,48,49,50,51,52]. However, the phenology of low-altitude sessile oak populations is not fully known [40,53], particularly for those found near the eastern boundary of the species distribution area. Therefore, it is important to assess both spring and autumn phenology and their relationship with local climate conditions under the expected environmental changes.
In Romania, Quercus petraea sensu lato (including Quercus petraea (Matt.) Liebl. ssp. petraea (Liebl.) Soó, Quercus petraea. ssp. dalechampii (Ten.) Soó, and Quercus petraea ssp. polycarpa (Schur) Soó) covers approximately 8.3% of the forested area [54], making it the most widespread native oak species. While the common sessile oak is a hill species with typical mesothermal behaviour [55], there are situations when this species enters the forest–steppe area, forming pure or mixed stands with the other two thermophilic sessile oak trees [56,57]. The climate in these marginal populations differs sharply from the hill area (higher average annual temperatures, lower average annual rainfall, and intense evapotranspiration), leading to numerous consequences for mesophilic species such as sessile oak at the limit of its tolerance range.
While some studies have evaluated sessile oak phenology at its lower altitudes in Romania [58,59], they have focused mainly on a single location. Moreover, sessile oak was a poorly represented taxon among the studied phytocenosis. In this context, the unique characteristics of peripheral populations constantly exposed to climate pressures and soil drought represent an understudied area that requires further consideration. Therefore, this study evaluated the phenological structure of low-altitude sessile oak populations near the eastern limit of the species’ general distribution range.
We focused on the following key objectives: (i) assess the onset of budburst and the leaf development dynamics; (ii) analyse the flowering phenology and establish the correspondences or differences from the budburst phenology; (iii) analyse the autumnal leaf senescence; (iv) evaluate the phenological behaviour of sessile oak populations originating from the entire area of the species in Romania and compare it to the areas of the peripheral populations studied. Furthermore, we assessed the intra- and inter-specific phenological structures of low-altitude populations to better understand their adaptive and evolutionary potential under conditions expected to occur due to global climate change. In addition, the data obtained from the comparative analysis of populations will provide a foundation for establishing strategies for the use and conservation of sessile oak genetic resources. Finally, knowledge of the level of intra- and inter-specific phenological variability in sessile oak comparative trials will inform the selection and promotion in plantations of the most suitable provenances to ensure the stability of forest ecosystems.

2. Materials and Methods

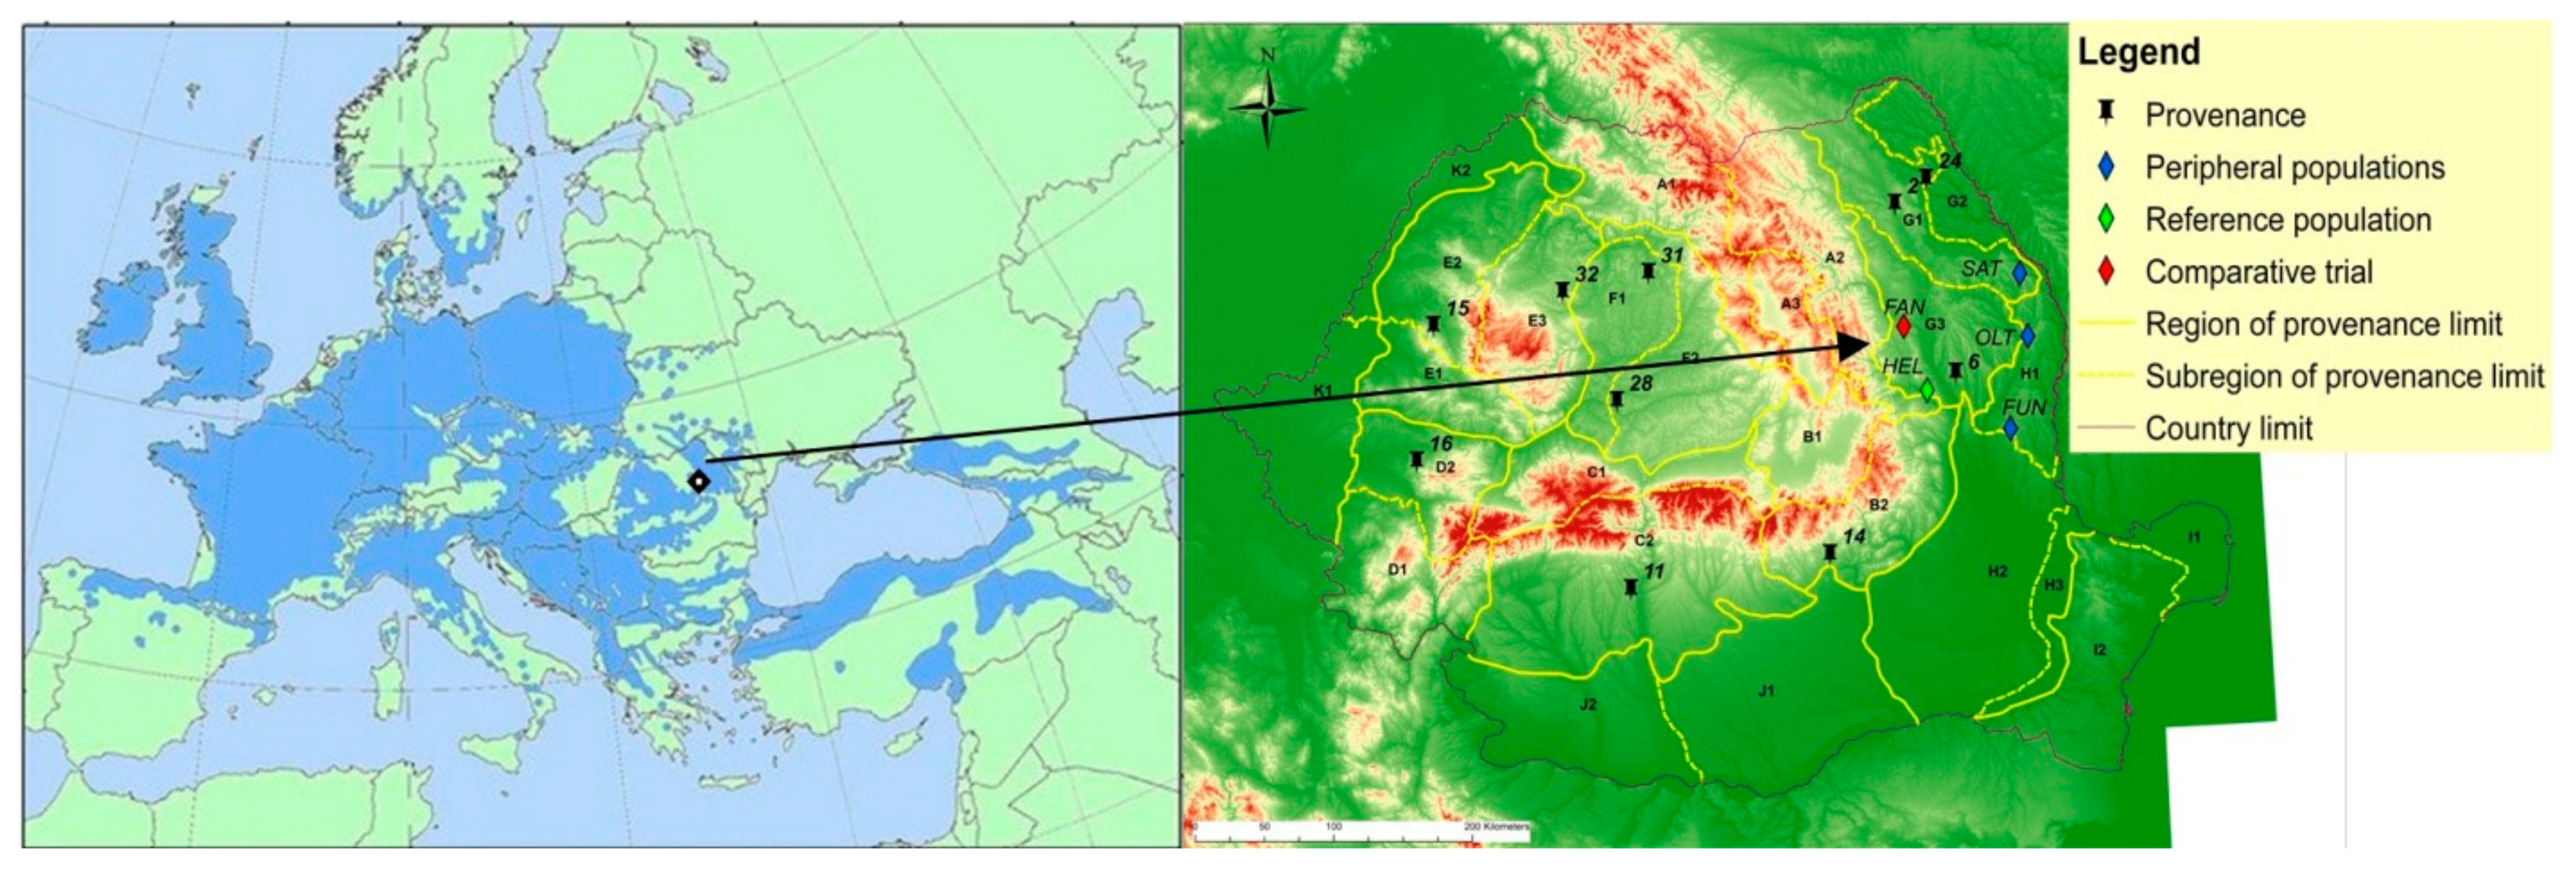
2.1. Study Site and Sampling

The phenological research included four populations of sessile oak (Table 1), three of which (SAT, OLT, FUN) are representative for their peripheral/marginal position (at low altitude for sessile oak in the research area, along a north–south transect, respectively, in close proximity to the eastern limit of the general sessile oak distribution). In addition, for the comparative analysis, we chose a reference population from the inner part of the species’ range (HEL) and a sessile oak comparative trial (FAN), where 10 provenances from the sessile oak area in Romania were tested (Figure 1, Table 1).
A total of 227 mature individuals were identified and phenologically evaluated in the four selected populations. For the FAN comparative trial, five trees from each of the ten provenances were selected randomly (Table 2).

2.2. Phenological Observations

This study was performed between spring 2017 and 2020 to cover the spring phenophases (budburst—BB, leaf development—LD, and flowering—FL) and autumn leaf senescence—LS. The phenological development of all phenophases followed the protocol proposed for oaks as part of the Tree4Future project [62] prepared by E. Chesnoiu (Institutul Național de Cercetare-Dezvoltare în Silvicultură (INCDS) “Marin Drăcea”, Bucharest, Romania) and L.E. Pâques (Institut National de la Recherche Agronomique (INRA), Orléans, France), consisting of four different stages for budburst and leaf development (0: > 50% of buds are fully closed (dormant stage); 1: >50% of buds are swollen and the first green leaflets are visible; 2: >50% of buds have grown leaflets without a distinguishable petiole or base shape; 3: >50% of leaves are fully expanded), two stages for flowering (FL; 0: >50% of male inflorescences are formed and green-yellow but have not released pollen; 1: >50% of inflorescence released pollen and are yellow-brown), and three stages for leaf colouring (1: >50% of foliage is still dark green, except the bottom part of leaves, which have begun to discolour; 2: >50% of leaves change colour to light green with yellow spots; 3: >50% of leaves are yellow).
For the flowering phase, we recorded only the maturation of male inflorescences because the maturation of the male and female flowers is intercorrelated [63], and the flowering phenophase for male flowers is easier to follow than for female flowers [58].
The phenophases stages were determined at intervals of 2–4 days by examining the entire crown of each individual tree (Table 1), always in the same direction, with 20 × 50 binoculars [64].
A temperature and relative humidity sensor (HOBO Pro v2) were installed at each site to enable the correlation of phenophases stages with climate.
Phenological data were analysed using the STATISTICA v.8.0 statistical software (StatSoft Inc., Tulsa, OK, USA) [65]. Initially, we used the Shapiro–Wilk test to confirm that the phenological variables are normally distributed, given that the studied populations do not have an equal number of trees. Subsequently, because we found them to be non-normally distributed, the Kruskal–Wallis test was used to explore whether significant differences exist between them.
Furthermore, the relationship between variables in each year and the geographic parameters, including the ecophysiological latitude, of each site was assessed using Spearman’s rank correlation coefficient (rs). The ecophysiological latitude (Le) represents the latitude (L) corrected by altitude (A), where a 100 m difference in altitude is equal to one degree of latitude, determined using the formula Le = L + A/100 [66].

3. Results

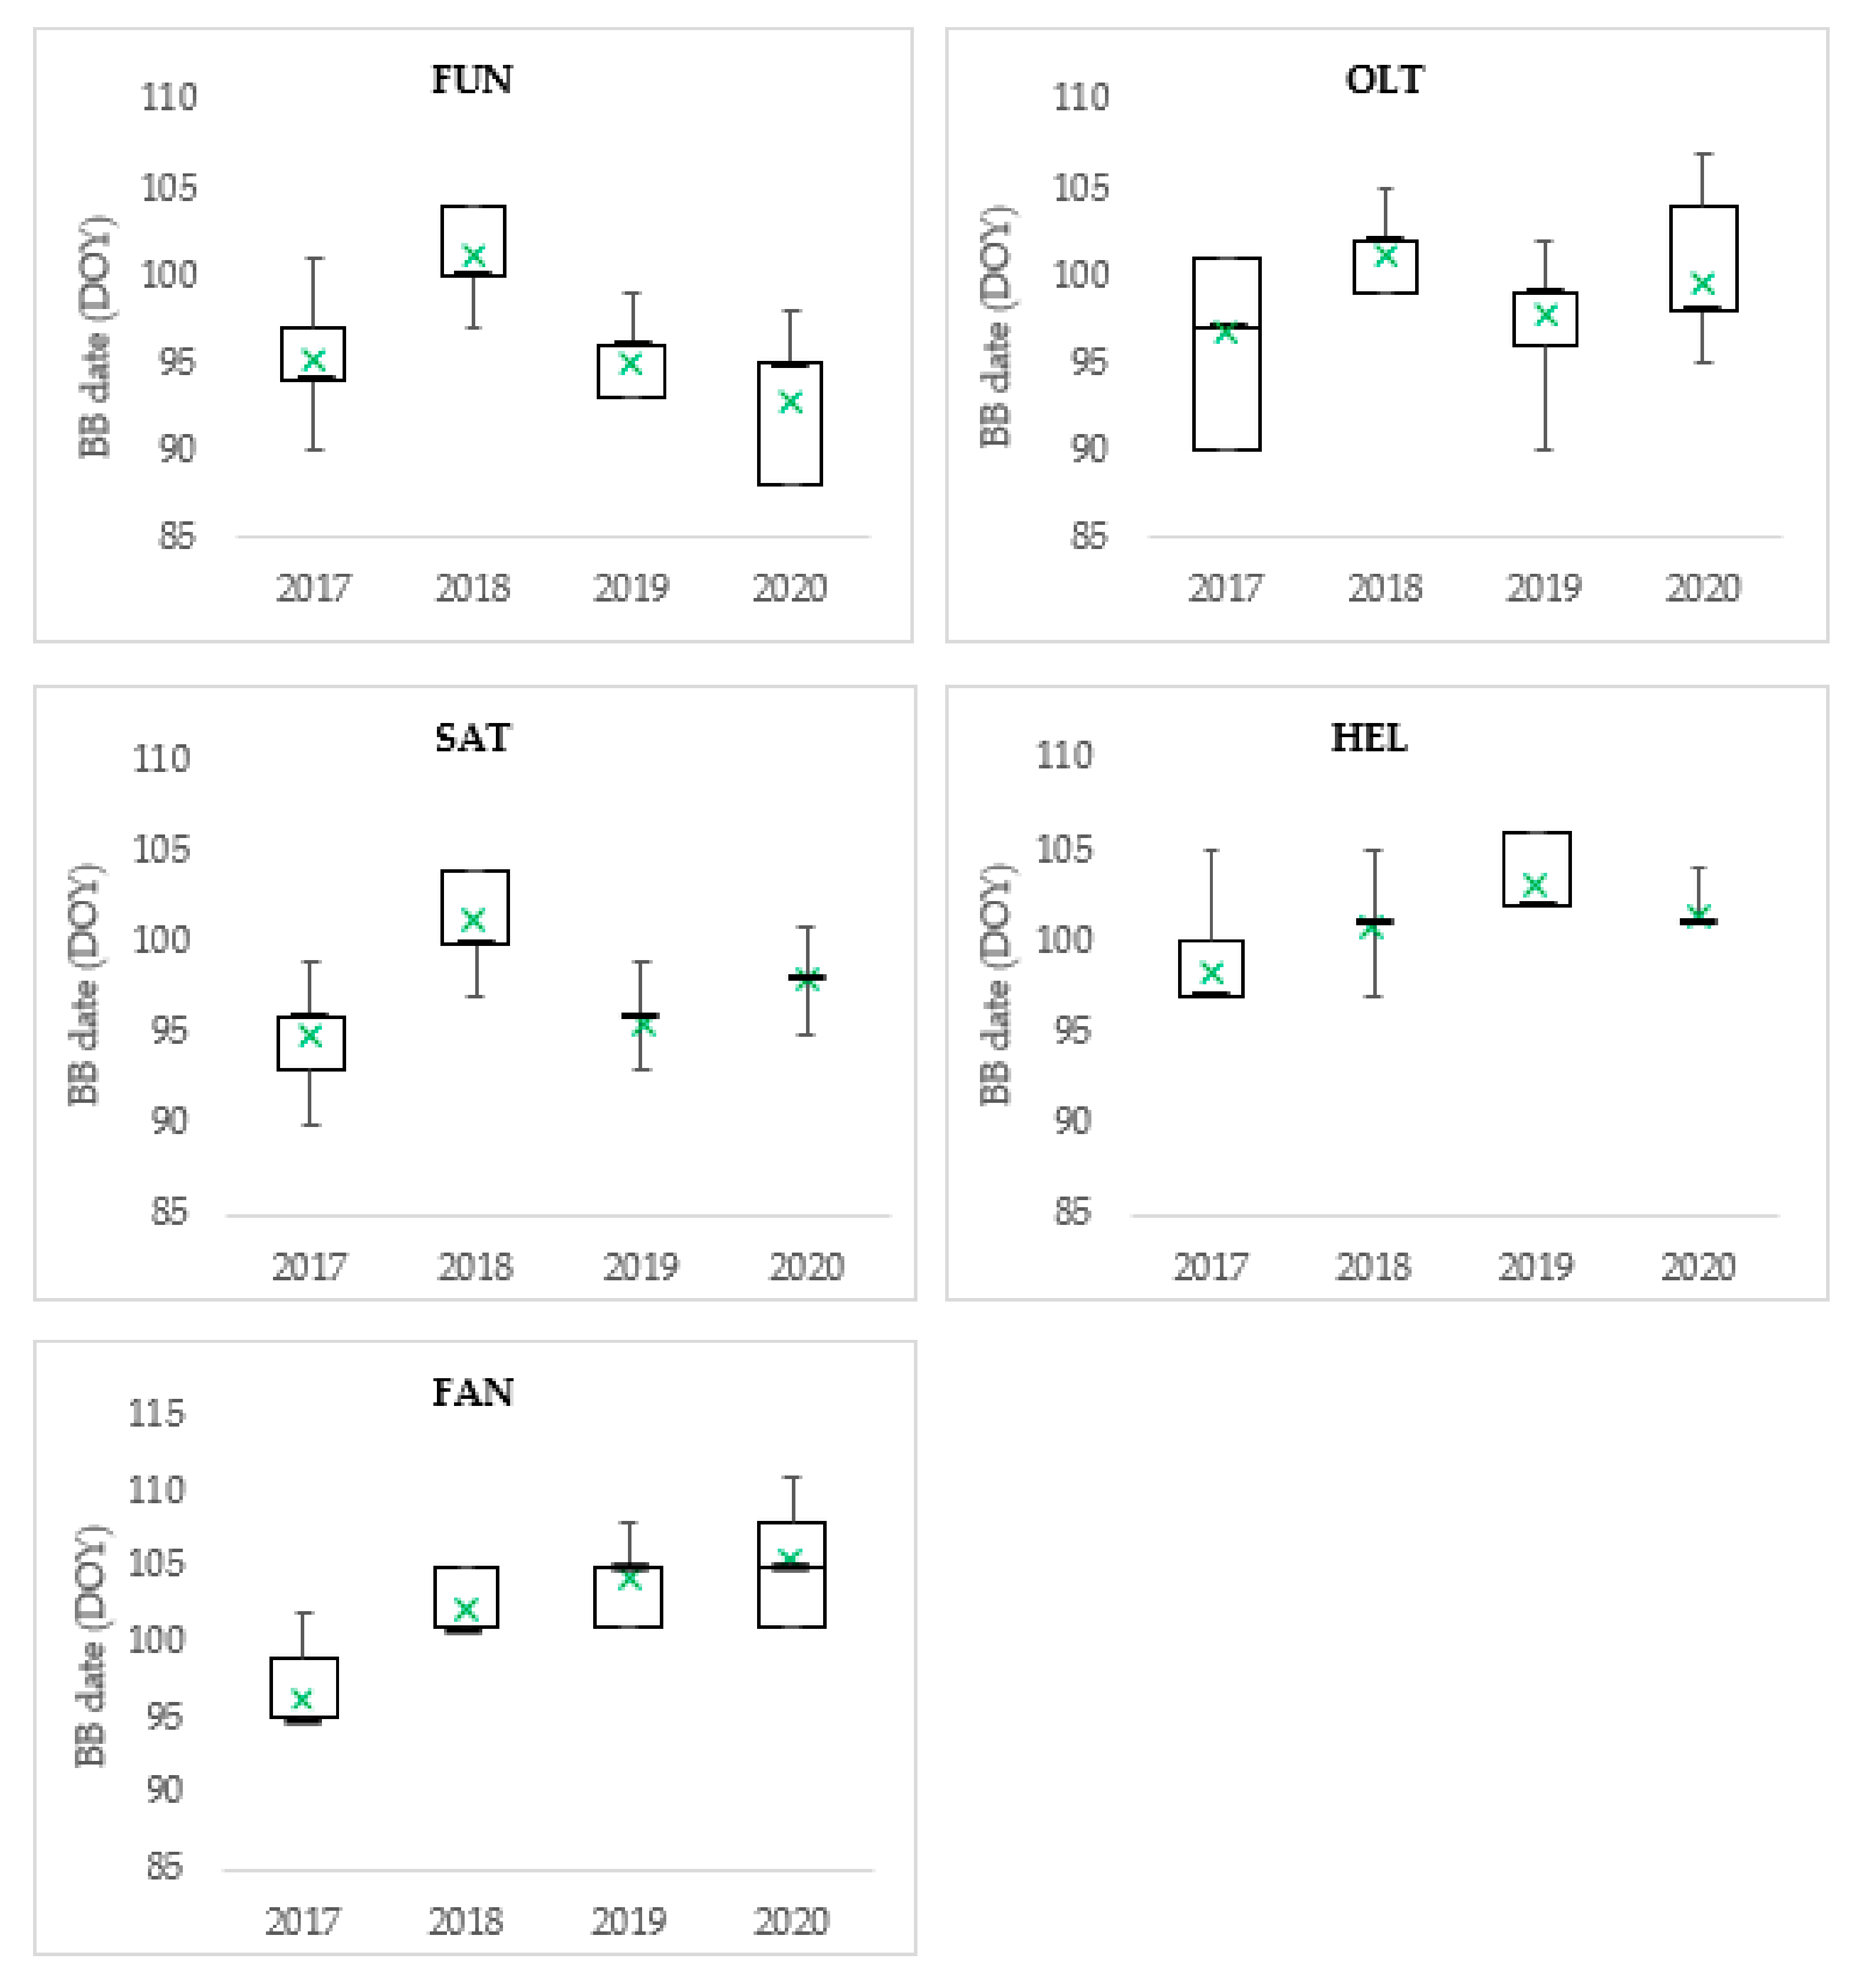
3.1. Budburst and Leaf Development

The budburst occurrence differed significantly by year (p < 0.001, Kruskal–Wallis test) for all populations. Amongst the peripheral populations FUN, OLT, and SAT, sessile oak showed an extremely small difference in the average date for budburst (Table 3). Moreover, there was only a few days difference between them and the reference HEL population, with a maximum average advance of 5 days for the FUN population. Unlike the peripheral populations, HEL showed the lowest inter-annual variability and the smallest range (9 days) for the start of the budburst.
The budburst starts in the peripheral populations before the reference population, except for 2018, when it starts almost at the same time (Figure 2). The later onset of budburst in the peripheral populations in 2018 compared to the other years was associated with lower temperatures between leaf senescence in the previous year and the start of budburst in the current year (data not shown). Consequently, the later start of vegetation growth in 2018 resulted in a shorter time for leaf phenophase (i.e., the number of days from budburst (stage I) until leaves reached the full size (stage III)) in the three peripheral populations. A similar situation was observed with the FAN comparative trial in 2018, where it required 4 days on average for all individuals to budburst, ranging between 7 and 11 days (data not shown).
In the FAN comparative trial, the budburst date range was the largest at 17 days, the earliest budburst dates recorded in 2017 (DOY 95) and the latest in 2020 (DOY 112; Figure 2).
The number of days required for leaves to complete expansion (from stage I to stage III) was between 13 to 16 days on average across all populations, with the process at its fastest in the peripheral populations.
There were extremely small differences in the thermal sum (sum of daily average temperatures) between 1 January and budburst across peripheral populations, decreasing from the southern to the northern regions of the transect (Table 4). In the HEL population, the thermal sum was slightly higher than in the peripheral populations (11.3% for SAT, 3.6% for OLT, and 1.8% for FUN) over this period and about 4.3% smaller than the FAN comparative trial.
Conversely, the thermal sum between leaf senescence in the previous year and budburst in the current year increased from the most southerly peripheral population to the most northerly. However, the differences were very small. The thermal sums of the HEL and FAN populations were similar and higher than those of the peripheral populations. Additionally, from the standard deviation values, it can be mentioned that all populations’ interannual variability shows similar patterns of variation over the recorded period (Table 4).
The local provenances 2 Dolhasca, 6 Sascut, and 24 Botosani—all within the G region (The Moldavian Plateau) where the comparative trial was conducted—were among the fastest to reach budburst dynamic stage I in all studied years. Moreover, the budburst onset for the local provenances occurred at about the same time as the HEL population, located in the G region, except in spring 2017. The same was true for the SAT population, also located in the G region, for the first two years of the study. However, the local provenances had a later budburst in the last two years of the study. While the differences in the average budburst date across provenances are not considerable, the slowest onset of budburst was found for the provenances 32 Cluj and 15 Beius, both in the E region (Apuseni Mountains).
Furthermore, a significant positive correlation was found between the budburst and provenance altitude in the data of the FAN comparative trial for all four years of the study (Table 5). Moreover, the budburst was significantly and indirectly correlated with the longitude of the sites, reflecting the positive correlation between site longitude and the rate of leafing. Therefore, our sessile oak data indicate a delay in budburst from east to west of 0.5 to 1.4 days for each degree of longitude. However, no significant correlations were observed between the budburst date and ecophysiological latitude (Table 5).
Both budburst and leaf development had small standard deviation values, suggesting low interannual variability. Across populations, the greatest variation was found in the comparative trial and the lowest was found in the reference population.

3.2. Flowering

During the flowering phenophase in spring 2017, a wide geographic area, including all studied populations, experienced a period of thermal stress. Following a period with mean air temperatures above 10 °C, the air temperature decreased and persisted for several days (DOY 109–115). The sudden drop in temperature was accompanied by heavy snow, catching the flowers in the full maturation process, and minimum temperatures dropped below 0 °C at night. Across sites, minimum temperatures ranged from −2.0 °C to −0.9 °C.
Therefore, individuals with visible flower injuries were observed in all populations. The reference population was the worst affected, with only 53.5% of the individuals having completed the flowering process. In the peripheral populations, the percentage of individuals that suffered from the low temperatures was smaller, 24.0% in SAT, 12.0% in OLT, and 11.8% in FUN. In the FAN comparative trial, there were injuries only to individuals in provenances 11 Babeni, 14 Valeni, and 24 Botosani, the latter having the largest proportion of injured trees. Nevertheless, the flowering phenophase overlapped with the leaf-development phenophase for all populations, except for the FUN population, where the lowest average DOY values were recorded (Table 6).
Pollen release started after 11–14 days after the budburst and lasted 7–10 days on average, depending on the population. Consistent with the other two spring phenophases, the flowering phenophase shows a similar pattern of standard deviation.
The average daily recorded temperatures of the OLT, SAT, and HEL populations were highly similar. The FUN population, located at the southernmost point in terms of altitude and latitude, had the highest temperature, leading to faster flowering compared to the other populations.
Within our comparative trial area, flowering time was positively correlated with latitudinal and longitudinal gradients (Table 5), except in 2017, when it was only correlated with longitude. Moreover, flowering time and altitude were significantly positively correlated in 2019 (p < 0.05, Spearman’s rank correlation test), but not in the other years. However, we observed no significant correlation between flowering time and ecophysiological latitude.

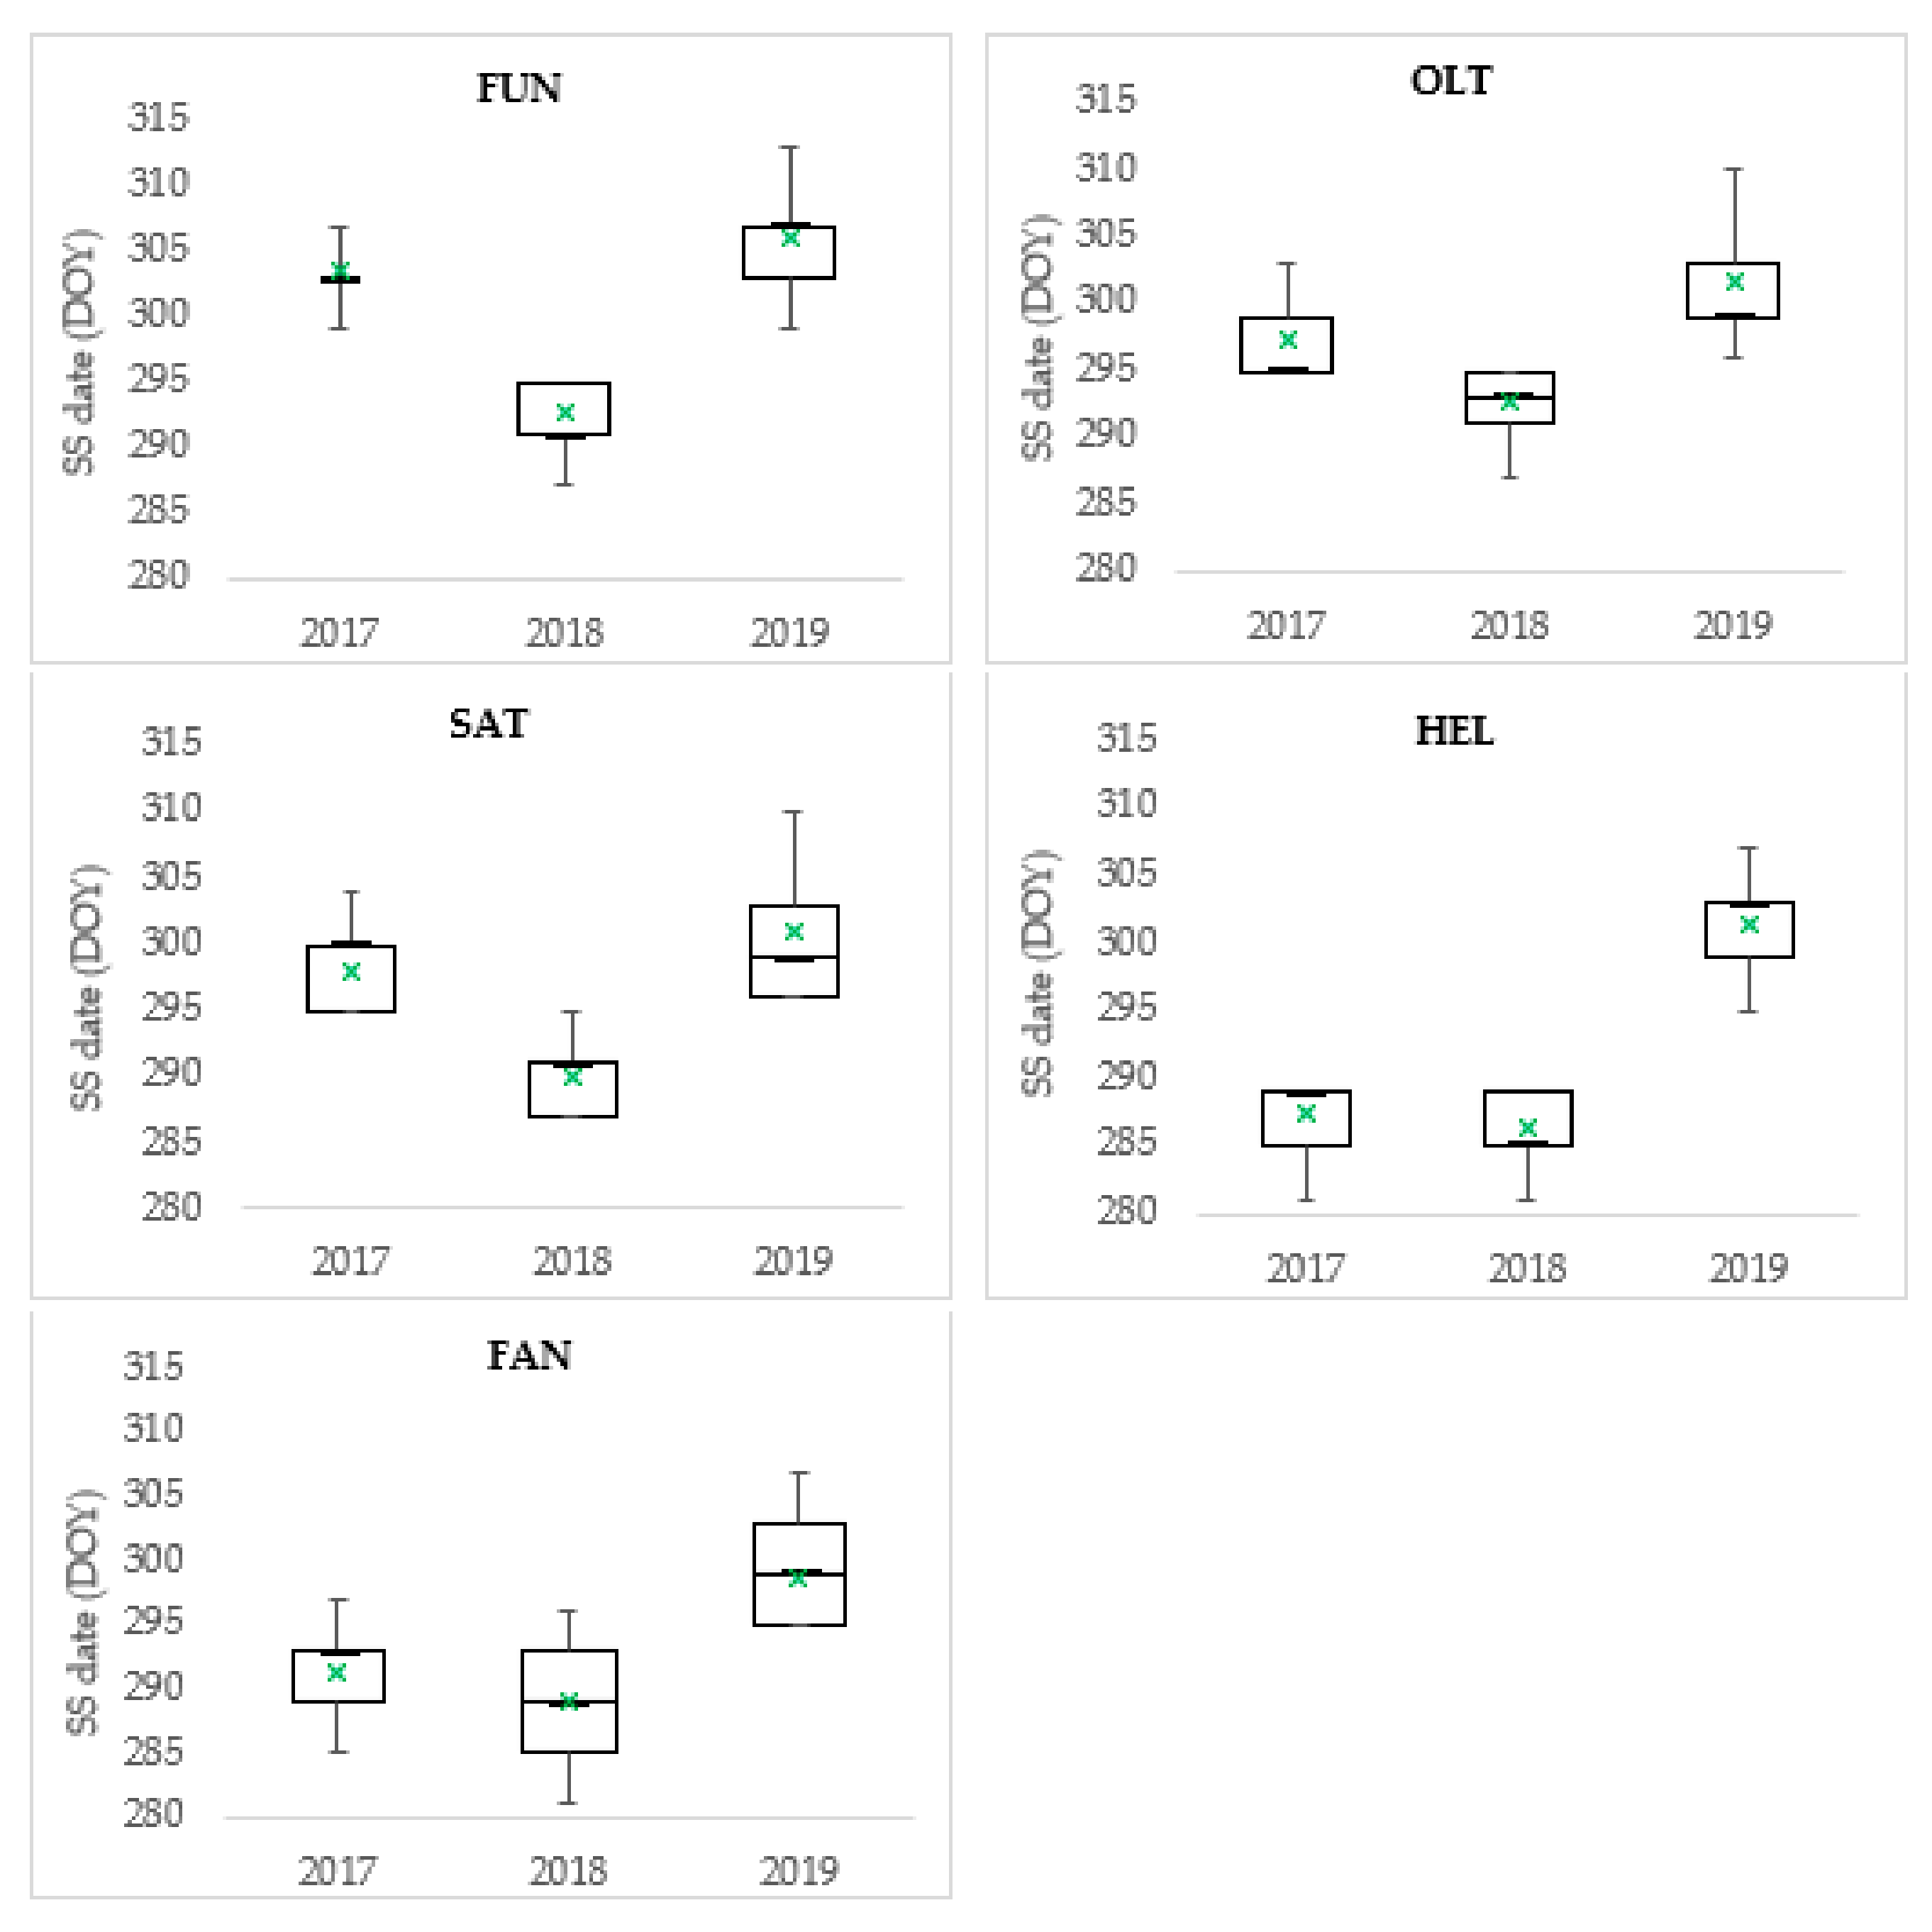
3.3. Leaf Senescence

Differences in the onset of leaf senescence across years were also statistically significant (p < 0.01, Kruskal–Wallis test). Sessile oak showed greater inter-individual variation in the date of leaf senescence (DOY 281–313, 32 days) than in budburst (DOY 88–112, 24 days) across the five populations (Table 3 and Table 7). The average date of leaf senescence varied by less than one week among the peripheral populations, which differed from the reference population by almost three weeks (Table 7). However, there were only small differences in the leaf senescence duration among populations, ranging between 23 and 26 days.
For the year 2018, which had a later budburst start date, the peripheral populations had an earlier onset of autumn leaf senescence (Figure 3).
During the first two seasons, the peripheral populations had later leaf colouring compared to the HEL population by more than 14 days in 2017 and almost a week in 2018, but occurred at about the same time in 2019, with a delay of 4 days for the FUN population and only 1 day for OLT and SAT.
Compared to the HEL population, the comparative trial also had a similar inter-individual variation range but a later average leaf senescence date (Table 3 and Table 7).
In contrast with budburst, leaf senescence was significantly correlated with the geographical gradients of the origins only in 2017. Specifically, leaf senescence had weak negative correlations with altitude and longitude and a moderately positive correlation with the ecophysiological latitude (Table 5).
Overall, the variation of leaf senescence from one year to the next was small in the comparative trial. However, there were changes at the level of provenance, particularly in 32 Cluj, which had the earliest leaf autumn colouring for each of the three consecutive years.
In addition, the standard deviation values showed that senescence has smaller interannual variability than budburst (Table 7). The coefficients of variation were smaller for the peripheral populations compared to the reference one at the population level, indicating a greater consistency in leaf senescence.
The recorded temperatures during the bioactive season were higher in the peripheral populations, with only slight differences between them. The onset of senescence occurred earlier (DOY 281) and finished faster (DOY 307) in the HEL reference population than in the FAN comparative trial because these populations are located in the sub-Carpathian area, resulting in a shorter bioactive season in these areas.

3.4. Correlations

The budburst across the studied years was significantly positively correlated with medium-to-low correlation coefficients (Table 8). Significant correlations were also found with leaf development phenophase across the studied years, but only in half of the areas studied. Flowering was also significantly correlated across the studied years, but with low to medium correlation coefficients.
Statistically significant correlations were found with leaf senescence in the FAN comparative trial. Moreover, significant correlations with leaf senescence were also detected for the OLT, SAT, and HEL populations in 2017 and 2018.
Sessile oak showed significant correlations between the spring phenophases across years, particularly budburst with leaf development and flowering (Table 9). However, significant correlations were not frequent between budburst and leaf senescence (Table 9), suggesting that the onset of budburst does not influence the start of senescence.
Finally, no significant correlation between budburst and previous year senescence was observed for most of the populations (Table 10).

4. Discussion

4.1. Budburst Phenology

Despite the sum of the average daily temperatures between 1 January and the date of budburst decreasing in the peripheral populations from the south of the transect to the north, small phenological differences were observed between populations. This finding can be explained by thermal differences not significantly influencing populations located along the ~120 km latitudinal transect. The average budburst date in the peripheral sessile oak populations (DOY 98, 8 April) was similar to that reported by Tomescu [67] in the Dobrina forest in Romania (DOY 99, 9 April), located at 200 m altitude near our OLT population. However, the duration of the time series observations and the locations were not the same and, therefore, these comparisons should be treated with caution. Still, the results show that similar budburst dates 70 years ago and nowadays could be encountered. More recent phenological observations carried out in the Fundeanu forest [58,68] showed an identical average value for sessile oak budburst (Apostol unpublished data) to our data. Our observations made at the same location (FUN population) showed a two-day advance in the average budburst (DOY 96, 6 April). This very small difference in average budburst for sessile oak at the same location could be because only a smaller number of sessile oak trees were monitored in previous studies.
Moreover, compared to extra-Carpathian sessile oak phenological studies, the average budburst in our peripheral populations occurred almost two weeks earlier than the average budburst indicated for sessile oak in the OPTIMix experimental plots in France (DOY 111; [69]) and 3 to 6 days later than the average budburst obtained for sessile oak in low-elevation populations (<387 m above sea level) in the Gave Valley, France (DOY 92–95; [70]). However, this difference is only illustrative because both previous studies considered different evaluation scales for leaf unfolding. These differences highlight the adaptive phenological features of sessile oak populations located near the eastern limit of the species’ general area.
We observed that the average budburst in the reference HEL population was very close to that of the peripheral populations (+2 days), and the range of budburst variation was almost twice as small as the peripheral populations. However, most individuals completed phenophase close to the average date, suggesting a greater reduction in behavioural diversity in the reference population for budburst. For instance, de Sauvage et al. [71] studied nine populations of sessile oak along an altitudinal gradient in the central Pyrenees in France and found smaller phenological variability for populations situated at higher elevations.
Numerous studies performed in comparative trials of sessile oak [42,43,44] have shown that the budburst phenology varies with latitude, with southern leafing earlier than northern populations. However, these findings contrast with those of Jensen [72], who found in comparative trials of sessile oak and pedunculate oak that northern provenances budded earlier than southern provenances. However, some studies have also reported similar clinal variations along altitudinal gradients [46,47].
In the FAN comparative trial, it was observed that the adaptive variation of the sessile oak provenances followed a longitudinal and altitudinal rather than latitudinal tendency (Table 5), with the lower eastern altitudes leafing earlier, indicating that less heating is required to trigger this phenophase than in higher western altitudes.
Unlike latitude, the influence of longitude in plant phenology is more obscure because it does not affect day length [73]. The effect of longitude on budburst can be considered a possible mechanism for adapting to local conditions associated with the need to avoid exposing leaves to late frosts, a behaviour observed in beech [74]. However, we found a clear east–west tendency at the time of budburst for the studied provenances.

4.2. Flowering Phenology

The abnormal spring event in 2017, where temperatures dropped sharply below 0 °C after a period with average air temperatures over 10 °C, coincided with a period of pollen release that partially compromised the flowering phenophase. It is important to note that several studies define this type of event as frost [46,75,76,77]. Unlike vegetative structures, the reproductive structures are reported to be more sensitive to frost [78], supported by the absence of damage to the leaves.
The effects of spring frost on temperate oak species phenology have been well documented. They are associated with the early timing of flowering, potentially resulting in reproductive failure [79], since there is a high probability that the pollen release process will occur during adverse meteorological conditions. Therefore, the unfavourable climatic conditions in 2017 during pollen release likely harmed the flowering process, interrupting microsporogenesis and the elongation of the catkins, leading to their death [80].
The reference HEL population had the highest proportion of frost-injured individuals among the studied populations because its average flowering DOY was closer to the average frost date. The differences between populations in the damage intensity can be attributed to the stage of development at the time of frost exposure [42,81].
It should also be noted that in the long-term phenological study conducted by Chesnoiu [68] in the Fundeanu forest, sudden drops in temperature in 2009 (minimum temperature −1 °C) and 2015 (minimum temperature −3 °C) were recorded at the time of flowering (23 April), partially affecting tree inflorescence. Therefore, our observations confirm those previously reported in this forest.
In the FAN comparative trial, flower injuries were also associated with the developmental stage at the time of frost exposure. Consequently, the three provenances (11 Babeni, 14 Valeni, and 24 Botosani) that had trees in a more advanced flowering stage suffered flower damage in 2017, potentially explaining the increased frost sensitivity. However, these results should be treated with caution, since there was only one episode of spring frost during this study, and further studies are required to confirm this observation.
In addition, there were geographic patterns with latitude and longitude and, to a lesser extent, altitude in flowering time in the FAN comparative trial (Table 5). The flowering date was negatively correlated with latitude and longitude, indicating that flowering occurs earlier in northern and eastern provenances than in southern and western provenances. There was also a significant positive correlation between flowering date and altitude only in 2019, suggesting lower-altitude provenances tend to release pollen earlier than higher altitude provenances.
In sessile oak, the role of geographic gradients in flowering onset has not been studied as extensively as budburst. For example, [82] found an association between the start of the oak pollen season and latitude, where southern populations flowered earlier than northern populations. In addition, [83] studied four Quercus species in the US, observing that latitude, longitude, and elevation were more likely to influence DOY flowering in western (Quercus agrifolia Née and Quercus lobata Née) than in eastern and central (Quercus alba L. and Quercus rubra L.) species.
In the four consecutive years studied, no meaningful differences in flowering period length (7–10 days) were observed among sites. This interval falls within limits observed in previous studies in mixed oak stands that reported a flowering period of 6 [58] to 12 days [59,68].

4.3. Leaf Senescence

The average leaf senescence date observed in the peripheral populations (DOY 298) is later than the average senescence DOY values reported in previous studies performed over half a century ago at the national level in sessile oak forest stands. For example, Tomescu [67] reported a DOY of 289 for sessile oak in the Dobrina forest, and Tomescu [84] reported a DOY of 273 for sessile oak in the Poieni forest located 360 m from our RAD population, suggesting a delay in leaf senescence of 1.7–4.6 days per decade. As mentioned previously, these differences should be treated with caution, since the phenological observation protocol is not the same, and the influence of inter-observer variability is very high [85]. Similarly, we observed a small delay in the average date of leaf senescence in the reference HEL population (DOY 282) and the FAN comparative trial (DOY 293) compared with nearby sites such as the Bradatel forest (DOY 273) and Casa cu Nuci forest (DOY 289; [84]). However, the average leaf senescence date for the peripheral populations was very close to that obtained by Chesnoiu [68] in the Fundeanu forest (DOY 299). Moreover, the differences in the leaf colouring average DOY in the peripheral populations were small compared to some European studies on autumn senescence in sessile oak that reported DOY of 299 [86] and 303 [45].
Numerous studies have indicated that leaf senescence will be progressively delayed over time under future climate-change scenarios [15,45,87,88,89,90,91,92]. In a prospective analysis, Delpierre et al. [86] proposed a pattern for sessile and pedunculate oak using data provided by the RENECOFOR network in France from 1997 to 2006. They predicted a trend toward a delay in leaf colouring of 1.7 days per decade for the period 1951–2099. In sessile oak in France, the simulations performed by Vitasse et al. [45] showed a delay in senescence of 1.4 days per decade. Moreover, the models explored by Nölte et al. [92] for sessile oak in Southwest Germany predicted a delay of 6–11 days per decade for the period 2070–2100 compared to 1985–2015. In contrast, it was shown that, due to global warming, the budburst phenology of oaks starts earlier by 1–3 days·°C−1 [93,94] up to 5–7 days·°C−1 [95,96].
These changes in the occurrence of phenological phases are also reflected in the length of the vegetation season [87,96,97,98], as can be seen in comparisons between our results and those reported previously for bioactive season lengths. Based on observations between 1956–1965, Tomescu [85] found that the vegetation period in sessile oak lasted, on average, 180 days regardless of geographical gradients (200 days at 100 m altitude and 160 at 650 m). Therefore, we can observe a lengthening of the growing season by ca. 40 days over the last few decades. Indeed, many studies based on phenological observations highlight an obvious extension in growing season length [99,100], with positive effects on forest productivity [101,102]. However, this pattern was not evident in sessile oak [71].
The difference in the length of the growing season between the peripheral populations, the reference population, and the comparative trial is apparently associated with the sum of the average daily temperatures recorded during the vegetation season. This association was expected, as the reference HEL population and FAN comparative trial are located in premontane areas.
The magnitude of the spring phenophases’ interannual variability (expressed by standard deviation) is higher than for leaf senescence.
While leaf senescence showed small variations across years for the FAN comparative trial, some differences were observed between provenances. For instance, the provenance 32 Cluj showed late budburst and early senescence across the three autumn seasons studied, likely reflecting its marginal location within the experimental trial.
Similar to budburst, leaf colouring variation in sessile oak with latitude has been reported [43,103]. Senescence is triggered earlier in high-latitude populations than in low-latitude populations due to variations in photoperiod length [104]. However, Vitasse et al. [105] found that the gradient variation of senescence with altitude is more likely to be caused by temperature than by photoperiod, a fact explained by the proximity between the sampled populations, leading to no variation in photoperiod between sites.

4.4. Correlations

In agreement with previous studies [49,106,107], the budburst timing was repeatable from year to year. However, the magnitude of repetition (rs < 0.6) was medium to low, suggesting that not all sampled trees start to budburst at the same time in different years [63]. Nevertheless, microenvironmental variation can help explain the individual consistency between years in budburst development [94].
Similarly, the repeatable order of flowering in consecutive springs was observed despite inter-year differences in the time of pollen release. However, the low-to-medium Spearman’s correlation coefficients we obtained indicate that only a small proportion of the sampled trees maintain their order when pollen is released, consistent with the observations of Craciunesc [59] and Chesnoiu [68].
Furthermore, we obtained positive correlations of budburst with leaf development and flowering. Therefore, the timing of budburst is a good indicator for the onset of leaf development and flowering. While this is consistent with some earlier studies [21,108], it is not with others [48,109].
In comparison, the timing of budburst and leaf senescence were correlated, albeit to a lesser extent, indicating that budburst is a poor indicator for the onset of leaf senescence. This finding is consistent with some earlier phenological studies [49,110], but not others [95,111]. Finally, no relationship was observed between budburst and previous year senescence, contradicting an earlier finding with sessile oak [110].

5. Conclusions

This study considered three peripheral sessile oak populations, a reference population from its inner range, and a comparative trial, and obtained results that contribute to the phenological understanding of the sessile oak. While variations in DOY were small among studied sites, they were sufficient to be associated with climatic conditions. In the peripheral populations, the specific climatic conditions resulted in budburst occurring before DOY 100. Consequently, sessile oak might be affected more often by late spring frost in the future.
We found that budburst and flowering dates were repeatable from year to year, consistent with the view that these phenophases are under genetic control. Interestingly, our results also showed that budburst in the FAN comparative trial followed longitudinal and altitudinal tendencies, likely reflecting the shared variation of environmental variables, such as average annual temperature, the severity of the winter season, and other seasonal climatic variations among the origins of the seeds, rather than the influence of longitudinal differences themselves. Moreover, we found that the timing of the budburst influences the leaf development and flowering phenophases, but not necessarily the leaf senescence.
These data can serve as the foundation for establishing strategies for using and conserving sessile oak genetic resources and predicting future phenological changes under the threat of climate and environmental change.

Author Contributions

Conceptualization, I.M.G., B.I.P. and E.N.A.; methodology, I.M.G., E.N.A. and N.Ș.; software, I.M.G.; validation, I.M.G., B.I.P., E.N.A. and N.Ș.; formal analysis, I.M.G.; investigation, I.M.G.; resources, I.M.G. and E.N.A.; data curation, I.M.G.; writing—original draft preparation, I.M.G.; writing—review and editing, I.M.G., B.I.P., E.N.A. and N.Ș.; visualization, I.M.G. and B.I.P.; supervision, I.M.G., E.N.A. and N.Ș.; project administration, I.M.G. and E.N.A.; funding acquisition, I.M.G. and E.N.A. All authors have read and agreed to the published version of the manuscript.

Funding

This study was funded by the Romanian Ministry of Research, Innovation and Digitization, within the Nucleu BIOSERV National Programme (Contract No. 12N/2019), the Project PN19070301, and by the CresPerfInst project—“Creșterea capacității și performanței instituționale a INCDS, Marin Drăcea” în activitatea de CDI—CresPerfInst (Contract No. 34PFE/30.12.2021) financed by the Ministry of Research, Innovation and Digitization through Program 1—Development of national research—development system, Subprogram 1.2—Institutional performance—Projects to finance excellence in RDI.

Institutional Review Board Statement

Not applicable.

Informed Consent Statement

Not applicable.

Conflicts of Interest

The authors declare no conflict of interest.

References

  1. Lieth, H. Purposes of a phenological book. In Phenology and Seasonality Modeling; Lieth, H., Ed.; Springer: Berlin, Germany, 1974; pp. 3–23. [Google Scholar]
  2. Davi, H.; Gillmann, M.; Ibanez, T.; Cailleret, M.; Bontemps, A.; Fady, B.; Lefèvre, F. Diversity of leaf unfolding dynamics among tree species: New insights from a study along an altitudinal gradient. Agric. For. Meteorol. 2011, 151, 1504–1513. [Google Scholar] [CrossRef]
  3. Zhao, M.; Peng, C.; Xiang, W.; Deng, X.; Tian, D.; Zhou, X.; He, H.; Zhao, Z. Plant phenological modeling and its application in global climate change research: Overview and future challenges. Environ. Rev. 2013, 21, 1–14. [Google Scholar] [CrossRef]
  4. Tang, J.; Körner, C.; Muraoka, H.; Piao, S.; Shen, M.; Thackeray, S.J.; Yang, X. Emerging opportunities and challenges in phenology: A review. Ecosphere 2016, 7, e01436. [Google Scholar] [CrossRef] [Green Version]
  5. Workie, T.G.; Debella, H.J. Climate change and its effects on vegetation phenology across ecoregions of Ethiopia. Glob. Ecol. Conserv. 2018, 13, e00366. [Google Scholar] [CrossRef]
  6. Khare, S.; Drolet, G.; Sylvain, J.D.; Paré, M.C.; Rossi, S. Assessment of Spatio-Temporal Patterns of Black Spruce Bud Phenology across Quebec Based on MODIS-NDVI Time Series and Field Observations. Remote Sens. 2019, 11, 2745. [Google Scholar] [CrossRef] [Green Version]
  7. Bertin, R.I. Plant phenology and distribution in relation to recent climate change. J. Torrey Bot. Soc. 2008, 135, 126–146. [Google Scholar] [CrossRef] [Green Version]
  8. Zhang, X.; Friedl, M.A.; Schaaf, C.B. Sensitivity of vegetation phenology detection to the temporal resolution of satellite data. Int. J. Remote Sens. 2009, 30, 2061–2074. [Google Scholar] [CrossRef]
  9. Chen, X.; Xu, L. Phenological responses of Ulmus pumila (Siberian Elm) to climate change in the temperate zone of China. Int. J. Biometeorol. 2012, 56, 695–706. [Google Scholar] [CrossRef]
  10. Richardson, A.D.; Keenan, T.F.; Migliavacca, M.; Ryu, Y.; Sonnentag, O.; Toomey, M. Climate change, phenology, and phenological control of vegetation feedbacks to the climate system. Agric. For. Meteorol. 2013, 169, 156–173. [Google Scholar] [CrossRef]
  11. Campbell, R.K.; Sugano, A.I. Phenology of Bud Burst in Douglas-Fir Related to Provenance, Photoperiod, Chilling, and Flushing Temperature. Bot. Gaz. 1975, 136, 290–298. [Google Scholar] [CrossRef]
  12. White, M.A.; Thornton, P.E.; Running, S.W. A continental phenology model for monitoring vegetation responses to interannual climatic variability. Glob. Biogeochem. Cycles 1997, 11, 217–234. [Google Scholar] [CrossRef]
  13. Chuine, I.; Cour, P.; Rousseau, D. Selecting models to predict the timing of flowering of temperate trees: Implications for tree phenology modelling. Plant Cell Environ. 1999, 22, 1–13. [Google Scholar] [CrossRef] [Green Version]
  14. Chuine, I.; de Cortazar-Atauri, I.G.; Kramer, K.; Hänninen, H. Plant development models. In Phenology: An Integrative Environmental Science; Springer: Dordrecht, The Netherlands, 2013; pp. 275–293. [Google Scholar]
  15. Menzel, A.; Estrella, N.; Fabian, P. Spatial and temporal variability of the phenological seasons in Germany from 1951 to 1996. Glob. Chang. Biol. 2001, 7, 657–666. [Google Scholar] [CrossRef]
  16. Chmielewski, F.M.; Rötzer, T. Response of tree phenology to climate change across Europe. Agric. For. Meteorol. 2001, 108, 101–112. [Google Scholar] [CrossRef]
  17. Schieber, B. Spring phenology of European beech (Fagus sylvatica L.) in a submountain beech stand with different stocking in 1995–2004. J. For. Sci. 2006, 52, 208–216. [Google Scholar] [CrossRef] [Green Version]
  18. Yu, L.; Yan, Z.; Zhang, S. Forest Phenology Shifts in Response to Climate Change over China–Mongolia–Russia International Economic Corridor. Forests 2020, 11, 757. [Google Scholar] [CrossRef]
  19. Chuine, I.; Beaubien, E.G. Phenology is a major determinant of tree species range. Ecol. Lett. 2001, 4, 500–510. [Google Scholar] [CrossRef] [Green Version]
  20. Chuine, I. Why does phenology drive species distribution? Philos. Trans. R. Soc. B Biol. Sci. 2010, 365, 3149–3160. [Google Scholar] [CrossRef] [Green Version]
  21. Soularue, J.P.; Kremer, A. Evolutionary responses of tree phenology to the combined effects of assortative mating, gene flow and divergent selection. Heredity 2014, 113, 485–494. [Google Scholar] [CrossRef] [Green Version]
  22. Liu, J.; Jiang, J.M.; Chen, Y.T. Genetic diversity of central and peripheral populations of Toona ciliata var. pubescens, an endangered tree species endemic to China. Genet. Mol. Res. 2014, 13, 4579–4590. [Google Scholar] [CrossRef]
  23. Kelleher, C.T.; de Vries, S.M.G.; Baliuckas, V.; Bozzano, M.; Frýdl, J.; Gonzalez Goicoechea, P.; Ivankovic, M.; Kandemir, G.; Koskela, J.; Kozioł, C.; et al. Approaches to the Conservation of Forest Genetic Resources in Europe in the Context of Climate Change; European Forest Genetic Resources Programme (EUFORGEN), Bioversity International: Rome, Italy, 2015; p. XIV 3. [Google Scholar]
  24. Fady, B.; Aravanopoulos, F.A.; Alizoti, P.; Mátyás, C.; von Wühlisch, G.; Westergren, M.; Belletti, P.; Cvjetkovic, B.; Ducci, F.; Huber, G.; et al. Evolution-based approach needed for the conservation and silviculture of peripheral forest tree populations. For. Ecol. Manag. 2016, 375, 66–75. [Google Scholar] [CrossRef] [Green Version]
  25. Ducci, F.; Donnelly, K. Forest tree marginal populations in Europe-report on the state of knowledge on forest tree marginal and peripheral populations in Europe. Ann. Silvic. Res. 2017, 41, 1–12. Available online: https://journals-crea.4science.it/index.php/asr (accessed on 13 March 2022).
  26. Mátyás, C.; Berki, I.; Bidló, A.; Csóka, G.; Czimber, K.; Führer, E.; Gálos, B.; Gribovszki, Z.; Illés, G.; Hirka, A.; et al. Sustainability of Forest Cover under Climate Change on the Temperate-Continental Xeric Limits. Forests 2018, 9, 489. [Google Scholar] [CrossRef] [Green Version]
  27. Popescu, R.; Șofletea, N. Spring and autumn phenology in sub-mesothermal beech stands from the southwestern extremity of the Carpathians. Not. Bot. Horti Agrobot. Cluj-Napoca 2020, 48, 1057–1069. [Google Scholar] [CrossRef]
  28. Gapare, W.J.; Aitken, S.N.; Ritland, C.E. Genetic diversity of core and peripheral Sitka spruce (Picea sitchensis (Bong.) Carr) populations: Implications for conservation of widespread species. Biol. Conserv. 2005, 123, 113–123. [Google Scholar] [CrossRef]
  29. Lesica, P.; Allendorf, F.W. When are peripheral populations valuable for conservation? Conserv. Biol. 1995, 9, 753–760. [Google Scholar] [CrossRef]
  30. Nielsen, J.L.; Scott, J.M.; Aycrigg, J.L. Endangered species and peripheral populations: Cause for conservation. Endanger. Species Update 2001, 18, 194–197. [Google Scholar]
  31. Ursenbacher, S.; Guillon, M.; Cubizolle, H.; Dupoué, A.; Blouin-Demers, G.; Lourdais, O. Postglacial recolonization in a cold climate specialist in western Europe: Patterns of genetic diversity in the adder (Vipera berus) support the central–marginal hypothesis. Mol. Ecol. 2015, 24, 3639–3651. [Google Scholar] [CrossRef]
  32. Eckert, C.G.; Samis, K.E.; Lougheed, S.C. Genetic variation across species’ geographical ranges: The central–marginal hypothesis and beyond. Mol. Ecol. 2008, 17, 1170–1188. [Google Scholar] [CrossRef]
  33. Lázaro-Nogal, A.; Matesanz, S.; García-Fernández, A.; Traveset, A.; Valladares, F. Population size, center–periphery, and seed dispersers’ effects on the genetic diversity and population structure of the Mediterranean relict shrub Cneorum tricoccon. Ecol. Evol. 2017, 7, 7231–7242. [Google Scholar] [CrossRef]
  34. Macdonald, S.L.; Llewelyn, J.; Moritz, C.; Phillips, B.L. Peripheral isolates as sources of adaptive diversity under climate change. Front. Ecol. Evol. 2017, 5, 88. [Google Scholar] [CrossRef] [Green Version]
  35. Vucetich, J.A.; Waite, T.A. Spatial patterns of demography and genetic processes across the species’ range: Null hypotheses for landscape conservation genetics. Conserv. Genet. 2003, 4, 639–645. [Google Scholar] [CrossRef]
  36. Hardie, D.C.; Hutchings, J.A. Evolutionary ecology at the extremes of species’ ranges. Environ. Rev. 2010, 18, 1–20. [Google Scholar] [CrossRef] [Green Version]
  37. Eliades, N.G.H.; Papageorgiou, A.C.; Fady, B.; Gailing, O.; Leinemann, L.; Finkeldey, R. An approach to genetic resources conservation of peripheral isolated plant populations: The case of an island narrow endemic species. Biodivers. Conserv. 2019, 28, 3005–3035. [Google Scholar] [CrossRef]
  38. Mátyás, C.; Vendramin, G.G.; Fady, B. Forests at the limit: Evolutionary–genetic consequencesof environmental changes at the receding (xeric) edge of distribution. Report from a research workshop. Ann. For. Sci. 2009, 66, 800. [Google Scholar] [CrossRef]
  39. Mátyás, C. Forecasts needed for retreating forests. Nature 2010, 464, 1271. [Google Scholar] [CrossRef]
  40. Borovics, A.; Mátyás, C. Decline of genetic diversity of sessile oak at the retracting (xeric) limits. Ann. For. Sci. 2013, 70, 835–844. [Google Scholar] [CrossRef] [Green Version]
  41. Ciocîrlan, E.; Sofletea, N.; Ducci, F.; Curtu, A.L. Patterns of genetic diversity in European beech (Fagus sylvatica L.) at the eastern margins of its distribution range. Iforest-Biogeosci. For. 2017, 10, 916. [Google Scholar] [CrossRef] [Green Version]
  42. Liepe, K. Growth-chamber trial on frost hardiness and field trial on flushing of sessile oak (Quercus petraea Liebl). In Annales des Sciences Forestières; EDP Sciences: Les Ulis, France, 1993; Volume 50, pp. 208s–214s. [Google Scholar] [CrossRef]
  43. Deans, J.; Harvey, F. Phenologies of sixteen European provenances of sessile oak growing in Scotland. For. Int. J. For. Res. 1995, 68, 265–274. [Google Scholar] [CrossRef]
  44. Ducousso, A.; Guyon, J.; Kremer, A. Latitudinal and altitudinal variation of bud burst in western populations of sessile oak (Quercus petraea (Matt) Liebl). Ann. Des Sci. For. 1996, 53, 775–782. [Google Scholar] [CrossRef]
  45. Vitasse, Y.; François, C.; Delpierre, N.; Dufrêne, E.; Kremer, A.; Chuine, I.; Delzon, S. Assessing the effects of climate change on the phenology of European temperate trees. Agric. For. Meteorol. 2011, 151, 969–980. [Google Scholar] [CrossRef]
  46. Alberto, F.; Bouffier, L.; Louvet, J.M.; Lamy, J.B.; Delzon, S.; Kremer, A. Adaptive responses for seed and leaf phenology in natural populations of sessile oak along an altitudinal gradient. J. Evol. Biol. 2011, 24, 1442–1454. [Google Scholar] [CrossRef] [PubMed]
  47. Alberto, F.J.; Derory, J.; Boury, C.; Frigerio, J.-M.; Zimmermann, N.E.; Kremer, A. Imprints of natural selection along environmental gradients in phenology-related genes of Quercus petraea. Genetics 2013, 195, 495–512. [Google Scholar] [CrossRef] [PubMed] [Green Version]
  48. Vander Mijnsbrugge, K.; Turcsán, A.; Maes, J.; Duchêne, N.; Meeus, S.; Steppe, K.; Steenackers, M. Repeated summer drought and re-watering during the first growing year of oak (Quercus petraea) delay autumn senescence and bud burst in the following spring. Front. Plant Sci. 2016, 7, 419. [Google Scholar] [CrossRef]
  49. Delpierre, N.; Guillemot, J.; Dufrêne, E.; Cecchini, S.; Nicolas, M. Tree phenological ranks repeat from year to year and correlate with growth in temperate deciduous forests. Agric. For. Meteorol. 2017, 234, 1–10. [Google Scholar] [CrossRef]
  50. Firmat, C.; Delzon, S.; Louvet, J.M.; Parmentier, J.; Kremer, A. Evolutionary dynamics of the leaf phenological cycle in an oak metapopulation along an elevation gradient. J. Evol. Biol. 2017, 30, 2116–2131. [Google Scholar] [CrossRef] [Green Version]
  51. Sáenz-Romero, C.; Lamy, J.B.; Ducousso, A.; Musch, B.; Ehrenmann, F.; Delzon, S.; Cavers, S.; Chałupka, W.; Dağdaş, S.; Hansen, J.K.; et al. Adaptive and plastic responses of Quercus petraea populations to climate across Europe. Glob. Chang. Biol. 2017, 23, 2831–2847. [Google Scholar] [CrossRef] [Green Version]
  52. Denéchère, R.; Delpierre, N.; Apostol, E.N.; Berveiller, D.; Bonne, F.; Cole, E.; Delzon, S.; Dufrêne, E.; Gressler, E.; Jean, F.; et al. The within-population variability of leaf spring and autumn phenology is influenced by temperature in temperate deciduous trees. Int. J. Biometeorol. 2019, 65, 369–379. [Google Scholar] [CrossRef]
  53. Czúcz, B.; Gálhidy, L.; Mátyás, C. Present and forecasted xeric climatic limits of beech and sessile oak distribution at low altitudes in Central Europe. Ann. For. Sci. 2011, 68, 99–108. [Google Scholar] [CrossRef] [Green Version]
  54. NFI (National Forest Inventory). 2019. Available online: http://roifn.ro/site/rezultate-ifn-2/ (accessed on 5 December 2020).
  55. Şofletea, N.; Curtu, L. Dendrologie; Editura Universităţii Transilvania: Brasov, Romania, 2007; pp. 156–164. [Google Scholar]
  56. Paşcovschi, S.; Doniță, N. Vegetaţia Lemnoasă din Silvostepa României; Editura Academiei Republicii Socialiste România: Bucharest, Romania, 1967. [Google Scholar]
  57. Sanda, V.; Barabaş, N.; Ştefănuţ, S. Atlas Florae Romaniae. III- Genul Quercus; Editura “Ion Borcea”: Bacau, Romania, 2004; p. 173. [Google Scholar]
  58. Chesnoiu, E.N.; Șofletea, N.; Curtu, A.L.; Toader, A.; Radu, R.; Enescu, M. Bud burst and flowering phenology in a mixed oak forest from Eastern Romania. Ann. For. Res. 2009, 52, 199–206. [Google Scholar] [CrossRef]
  59. Crăciunesc, I. Evaluation of Natural Hybridization in Native Species of Oaks: A Case Study in Bejan-Deva Natural Reserve. Ph.D. Thesis, Transilvania University of Brasov Degree-Granting University, Brasov, Romania, 2013; p. 175. [Google Scholar]
  60. Ducousso, A.; Bordacs, S. EUFORGEN Technical Guidelines for Genetic Conservation and use for Pedunculate and Sessile Oaks (Quercus robur and Q. petraea); International Plant Genetic Resources Institute: Rome, Italy, 2004; 6 pages, Available online: www.euforgen.org (accessed on 13 March 2022).
  61. Pârnuța, G.; Lorent, A.; Tudoroiu, M.; Petrila, M. Regiuni de Provenienta Pentru Materiale de Baza din Care se Obtin Materiale Forestiere de Reproducere în România; Editura Silvica: Bucharest, Romania, 2010. [Google Scholar]
  62. Pâques, L.E. TREES4FUTURE—Designing Trees for the Future. Alternative Methodologies for Phenology Assessment in Forest Trees. 2016, pp. 4–6. Available online: http://www.trees4future.eu/uploads/t4f-training-activities/Annex%20I%201%20Alternative%20methodologies%20for%20phenology%20assessment%20in%20forest%20trees.pdf (accessed on 13 March 2022).
  63. Bacilieri, R.; Ducousso, A.; Kremer, A. Genetic, morphological, ecological and phenological differentiation between Quercus petraea (Matt.) Liebl. and Quercus robur L. in a mixed stand of northwest of France. Silvae Genet. 1995, 44, 1–9. [Google Scholar]
  64. Preushler, T. Manual on methods and criteria for harmonized sampling, assessment, monitoring and analysis of the effects of air pollution on forest. In Part IX, Phenological Observatio; UNECE: Geneva, Switzerland, 1999. [Google Scholar]
  65. STATISTICA, Version 8.0; StatSoft Inc.: Tulsa, OK, USA, 2007.
  66. Wiersma, J.H. Enkete kwantitatieve aspecten van het exotenvraagstuk. Ned. Bosb. Tijtschrift 1962, 34, 175–184. [Google Scholar]
  67. Tomescu, A. Fazele Periodice de Vegetație la Speciile Forestiere—Sinteza Pentru Perioada 1946–1955; Editura Agro-Silvică de Stat: Bucharest, Romania, 1957; p. 123. [Google Scholar]
  68. Chesnoiu, E.N. Taxonomic Discrimination through Leaf Descriptors and Analysis of Spring Phenology in Pedunculate Oak (Quercus robur L.) and Grayish Oak (Quercus pedunculiflora K. Koch). Ph.D. Thesis, Transilvania University of Brasov Degree-Granting University, Brasov, Romania, 2017. Summary. p. 67. [Google Scholar]
  69. Perot, T.; Balandier, P.; Couteau, C.; Delpierre, N.; Jean, F.; Perret, S.; Korboulewsky, N. Budburst date of Quercus petraea is delayed in mixed stands with Pinus sylvestris. Agric. For. Meteorol. 2021, 300, 108326. [Google Scholar] [CrossRef]
  70. Dantec, C.F.; Vitasse, Y.; Bonhomme, M.; Louvet, J.M.; Kremer, A.; Delzon, S. Chilling and heat requirements for leaf unfolding in European beech and sessile oak populations at the southern limit of their distribution range. Int. J. Biometeorol. 2014, 58, 1853–1864. [Google Scholar] [CrossRef]
  71. de Sauvage, J.C.; Vitasse, Y.; Meier, M.; Delzon, S.; Bigler, C. Temperature rather than individual growing period length determines radial growth of sessile oak in the Pyrenees. Agric. For. Meteorol. 2022, 317, 108885. [Google Scholar] [CrossRef]
  72. Jensen, J.S. Provenance variation in phenotypic traits in Quercus robur and Quercus petraea in Danish provenance trials. Scand. J. For. Res. 2000, 15, 297–308. [Google Scholar] [CrossRef]
  73. Sampaio, T.; Branco, M.; Guichoux, E.; Petit, R.J.; Pereira, J.S.; Varela, M.C.; Almeida, M.H. Does the geography of cork oak origin influence budburst and leaf pest damage? For. Ecol. Manag. 2016, 373, 33–43. [Google Scholar] [CrossRef]
  74. Chmura, D.J.; Rozkowski, R. Variability of beech provenances in spring and autumn phenology. Silvae Genet. 2002, 51, 123–127. [Google Scholar]
  75. Anandhi, A.; Perumal, S.; Gowda, P.H.; Knapp, M.; Hutchinson, S.; Harrington, J.; Murray, L.; Kirkham, M.B.; Rice, C.W. Long-term spatial and temporal trends in frost indices in Kansas, USA. Clim. Change 2013, 120, 169–181. [Google Scholar] [CrossRef] [Green Version]
  76. Vanoni, M.; Bugmann, H.; Nötzli, M.; Bigler, C. Drought and frost contribute to abrupt growth decreases before tree mortality in nine temperate tree species. For. Ecol. Manag. 2016, 382, 51–63. [Google Scholar] [CrossRef] [Green Version]
  77. Gazol, A.; Camarero, J.J.; Colangelo, M.; de Luis, M.; del Castillo, E.M.; Serra-Maluquer, X. Summer drought and spring frost, but not their interaction, constrain European beech and Silver fir growth in their southern distribution limits. Agric. For. Meteorol. 2019, 278, 107695. [Google Scholar] [CrossRef]
  78. Sakai, A.; Larcher, W. Frost Survival of Plants: Responses and Adaptation to Freezing Stress; Springer Science & Business Media: Berlin, Germany, 2012; Volume 62. [Google Scholar]
  79. Schermer, É.; Bel-Venner, M.C.; Gaillard, J.M.; Dray, S.; Boulanger, V.; Le Roncé, I.; Oliver, G.; Chuine, I.; Delzon, S.; Venner, S. Flower phenology as a disruptor of the fruiting dynamics in temperate oak species. N. Phytol. 2020, 225, 1181–1192. [Google Scholar] [CrossRef] [PubMed]
  80. Garca-Mozo, H.; Pablo, J.H.; Carmen, G.; Gomez-casero, M.T.; Dominguez, E. Catkin frost damage in Mediterranean cork-oak (Quercus suber L.). Isr. J. Plant Sci. 2001, 49, 42–47. [Google Scholar] [CrossRef]
  81. Chaar, H.; Colin, F. Impact of late frost on height growth in young sessile oak regenerations. Ann. For. Sci. 1999, 56, 417–429. [Google Scholar] [CrossRef] [Green Version]
  82. Grundström, M.; Adams-Groom, B.; Pashley, C.H.; Dahl, Å.; Rasmussen, K.; de Weger, L.A.; Thibaudon, M.; Fernández-Rodríguez, S.; Silva-Palacios, I.; Skjøth, C.A. Oak pollen seasonality and severity across Europe and modelling the season start using a generalized phenological model. Sci. Total Environ. 2019, 663, 527–536. [Google Scholar] [CrossRef]
  83. Gerst, K.L.; Rossington, N.L.; Mazer, S.J. Phenological responsiveness to climate differs among four species of Quercus in North America. J. Ecol. 2017, 105, 1610–1622. [Google Scholar] [CrossRef] [Green Version]
  84. Tomescu, A. Cercetări Fenologice la Principalele Specii Forestiere Autohtone din RSR-Sinteza Pentru Perioada 1956–1965; Centrul de Documentare Tehnică Pentru Economia Forestieră: Bucharest, Romania, 1967; p. 100. [Google Scholar]
  85. Liu, G.; Chuine, I.; Denéchère, R.; Jean, F.; Dufrêne, E.; Vincent, G.; Berveiller, D.; Delpierre, N. Higher sample sizes and observer inter-calibration are needed for reliable scoring of leaf phenology in trees. J. Ecol. 2021, 109, 2461–2474. [Google Scholar] [CrossRef]
  86. Delpierre, N.; Dufrêne, E.; Soudani, K.; Ulrich, E.; Cecchini, S.; Boé, J.; François, C. Modelling interannual and spatial variability of leaf senescence for three deciduous tree species in France. Agric. For. Meteorol. 2009, 149, 938–948. [Google Scholar] [CrossRef]
  87. Menzel, A.; Fabian, P. Growing season extended in Europe. Nature 1999, 397, 659. [Google Scholar] [CrossRef]
  88. Schaber, J.; Badeck, F.W. Plant phenology in Germany over the 20th century. Reg. Environ. Change 2005, 5, 37–46. [Google Scholar] [CrossRef]
  89. Estrella, N.; Menzel, A. Responses of leaf colouring in four deciduous tree species to climate and weather in Germany. Clim. Res. 2006, 32, 253–267. [Google Scholar] [CrossRef] [Green Version]
  90. Menzel, A.; Sparks, T.H.; Estrella, N.; Koch, E.; Aasa, A.; Ahas, R.; Alm-Kübler, K.; Bissolli, P.; Braslavská, O.; Briede, A.; et al. European phenological response to climate change matches the warming pattern. Glob. Chang. Biol. 2006, 12, 1969–1976. [Google Scholar] [CrossRef]
  91. Menzel, A.; Estrella, N.; Heitland, W.; Susnik, A.; Schleip, C.; Dose, V. Bayesian analysis of the species-specific lengthening of the growing season in two European countries and the influence of an insect pest. Int. J. Biometeorol. 2008, 52, 209–218. [Google Scholar] [CrossRef] [Green Version]
  92. Nölte, A.; Yousefpour, R.; Hanewinkel, M. Changes in sessile oak (Quercus petraea) productivity under climate change by improved leaf phenology in the 3-PG model. Ecol. Model. 2020, 438, 109285. [Google Scholar] [CrossRef]
  93. Thomas, F.M.; Gausling, T. Morphological and physiological responses of oak seedlings (Quercus petraea and Q. robur) to moderate drought. Ann. For. Sci. 2000, 57, 325–333. [Google Scholar] [CrossRef] [Green Version]
  94. Fu, Y.S.; Campioli, M.; Vitasse, Y.; De Boeck, H.J.; Van den Berge, J.; AbdElgawad, H.; Asard, H.; Piao, S.; Deckmyn, G.; Janssens, I.A. Variation in leaf flushing date influences autumnal senescence and next year’s flushing date in two temperate tree species. Proc. Natl. Acad. Sci. USA 2014, 111, 7355–7360. [Google Scholar] [CrossRef] [PubMed] [Green Version]
  95. Morin, X.; Roy, J.; Sonié, L.; Chuine, I. Changes in leaf phenology of three European oak species in response to experimental climate change. N. Phytol. 2010, 186, 900–910. [Google Scholar] [CrossRef] [PubMed]
  96. Vitasse, Y.; Bresson, C.C.; Kremer, A.; Michalet, R.; Delzon, S. Quantifying phenological plasticity to temperature in two temperate tree species. Funct. Ecol. 2010, 24, 1211–1218. [Google Scholar] [CrossRef]
  97. Crabbe, R.A.; Dash, J.; Rodriguez-Galiano, V.F.; Janous, D.; Pavelka, M.; Marek, M.V. Extreme warm temperatures alter forest phenology and productivity in Europe. Sci. Total Environ. 2016, 563, 486–495. [Google Scholar] [CrossRef]
  98. Vitasse, Y.; Porté, A.J.; Kremer, A.; Michalet, R.; Delzon, S. Responses of canopy duration to temperature changes in four temperate tree species: Relative contributions of spring and autumn leaf phenology. Oecologia 2009, 161, 187–198. [Google Scholar] [CrossRef]
  99. Linderholm, H.W. Growing season changes in the last century. Agric. For. Meteorol. 2006, 137, 1–14. [Google Scholar] [CrossRef]
  100. Zhu, W.; Tian, H.; Xu, X.; Pan, Y.; Chen, G.; Lin, W. Extension of the growing season due to delayed autumn over mid and high latitudes in North America during 1982–2006. Glob. Ecol. Biogeogr. 2012, 21, 260–271. [Google Scholar] [CrossRef]
  101. Kolářová, E.; Nekovář, J.; Adamík, P. Long-term temporal changes in central European tree phenology (1946− 2010) confirm the recent extension of growing seasons. Int. J. Biometeorol. 2014, 58, 1739–1748. [Google Scholar] [CrossRef] [PubMed]
  102. Estiarte, M.; Peñuelas, J. Alteration of the phenology of leaf senescence and fall in winter deciduous species by climate change: Effects on nutrient proficiency. Glob. Chang. Biol. 2015, 21, 1005–1017. [Google Scholar] [CrossRef] [Green Version]
  103. Jensen, J.S.; Hansen, J.K. Geographical variation in phenology of Quercus petraea (Matt.) Liebl and Quercus robur L. oak grown in a greenhouse. Scand. J. For. Res. 2008, 23, 179–188. [Google Scholar] [CrossRef]
  104. Gill, A.L.; Gallinat, A.S.; Sanders-DeMott, R.; Rigden, A.J.; Short Gianotti, D.J.; Mantooth, J.A.; Templer, P.H. Changes in autumn senescence in northern hemisphere deciduous trees: A meta-analysis of autumn phenology studies. Ann. Bot. 2015, 116, 875–888. [Google Scholar] [CrossRef] [Green Version]
  105. Vitasse, Y.; Delzon, S.; Bresson, C.C.; Michalet, R.; Kremer, A. Altitudinal differentiation in growth and phenology among populations of temperate-zone tree species growing in a common garden. Can. J. For. Res. 2009, 39, 1259–1269. [Google Scholar] [CrossRef] [Green Version]
  106. Wesołowski, T.; Rowiński, P. Timing of bud burst and tree-leaf development in a multispecies temperate forest. For. Ecol. Manag. 2006, 237, 387–393. [Google Scholar] [CrossRef]
  107. Cole, E.F.; Sheldon, B.C. The shifting phenological landscape: Within-and between-species variation in leaf emergence in a mixed-deciduous woodland. Ecol. Evol. 2017, 7, 1135–1147. [Google Scholar] [CrossRef]
  108. Franjic, J.; Sever, K.; Bogdan, S.; Skvorc, Z.; Krstonosic, D.; Aleskovic, I. Phenological asynchronization as a restrictive factor of efficient pollination in clonal seed orchads of Pedunculate Oak (Quercus robur L.)/Fenoloska neujednacenost kao ogranicavajuci cimbenik uspjesnoga oprasivanja u klonskim sjemenskim plantazama hrasta luznjaka (Quercus robur L.). Croat. J. For. Eng. 2011, 32, 141–157. [Google Scholar]
  109. Diggle, P.K.; Mulder, C.P. Diverse developmental responses to warming temperatures underlie changes in flowering phenologies. Integr. Comp. Biol. 2019, 59, 559–570. [Google Scholar] [CrossRef] [PubMed]
  110. Marchand, L.J.; Dox, I.; Gričar, J.; Prislan, P.; Leys, S.; Van den Bulcke, J.; Fronti, P.; Lange, H.; Matthysen, E.; Peñuelas, J.; et al. Inter-individual variability in spring phenology of temperate deciduous trees depends on species, tree size and previous year autumn phenology. Agric. For. Meteorol. 2020, 290, 108031. [Google Scholar] [CrossRef] [PubMed]
  111. Keenan, T.F.; Richardson, A.D. The timing of autumn senescence is affected by the timing of spring phenology: Implications for predictive models. Glob. Chang. Biol. 2015, 21, 2634–2641. [Google Scholar] [CrossRef] [PubMed] [Green Version]
Figure 1. The natural range of sessile oak [60] (left), the location of the research area, and the geographic location of the origins according to the ecological subregions (A1 Eastern Carpathians–Weastern range, A2 Eastern Carpathians–Eastern range, A3 Eastern Carpathians: Giurgiu-Ciuc Depression, B1 Curved Carpathians–Brasov Depression, B2 Curved Carpathians-Exterior range, C1 Meridional Carpathians–Northern range, C2 Meridional Carpathians–Southern range, D1 Banat Mountains: Mehedinti-Cerna-Semeniuc, D2 Banat Mountains: Tarcu-Poiana Rusca, E1 Apuseni Mountains-Zarand and Metaliferi Mountains, E2 Western Apuseni Mountains, E3 Eastern Apuseni Mountains, F1 Transylvania Plain, F2 Transylvania Tableland, G1 Suceava Tableland and Siret and Iasi Hills, G2 Jijia Plain, G3 Barlad Tableland and Bacau Hills, H1 Covurlui Tableland, H2 Siret and Baragan Plains, H3 Danube Ponds, I1 Danube Delta, I2 Dobrogea Tableland, J1 Bucharest Plain, J2 Oltenia Plain, K1 Timis and Arad Plains, K2 Crisurile, Carei and Somes Plains) (right).
Forests 13 01125 g001
Figure 2. Boxplot diagram of sessile oak budburst phenophase in the studied populations. The bottoms and tops of boxes denote the 25 and 75% quartiles; the bold lines denote the median. The whiskers represent the minimum and the maximum DOY values. The green crosses indicate the mean value across all trees in each population.
Forests 13 01125 g002
Figure 3. Boxplot diagram of sessile oak senescence phenophase in the studied populations. The bottoms and tops of boxes denote the 25 and 75% quartiles; the bold lines denote the median. The whiskers represent the minimum and the maximum DOY values. The green crosses indicate the mean value across all trees in each population.
Forests 13 01125 g003
Table 1. Geographic location, sample size, and climate conditions of the sampled sessile oak populations.
LabelPopulationNo. of TreesTrees CharacteristicsGeographical PositionClimatic Conditions
DBH
(cm)
Height
(m)
AgeLatitude
(N)
Longitude (E)Altitude (m)Annual Average Temperature (°C)Annual Rainfall (mm)
FUNFundeanu3430.316.68845°58′27° 41’2109.6470
OLTOltenesti5027.619.97346°34′27° 53’3059.2530
SATSatu Nou5059.625.310746°58′27° 49’3009.2535
HELHeltiu4334.525.09046°14′26° 55’4908.9544
FAN *Fantanele5018.216.13446°39′26° 43’2609.6590
* Sessile oak comparative trial.
Table 2. Location and geographical coordinates of the tested provenances in the FAN comparative trial.
ProvenanceEcological Subregion of ProvenanceProvenance Location
Code *NameForest District
Production Unit
Amenajistic Unit
Latitude
(N)
Longitude (E)Altitude
(m)
2G150Suceava Tableland and Siret and Iasi hillsDolhasca
V Dolhasca
20 A
47°07′26°37′325
6G350Barlad Tableland and Bacau hillsSascut
IV Gaiceana
52A
46°10′27°05′300
11C250Outer Southern CarpathiansBabeni
III Sirineasa
10 A, 26 B
44°55′24°14′290
14B250Outer Curvature CarpathiansValeni
III Slanic
45 A
45°23′23°03′490
15E250Western Apuseni MountainsBeius
VII Cerbu
201 C,202 B
46°40′22°22′300
16D250Banat Mountains: Tarcu Poiana RuscaiFaget
V Vladeana
90 B, 91 B
45°45′22°05′410
24G26CJijia PlainBotosani
IV Poienita-Turbuleni
46 B
47°45′26°40′130
28F250Transylvania TablelandBlaj
II Valea Lunga
19 G
46°12′23°54′420
31F150Transylvania PlainLechinta
V Matei
16
47°02′24°20′425
32E350Eastern Apuseni MountainsCluj
IX Mara
38
46°45′23°34′600
* Subregions of provenance established in Romania [61].
Table 3. Characteristic values of budburst and leaf development phenophases date observed for sessile oak in the analysed populations and FAN comparative trial for the period 2017–2020.
PopulationBudburst (DOY)—Stage ILeaf Development (DOY)—Stage IIIBB-LD Dynamic
MinMaxMean ± SERangeSD MinMaxMean ± SERangeSDNo. of DaysAverage T (°C)∑ T (°C)
Peripheral populations
FUN8810496 ± 0.38164.4101114109 ± 0.27133.213.211.1230.4
OLT9010798 ± 0.27173.7104120111 ± 0.26163.813.210.9217.8
SAT9010498 ± 0.23143.1106120112 ± 0.26143.514.010.5217.1
Mean of peripheral populations8910598 ± 0.16163.7104118111 ± 0.16143.513.510.8221.8
Reference population
HEL97106101 ± 0.2092.4106120116 ± 0.25143.315.410.4214.5
Comparative trial
FAN95112103 ± 0.32174.6109124117 ± 0.29153.915.410.4236.9
SD—standard deviation; ΣT (°C)—sum of average daily temperatures.
Table 4. Average daily temperature summed from 1 January to budburst (A) and from LS in the previous year until BB in the current year (B).
PopulationFUNOLTSATHELFAN
∑ T (°C) ± SD
(A) 1 January-BB DOY191.5 ± 5.5188.0 ± 5.6173.0 ± 5.6195.1 ± 5.5203.8 ± 5.6
(B) LS DOY-BB DOY438.4 ± 5.0445.3 ± 5.3447.0 ± 5.1500.2 ± 4.7500.8 ± 5.0
SD—standard deviation; ΣT (°C)—sum of average daily temperatures.
Table 5. Spearman’s rank correlation coefficients and their significance levels between phenophases and the geographical gradients of the origins.
PhenophaseYear of ObservationAltitude
(m)
Latitude
(N)
Ecophysiological LatitudeLongitude
(E)
Budburst20170.310 *−0.1040.251−0.379 *
0.0120.4810.0790.022
20180.322 *−0.2540.179−0.322 *
0.0220.0750.2130.020
20190.300 *−0.0490.210−0.493 ***
0.0340.7360.142<0.001
20200.386 **−0.2390.253−0.581 ***
0.0060.0950.077<0.001
Flowering20170.2760.0270.223−0.334 *
0.0670.8600.1410.025
20180.204−0.463 ***0.046−0.419 **
0.155<0.0010.7510.002
20190.283 *−0.304 *0.183−0.574 ***
0.0460.0320.234<0.001
20200.132−0.349 *−0.038−0.322 *
0.3630.0130.7950.022
Senescence2017−0.391 **−0.256−0.457 **0.331 *
0.0050.0730.0010.019
2018−0.034−0.260−0.2620.262
0.8140.0680.0540.066
2019−0.184−0.277−0.2430.089
0.2020.0510.0900.538
* p < 0.05; ** p < 0.01; *** p < 0.001.
Table 6. Representative flowering phenophase dates for sessile oak observed in the studied populations and the FAN comparative trial.
PopulationFlowering (DOY)Temperature °C
MinMaxMean ± SERangeSDAverage∑T > 5 °CNo. of Days a
Peripheral populations
FUN101114109 ± 0.31133.712.480.07.0
OLT104117110 ± 0.22133.111.896.68.3
SAT106120111 ± 0.23143.411.494.38,5
Mean of peripheral populations104117110 ± 0.15133.411.990.37.9
Reference population
HEL106120113 ± 0.28143.111.190.58.0
Comparative trial
FAN109124117 ± 0.24153.410.1107.99.5
a The difference between DOY BB and DOY flowering; SD—standard deviation; ΣT (°C)—sum of average daily temperatures.
Table 7. Representative values of leaves senescence and bioactive season date observed for sessile oak in the studied populations and the FAN comparative trial.
PopulationSS (DOY)Bioactive SeasonSD
MinMaxMean ± SERangeNo. of Days aClimate Conditions
Average T (°C)∑ T (°C)
Peripheral populations
FUN287313301 ± 0.652622517.83806.76.5
OLT287310297 ± 0.402322017.53576.34.9
SAT287310296 ± 0.482322017.43500.45.8
Mean of peripheral populations287311298 ± 0.292422217.63627.85.7
Reference population
HEL281307282 ± 0.662621017.13271.27.5
Comparative trial
FAN281307293 ± 0.472621217.23347.15.7
a The difference between DOY BB and DOY leaves senescence; ΣT (°C)—sum of average daily temperatures; SD—standard deviation.
Table 8. Spring and autumn phenophase correlations based on the phenological records.
PhenophasePopulationYears of Observation
2017–20182018–20192019–20202017–20192017–20202018–2020
rsprsprsprsprsprsp
BBFUN0.347 *0.0440.343 *0.0470.440 **0.0090.433 *0.0110.656 ***<0.0010.402 *0.018
OLT0.585 ***<0.0010.304 *0.0430.471 ***<0.0010.487 *0.0140.487 ***<0.0010.416 **0.002
SAT0.417 **0.0030.397 **0.0050.340 *0.0180.586 ***<0.0010.348 *0.0150.596 ***<0.001
HEL0.474 **0.0020.321 *0.0380.375 *0.0150.341 *0.0270.495 ***<0.0010.310 *0.045
FAN0.533 ***<0.0010.370 **0.0080.438 **0.0010.301 *0.0330.479 ***<0.0010.448 **0.001
LDFUN0.063>0.050.165>0.050.403 *0.0180.2520.1500.450 **0.0080.165>0.05
OLT0.175>0.050.149>0.050.237>0.050.214>0.050.197>0.050.063>0.05
SAT0.355 *0.0130.580 ***<0.0010.394 **0.0060.329 *0.0220.173>0.050.361 *0.012
HEL0.235>0.050.174>0.050.305 *0.0490.400 **0.0090.375 *0.0140.225>0.05
FAN0.442 **0.0010.347 *0.0130.308 *0.0300.354 *0.0120.273>0.050.399 **0.004
FLFUN0.358 *0.0370.340 *0.0490.539 **0.0010.523 **0.0010.527 **0.0010.361 *0.036
OLT0.372 *0.0120.428 **0.0020.395 **0.0050.320 *0.0340.375 *0.0120.417 **0.003
SAT0.353 *0.0350.331 *0.0220.389 **0.0060.347 *0.0380.372 *0.0260.421 **0.003
HEL0.417 *0.0480.488 **0.0010.405 **0.0080.425 *0.0430.401>0.050.479 **0.001
FAN0.317 *0.0340.560 ***<0.0010.388 **0.0050.314 *0.0360.300 *0.0450.327 *0.020
SSFUN0.110>0.050.171>0.05--0.266>0.05----
OLT0.282 *0.0470.170>0.05--0.180>0.05----
SAT0.396 **0.0050.208>0.05--0.172>0.05----
HEL0.448 **0.0030.015>0.05--0.091>0.05----
FAN0.632 ***<0.0010.412 **0.003--0.562 ***<0.001----
rs—Spearman rank coefficient; * p < 0.05, ** p < 0.01, *** p < 0.001.
Table 9. Correlations between phenophases based on the recorded phenological years.
PhenophasePopulationYears of Observation
2017201820192020
rsprsprsprsp
BB-LDFUN0.605 ***<0.0010.551 **<0.0010.348 *0.0440.740 ***<0.001
OLT0.363 **0.0090.293 *0.0390.327 *0.0200.488 ***<0.001
SAT0.292 *0.0440.371 **0.0090.333 *0.0210.427 **0.002
HEL0.319 *0.0390.361 *0.0190.376 *0.0140.332 *0.031
FAN0.066 **0.0080.557 ***<0.0010.463 ***<0.0010.567 ***<0.001
BB-FLFUN0.562 **0.0010.348 *0.0440.618 ***<0.0010.648 ***<0.001
OLT0.344 *0.0220.403 **0.0040.723 ***<0.0010.702 ***<0.001
SAT0.328 *0.0440.291 *0.0450.399 **0.0050.336 *0.020
HEL0.423 *0.0450.329 *0.0330.327 *0.0340.485 **0.001
FAN0.441 **0.0020.503 ***<0.0010.446 **0.0010.743 ***<0.001
BB-SSFUN0.528 **0.0010.188>0.050.231>0.05--
OLT0.282 *0.0470.180>0.050.1700.238--
SAT0.130>0.050.224>0.050.319 *0.027--
HEL0.001>0.050.380 *0.0130.243>0.05--
FAN−0.220>0.05−0.078>0.05−0.187>0.05--
rs—Spearman rank coefficient; * p < 0.05, ** p < 0.01, *** p < 0.001.
Table 10. Correlations between budburst and previous year senescence based on the recorded phenological years.
PhenophasePopulationYears of Observation
2017–20182018–20192019–2020
rsprsprsp
Previous year SS-BBFUN0.256>0.050.202>0.050.32>0.05
OLT0.045>0.050.079>0.050.114>0.05
SAT0.238>0.050.319 *0.0270.017>0.05
HEL0.009>0.050.414 **0.0060.069>0.05
FAN−0.085>0.05−0.229>0.05−0.239>0.05
rs—Spearman rank coefficient; * p < 0.05, ** p < 0.01
Publisher’s Note: MDPI stays neutral with regard to jurisdictional claims in published maps and institutional affiliations.

