1. Introduction
The
Pinus genus was introduced into Brazil in 1948 by the State of
São Paulo Forest Service and has been widely planted with significant expansion in the 1960s [
1]. Currently,
Pinus plantations represent ~20% of total planted forest area in Brazil, primarily concentrated in the states of
Paraná (721.6 th ha) and
Santa Catarina (542.4 th ha) [
2].
Over time, areas with primary and secondary native vegetation were converted to commercial-forest stands. During forest expansion, the concepts of no-tillage and minimum tillage were not practiced; thus, classic silviculture residue practices [
3] used chains to removed native vegetation [
4] and accumulated residue pilings were spaced ~40 to 60 m apart [
5]. After accumulation, residue converts to necromass, which is composed of different portions of dead vegetation at various stages of decomposition [
6]. In most cases, pilings were burned to facilitate seedling establishment [
7]. However, burning was not always practiced due to environmental restrictions (Law 4.771/65, old Brazilian Forest Code).
In the absence of burning, decomposition of woody material is generally a slow process [
8,
9]. The sequence of decompositional processes varies over time due to changes in physical climate and the chemical and physical makeup of wood over the decay cycle [
6]. In addition to a constant input of energy and nutrients, this slow decomposition process can impact organic matter addition, habitat for decomposing organisms, water retention during drought periods, and establishment of ecosystem nutrients pools [
10]. Several studies have evaluated median- to long-term residual effects of nutrients added as industrial residue by-products or fertilizer to agroforestry systems, especially in regards to nutrient cycling [
11,
12,
13,
14].
Nutrients added to soil from the decay of residue pilings depend on nutrient concentrations and biomass amounts. Tropical and subtropical forests can have more than 200 t ha
−1 of biomass consisting of timber, branches, bark, and foliage [
15] and can accumulate large amounts of N, Ca, K, Mg, P, and other nutrients aboveground. Nutrients added by deforestation can be estimated from amounts found in standing biomass; this can be substantial for some nutrients. A subtropical forest in southern Brazil with 232 t ha
−1 of biomass had 1626, 1620, 1364, 224, 115, and 103 kg ha
−1 of K, N, Ca, Mg, S, and P, respectively [
16]. Similar results were reported by others, where 210 t ha
−1 of biomass contained 1929, 1515, 926, 386, 275, and 80 kg ha
−1 for Ca, N, K, Mg, S, and P, respectively [
17]. Clearly, quantities can vary across sites. When pilings are burned, nutrient amounts can differ due to losses via volatilization or fly ash powder [
18,
19]; residue type/quantity and environmental conditions can influence nutrient-loss variability. Loss of N and S can be high, with some authors reporting most N and S being lost [
20,
21], while others reported ~50% lost [
22]. However, losses of P, Ca, and K are generally less than 40% [
20,
21,
22].
Destruction of organic structures by burning can accelerate the release of nutrients remaining in ash [
7], while unburned residue pilings can result in the very slow release of some nutrients, especially nutrients contained in timber. Although residue burning has been reported to decrease soil acidity [
8,
23] and increase the availability of some nutrients (Ca, K, Mg, sulfate, and nitrate) [
8], soil organic matter levels have exhibited no change [
23] or increases [
8]. Effects of forest slash pilings on nutrient deposition and tree growth were reported by [
24] for a 22-month-old
Eucalyptus dunnii forest in southern Brazil. These authors reported 7.2 and 4.1 m tree heights inside and outside piling areas, respectively. In addition, they found higher foliar N and P and higher soil P and K inside piling areas.
While weeds can also benefit from addition of nutrients to forest systems [
25,
26], the response can differ among herbaceous and shrub weeds [
26]. In one year of a three-year evaluation, [
27] found an influence of fertilization on total vegetation soil coverage, but no differences among vegetation groups (i.e., graminoids, forbs, ferns, woody plants, and woody vines). There are reports that fertilization and weed control has an additive effect on
Pinus growth in North America [
28,
29,
30]. However, no additive effect was found in Argentina, where only weed control enhanced
P. taeda yield [
31]. Others found that weed control during initial growth stages of
Pinus greatly enhanced seedling height (59%) and diameter (103%) [
32,
33]. Lack of weed control prior to planting resulted in a ~60% reduction in
P. taeda biomass accumulation during the first year [
32]. Another observation showed that weed control conducted over three periods resulted in significant differences in
Pinus growth; the average height difference (relative to the control) was 16% or 0.88 m [
34]. Others have reported that increased weed growth with fertilizer application resulted in increased mortality of pine seedlings [
26].
Studies that have evaluated the long-term effects of necromass accumulation on the soil properties, growth, and nutrition of P. taeda and interaction with weeds are sparse. We hypothesized that the great variability in tree growth observed by satellite imagery was an artifact of piling residue without burning, which resulted in enhanced soil properties and tree growth. This information can be of great importance to foresters seeking to adopt management practices that increase soil nutrition, reduce negative environmental effects, and guarantee forest productivity and sustainability. Thus, the aim of this study was to survey the long-term effects (after 30 years) on soil chemical properties and growth and nutrition of Pinus taeda and weeds by piling secondary-forest residues.
2. Materials and Methods
2.1. General Caracterization
The study site was located in the
Rio Negrinho municipality of
Santa Catarina, Brazil; this was a commercial-forest area managed by the pulp industry (
Companhia Volta Grande Papel). The region was Cfb (Köppen classification) and had a humid temperate climate with summer temperatures around 16.5 °C and uniformly distributed annual precipitation of 1600 mm [
35]. This plateau region was located at geographic coordinates of 26.499984 S and 49.541919 W (area center) with altitudes of 950 to 980 m. Shale is the parent material for the study sites soil that displayed strong acidic reactions, low base sums and saturation, and high levels of organic carbon and Al, which are reflective of a humid, cold climate that favors intense leaching of soils [
36].
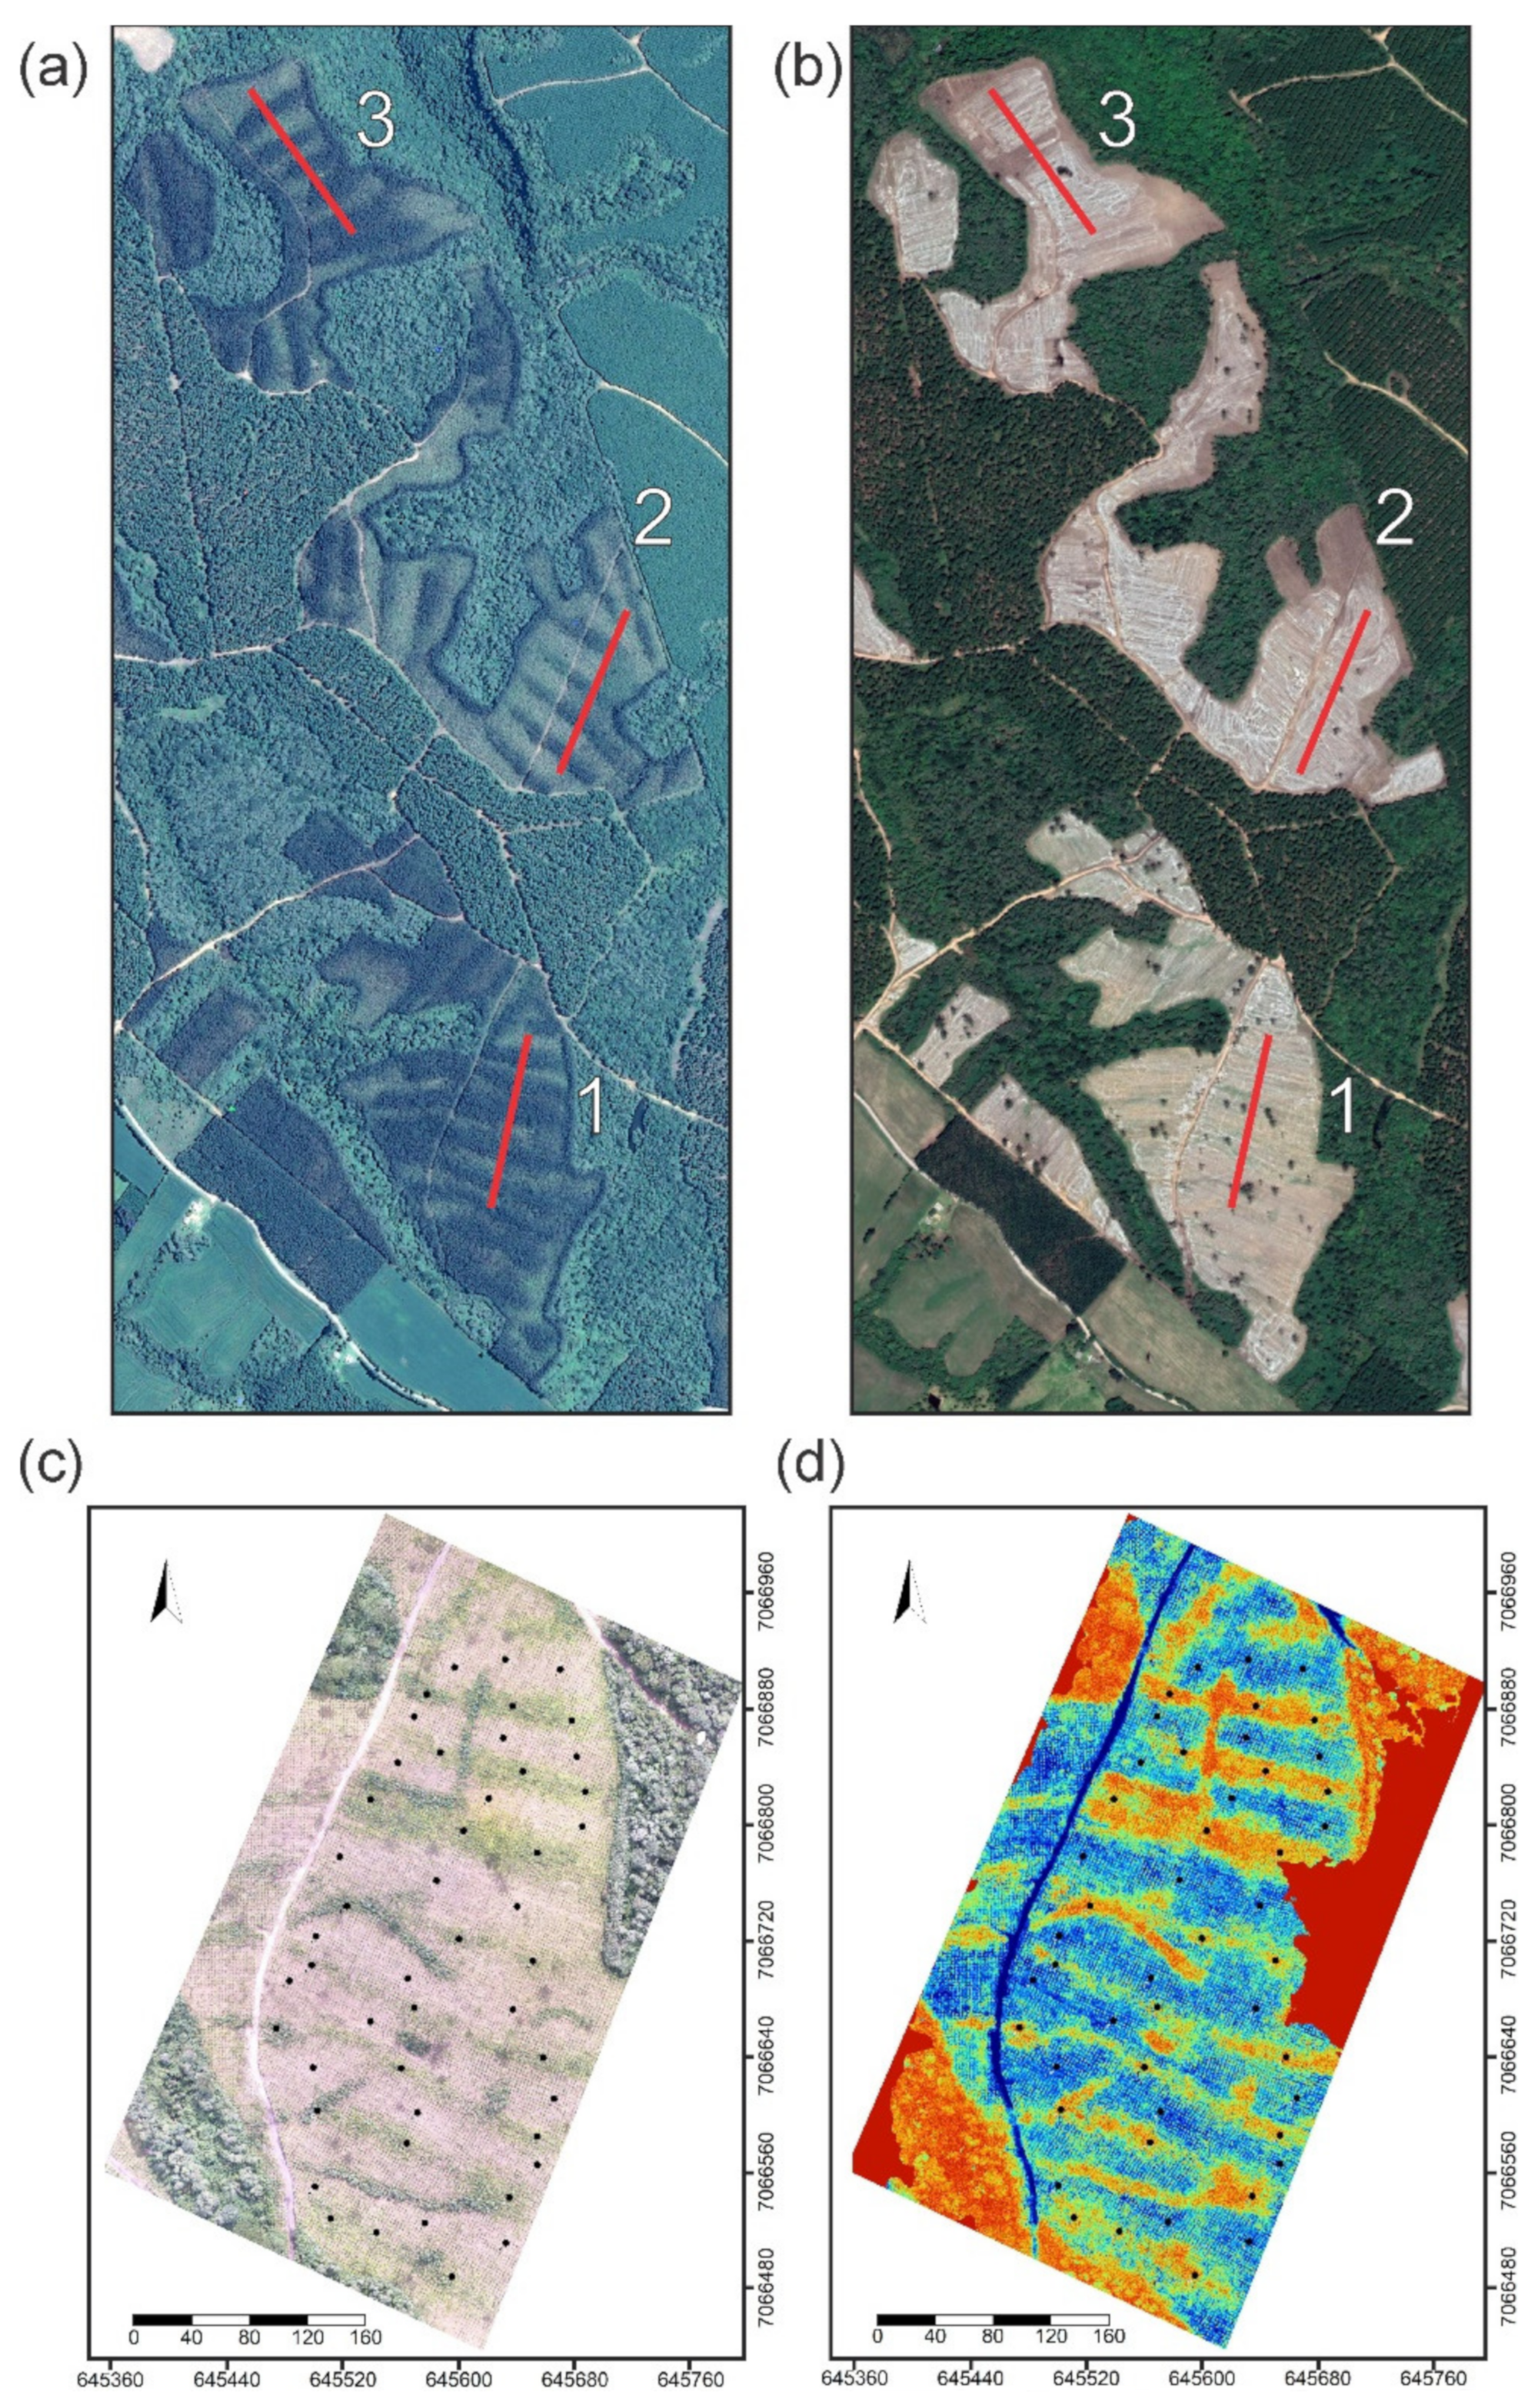
Three sites identified by the commercial-forest company were used for this study (
Figure 1a). These sites historically displayed large spatial variability in tree growth as result of initial piling management. These sites were initially managed by piling secondary-forest residues (without burning) prior to commercial-forest planting. The first commercial planting used
P. taeda (22-year cycle, with two thinnings at 7 and 14 years, without fertilization and liming; space 2.5 m × 2.5 m spaces). Then,
Eucalyptus (7-year cycle) was planted (3.0 × 2.5 m) for biomass production and received only fertilizer, receiving 30, 120, and 45 kg/ha of N, P
2O
5, and K
2O at planting and 16 and 48 kg/ha of N and K
2O kg/ha of sidedressing, respectively. Due to very low eucalyptus yields, the areas were replanted with
P. taeda on 2.5 by 2.5 m spacings. Study samplings were conducted when trees were 2 years old. The three study sites also received a broadcast rate of 20 Mg ha
−1 of paper residue in 2016 (
Figure 1b) and had the following chemical properties: pH—8.6; C—238 g/kg; N—0.3 g/kg; S—0.4 g/kg; Ca—150 g/kg; P—2.3 g/kg; Mg—1.7 g/kg; K—0.14 g/kg; Fe—2480 mg/kg; Zn—265 mg/kg; Mn—44.3 mg/kg; and Cu—49 mg/kg. Approximately 31 years had passed since initial forest clearing, before areas were assessed for long-term impacts of residue piling.
Google Earth satellite images of the three sites were used to check for variation in tree growth. Historic images of the previous eucalyptus forest identified the occurrence pale green and dark green strips; residual effects of residue piling were associated with the dark green areas (
Figure 1a).
2.2. Experimental Design
The experimental design was an adaptation of the Linear Intercept Sampling (LIS) method developed by Candfield in 1941 [
37] that is based on measuring plants intercepting horizontal transects [
38]. The length and width of transects are adjustable according to research interests [
39]. This method is typically used in biodiversity and ecology work focused on studying plant communities and structures. This method is particularly useful for assessing transition gradients between communities [
39]. Although our work does not focus on biodiversity or ecology, the existence of gradients (soil and plant cover) supports the use of this method as being appropriate to the research. Three transect lines measuring 300 m length intersected 5 residue piling lines (
Figure 1a,b). Transects were initiated from the base of a line of trees; starting points were randomly selected and tree height measurements and soil samples (two depths) were systematically sampled every 7.5 m (
Figure 1c). Samples were collected regardless of whether or not the collection point fell in the residue-piling area.
2.3. Plant Data Collection
Transect lines were established in order to collect soil and tree parameters (height and foliar tissue samples) outside (OP) or inside (IP) the influence of piling in each area of study. Transects were composed of three 300 m lines that transposed five piling areas and five outside areas. Lines crossing the transects were systematically established every 7.5 m along a 300 m transect; this resulted in 41 crossing lines with each having five associated trees (
Figure 1a,b). At each of the 41 crossing lines, heights of individual pines were measured using a stretch ruler (total of 205 trees measurements). Mean height was calculated using heights of the five trees at each crossing line. At the time of tree height determination, 4 branches were collected from the upper third of each tree canopy to form one sample composited of 20 branches (5 trees × 4 branches per tree) per crossing line. Needles were sampled from branches based on methods of [
40], where newly mature needles were collected (usually the penultimate needle flush of the last 12 months). After collection, needle samples were dried (60 °C) for ~7 days and 100 needles from each sample were weighed on a precision scale.
It is important to note that a satellite image was used as guide to establish transects and piling-area locations. Soil properties and the abundance of weeds and residue were used to indicate if the crossing line stayed in the piling area or outside the piling area. Each of the 41 crossing lines were classified as outside (OP) or inside (IP) the piling areas according to its position relative to piling areas. This sampling methodology resulted in unbalanced data for soil and tree parameters (OP n = 81; IP n = 42).
Using the 300 m transect from previously tree and soil sampling, one month after collecting pine height and branches, weeds samples were collected. Weeds were separated into two categories: herbaceous plants, considering all flexible stem species; and shrub weeds, represented by “wild tobacco” (Solanum mauritianum Scop.), since it was by far the most abundant shrub weed in study site. In meadow areas (OP and IP), 56 m2 sample areas were demarcated for weed collection; five OP and five IP samples areas were in each site.
To assess herbaceous weeds, a 0.5 × 0.5 m template was randomly placed inside the demarcated 56 m2 sample areas, and all herbaceous plants within the template were collected, by cutting ~5 cm above the soil surface, and placed into plastic bags. This procedure was repeated four times per sample area, for a total of 40 herbaceous weed samples (5 OP × 4 samples and 5 IP × 4 samples). After herbaceous sampling, the number of “wild tobacco” plants inside the 56 m2 area was counted, and 4 representative plants were cut 5 cm above the soil surface and placed in separated plastic bags for a total of 40 shrub weed samples (5 OP × 4 samples and 5 IP × 4 samples). Harvested plants were stored in plastic bags for transport back to the laboratory. Wild tobacco was separated into leaves and stems for green-weight measurements. All samples were transfer to paper bags and dried in a forced-air-circulation oven (65 °C) for one week. Dried materials were weighed to obtain total dry mass. The total number of samples for OP and IP were the same (balanced).
Dry needles, herbaceous weeds, and wild tobacco leaves were ground in a Wiley mill. Ground plant tissues were ashed (500 °C) and solubilized by HCl, prior to determination of P, K, Ca, Mg, Cu, Fe, Mn, and Zn by an Optical Emission Spectrophotometer equipped with Plasma Induction (ICP-OES) (Varian, 720-ES—Mulgrave, Victoria, Australia).
2.4. Soil Sample Collection
Along each transect (as describe above), five soil samples (0–20-cm and 20–40-cm depths) associated with the five trees measured for height were collected using a standard soil probe and mixed, totaling 82 soil samples for site (41 crossing line × 2 depths). After collection, soil samples were dried (40 °C) for ~4 days. Afterwards, soil was ground to pass a 2 mm sieve and analyzed for pH in 0.01 M CaCl2 (1:2.5 soil:solution), Al, Ca, Mg, K, P, Zn, Mn, Fe, Cu, and C; 1 M KCl was used for extraction of Al, Ca, and Mg; and Mehlich I (0.05 M HCl and 0.0125 M H2SO4) was used for K, P, and micronutrients. Total C and N were determined using a Perkin-Elmer CHNS/OPEZ 400 series Elemental Analyzer. Based on granulometry testing, soil from the sites was classified as clay loam with 385 and 400 g kg−1 of clay and 380 and 370 g kg−1 of silt for the 0–20- and 20–40-cm depths, respectively.
2.5. NDVI Collection
Drone images were obtained to evaluate the piling effect at the three selected sites. After image acquisition, the Normalized Difference Vegetation Index (NDVI) was determined for OP and IP areas (
Figure 1). The drone was a Phantom 4 (DJI) quad-copter (four-propeller) equipped with a 4K-resolution camera that captured high spatial-resolution images. Flight settings (sensors, camera, GPS, etc.) were defined in the DJI app. For the present study, autonomous flight was performed (i.e., previously programmed flight plan) using the Drone Deploy application. The flight occurred on 1 April 2018 under favorable weather conditions (no rain, with wind speeds less than 20 km h
−1). Flight preparation was previously performed using the Drone Deploy application and a delimited polygon around the study area. Within the application, flight height (120 m) and lateral (60%) and longitudinal (90%) overlap between images were selected to produce an image with a spatial resolution of ~4 cm.
The Mapir Survey 3 camera coupled to the drone captured infrared wavelengths. Field targets with known coordinates were used for image adjustment. After image acquisition and adjustment, NDVI was calculated from red (R) and infrared (IR) bands, according to the following equation:
2.6. Data Analysis
Soil and plant data associated with OP and IP areas were compared using the t-test. Each of the three evaluated sites was tested individually. Statistical analyses were performed using R software version 4.2.0 (Vienna, Austria).


 ,
, 
