Article

Comparison of Different Methods to Estimate Canopy Water Storage Capacity of Two Shrubs in the Semi-Arid Loess Plateau of China

School of Water Conservancy Science & Engineering, Zhengzhou University, Zhengzhou 450001, China
*
Author to whom correspondence should be addressed.
Forests 2022, 13(8), 1187; https://doi.org/10.3390/f13081187
Submission received: 8 June 2022 / Revised: 20 July 2022 / Accepted: 25 July 2022 / Published: 26 July 2022
(This article belongs to the Section Forest Hydrology)

Abstract

:
The canopy water storage capacity of vegetation has great significance for the hydrological cycle. We used the Pereira regression analysis method, scale-up method, and simulated rainfall method to determine canopy water storage capacity from 2014 to 2018. The Pereira regression analysis was affected mainly by the seasonal variation in the leaf area index and the observation method of throughfall. The canopy water storage capacity was 0.68 mm and 0.72 mm for C. korshinskii and H. rhamnoides, respectively. The canopy water storage capacity of C. korshinskii and H. rhamnoides was 0.73 mm and 0.76 mm, respectively, using the scale-up method. The scale-up method showed that water storage capacity per area of the canopy components was in the order of branches (0.31 mm) > leaves (0.27 mm) > trunks (0.15 mm) for C. korshinskii, and trunks (0.33 mm) > branches (0.29 mm) > leaves (0.14 mm) for H. rhamnoides. We used eight simulated rainfall intensities to determine the canopy water storage capacity for C. korshinskii and H. rhamnoides, which was 0.63 mm and 0.59 mm, respectively.

1. Introduction

The vegetation canopy is the primary layer between forest ecosystems and the environment, which affects ecological hydrological processes in forest ecosystems. Rainfall is separated into three components after it passes through the canopy: throughfall, stemflow, and canopy interception [1]. Canopy interception not only changes the spatial distribution pattern of rainfall and affects the water input and output of the basin but also changes the energy characteristics of rainfall. It significantly influences the formation and development of runoff and is an important ecological hydrological function of forest ecosystems [2]. The amount of water a canopy can store, or the canopy interception, is the main component of the water balance in an ecosystem. It marks not only the starting point of water redistribution in an ecosystem but also the beginning of the water cycle. It is essential to understand how to evaluate the amount of precipitation reaching the ground and how vegetation intercepts, stores, and evaporates this precipitation, which plays an essential role in the ecosystem. The capacity of the canopy to store water is an important aspect in managing canopy interception and vegetation eco-hydrology processes [3].
Different researchers have different definitions of canopy water storage capacity. The most widely used are Horton’s definition (the maximum canopy adsorption is represented by the thickness of the water layer on the projected canopy area) [4] and Rutter’s definition (the maximum canopy water storage capacity means the minimum rainfall interception when the canopy reaches saturation) [5]. The canopy interception and canopy water storage capacity are mainly influenced by rainfall features (rainfall intensity, duration, raindrop size distribution, direction and angle, etc.), the canopy structure (leaf area index, leaf dip angle, leaf azimuth angle, branch angle and arrangement orientation, etc.), and weather conditions.
Many researchers have studied this issue using both direct and indirect methods. Direct methods, such as the simulated rainfall method, require special complex equipment and are expensive and difficult to use widely. However, simulated rainfall methods do have high precision [6,7]. Measuring the canopy water storage capacity by indirect methods is cheaper and easier, but takes longer. In general, indirect methods ignore the influence of the canopy structure, morphological characteristics, and natural precipitation. For example, the scale-up method first measures the water storage capacity of different components per unit area of the canopy and then calculates the quadrat-scale water storage capacity according to the measured data [3,8]. The Pereira regression analysis method considers the effect of the evaporation rate on the maximum canopy water storage capacity of the canopy during canopy interception. The maximum water storage capacity of the forest canopy can be calculated based on the linear relationship between canopy-penetrating rainfall and precipitation outside the forest, and the mean evaporation and mean rainfall intensity after canopy saturation [9,10].
Studies on canopy water storage capacity have focused primarily on tree species in wetlands and tropical rainforest areas. For tree crowns, the scale-up method is a common method for the measurement of canopy water storage capacity. This method firstly measures the water storage capacity per unit leaf (branch and trunk) area and then calculates the water storage capacity of the quadrat-scale forest canopy based on the measured storage capacity per unit area [11]. Shrub interception losses in arid and semi-arid regions with little rainfall may play a more significant role in their ecosystems because they are water-limited, but their water storage capacity has rarely been reported [12]. Syahida and Azida [13] measured the canopy water storage capacity of Scindapsus Aureus with the simulated rainfall method and found it was 0.2–0.8 mm. According to Zhang et al. [14], the estimated canopy storage capacity of Potentilla fruticosa using an indirect method was 1.13 mm. Zhang et al. [15] found that the mean canopy storage capacity of Caragana korshinskii and Artemisia ordosica shrubs using an indirect method in northwestern China was 1.3 and 2.2 mm, respectively.
C. korshinskii and H. rhamnoides are the main shrub species for afforestation in the Loess Plateau, China. In this study, we estimated the canopy water storage capacity of C. korshinskii and H. rhamnoides using the scale-up method, the Pereira regression analysis method, and the simulated rainfall method. We compared the differences among these three methods and explored reasons for these differences. This study provides a theoretical basis and technical support for canopy hydrology, related model simulation, and the selection of the best method for estimating the canopy water storage capacity.

2. Materials and Methods

2.1. Study Area

We implemented this experiment in the Anjiagou catchment of the western Loess Plateau in C. korshinskii and H. rhamnoides plantations from 2014 to 2018. The Anjiagou catchment has an area of 2.98 km2, which is surrounded by loess hills with altitude ranging from 1900 to 2250 m. This region belongs to the semi-arid climate zone in the middle temperate zone, with an average annual temperature of 6.3 °C, an extreme maximum temperature of 34.3 °C, and a minimum temperature of −27.1 °C. The average annual precipitation is 427 mm, and precipitation in July, August, and September accounts for 58% of the annual precipitation, mostly in the form of heavy rain, easily causing soil erosion. The monthly sunshine duration is 200 h, and the average monthly water surface evaporation is 125.8 mm. Vegetation in the catchment belongs to the arid-zone forest grassland belt. The catchment is dominated by non-native vegetation; trees include Pinus tabuliformis, Populus tomentosa, Armeniaca sibirica, and Robinia pseudoacacia, and shrubs include C. korshinskii and H. rhamnoides.
The plantation areas of C. korshinskii and H. rhamnoides were 44.2 ha and 35.6 ha, respectively. Both C. korshinskii and H. rhamnoides were cultivated in 1987 as three-year-old seedlings with a spacing of 2 × 2 m. C. korshinskii was planted in a cluster of 6 plants, where the initial stem number and vegetation cover were about 14,400 per ha and 25%, respectively. H. rhamnoides was planted in a cluster of 3 plants, where the initial stem number and vegetation cover were about 7200 per ha and 18%, respectively.
We conducted all of the experiments in typical C. korshinskii and H. rhamnoides experimental plantations with a size of 100 × 100 m (the criterion for selection is good growth). Table 1 provides fundamental data on the C. korshinskii and H. rhamnoides plots. The results show that considerable distinctions appeared among the shrub species for all the biometric traits examined except basic diameter—twig. We selected three plots with a size of 10 × 10 m for C. korshinskii and H. rhamnoides in the experimental plantations (100 × 100 m) based on the averaged measured results of Table 1. C. korshinskii is a multi-branched shrub with a maximum height of 2 m. The leaves are pinnate and are clustered or alternating, with a smooth plant surface. The leaf axis falls off or persists and hardens into a needling. H. rhamnoides is 1–5 m high, and the petiole is quite short and has a slender main stem with papery leaves. Its narrow lanceolate or oblong lanceolate leaves are 3–8 cm long and 1 cm wide (Figure 1).

2.2. Experimental Design

We installed an AG1000 automatic weather station (Onset Computer Corporation, Pocasset, MA, USA) approximately 100 m from the study plots. Observed meteorological data included solar radiation intensity, air temperature, air relative humidity, wind speed, wind direction, and rainfall. Rainfall was measured with a tipping-bucket rain gauge. Other meteorological data were recorded every 5 min and then stored as 30 min mean values. We also placed a standard rainfall gauge in the open area outside the plots to work simultaneously with the automatic weather station to measure the rainfall, based on Hamilton and Rowe’s [16] standard for storm and rainfall events, which are defined as follows: (1) an individual storm is a rainfall period separated by dry intervals of at least 24 h; and (2) an individual rainfall event is defined as a rainfall event separated by dry intervals of at least 4 h.

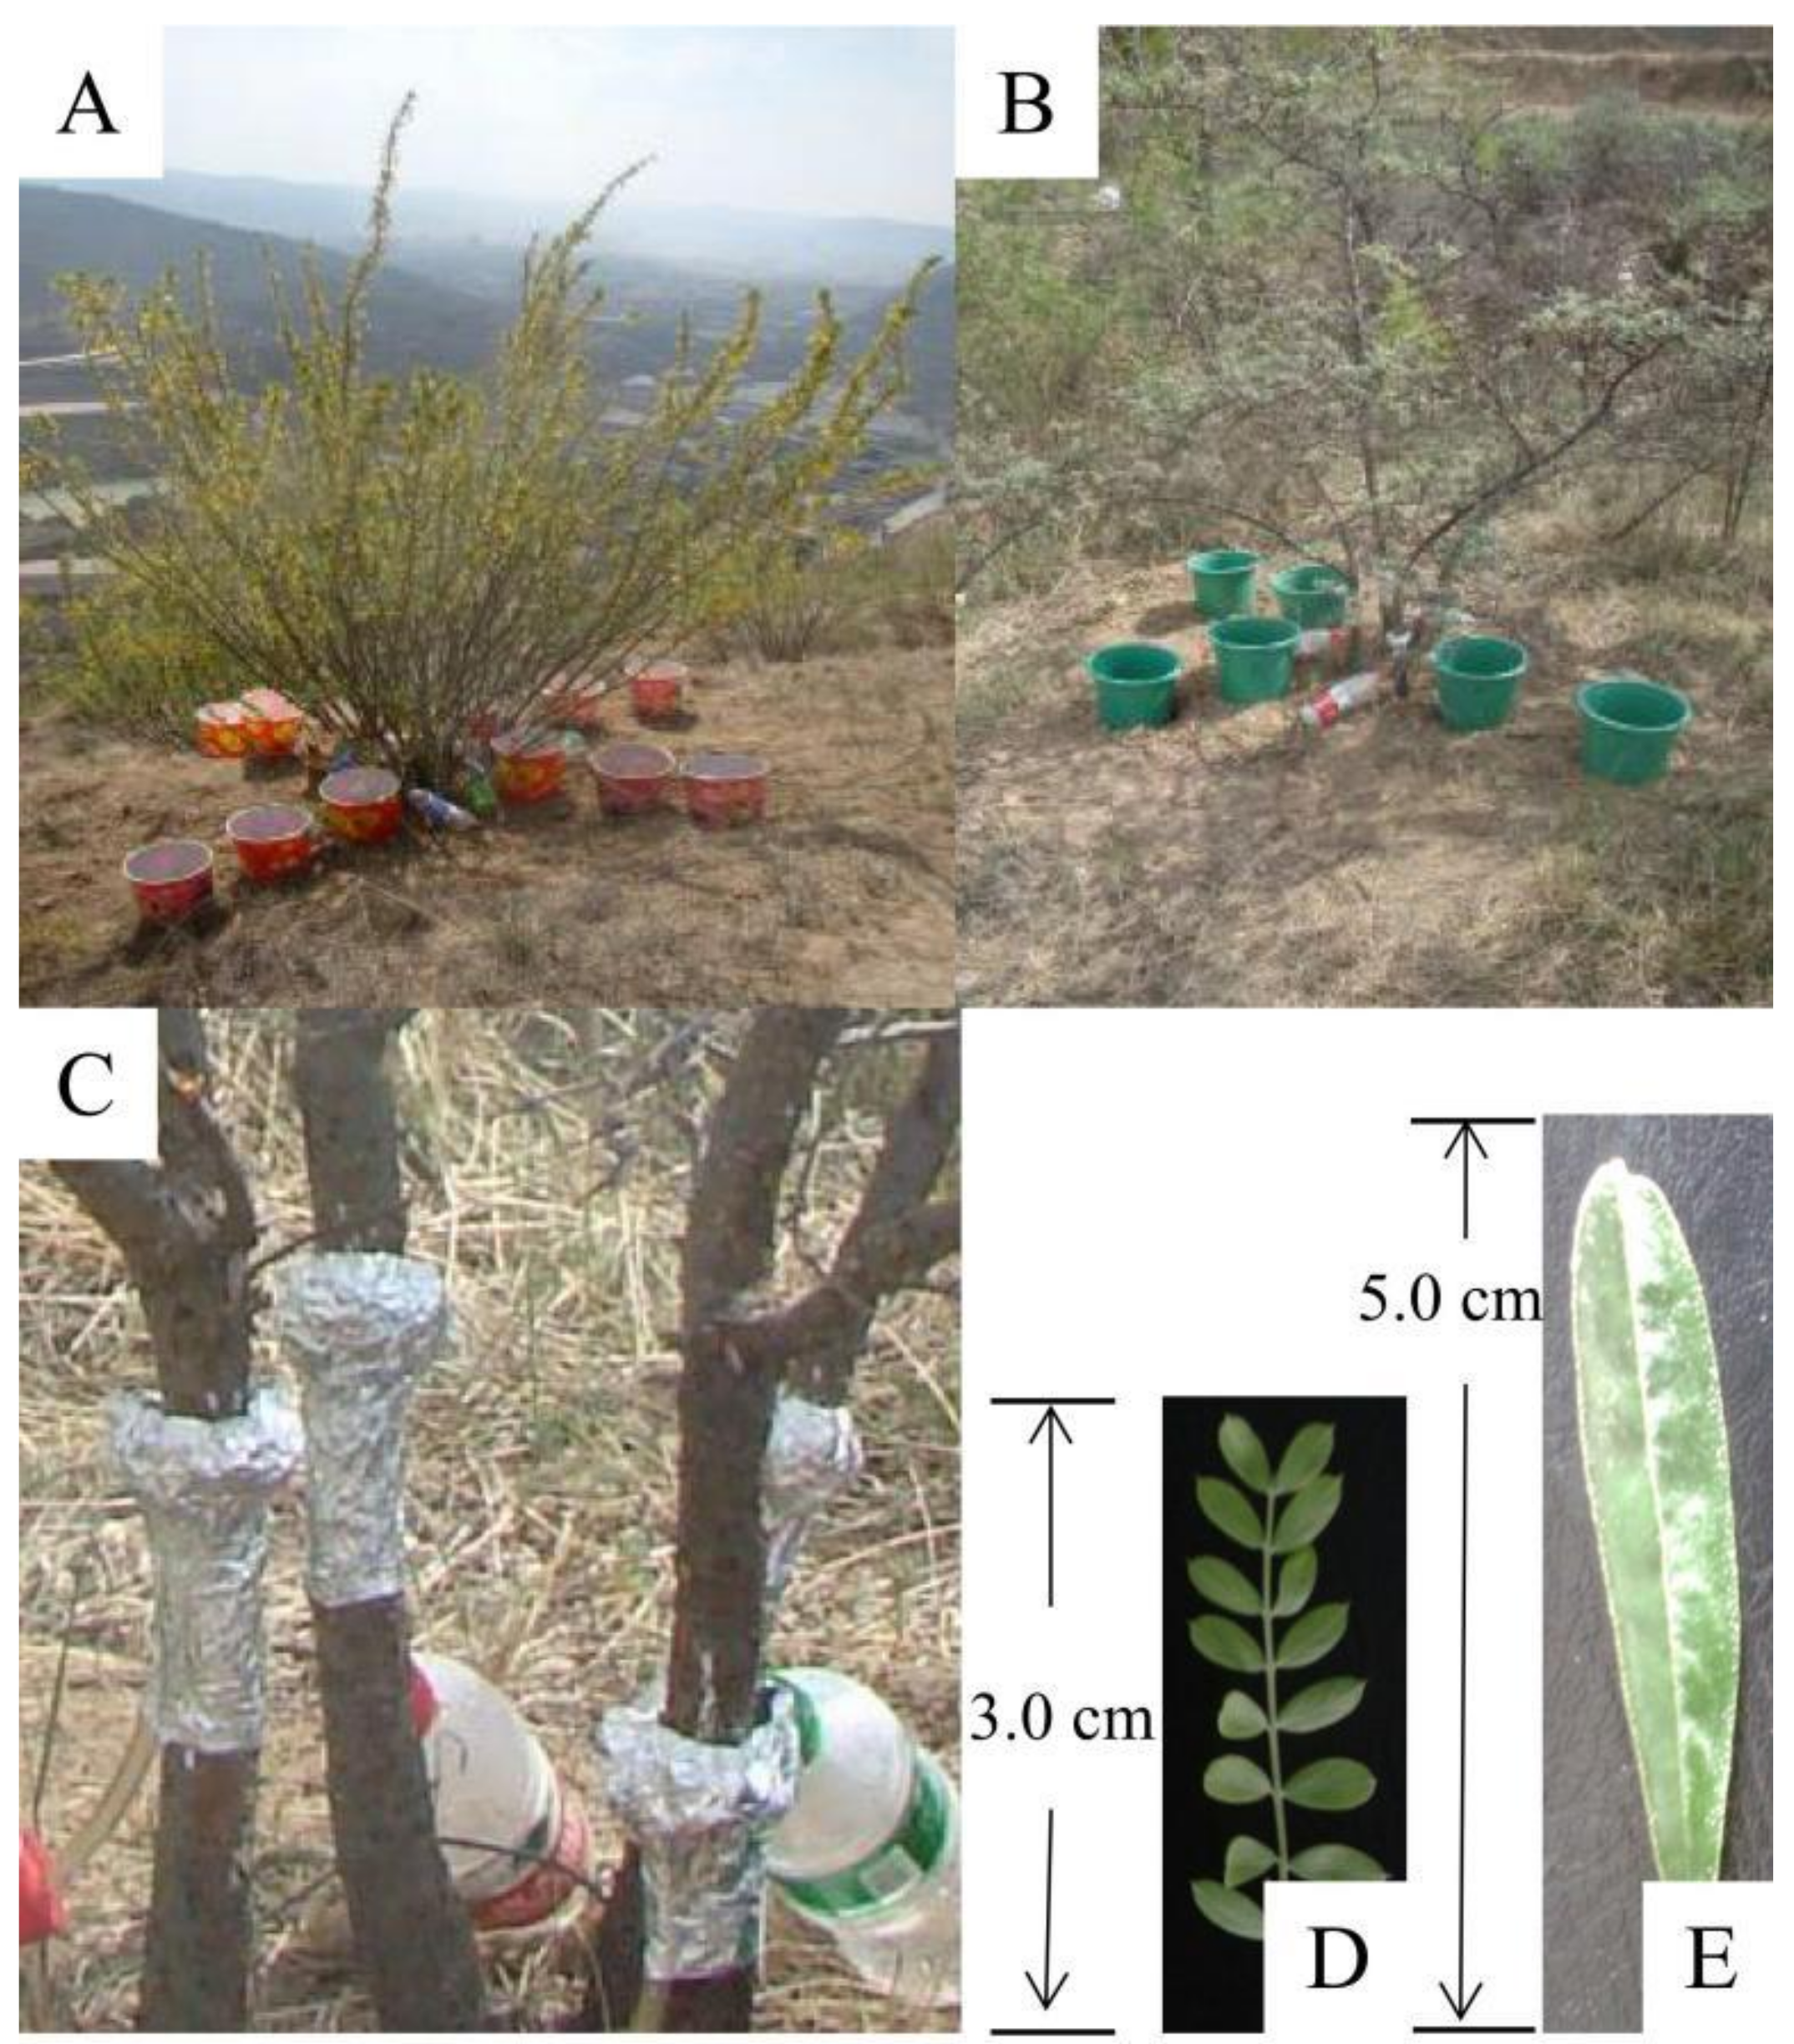
2.2.1. Throughfall, Stemflow, and Canopy Interception

We selected 12 C. korshinskii individuals and 12 H. rhamnoides individuals from the plots with a size of 10 × 10 m for in situ observation of throughfall and stemflow. Table 2 shows that significant differences appeared among the selected shrub individuals for all the biometric characters. We used plastic buckets with 20 cm outer-edge diameters to measure the throughfall. We placed four rows of plastic buckets centered on the main stem of the plant (90° between rows) in the radial direction. We placed a plastic bucket near, midway, and far away from the trunk in each row and arranged 12 plastic buckets for each plant (Figure 1).
For C. korshinskii and H. rhamnoides, at the base of each tree trunk about 10 cm above the ground, we filed it with fine sandpaper. We wrapped the trunk in a V shape with aluminum tape and filled the gap with adhesive. Because of the strong plasticity of the aluminum tape, we formed a trough completely surrounding the trunk between the aluminum foil and the trunk. The opening of the sink was less than 1 cm, which was used to intercept the stemflow. We connected the aluminum foil tank to the water-collecting container through a hose with a diameter of about 1 cm (Figure 1). To reduce evaporation loss, we measured throughfall and stemflow immediately after each rainfall event.
We calculated canopy interception by precipitation minus throughfall minus stemflow.

2.2.2. Scale-Up Method

(1)
Water storage capacity of the stem, branch, and leaf
We selected 100 branch samples and 100 stem samples for C. korshinskii and H. rhamnoides, from the sampling plots with a size of 100 × 100 m (not sampled from the 10 × 10 m plots). We took the samples to the laboratory for numbering and weighing. We immersed the samples in water for about 10 min and then removed them from the water after the branches and trunks were completely saturated. We suspended the branches in the natural growth mode and measured the quality of branches and trunks when there was no more gravity water (about 1–2 min). We air-dried the branches and stems for 6 h and took off all the leaves. We weighed the leafless branches and stems and then wetted them again. We measured the length and diameter of the branches and stems using a vernier caliper with an accuracy of 0.01 mm and tape with an accuracy of 0.1 cm. Then, we calculated the surface area of the branches and stems (Table 3).
We lay the leaves flat on the scanning equipment, avoiding overlap, and imported the scanned images into ArcGIS 10.5 to obtain the pixel value range of the leaf, count the number of pixels of the leaf, and compare with the pixel value of the picture. We established the model and batch process to obtain the leaf surface area [17] (Table 3). Table 3 illustrates the significant differences in the biometric characters among the selected samples.
(2)
Scale-up
Assuming that the canopy structure is uniform and the canopy water storage capacity per unit area is the same, Peng et al. (2011) [17] used the following method to calculate canopy water storage capacity. The water storage capacity of leaves (h1, mm) is as follows:
h 1 = w 1 10 ρ s × L A I ,
where w1 is the leaf water storage (g); ρ is the water density (g/cm3); s is the total leaf surface area (cm2); and LAI is the leaf area index.
The water storage capacity of branches (h2, mm) is as follows:
h 2 = w 2 π ρ d l × W A I ,
where w2 is the leaf water storage (g); d is the diameter of the branch (cm); l is the length of the branch; and WAI is the branch effective area index, which was measured in the spring or winter when all leaves dropped.
The water storage capacity of branches (h3, mm) is as follows:
h 3 = w 3 1000 ρ s × π n 0 D H ,
where w3 is the stem water storage (g); n0 is the plant density in the sample plot (numbers/m2); D is the averaged base diameter (cm); and H is the averaged plant height (cm).
Therefore, the canopy water storage capacity (h) of the whole stand can be expressed as follows [18]:
h = h1 + h2 + h3.

2.2.3. Pereira Regression Analysis Method

A good linear relationship exists between rainfall outside the forest and throughfall, which can be expressed as follows [5]:
T F = a P G + b ,
where TF is the throughfall; PG is the rainfall outside the forest; and a and b are the equation fitting parameters, where b is related to the canopy water storage capacity.
Pereira et al. [19] obtained the canopy water storage capacity (S, mm) based on the Gash model [20]:
S = b ( E / R 1 ) E R × 1 ln [ 1 ( E / R ) ] ,
where R is the rainfall intensity (mm/h) and E is the evaporation of the saturated canopy (mm), which is obtained by the Penman–Monteith equation:
λ E = ( Δ R n + ρ c P D / r a ) ( Δ + γ ) 1 ,
where λ is the latent heat of vaporization of water (20 °C, 2454 J g−1); Δ is the slope of the curve relating saturated vapor pressure to temperature (hPa °C−1); Rn is the net radiation (MJ m−2 h−1); ρ is the density of dry air (20 °C, 1204 g m−3); cp is the specific heat of the air (1.0048 J g−1 °C−1); D is the saturation pressure deficit (hPa); γ is the psychometric constant; and ra is the bulk aerodynamic conductance between the leaf surfaces and the reference point. The estimation of ra by the momentum method is as follows [21]:
r a = ln [ ( z d ) / z 0 ] 2 k 2 U ,
where k is von Karman’s constant (k = 0.4), U is the wind speed (m s–1) at height z (m), z is the reference height above the ground surface, d is the zero-plane displacement height, and z0 is the roughness length for momentum (d = 0.75 h, z0 = 0.1 h, z = h + 2, where h is the canopy height).

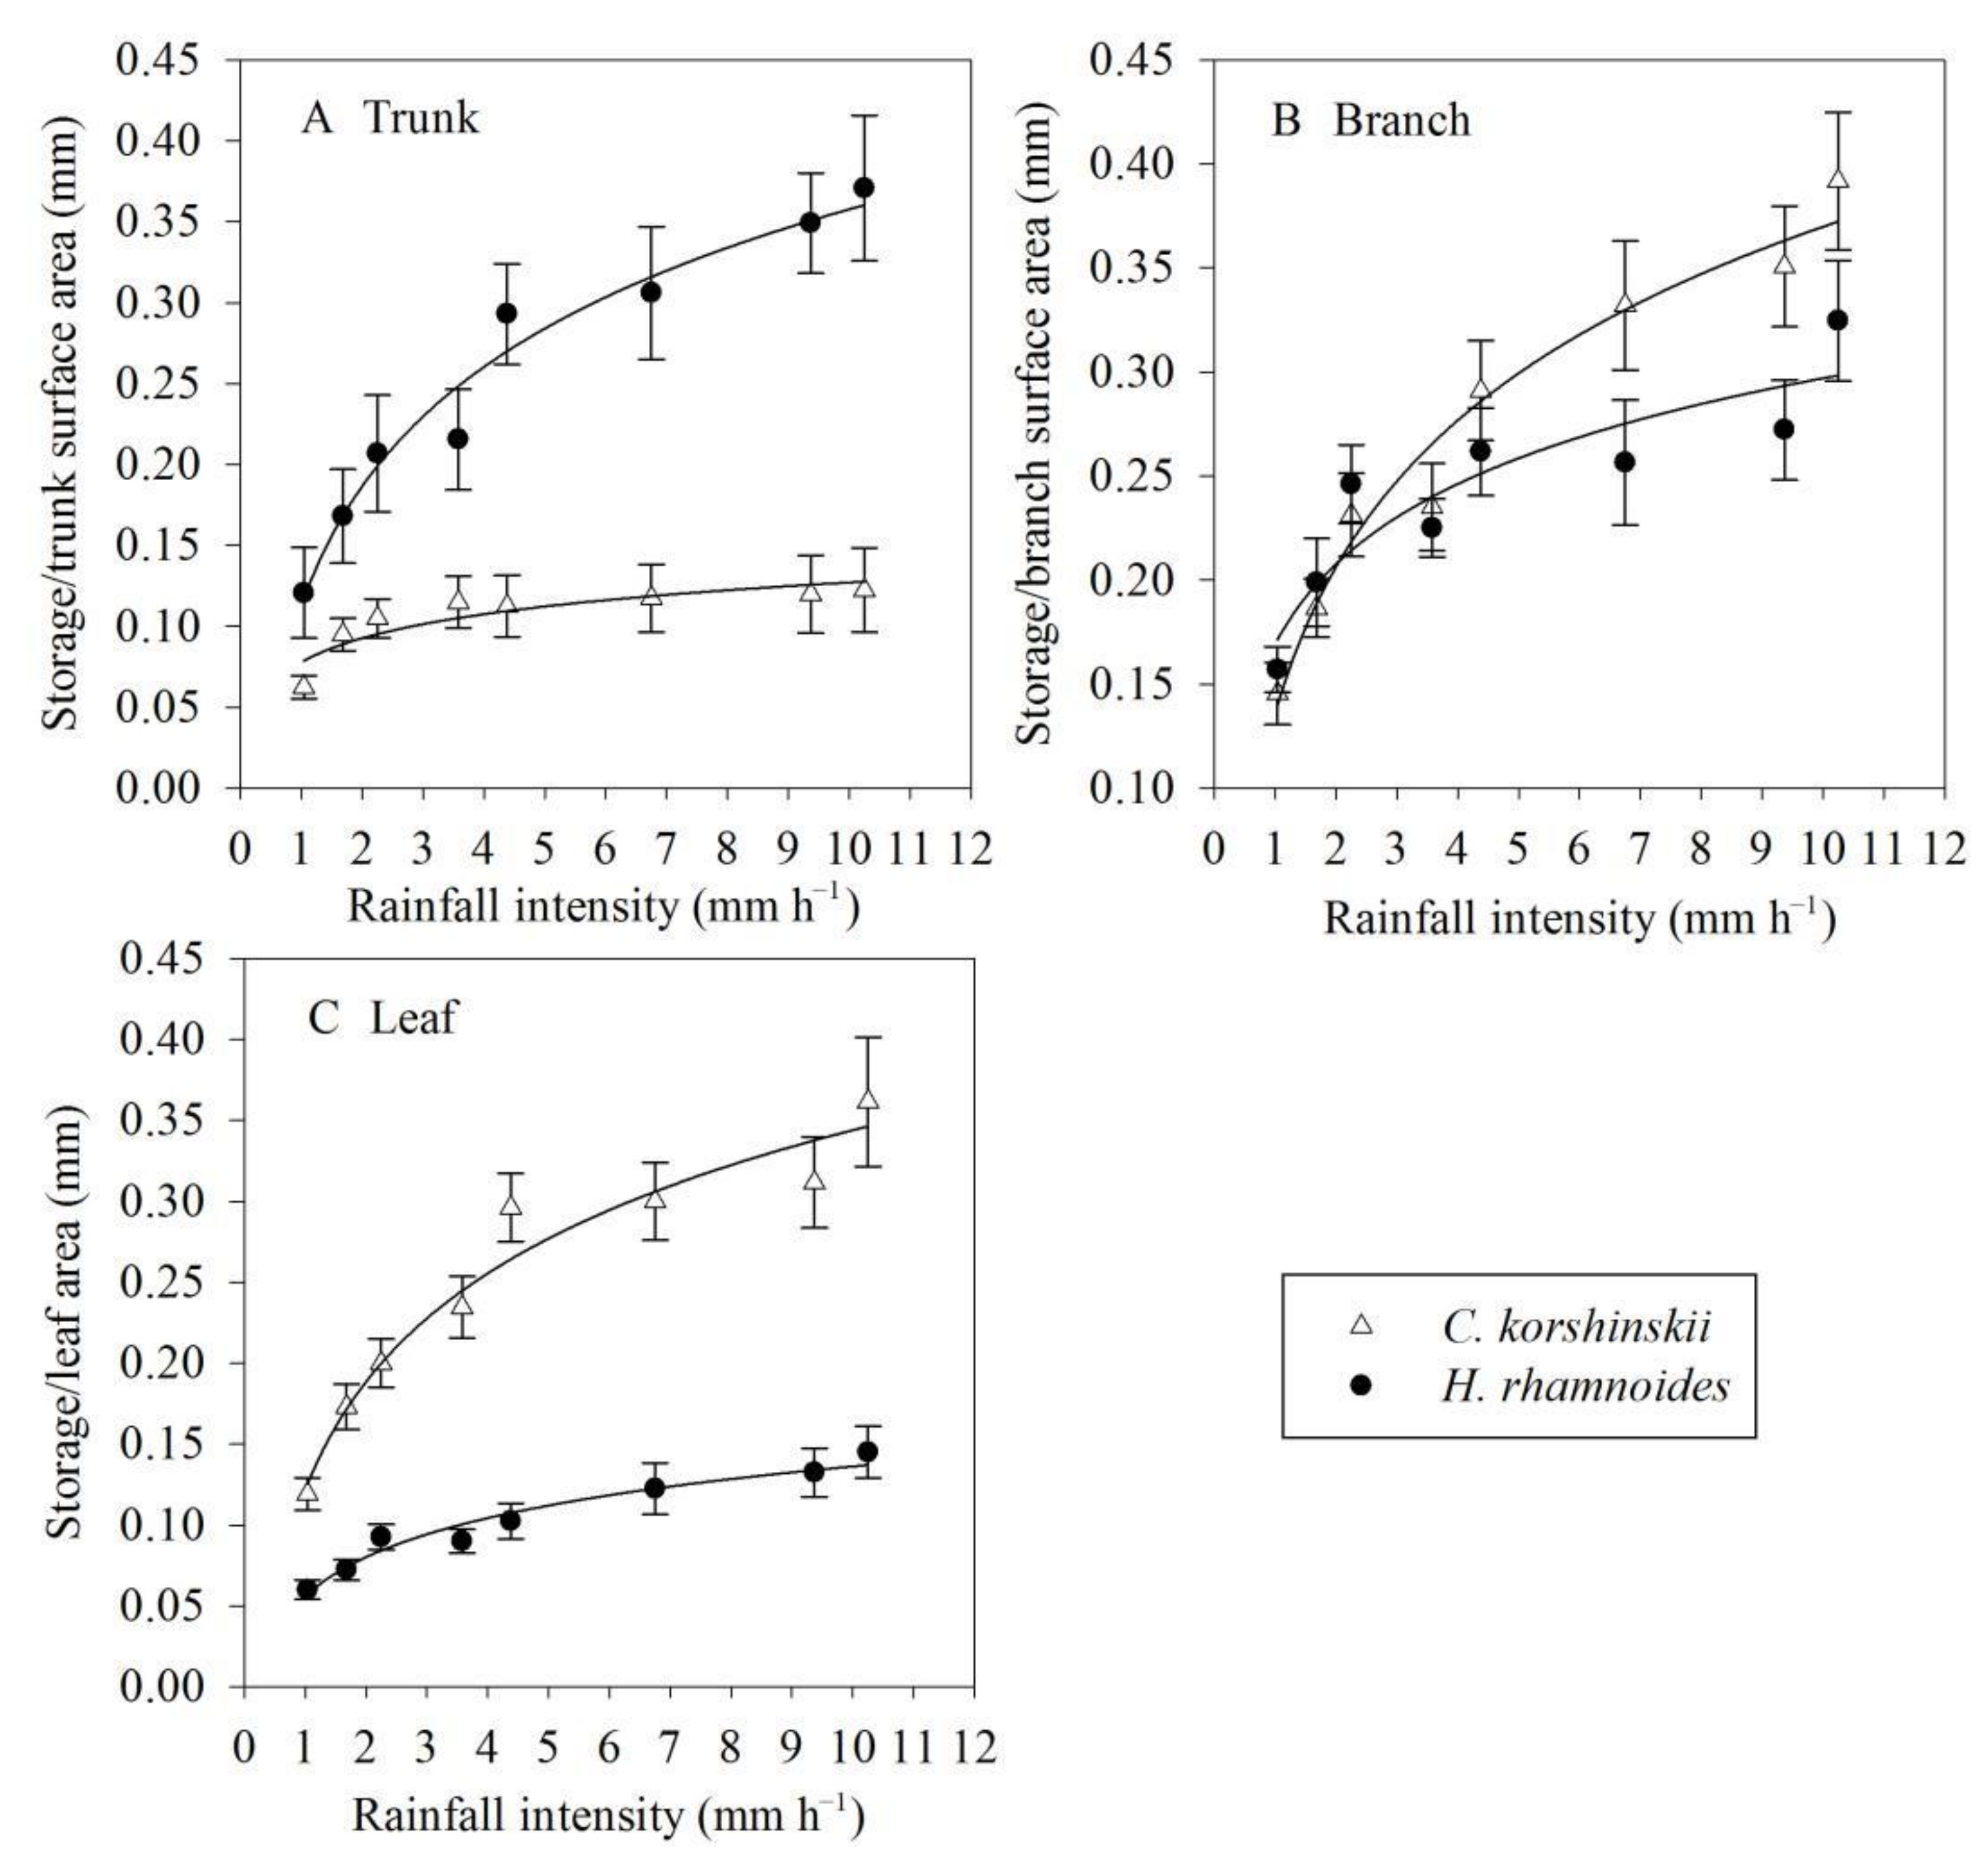
2.2.4. Simulated Rainfall Method

We used a rainfall simulator (model DIK-6000, Daiki Rika Kogyo Co., Saitama, Japan) with a height of 2 m, which had a spray spacing grid (1 × 1 m) and 400 needles (20 × 20). The effective rainfall area to simulate rainfall events with different intensities was 1.18 m2. The rainfall intensity of the simulator ranged from 0 and 200 mm h−1. Using the coarse and fine adjustment floats on the control panel, 8 rainfall intensities (25, 35, 45, 55, 85, 125, 165, and 200 mL min−1) were set corresponding to intensities of 1.04, 1.68, 2.25, 3.58, 4.38, 6.75, 9.37, and 10.25 mm h−1 calibrated by a standard rain gage.
According to the average value of the biological parameters (Table 1), we selected representative individual shrubs from the plot with a size of 100 × 100 m (not sampled from the 10 × 10 m plots). We took six samples for each shrub from the sampling plots with a size of 100 × 100 m (not sampled from the 10 × 10 m plots). We cut the stem of the sample and sealed it with liquid paraffin to prevent it from wilting immediately [1]. After the experiment, we dissected the samples into leaves, stems, and branches. We calculated the single leaf area following the method of Li et al. [22]. We took the branches and trunks as cylinders and calculated the surface area. We calculated the projected area of the shrub canopy by the longest diameter and shortest diameter of most canopy centers. We calculated the LAI according to the ratio of leaf area to canopy projection area. We obtained the dry biomass of leaves, stems, and branches by means of the oven drying method (75 °C, about 48 h), which was calculated as the dry biomass of the whole shrub.
We selected shrub specimens from the test field and suspended the specimens on a 1 mm-diameter cable. According to Ginebra-Solanellas et al. [1], we covered the samples on the pedestals of the electronic balances (type LAI 6001 s, Sartorius Co., Göttingen, Germany; accuracy: ±0.1 g) and put them on the upper flat of the rain simulator. We connected a laptop to the electronic balance and recorded the weight of the sample every 3 s automatically during the period of rainfall simulation [3]. We assumed that the amount of water held in the shrub canopy would increase as the intensity of rainfall increased. Therefore, the canopy in wet situations did not affect the total water stored in each test stage with the consecutive higher rainfall intensity, i.e., the canopy storage water is the sum of the water intercepted by the canopy from a dry state to a wet state. Each simulated rainfall course started from the lowest intensity (1.04 mm h−1) until the weight achieved a stable status [1]. We thereafter turned off the simulator for 5 min to facilitate the drainage of extra water from the plant. The aim was not to return to the initial dry conditions, but rather to allow excess water to leave the plant. The rainfall intensity was then increased to 1.68 mm h−1 and further until 10.25 mm h−1 was reached. When the weight rise of the vegetation specimens retained steady-state storage at the last rainfall of 10.25 mm h−1, the rainfall simulator was immediately turned off. At the same time, two ventilators were turned on, and all doors and windows were opened to enable quick specimen drying for subsequent biometric variable determination.

2.3. Data Analysis

One-way analysis of variance (ANOVA) was performed to compare differences among species in their biometric variables (plant height, basic diameter, projected area, LAI). The same method was used to compare the sampling by the scale-up method (length, basic diameter, leaf area) and the sampling by canopy interception (canopy bulk, branch numbers, branch angle, branch length, projected area, basic diameter, plant height). General linear models of two-way ANOVA were used to examine the major and interactive effects of shrub species and the biological parameters of water storage ability. Correlations between biometric features and intercept variables were evaluated by Pearson’s correlation analysis. Sampling was tested by using the randomness test of single sample variable values. All statistical tests were conducted using SPSS 18.0 software.

3. Results

3.1. Rainfall

In the period of the experiment (1 May to 30 September 2014–2018), we observed 235 rainfall events. Of these, 75 rainfall events happened in the daytime and 161 rainfall events happened at night. The results reveal that a low rainfall intensity (<0.5 mm h−1) occurred in 43.8% of the rainfall events (Figure 2A). The average rainfall per year was 363.2 mm, and the rainfall distribution is shown in Figure 2B. Over the duration of the experiment, 197 individual rainfall events produced throughfall and 151 rainfall events produced stemflow.

3.2. Canopy Water Storage Based on Pereira Regression Analysis Method

3.2.1. Throughfall, Stemflow, and Canopy Interception

Throughfall ranged from 23.2% to 98.1%, accounting for 62.4% of the total rainfall over individual rainfall events. The comparable throughfall of C. korshinskii was 70.1%, the range was 21–98.3%, and the standard deviation was 21.4%. Under the same rainfall circumstances, the throughfall of C. korshinskii was 7.7% higher than that of H. rhamnoides. Stemflow values contributed 6.7% and 2.4% of the total rainfall, respectively. Their variation ranged from 1.5 to 17.7% and 0.07 to 4.7%, and their standard deviations were 25.5% and 17.7%, respectively, for C. korshinskii and H. rhamnoides (Figure 3).
The average interception loss for C. korshinskii and H. rhamnoides accounted for 23.3% and 34.2%, respectively, of the total rainfall during the study period (Figure 4). The logarithmic regression equation of canopy interception loss and total rainfall is shown in Figure 4.

3.2.2. Average Rainfall Intensity and Evaporation Intensity

Among the 197 rainfall events that produced throughfall, the average rainfall intensity was 0.15–13.65 mm h−1, among which one strong rainfall event reached 32.5 mm h−1, and the most common rainfall intensity was less than 1 mm h−1. The evaporation of C. korshinskii and H. rhamnoides during 197 rainfall periods calculated according to the Penman–Monteith formula was 0.0090–0.20 mm h−1 and 0.008–0.17 mm h−1, respectively, accounting for 10.30% and 8.09% of the rainfall. We applied these values to Equation (6), and the canopy water storage capacities of C. korshinskii and H. rhamnoides were 0.68 mm and 0.72 mm, respectively.

3.3. Canopy Water Storage Based on Scale-Up Method

We determined the canopy water storage capacity according to the structural characteristics of the canopy and the physiological characteristics of each component of the canopy. The maximum water storage capacity of each component of C. korshinskii was as follows: branch, 0.31 mm > leaf, 0.27 mm > trunk, 0.15 mm, and the canopy water storage capacity was 0.73 mm. The maximum water storage capacity of each component of H. rhamnoides was as follows: trunk, 0.33 mm > branch, 0.29 mm > leaf, 0.14 mm, and the canopy water storage capacity was 0.76 mm (Figure 5). There was a positive correlation between the branch water storage capacity and the proportion of canopy branchlets and leaf biomass to the total biomass of the branch (Figure 6).

3.4. Canopy Water Storage Based on Simulated Rainfall Method

Figure 7 illustrates the exponential regression relationship between water storage per leaf area, branch and stem surface area (as indicated by the equivalency of the water depth), and simulated rainfall intensity (1.04, 1.68, 2.25, 3.58, 4.38, 6.75, 9.37, and 10.25 mm h−1). We found that in each simulated rainfall intensity, the water intercepted by H. rhamnoides on each trunk surface area was more than that of C. korshinskii on each branch surface area and leaf area; C. korshinskii could store more water than H. rhamnoides. The canopy water storage capacity was 0.63 mm and 0.59 mm for C. korshinskii and H. rhamnoides, respectively. Canopy water storage showed an increasing trend with an increase in the rainfall intensity in both C. korshinskii and H. rhamnoides (Figure 7).

3.5. Relationships between Water Storage Capacities and Community Characteristics

Shrub species and biological parameters were significant in affecting the water storage capacity of the canopy (p < 0.0001). There was no significant effect of their interaction on canopy water storage capacity (p > 0.05) (Table 4). Table 5 shows that our absolute water storage capacity (S) values showed a positive correlation with the leaf area, LAI, and projected area, and a negative correlation with the branch angle. However, no correlation was observed between canopy water storage capacity and basic diameter or shrub height.

4. Discussion

4.1. Influential Factors of Shrub Canopy Water Storage Capacity

Although few studies have been conducted on the canopy water storage capacity of shrubs, some related studies have shown that it is related mainly to the canopy volume, projected area, biomass, leaf area, LAI, leaf structure, shape, inclination angle, water storage capacity of leaves, growth of soft hairs, and the type, number, and density of wrinkles between leaves and stems. We found that the canopy water storage capacity was significantly affected by species and biological parameters. However, there was no significant effect of their interaction on the water storage capacity of the canopy. Our results are similar to those of Guo et al. [23] and Xiong et al. [24]. The canopy water storage capacity was highly correlated with canopy structural characteristics, positively correlated with the leaf area, LAI, and projected area, and negatively correlated with the branch angle. Wang et al. [25] found that the leaf area and biomass had more influence on the canopy water storage capacity than the projected area and shrub volume. The larger species and specimens were able to store more water than the smaller shrubs, and for similar canopy surface areas, the water storage capacity increased with the surface area.
We found that the canopy water storage capacity of H. rhamnoides was greater than that of C. korshinskii for the average of the three methods. This may have been due to the fact that the bark of H. rhamnoides was thick and soft and could absorb more water, and that the bark often splits obliquely, which can store more water. The leaves, branches, and trunks of the C. korshinskii individuals had a layer of wax, which made the canopy surface smooth and adverse to water retention, which may limit or reduce water storage. Garcia-Estringana et al. [26] showed that the root cause of determining the water-holding capacity of shrubs is the physiological structure of the stems and leaves. Garcia-Estringana et al. [27] also reported that Typha latifolia had a strong water-holding capacity because of the abundant soft hairs on the leaves and young stems. The canopy water storage capacity of Cistus ladanifer was lower because the growth direction of the leaves and petioles was different, which is not conducive to water retention. A layer of impermeable wax on the surface of leaves can prevent water penetration. At the same time, this capacity also proved that coniferous leaves have a stronger water-holding capacity than broad leaves [28].

4.2. Effects of Different Methods on Canopy Water Storage Capacity

Different methods had a significant influence on the determination of the canopy water-holding capacity. The canopy water storage capacity of C. korshinskii and H. rhamnoides was ascertained as 0.68 mm and 0.72 mm, 0.73 mm and 0.76 mm, and 0.63 mm and 0.59 mm using the Pereira regression analysis method, scale-up method, and simulated rainfall method, respectively. Wang et al. [25] revealed that the canopy water storage capacity of C. korshinskii under seven rainfall intensities was 0.24–0.53 mm. Zhang et al. [27] used regression analysis and found that the canopy water storage capacity of C. korshinskii was 0.71 mm and that a large gap existed between the rainfall intensities. The results of this study are similar to those of Zhang et al. [27]. The results may be similar because the observation error of the throughfall was large and because of the seasonal change in LAI. In addition, regression analysis depends on the observation data of rainfall outside the forest and the throughfall. Peng et al. [17] used different equipment to observe throughfall. Their results showed that different equipment and different layout methods of the same equipment had a certain impact on the observation data of throughfall. It is evident from Table 1 that the throughfall rate of C. korshinskii and H. rhamnoides showed an increasing trend as the growing season went on, which may have been caused by the change in LAI and rainfall characteristics, affecting the determination of the canopy water storage capacity.
As for the research on canopy water storage capacity, some researchers have said that the water absorbed by tree trunks should not be considered [29], while others believe that, in arid and semi-arid regions, the water absorbed by tree trunks could reach about 16% of the water retained by the canopy [30]. The canopy water storage capacity calculated by the scale-up method in this study is the maximum canopy water storage capacity under ideal conditions, but the actual canopy water storage capacity cannot reach the maximum water storage capacity in many cases. The actual canopy water storage capacity is mainly affected by the stand status, and rainfall characteristics will also affect the canopy water storage capacity. For example, in the case of a short period of heavy rainfall, it is difficult to achieve the maximum canopy water storage capacity. Therefore, the actual canopy water storage status should be considered in the application of scale-up results. The Pereira regression analysis method mainly utilizes observation data of precipitation outside the forest and throughfall. The observation error of throughfall is large, and observation equipment and the arrangement of observation points will affect the measurement of throughfall. Rainfall events considered by the Pereira regression analysis method need to meet canopy saturation. Gash et al. [21] described the process of canopy interception as canopy unsaturation–canopy saturation–stemflow generation and comprehensively considered rainfall characteristics outside the forest and the maximum water storage capacity of trunks during the observation. The maximum canopy water storage capacity obtained by the Pereira regression analysis method was between that obtained by the scale-up method and that obtained by the simulated rainfall method. It can be considered that the canopy water storage capacity obtained by the Pereira regression analysis method is reasonable.
We observed the minimum canopy water storage capacity using the simulated rainfall method. The results of the study by Llorens and Gallart [29] indicated that the water storage capacity of the canopy measured using the scale-up method was about 30% greater than that measured by the simulated rainfall method, because the scale-up method inevitably made the samples absorb more water, particularly the xylem of the canopy. Our earlier research revealed that the specific storage capacity of the water-immersed samples was 20% higher than that of the indirect method [30]. Soaking inevitably resulted in more water absorption by the sample than natural rainfall events [31]. Garcia-Estringana et al. [26] obtained the opposite results, however. When the simulated rainfall intensity was 11.53 mm h−1, the water volume stored by A. ordosica was close to that of Dorycnium pentaphyllum; the water volume stored by C. korshinskii and Haloxylon scoparium was similar to that of Cistus albidus in Garcia-Estringana et al. [26], obtained using simulated rainfall of 13 mm h−1. Comparing the thin–thick-leaf and thin–large-stem plants, the wide-leaf ones stored more water in unit biomass than the fine-leaf ones [32]. These studies indicated that the sample biomass is not a reliable predictor of cross-species storage and demonstrated that the leaf biomass as a storage predictor has an intermediate use, possibly the result of the use of a large number of simulated rainfall intensities (20 mm h−1). In future studies, scholars could analyze the influence of leaf thickness, leaf area, leaf tissue density, stem density, and other indicators on canopy water storage capacity, because they are all relevant.
According to the regression analysis method, each precipitation event may not have caused the canopy to achieve canopy water storage capacity. Generally, the leaves and branches of the canopy easily reached the maximum canopy water storage capacity, whereas the tree trunks needed to reach the maximum canopy water storage capacity under heavy rainfall events. Therefore, the water storage capacity of the canopy estimated by the regression analysis method better reflected the canopy water storage capacity in the actual precipitation process. The simulated rainfall method could overcome the shortcomings of the regression analysis method and the scale-up method.

5. Conclusions

Different methods had a significant influence on the results of the canopy water-holding capacity. The canopy water storage capacity for C. korshinskii and H. rhamnoides was determined to be 0.68 mm and 0.72 mm, 0.73 mm and 0.76 mm, and 0.63 mm and 0.59 mm using the Pereira regression analysis method, scale-up method, and simulated rainfall method, respectively. The ability to clarify the influence of vegetation restoration measures on the semi-arid Loess Plateau has great practical significance for effective vegetation management and for maximum realization of the water cycle of natural rainfall. Therefore, an artificial ecosystem could be established using xerophytic shrubs, such as C. korshinskii and H. rhamnoides. The canopy water storage capacity leads to the loss of net water in the hydrological cycle. The research results of canopy water storage in shrub canopies are helpful for vegetation restoration and water budget assessment in the Loess Plateau. For example, species with a low canopy water storage capacity can be selected for vegetation restoration, which is conducive to efficient water utilization. The findings of this research can be applied to other shrub-dominated ecosystems.

Author Contributions

Conceptualization, S.J. and X.D.; methodology, S.J.; software, C.H. and D.Y.; validation, S.J. and X.Z.; formal analysis, X.Z. and C.H.; investigation, S.J., X.Z. and D.Y.; resources, X.Z. and C.H.; data curation, S.J. and C.H.; writing—original draft preparation, S.J.; writing—review and editing, X.Z. and D.Y.; visualization, X.Z.; supervision, S.J. and D.Y.; project administration, S.J.; funding acquisition, S.J. and D.Y. All authors have read and agreed to the published version of the manuscript.

Funding

This research was funded by the Training Program for Young Backbone Teachers in Colleges and Universities of Henan Province (2021GGJS003) by S.J., the Henan Natural Science Foundation (212300410413) by S.J., the Henan Youth Talent Promotion Project (2021HYTP030) by S.J., and China Postdoctoral Science Foundation (2020M672247) by S.J.

Conflicts of Interest

The authors declare no conflict of interest.

References

  1. Ginebra-Solanellas, R.M.; Holder, C.D.; Lauderbaugh, L.K.; Webb, R. The influence of changes in leaf inclination angle and leaf traits during the rainfall interception process. Agric. For. Meteorol. 2020, 285, 107924. [Google Scholar] [CrossRef]
  2. Grunicke, S.; Queck, R.; Bernhofer, C. Long-term investigation of forest canopy rainfall interception for a spruce stand. Agric. For. Meteorol. 2020, 292, 108125. [Google Scholar] [CrossRef]
  3. Campellone, S.V.; Levia, D.F.; Montalto, F.A. Differences in submillimetre surface morphology and canopy interception storage capacities of Gleditsia triacanthos L. (honeylocust) in relation to canopy phenophase and position. Ecohydrology 2020, 13, e2192. [Google Scholar] [CrossRef]
  4. Horton, R.E. Rainfall interception. Mon. Weather Rev. 1919, 47, 603–623. [Google Scholar] [CrossRef]
  5. Rutter, A.J.; Kershaw, K.A.; Robins, P.C.; Morton, A.J. A predictive model of rainfall interception in forests. I. Derivation of the model from observations in a plantation of Corsican pine. Agric. Meteorol. 1972, 9, 367–384. [Google Scholar] [CrossRef]
  6. Baptista, M.D.; Livesley, S.J.; Parmehr, E.G.; Neave, M.; Amati, M. Terrestrial laser scanning to predict canopy area metrics, water storage capacity, and throughfall redistribution in small trees. Remote Sens. 2018, 10, 1958. [Google Scholar] [CrossRef] [Green Version]
  7. Klamerus-Iwan, A.; Lagan, S.; Zarek, M.; Slowik-Opoka, E.; Wojtan, B. Variability of Leaf Wetting and Water Storage Capacity of Branches of 12 Deciduous Tree Species. Forests 2020, 11, 1158. [Google Scholar]
  8. Xiong, P.; Chen, Z.; Zhou, J.; Lai, S.; Jian, C.; Wang, Z.; Xu, B. Aboveground biomass production and dominant species type determined canopy storage capacity of abandoned grassland communities on semiarid Loess Plateau. Ecohydrology 2021, 14, e2265. [Google Scholar] [CrossRef]
  9. Chen, Y.; Li, M. Quantifying Rainfall Interception Loss of a Subtropical Broadleaved Forest in Central Taiwan. Water 2016, 8, 14. [Google Scholar] [CrossRef]
  10. Jiao, J.; Su, D.; Han, L.; Wang, Y. A Rainfall Interception Model for Alfalfa Canopy under Simulated Sprinkler Irrigation. Water 2016, 8, 585. [Google Scholar] [CrossRef] [Green Version]
  11. Klamerus-Iwan, A.; Blonska, E. Canopy storage capacity and wettability of leaves and needles: The effect of water temperature changes. J. Hydrol. 2018, 559, 534–540. [Google Scholar] [CrossRef]
  12. Klamerus-Iwan, A.; Emanuel, G.; Anna, S.; Blonska, E.; Lasota, J.; Lagan, S. Linking the contents of hydrophobic PAHs with the canopy water storage capacity of coniferous trees. Environ. Pollut. 2018, 242, 1176–1184. [Google Scholar]
  13. Syahida, N.A.M.; Azida, A.A.B. The effect of vegetation canopy on canopy storage capacity with different rainfall intensity. In Proceedings of the 12th International Civil Engineering Post Graduate Conference (SEPKA)/3rd International Symposium on Expertise of Engineering Design (ISEED), Johor, Malaysia, 27–28 August 2018. [Google Scholar]
  14. Zhang, S.; Li, X.; Jiang, Z.; Li, D.; Lin, H. Modelling of rainfall partitioning by a deciduous shrub using a variable parameters Gash model. Ecohydrology 2018, 11, e2011. [Google Scholar] [CrossRef]
  15. Zhang, Y.; Wang, X.; Hu, R.; Pan, Y.; Paradeloc, M. Rainfall partitioning into throughfall, stemflow and interception loss by two xerophytic shrubs within a rain-fed re-vegetated desert ecosystem, northwestern China. J. Hydrol. 2015, 527, 1084–1095. [Google Scholar] [CrossRef]
  16. Hamilton, E.L.; Rowe, P.B. Rainfall Interception by Chaparral in California; State of California; Department of Natural Resources, Division of Forestry: Sacramento, CA, USA, 1949. [Google Scholar]
  17. Peng, H.H.; Zhao, C.Y.; Xu, Z.L.; Peng, S.Z.; Wang, Y. Water storage capacity of Qinghai spruce (Picea crassifolia) forest canopy in Qilian Mountains. Chin. J. Appl. Ecol. 2011, 22, 2233–2239, (in Chinese with English abstract). [Google Scholar]
  18. Bram, H.; Pierre-Erik, I.; Daniel, F.N.; Steeve, P. Observations of canopy storage capacity and wet canopy evaporation in a humid boreal forest. Hydrol. Process. 2021, 35, e14021. [Google Scholar]
  19. Pereira, F.L.; Gash, J.H.C.; David, J.S.; David, T.S.; Monteiro, P.R.; Valente, F. Modelling interception loss from evergreen oak Mediterranean savannas: Application of a tree-based modelling approach. Agric. For. Meteorol. 2009, 149, 680–688. [Google Scholar] [CrossRef] [Green Version]
  20. Gash, J.H.C. An analytical model of rainfall interception by forests. Q. J. Roy. Meteor. Soc. 1979, 105, 43–55. [Google Scholar] [CrossRef]
  21. Gash, J.; Lloyd, C.; Lachaud, G. Estimating sparse forest rainfall interception with an analytical model. J. Hydrol. 1995, 170, 79–86. [Google Scholar] [CrossRef]
  22. Li, X.R.; Ma, F.Y.; Xiao, H.L.; Wang, X.P.; Kim, K.C. Long-term effects of revegetation on soil water content of sand dunes in arid region of Northern China. J. Arid Environ. 2004, 57, 1–16. [Google Scholar] [CrossRef]
  23. Guo, Y.; Hou, L.; Zhang, Z.; Zhang, J.; Cheng, J.; Wei, G.; Lin, Y. Soil microbial diversity during 30 years of grassland restoration on the Loess Plateau, China: Tight linkages with plant diversity. Land Degrad. Dev. 2019, 30, 1172–1182. [Google Scholar] [CrossRef]
  24. Xiong, P.; Chen, Z.; Yang, Q.; Zhou, J.; Zhang, H.; Wang, Z.; Xu, B. Surface water storage characteristics of main herbaceous species in semiarid Loess Plateau of China. Ecohydrology 2019, 12, e2145. [Google Scholar] [CrossRef]
  25. Wang, X.P.; Zhang, Y.F.; Hu, H.; Pan, Y.X.; Berndtsson, R. Canopy storage capacity of xerophytic shrubs in Northwestern China. J. Hydrol. 2012, 454, 152–159. [Google Scholar] [CrossRef]
  26. Garcia-Estringana, P.; Alonso-Blázquez, N.; Alegre, J. Water storage capacity, stemflow and water funneling in Mediterranean shrubs. J. Hydrol. 2010, 389, 363–372. [Google Scholar] [CrossRef]
  27. Zhang, Z.; Zhao, Y.; Li, X.; Huang, L.; Tan, H. Gross rainfall amount and maximum rainfall intensity in 60-minute influence on interception loss of shrubs: A 10-year observation in the Tengger Desert. Sci. Rep. 2016, 6, 26030. [Google Scholar] [CrossRef] [Green Version]
  28. Dykes, A.P. Rainfall interception from a lowland tropical rainforest in Brunei. J. Hydrol. 1997, 200, 260–279. [Google Scholar] [CrossRef]
  29. Wei, S.P.; Wang, L.; Wu, F.Q. Hydrological properties of canopy of acacia in loess hilly and gully region. J. Nanjing For. Uni. Nat. Sci. 2008, 32, 43–48. [Google Scholar]
  30. Llorens, P.; Gallart, F. A simplified method for forest water storage capacity measurement. J. Hydrol. 2000, 240, 131–144. [Google Scholar] [CrossRef]
  31. Jian, S.; Zhao, C.; Fang, S.; Yu, K.; Ma, W. Water storage capacity of the canopy dominated by Caragana korshinskii and Hippophae rhamnoides in hilly and gully region on the Loess Plateau of Northwest China. Acta Phytoecol. Sin. 2013, 37, 45–51. [Google Scholar] [CrossRef]
  32. Keim, R.F.; Skaugset, A.E.; Weiler, M. Storage of water on vegetation under simulated rainfall of varying intensity. Adv. Water Resour. 2006, 29, 974–986. [Google Scholar] [CrossRef]
Figure 1. Schematic diagram. (A) C. korshinskii; (B) H. rhamnoides; and (C) stemflow collection. (D,E) are the leaf characteristics of the two shrubs.
Forests 13 01187 g001
Figure 2. The distributions of the rainfall intensity, rainfall, and rainfall events from 1 May to 30 September 2014–2018. (A), the frequency of different rainfall intensity classes; (B), the frequency of rainfall events and rainfall in different rainfall classes.
Forests 13 01187 g002
Figure 3. Linear regression relationship between rainfall and throughfall or stemflow from 2014 to 2018 for C. korshinskii and H. rhamnoides.
Forests 13 01187 g003
Figure 4. Logistic regression relationship between rainfall and canopy interception for C. korshinskii and H. rhamnoides.
Forests 13 01187 g004
Figure 5. Box-and-whisker diagrams of the water storage capacity of leaf, branch, and trunk for C. korshinskii and H. rhamnoides, showing the mean value (the dotted line), standard deviation, and 25th, 50th, 75th, and abnormal percentile values.
Forests 13 01187 g005
Figure 6. Linear regression relationship between water storage volume of branches and the biomass ratio of leaf and branch/trunk for C. korshinskii and H. rhamnoides. (A) C. korshinskii. (B) H. rhamnoides.
Forests 13 01187 g006
Figure 7. Canopy storage capacity per trunk, branch, and leaf area for eight rainfall intensities for C. korshinskii and H. rhamnoides. Values are the average of the equilibrium stores in all tests for each species (n = 16). The vertical bars show the standard error. (A), Trunk; (B), Branch; (C), Leaf.
Forests 13 01187 g007
Table 1. The basic information of the C. korshinskii and H. rhamnoides plots.
ParameterSample NumbersMean ± SD
C. korshinskiiH. rhamnoides
Geographical
parameters
Slope position--MiddleUpper
Slope aspect--SESE
Biological
parameters
Plant height (mm)901700 ± 120 a1913 ± 170 b
Basic diameter—twig (mm)
Basic diameter—branch (mm)
180
180
19.12 ± 0.21 a
15.93 ± 1.9 a
19.55 ± 0.33 a
13.55 ± 0.41 b
Projected area (m2)603.01 ± 0.46 a3.56 ± 0.22 b
Vegetation cover (%)
Stem number (per ha)
Leaf area index (LAI)
6
--
350
87 ± 11 a
21,450
1.03 ± 0.08, 1.57 ± 0.23, 2.14 ± 0.17, 2.15 ± 0.16 a
49 ± 7 b
10,210
0.92 ± 0.13, 1.16 ± 0.18
1.88 ± 0.19, 2.11 ± 0.21 a
Soil
parameters
Clay (<0.002 mm; %)39.16 ± 1.2111.05 ± 2.40
Sand (0.05–2 mm; %)315.26 ± 1.1712.26 ± 2.79
Silt (0.05–0.002 mm; %)375.61 ± 9.2276.71 ± 11.36
Organic matter (%)30.69 ± 0.070.72 ± 0.041
pH38.0 ± 0.957.8 ± 0.76
A compass was used to measure slope aspect and slope position; the LAI was measured using a canopy analyzer (LAI2000, LI–COR, Lincoln, USA) on 10 June, 11 July, 12 August, and 10 September; the vegetation cover was measured in September using a vegetation coverage measuring instrument (JZ-SH11, JiuzhouSX, China); the soil organic matter was measured using the potassium dichromate volumetric method; the pH was measured by potentiometry; the particle size distribution was measured using the sedimentation method. Soil properties are for the top 1 m. Data = mean ± SD. Results with different letters (a or b) are different with a p level < 0.05.
Table 2. The characteristics of 12 sampled C. korshinskii individuals and 12 H. rhamnoides individuals in the experiments.
SpeciesNumberDiameter (cm)Length (cm)Height (cm)Angle (°)Projected Area (m2)Canopy Bulk (m3)
C. korshinskii21 ± 6 a1.67 ± 0.21 a199 ± 22 a181 ± 13 a51 ± 9 a4.94 ± 1.2 a2.56 ± 0.43 a
H. rhamnoides13 ± 5 b1.78 ± 0.23 b210 ± 26 b201 ± 20 b56 ± 11 b4.13 ± 1.56 b2.83 ± 0.54 b
The upward branch angle to the ground was measured in degrees. Data = mean ± SD. Results with different letters (a or b) are different with a p level < 0.05.
Table 3. The characteristics of the 100 selected branch samples and 100 stem samples of C. korshinskii and H. rhamnoides in the scale-up method.
SpeciesnDiameter (cm)Length (cm)Leaf Area (cm2)
C. korshinskii1001.72 ± 0.26 a195 ± 20 a61.2 ± 8.7 a
H. rhamnoides1001.88 ± 0.23 b212 ± 24 b85.6 ± 7.1 b
Data = mean ± SD. Results with different letters (a or b) are different with a p level < 0.05.
Table 4. Analysis of variance for the effects of shrub species and biological parameters on canopy water storage capacities (n = 3).
Sources of VariationdfCanopy Water Storage Capacity (mm)
Shrub species (SS)10.12 ***
Biological parameters (BP)50.07 ***
SS × BP50.0062 *
Biological parameters: basic diameter, shrub height, leaf area, LAI, projected area, branch angle. * p ≥ 0.05; *** p ≤ 0.0001. df, degree of freedom.
Table 5. Correlation coefficients between the absolute water storage capacity (S) and basic diameter, shrub height, leaf area, LAI, projected area, and branch angle. n = 81.
Biological ParametersBasic Diameter (mm)Shrub Height (m)Leaf Area (cm2)LAIProjected Area (m2)Branch Angle (°)
S0.19 *0.17 *0.43 **0.50 ***0.49 ***−0.32 *
* p ≥ 0.05; ** p ≤ 0.001; *** p ≤ 0.0001.
Publisher’s Note: MDPI stays neutral with regard to jurisdictional claims in published maps and institutional affiliations.

