
Influence of Ozone and Drought on Tree Growth under Field Conditions in a 22 Year Time Series


Abstract
:1. Introduction
2. Materials and Methods
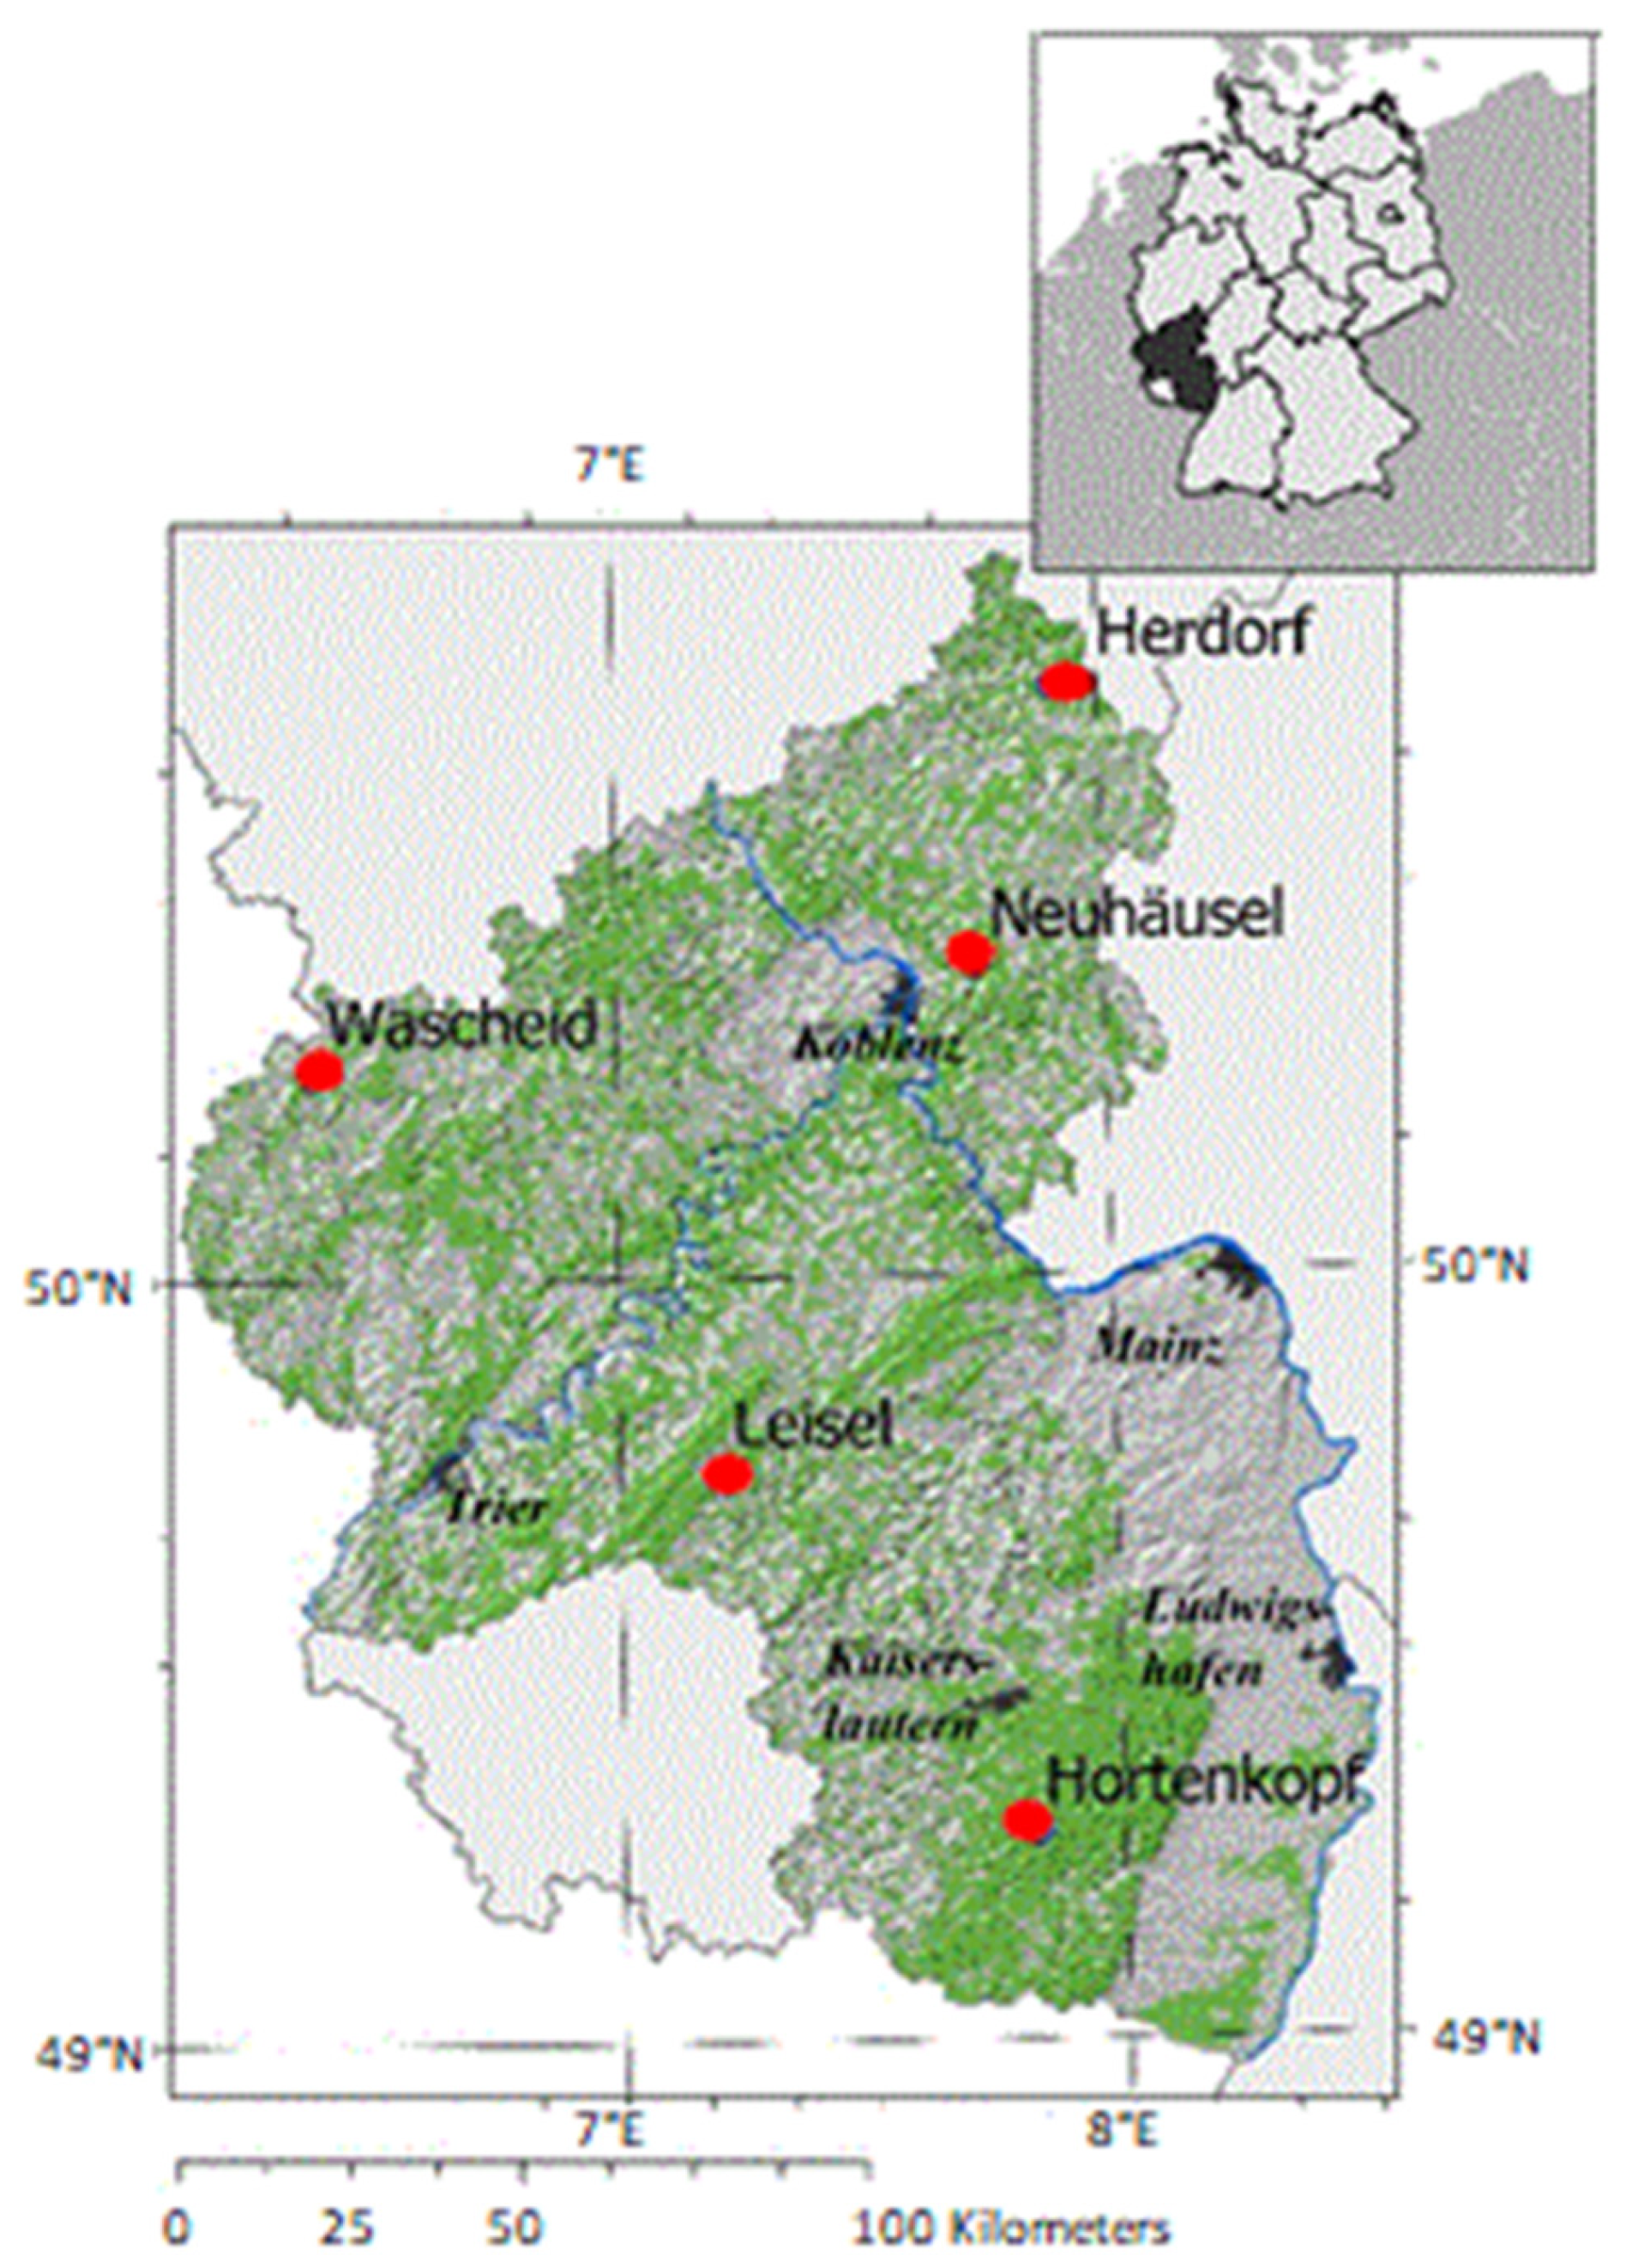
2.1. Site Description
2.2. Methods
2.2.1. Radial Growth and Basal Area Increment
2.2.2. Fructification
2.2.3. Ozone Flux
2.2.4. Comparison to Actual Yield Tables
2.2.5. Statistical Analyses
3. Results
3.1. POD1 and Potential Biomass Loss
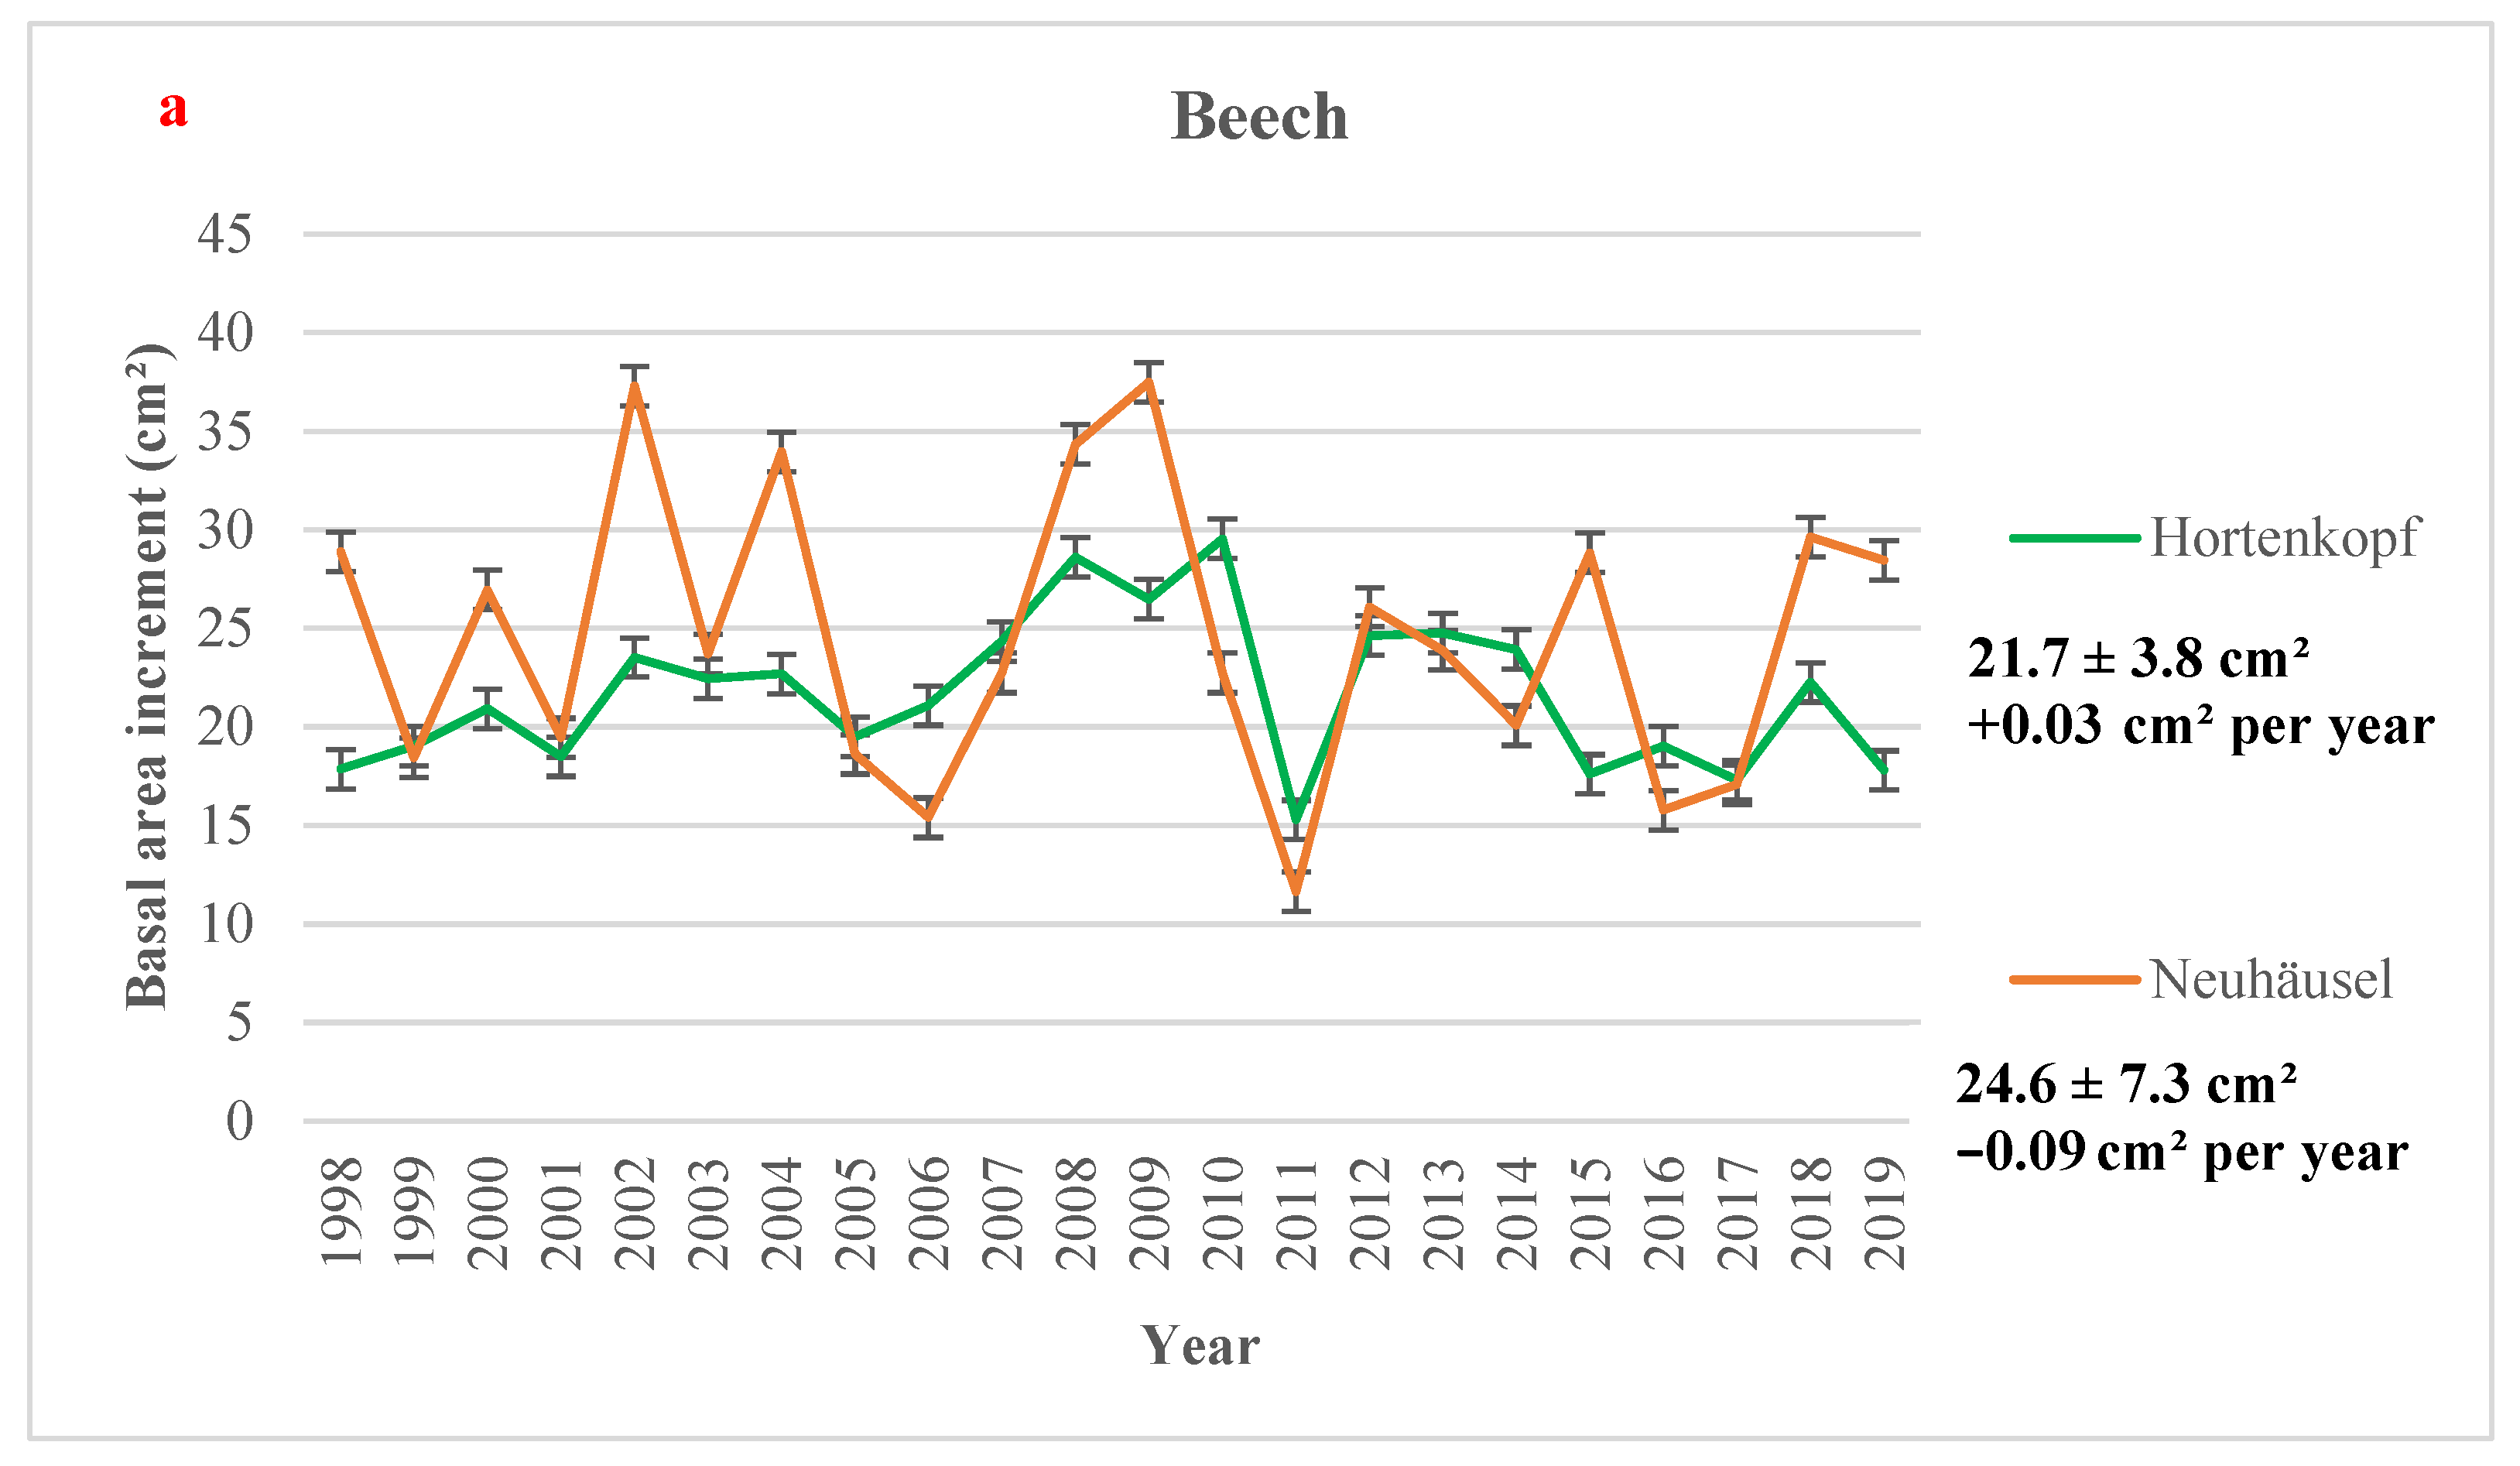
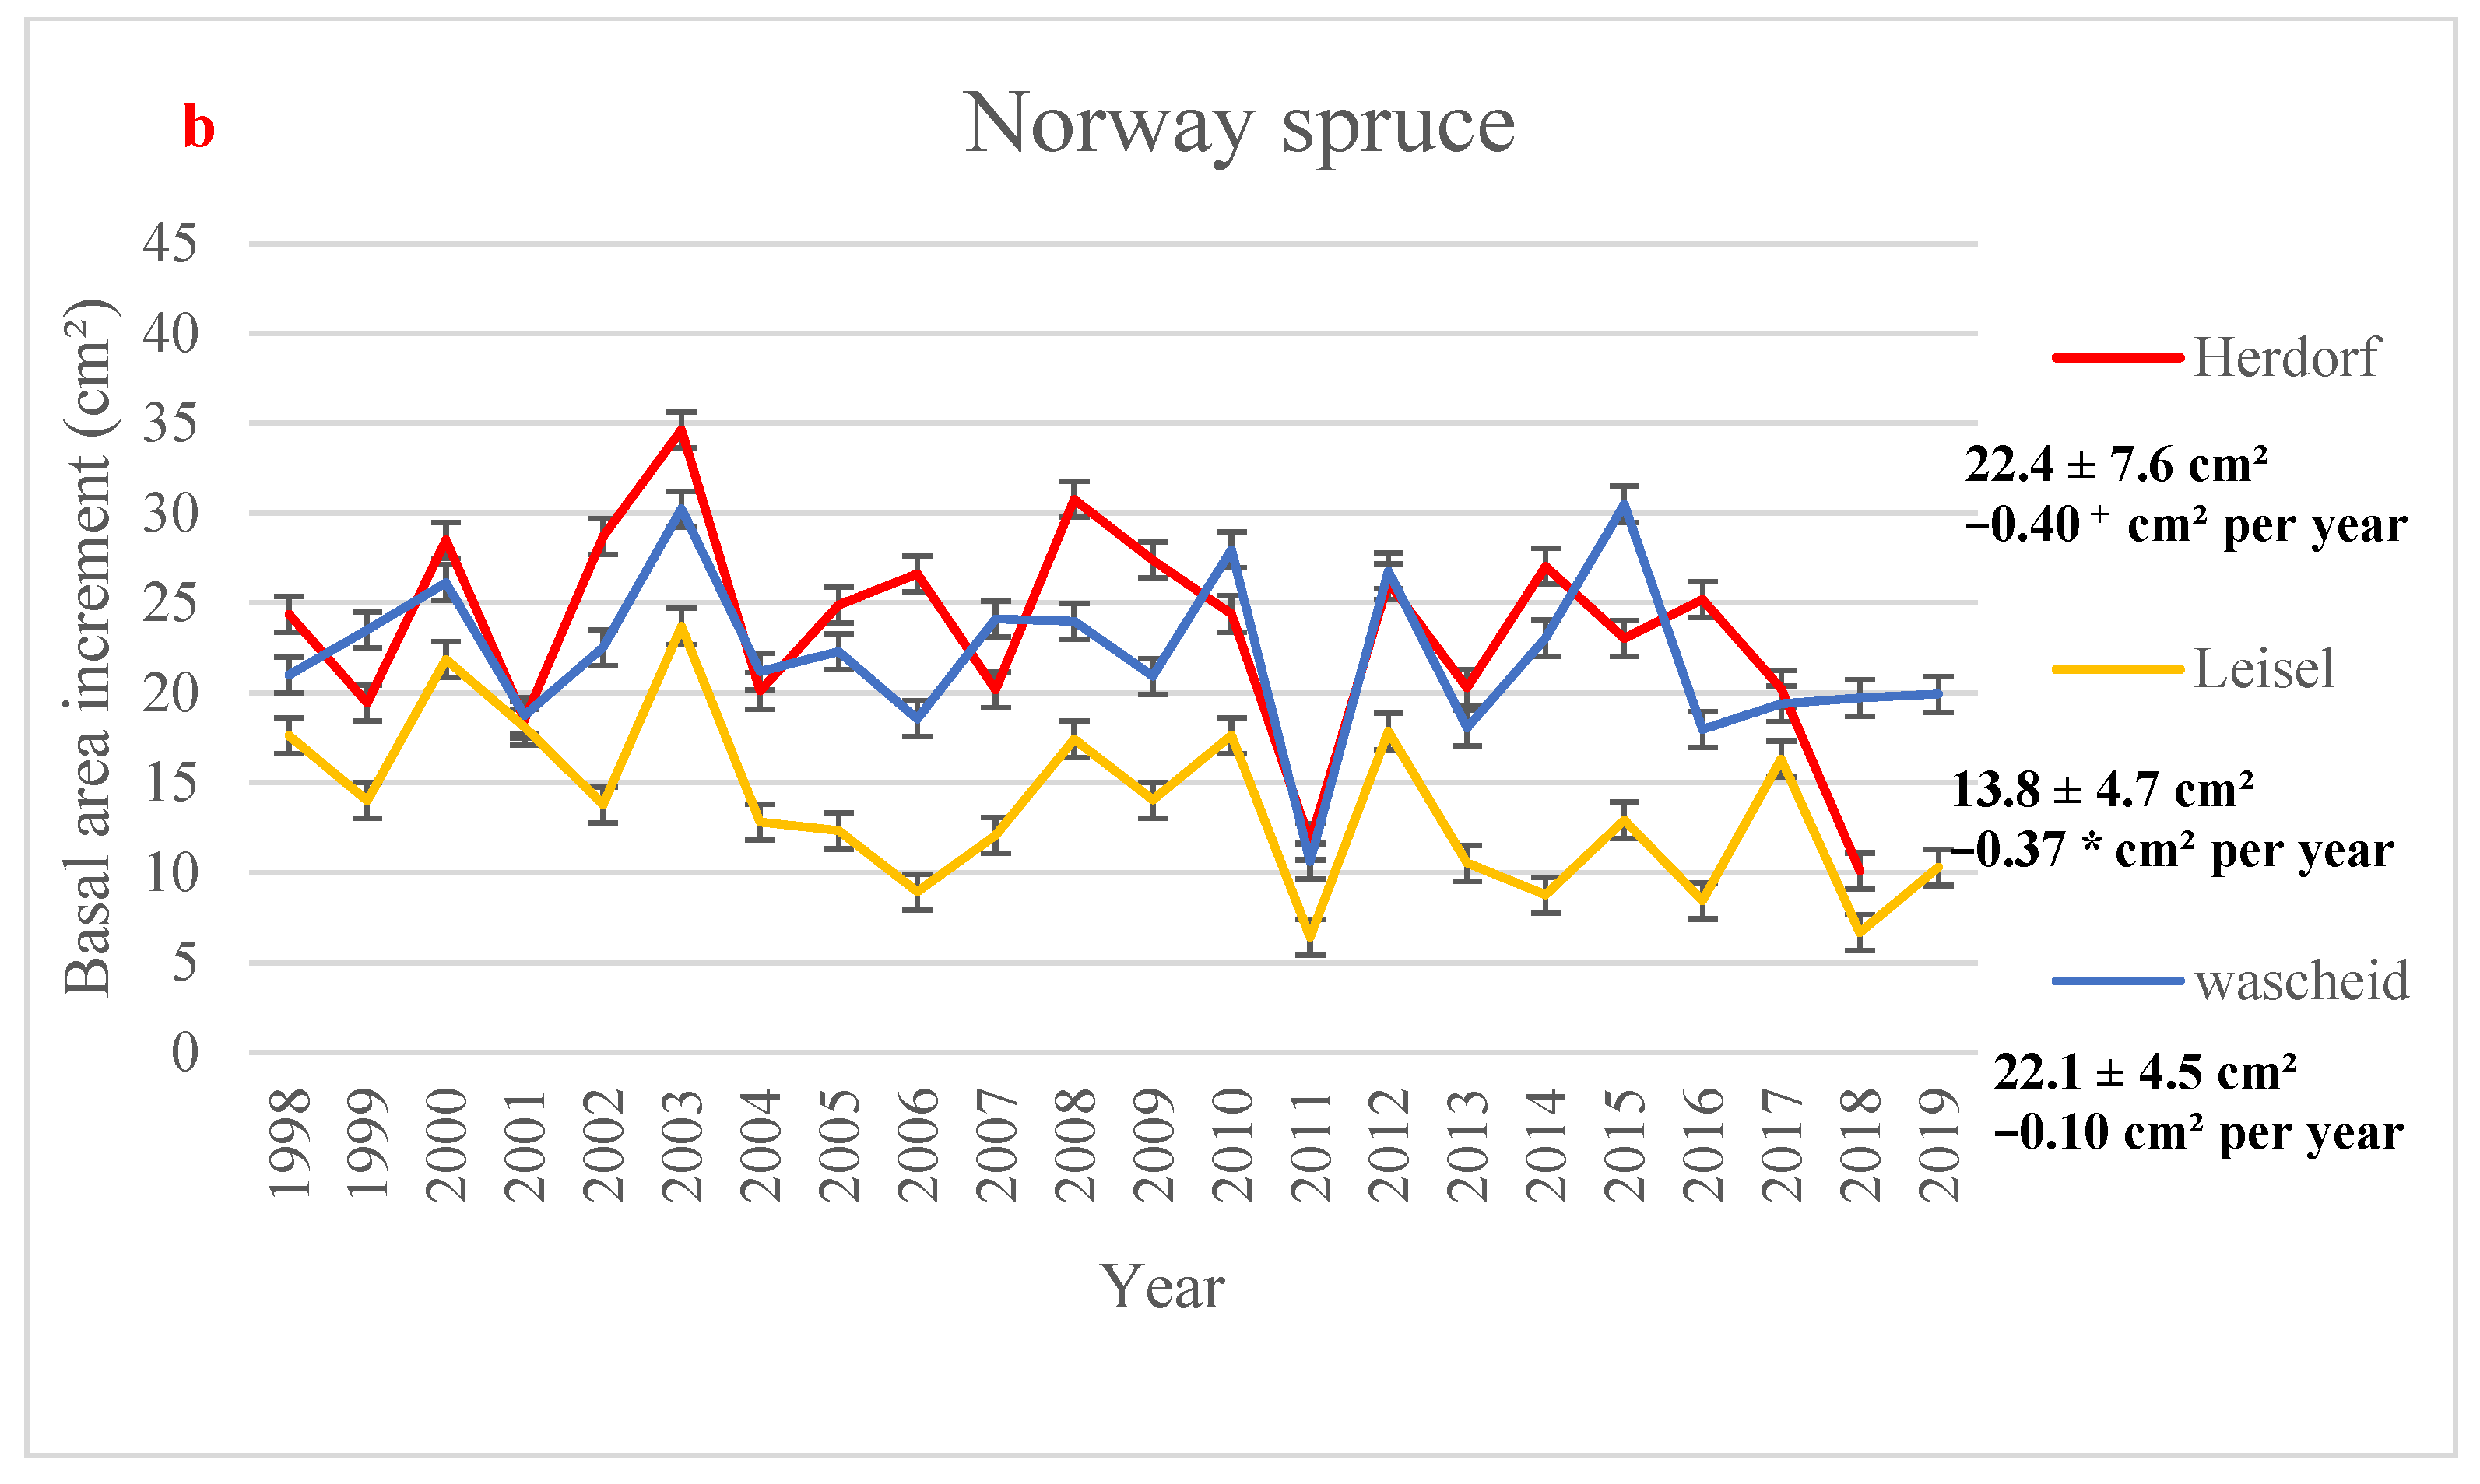
3.2. Basal Area Increment
3.3. Fructification
3.4. PCA Analysis
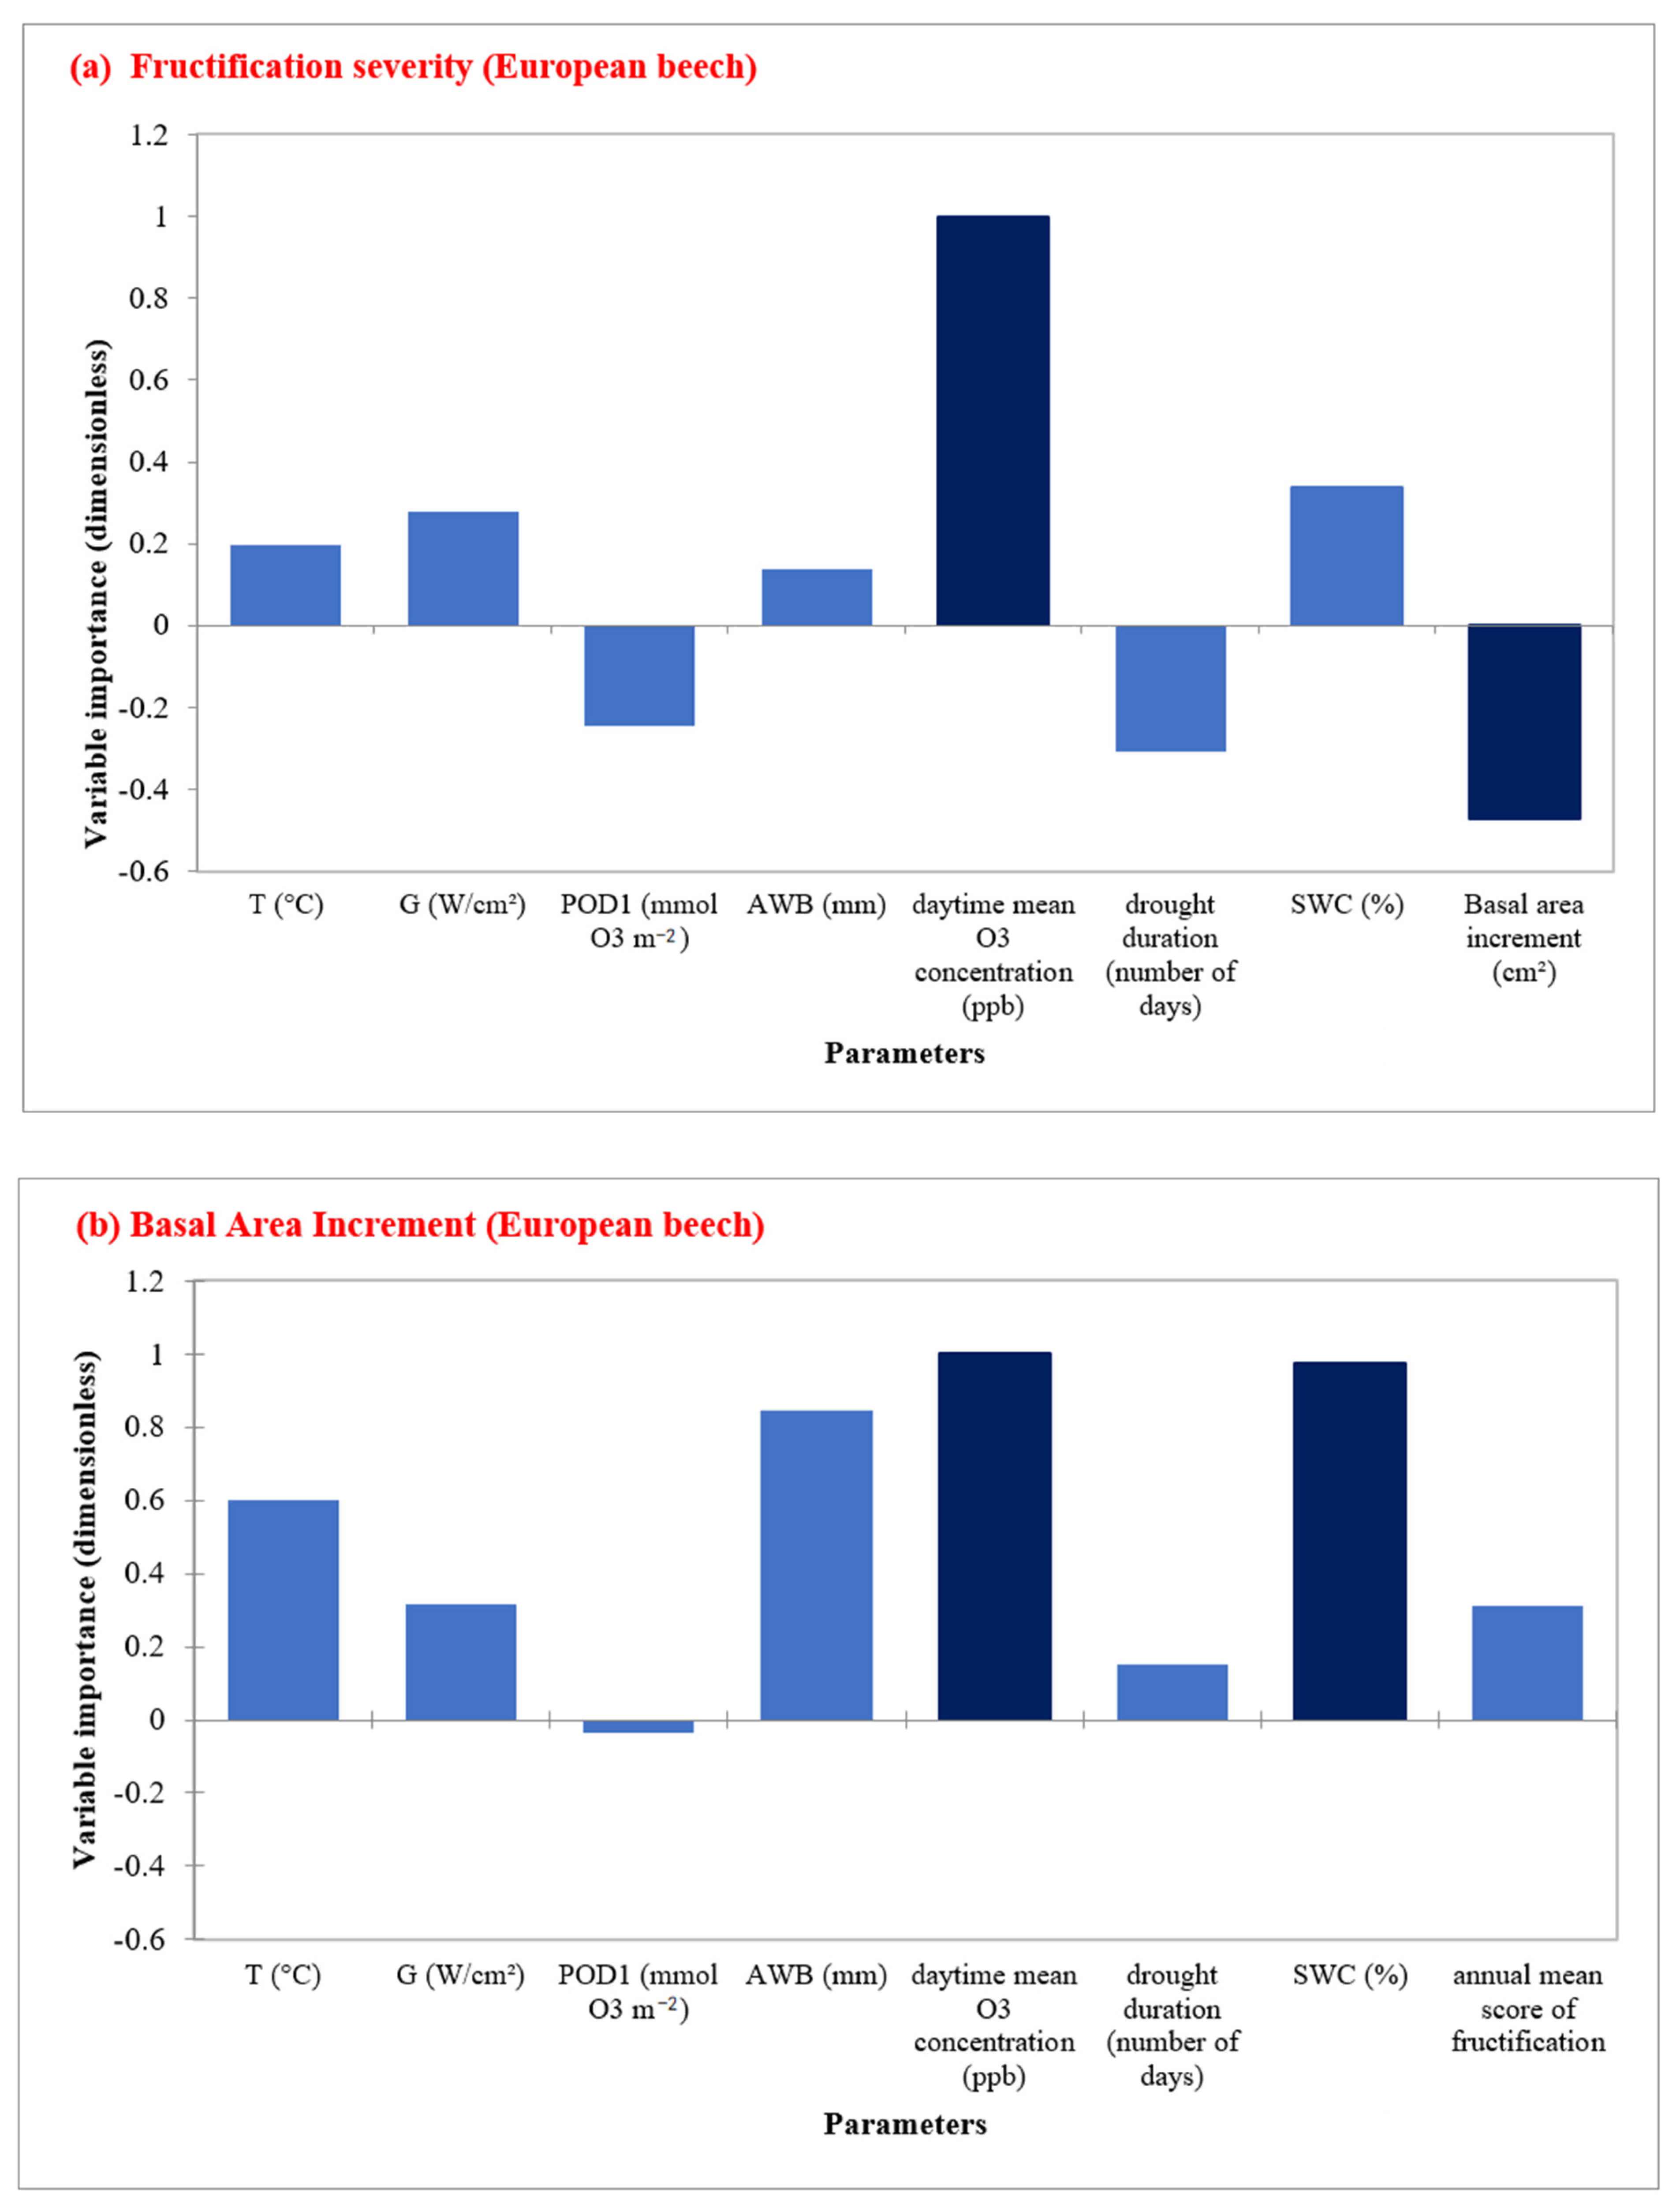
3.5. RFA Analysis
3.6. Comparison with Yield Tables
4. Discussion
5. Conclusions
Supplementary Materials
Author Contributions
Funding
Institutional Review Board Statement
Informed Consent Statement
Data Availability Statement
Acknowledgments
Conflicts of Interest
References
- Panek, J.; Saah, D.; Esperanza, A.; Bytnerowicz, A.; Fraczek, W.; Cisneros, R. Ozone distribution in remote ecologically vulnerable terrain of the southern Sierra Nevada, CA. Environ. Pollut. 2013, 182, 343–356. [Google Scholar] [CrossRef]
- Paoletti, E.; De Marco, A.; Anav, A.; Gasparini, P.; Pompei, E. Five-year volume growth of European beech does not respond to ozone pollution in Italy. Environ. Sci. Pollut. Res. 2018, 25, 8233–8239. [Google Scholar] [CrossRef] [PubMed]
- Proietti, C.; Fornasier, M.F.; Sicard, P.; Anav, A.; Paoletti, E.; De Marco, A. Trends in tropospheric ozone concentrations and forest impact metrics in Europe over the time period 2000–2014. J. For. Res. 2021, 32, 543–551. [Google Scholar] [CrossRef]
- De Marco, A.; Anav, A.; Sicard, P.; Feng, Z.; Paoletti, E. High spatial resolution ozone risk-assessment for Asian forests. Environ. Res. Lett. 2020, 15, 104095. [Google Scholar] [CrossRef]
- Anav, A.; De Marco, A.; Proietti, C.; Alessandri, A.; Dell’Aquila, A.; Cionni, I.; Vitale, M. Comparing concentration-based (AOT40) and stomatal uptake (PODY) metrics for ozone risk assessment to European forests. Glob. Chang. Biol. 2016, 22, 1608–1627. [Google Scholar] [CrossRef] [PubMed]
- Sicard, P.; Serra, R.; Rossello, P. Spatiotemporal trends in ground-level ozone concentrations and metrics in France over the time period 1999–2012. Environ. Res. 2016, 149, 122–144. [Google Scholar] [CrossRef] [PubMed]
- Anav, A.; De Marco, A.; Friedlingstein, P.; Savi, F.; Sicard, P.; Sitch, S.; Paoletti, E. Growing season extension affects ozone uptake by European forests. Sci. Total Environ. 2019, 669, 1043–1052. [Google Scholar] [CrossRef]
- Sicard, P.; Anav, A.; De Marco, A.; Paoletti, E. Projected global ground-level ozone impacts on vegetation under different emission and climate scenarios. Atmos. Chem. Phys. 2017, 17, 12177–12196. [Google Scholar] [CrossRef] [Green Version]
- Moura, B.B.; Alves, E.S.; Marabesi, M.A.; de Souza, S.R.; Schaub, M.; Vollenweider, P. Ozone affects leaf physiology and causes injury to foliage of native tree species from the tropical Atlantic Forest of southern Brazil. Sci. Total Environ. 2018, 610, 912–925. [Google Scholar] [CrossRef] [PubMed]
- Sicard, P.; De Marco, A.; Carrari, E.; Dalstein-Richier, L.; Hoshika, Y.; Badea, O.; Paoletti, E. Epidemiological derivation of flux-based critical levels for visible ozone injury in European forests. J. For. Res. 2020, 31, 1509–1519. [Google Scholar] [CrossRef]
- Hoshika, Y.; Fares, S.; Savi, F.; Gruening, C.; Goded, I.; De Marco, A.; Paoletti, E. Stomatal conductance models for ozone risk assessment at canopy level in two Mediterranean evergreen forests. Agric. For. Meteorol. 2017, 234, 212–221. [Google Scholar] [CrossRef]
- Hoshika, Y.; Watanabe, M.; Kitao, M.; Häberle, K.H.; Grams, T.E.; Koike, T.; Matyssek, R. Ozone induces stomatal narrowing in European and Siebold’s beeches: A comparison between two experiments of free-air ozone exposure. Environ. Pollut. 2015, 196, 527–533. [Google Scholar] [CrossRef] [PubMed]
- Proietti, C.; Anav, A.; De Marco, A.; Sicard, P.; Vitale, M. A multi-site analysis on the ozone effects on Gross Primary Production of European forests. Sci. Total Environ. 2016, 556, 1–11. [Google Scholar] [CrossRef] [PubMed]
- Cailleret, M.; Ferretti, M.; Gessler, A.; Rigling, A.; Schaub, M. Ozone effects on European forest growth—Towards an integrative approach. J. Ecol. 2018, 106, 1377–1389. [Google Scholar] [CrossRef]
- Chappelka, A.H.; Samuelson, L.J. Ambient ozone effects on forest trees of the eastern United States: A review. New Phytol. 1998, 139, 91–108. [Google Scholar] [CrossRef]
- Skärby, L.; Ro-Poulsen, H.; Wellburn, F.A.; Sheppard, L.J. Impacts of ozone on forests: A European perspective. New Phytol. 1998, 139, 109–122. [Google Scholar] [CrossRef]
- Karnosky, D.F.; Werner, H.; Holopainen, T.; Percy, K.; Oksanen, T.; Oksanen, E.; Matyssek, R. Free-air exposure systems to scale up ozone research to mature trees. Plant Biol. 2007, 9, 181–190. [Google Scholar] [CrossRef] [Green Version]
- Wittig, V.E.; Ainsworth, E.A.; Naidu, S.L.; Karnosky, D.F.; Long, S.P. Quantifying the impact of current and future tropospheric ozone on tree biomass, growth, physiology and biochemistry: A quantitative meta-analysis. Glob. Chang. Biol. 2009, 15, 396–424. [Google Scholar] [CrossRef]
- Matyssek, R.; Bytnerowicz, A.; Karlsson, P.E.; Paoletti, E.; Sanz, M.; Schaub, M.; Wieser, G. Promoting the O3 flux concept for European forest trees. Environ. Pollut. 2007, 146, 587–607. [Google Scholar] [CrossRef]
- Manning, W.J. Establishing a cause-and-effect relationship for ambient ozone exposure and tree growth in the forest: Progress and an experimental approach. Environ. Pollut. 2005, 137, 443–454. [Google Scholar] [CrossRef]
- Braun, S.; Schindler, C.; Rihm, B. Growth trends of beech and Norway spruce in Switzerland: The role of nitrogen deposition, ozone, mineral nutrition and climate. Sci. Total Environ. 2017, 599, 637–646. [Google Scholar] [CrossRef]
- Nabuurs, G.J.; Lindner, M.; Verkerk, P.J.; Gunia, K.; Deda, P.; Michalak, R.; Grassi, G. First signs of carbon sink saturation in European forest biomass. Nat. Clim. Chang. 2013, 3, 792–796. [Google Scholar] [CrossRef]
- Martinez del Castillo, E.; Zang, C.S.; Buras, A.; Hacket-Pain, A.; Esper, J.; Serrano-Notivoli, R.; de Luis, M. Climate-change-driven growth decline of European beech forests. Commun. Biol. 2022, 5, 163. [Google Scholar] [CrossRef]
- Braun, S.; Schindler, C.; Rihm, B. Growth losses in Swiss forests caused by ozone: Epidemiological data analysis of stem increment of Fagus sylvatica L. and Picea abies Karst. Environ. Pollut. 2014, 192, 129–138. [Google Scholar] [CrossRef] [PubMed]
- Charru, M.; Seynave, I.; Morneau, F.; Bontemps, J.D. Recent changes in forest productivity: An analysis of national forest inventory data for common beech (Fagus sylvatica L.) in north-eastern France. For. Ecol. Manag. 2010, 260, 864–874. [Google Scholar] [CrossRef]
- Gschwantner, T. Zuwachsänderungen nach den Daten der Österreichischen Waldinventur und ihre klimatischen Ursachen: Abdruck der im April 2004 approbierten Dissertation, no. 133. Ph.D. Thesis, Bundesforschungs-und Ausbildungszentrum für Wald, Naturgefahren und Landschaft, Wien, Austria, 2006. [Google Scholar]
- Jump, A.S.; Hunt, J.M.; Penuelas, J. Rapid climate change-related growth decline at the southern range edge of Fagus sylvatica. Glob. Change Biol. 2006, 12, 2163–2174. [Google Scholar] [CrossRef] [Green Version]
- Piovesan, G.; Biondi, F.; Filippo, A.D.; Alessandrini, A.; Maugeri, M. Drought-driven growth reduction in old beech (Fagus sylvatica L.) forests of the central Apennines, Italy. Glob. Chang. Biol. 2008, 14, 1265–1281. [Google Scholar] [CrossRef]
- Wipfler, P.; Seifert, T.; Heerdt, C.; Werner, H.; Pretzsch, H. Growth of adult Norway spruce (Picea abies [L.] Karst.) and European beech (Fagus sylvatica L.) under free-air ozone fumigation. Plant Biol. 2005, 7, 611–618. [Google Scholar] [CrossRef] [Green Version]
- Dittmar, C.; Zech, W.; Elling, W. Growth variations of common beech (Fagus sylvatica L.) under different climatic and environmental conditions in Europe—A dendroecological study. For. Ecol. Manag. 2003, 173, 63–78. [Google Scholar] [CrossRef]
- Mäkinen, H.; Nöjd, P.; Kahle, H.P.; Neumann, U.; Tveite, B.; Mielikäinen, K.; Spiecker, H. Radial growth variation of Norway spruce (Picea abies (L.) Karst.) across latitudinal and altitudinal gradients in central and northern Europe. For. Ecol. Manag. 2002, 171, 243–259. [Google Scholar] [CrossRef]
- Angert, A.; Biraud, S.; Bonfils, C.; Henning, C.C.; Buermann, W.; Pinzon, J.; Fung, I. Drier summers cancel out the CO2 uptake enhancement induced by warmer springs. Proc. Natl. Acad. Sci. USA 2005, 102, 10823–10827. [Google Scholar] [CrossRef] [PubMed] [Green Version]
- Hacket-Pain, A.J.; Cavin, L.; Friend, A.D.; Jump, A.S. Consistent limitation of growth by high temperature and low precipitation from range core to southern edge of European beech indicates widespread vulnerability to changing climate. Eur. J. For. Res. 2016, 135, 897–909. [Google Scholar] [CrossRef] [Green Version]
- Obladen, N.; Dechering, P.; Skiadaresis, G.; Tegel, W.; Keßler, J.; Höllerl, S.; Seim, A. Tree mortality of European beech and Norway spruce induced by 2018–2019 hot droughts in central Germany. Agric. For. Meteorol. 2021, 307, 108482. [Google Scholar] [CrossRef]
- Hacket-Pain, A.J.; Friend, A.D.; Lageard, J.G.; Thomas, P.A. The influence of masting phenomenon on growth–climate relationships in trees: Explaining the influence of previous summers’ climate on ring width. Tree Physiol. 2015, 35, 319–330. [Google Scholar] [CrossRef] [PubMed]
- CLRTAP. Mapping Critical Levels for Vegetation, Chapter III of Manual on Methodologies and Criteria for Modelling and Mapping Critical Loads and Levels and Air Pollution Effects, Risks and Trends UNECE Convention on Long-Range Transboundary Air Pollution. 2017. Available online: http://icpvegetation.ceh.ac.uk/ (accessed on 20 May 2022).
- Braun, S.; Rihm, B.; Schindler, C. Epidemiological Estimate of Growth Reduction by Ozone in Fagus sylvatica L. and Picea abies Karst.: Sensitivity Analysis and Comparison with Experimental Results. Plants 2022, 11, 777. [Google Scholar] [CrossRef]
- Büker, P.; Feng, Z.; Uddling, J.; Briolat, A.; Alonso, R.; Braun, S.; Emberson, L.D. New flux based dose–response relationships for ozone for European forest tree species. Environ. Pollut. 2015, 206, 163–174. [Google Scholar] [CrossRef]
- Karlsson, P.E.; Braun, S.; Broadmeadow, M.; Elvira, S.; Emberson, L.; Gimeno, B.S.; Wilkinson, M. Risk assessments for forest trees: The performance of the ozone flux versus the AOT concepts. Environ. Pollut. 2007, 146, 608–616. [Google Scholar] [CrossRef] [PubMed]
- Mills, G.; Pleijel, H.; Braun, S.; Büker, P.; Bermejo, V.; Calvo, E.; Simpson, D. New stomatal flux-based critical levels for ozone effects on vegetation. Atmos. Environ. 2011, 45, 5064–5068. [Google Scholar] [CrossRef]
- Emberson, L.D.; Ashmore, M.R.; Cambridge, H.M.; Simpson, D.; Tuovinen, J.P. Modelling stomatal ozone flux across Europe. Environ. Pollut. 2000, 109, 403–413. [Google Scholar] [CrossRef]
- Paoletti, E.; Alivernini, A.; Anav, A.; Badea, O.; Carrari, E.; Chivulescu, S.; Hoshika, Y. Toward stomatal–flux based forest protection against ozone: The MOTTLES approach. Sci. Total Environ. 2019, 691, 516–527. [Google Scholar] [CrossRef] [PubMed]
- Pretzsch, H.; Grams, T.; Häberle, K.H.; Pritsch, K.; Bauerle, T.; Rötzer, T. Growth and mortality of Norway spruce and European beech in monospecific and mixed-species stands under natural episodic and experimentally extended drought. Results of the KROOF throughfall exclusion experiment. Trees 2020, 34, 957–970. [Google Scholar] [CrossRef]
- ICP Forests Manual 2016—Part I. 2016. Available online: https://www.icp-forests.org/pdf/manual/2016/Manual_Part_I.pdf (accessed on 20 May 2022).
- Rheinlandpfalz Landesamt Für Umwelt. Available online: www.luft-rlp.de (accessed on 20 May 2022).
- Eghdami, H.; Werner, W.; Büker, P. Spatio-Temporal Variation of Ozone Concentrations and Ozone Uptake Conditions in Forests in Western Germany. Atmosphere 2020, 11, 1261. [Google Scholar] [CrossRef]
- Eghdami, H.; Werner, W.; Büker, P.; Sicard, P. Assessment of ozone risk to Central European forests: Time series indicates perennial exceedance of ozone critical levels. Environ. Res. 2022, 203, 111798. [Google Scholar] [CrossRef] [PubMed]
- Dobler, L.; Hinterding, A.; Gerlach, N. INTERMET—Interpolation Stündlicher und Tagesbasierter Meteorologischer Parameter—Gesamtdokumentation; Unveröffentlichter Projektbericht, Institut für Geoinformatik der Universität Münster: Münster, Germany, 2004. [Google Scholar]
- United Nations Economic Commission for Europe. ICP Forest Manual Part IV—Visual Assessment of Crown Condition and Damaging Agents; UNECE: Geneva, Switzerland, 2020. [Google Scholar]
- Lockwood, B.R.; Maxwell, J.T.; Robeson, S.M.; Au, T.F. Assessing bias in diameter at breast height estimated from tree rings and its effects on basal area increment and biomass. Dendrochronologia 2021, 67, 125844. [Google Scholar] [CrossRef]
- Bouriaud, O.; Bréda, N.; Dupouey, J.L.; Granier, A. Is ring width a reliable proxy for stem-biomass increment? A case study in European beech. Can. J. For. Res. 2005, 35, 2920–2933. [Google Scholar] [CrossRef]
- Livingston, W.H.; Pontius, J.; Costanza, K.K.; Trosper, S. Using changes in basal area increments to map relative risk of HWA impacts on hemlock growth across the Northeastern USA. Biol. Invasions 2017, 19, 1577–1595. [Google Scholar] [CrossRef]
- Vospernik, S. Basal area increment models accounting for climate and mixture for Austrian tree species. For. Ecol. Manag. 2021, 480, 118725. [Google Scholar] [CrossRef]
- Begon, M.; Mortimer, M. Population Ecology: A Unified Study of Animals and Plants; Sinauer: Sunderland, MA, USA, 1986. [Google Scholar]
- Büker, P.; Morrissey, T.; Briolat, A.; Falk, R.; Simpson, D.; Tuovinen, J.P.; Alonso, R.; Barth, S.; Baumgarten, M.; Grulke, N.; et al. DO 3 SE modelling of soil moisture to determine ozone flux to forest trees. Atmos. Chem. Phys. 2012, 12, 5537–5562. [Google Scholar] [CrossRef] [Green Version]
- Nunn, A.J.; Kozovits, A.R.; Reiter, I.M.; Heerdt, C.; Leuchner, M.; Lütz, C.; Liu, X.; Löw, M.; Winkler, J.B.; Grams, T.E.E.; et al. Comparison of ozone uptake and sensitivity between a phytotronstudy with young beech and a field experiment with adult beech (Fagus sylvatica). Environ. Pollut. 2005, 137, 494–506. [Google Scholar] [CrossRef] [PubMed]
- Fares, S.; Savi, F.; Muller, J.; Matteucci, G.; Paoletti, E. Simultaneousmeasurements ofabove and below canopy ozone fluxes help partitioning ozone deposition between ist various sinks in a Mediterranean Oak Forest. Agric. For. Meteorol. 2014, 198–199, 181–191. [Google Scholar] [CrossRef]
- Bender, J.; Bergmann, E.; Weigel, H.J.; Grünhage, L.; Schröder, M.; Builtjes, P.; Schaap, M.K.; Wichink Kruit, R.; Stern, R.; Baumgarten, M.; et al. Anwendung und Überprüfung neuer Methoden zur Flächenhaften Bewertung der Auswirkung von Bodennahem Ozon auf die Biodiversität Terrestrischer Ökosysteme. 2015. Available online: https://www.umweltbundesamt.de/publikationen/anwendung-ueberpruefung-neuer-methoden-zur (accessed on 20 May 2022).
- Albert, M.; Nagel, J.; Schmidt, M.; Nagel, R.-V.; Spellmann, H. Neue Ertragstafel für Fichte und Buche. Nordwestdeutsche Forstliche Versuchsanstalt (Hrsg.). 2021. Available online: https://www.nw-fva.de/unterstuetzen/waldpflege-und-nutzung/neue-ertragstafeln (accessed on 20 May 2021).
- Breiman, L. Random forests. Mach. Learn. 2001, 45, 5–32. [Google Scholar] [CrossRef] [Green Version]
- Araminienė, V.; Sicard, P.; Anav, A.; Agathokleous, E.; Stakėnas, V.; De Marco, A.; Girgždienė, R. Trends and inter-relationships of ground-level ozone metrics and forest health in Lithuania. Sci. Total Environ. 2019, 658, 1265–1277. [Google Scholar] [CrossRef]
- Sicard, P.; Hoshika, Y.; Carrari, E.; De Marco, A.; Paoletti, E. Testing visible ozone injury within a Light Exposed Sampling Site as a proxy for ozone risk assessment for European forests. J. For. Res. 2021, 32, 1351–1359. [Google Scholar] [CrossRef]
- Dohrenbusch, A.; Jaehne, S.; Bredemeier, M.; Lamersdorf, N. Growth and fructification of a Norway spruce (Picea abies L. Karst) forest ecosystem under changed nutrient and water input. Ann. For. Sci. 2002, 59, 359–368. [Google Scholar] [CrossRef]
- Schäfer, C.; Rötzer, T.; Thurm, E.A.; Biber, P.; Kallenbach, C.; Pretzsch, H. Growth and tree water deficit of mixed Norway spruce and European beech at different heights in a tree and under heavy drought. Forests 2019, 10, 577. [Google Scholar] [CrossRef] [Green Version]
- Sánchez-Salguero, R.; Navarro-Cerrillo, R.M.; Camarero, J.J.; Fernández-Cancio, Á. Selective drought-induced decline of pine species in southeastern Spain. Clim. Change 2012, 113, 767–785. [Google Scholar] [CrossRef]
- Adams, H.D.; Kolb, T.E. Tree growth response to drought and temperature in a mountain landscape in northern Arizona, USA. J. Biogeogr. 2005, 32, 1629–1640. [Google Scholar] [CrossRef]
- Granier, A.; Reichstein, M.; Bréda, N.; Janssens, I.A.; Falge, E.; Ciais, P.; Wang, Q. Evidence for soil water control on carbon and water dynamics in European forests during the extremely dry year: 2003. Agric. For. Meteorol. 2007, 143, 123–145. [Google Scholar] [CrossRef]
- Castagneri, D.; Nola, P.; Motta, R.; Carrer, M. Summer climate variability over the last 250 years differently affected tree species radial growth in a mesic Fagus–Abies–Picea old-growth forest. For. Ecol. Manag. 2014, 320, 21–29. [Google Scholar] [CrossRef]
- Agyei, T.; Jurán, S.; Kwakye, K.O.; Šigut, L.; Urban, O.; Marek, M.V. The impact of drought on total ozone flux in a mountain Norway spruce forest. J. For. Sci. 2020, 66, 280–287. [Google Scholar] [CrossRef]
- Juraň, S.; Edwards-Jonašova, M.; Cudlin, P.; Zapletal, M.; Šigut, L.; Grace, J.; Urban, O. Prediction of ozone effects on net ecosystem production of Norway spruce forest. iForest 2018, 11, 743–750. [Google Scholar] [CrossRef] [Green Version]
- Braun, S.; Schindler, C.; Rihm, B.; Flückiger, W. Shoot growth of mature Fagus sylvatica and Picea abies in relation to ozone. Environ. Pollut. 2007, 146, 624–628. [Google Scholar] [CrossRef] [PubMed]
- Seifert, T.; Müller-Starck, G. Impacts of fructification on biomass production and correlated genetic effects in Norway spruce (Picea abies [L.] Karst.). Eur. J. For. Res. 2009, 128, 155–169. [Google Scholar] [CrossRef]
- Kohler, M.; Sohn, J.; Nägele, G.; Bauhus, J. Can drought tolerance of Norway spruce (Picea abies (L.) Karst.) be increased through thinning? Eur. J. For. Res. 2010, 129, 1109–1118. [Google Scholar] [CrossRef]
- Chapin, F.S., III; Schulze, E.D.; Mooney, H.A. The ecology and economics of storage in plants. Annu. Rev. Ecol. Syst. 1990, 21, 423–447. [Google Scholar] [CrossRef]


| Station Name | Latitude Longitude | Elevation (m a.s.l.) | Main Tree Species | Age of Trees [Years in 2015] | Forest Canopy Height (m) | Distance between Forest Plot and ZIMEN Station (km) | |
|---|---|---|---|---|---|---|---|
| ZIMEN Station | Forest Plot | ||||||
| Hortenkopf | 49°27′ N 07°82′ E | 606 | 550 | European beech | 60 | 25 | 1.2 |
| Neuhäusel | 50°42′ N 07°73′ E | 540 | 390 | European beech | 123 | 35 | 2.2 |
| Herdorf | 50°76′ N 07°90′ E | 480 | 440 | Norway spruce | 101 | 30 | 4.6 |
| Leisel | 49°74′ N 07°19′ E | 650 | 660 | Norway spruce | 137 | 31 | 0.4 |
| Wascheid | 50°26′ N 06°37′ E | 680 | 690 | Norway spruce | 109 | 30 | 0.6 |
| European Beech | Norway Spruce | ||||
|---|---|---|---|---|---|
| Hortenkopf | Neuhäusel | Herdorf | Leisel | Wascheid | |
| Number of trees for annual measurements of radial growth | 26–30 | 41 | 82–92 | 88 | 74–77 |
| Total number of observations of basal area increment from 1998 to 2019 | 632 | 902 | 1780 | 1936 | 1661 |
| Number of observation for fructification per year (min-max) *, ** | 0–43 | 24–47 | 80–143 | 68–98 | 70–79 |
| Hortenkopf | Neuhäusel | Herdorf | Leisel | Wascheid | |
|---|---|---|---|---|---|
| POD1 (mmol/m2 per leaf area) | 21.94 ± 4.3 | 21.11 ± 3.0 | 20.20 ± 2.7 | 25.50 ± 2.4 | 22.75 ± 2.8 |
| Trend in POD1 (mmol/m2 per year) | −0.56 *** | −0.17 * | −0.26 *** | −0.11 | −0.24 * |
| (a) Potential max. rate of reduction (%) | 15.6 ± 4.0 | 14.8 ± 2.8 | 2.4 ± 0.6 | 3.6 ± 0.5 | 3.0 ± 0.6 |
| (b) Potential max. rate of reduction_1980 (%) | 8.3 ± 4.0 | 7.6 ± 2.8 | 1.2 ±0.5 | 2.3 ± 0.5 | 1.6 ± 0.6 |
| Sites | Yield Table | Measured | Significance between Yield Table and Measured Values |
|---|---|---|---|
| Regression analysis of Brest Height Diameter [cm] | |||
| Hortenkopf | y = 0.6225x − 1227.2 | y = 0.5660x − 1110.9 | * |
| Neuhäusel * | y = 0.6345x − 1220.4 | y = 0.3149x − 583.93 | * |
| y = 0.4959x − 950.48 | * | ||
| Herdorf | y = 0.3433x − 649.44 | y = 0.3544x − 670.85 | * |
| Leisel | y = 0.4571x − 871.38 | y = 0.1900x − 340.20 | * |
| Wascheid | y = 0.3566x − 670.51 | y = 0.3125x − 582.45 | * |
| Regression analysis of Basal Area Increment [cm2] | |||
| Hortenkopf | y = 17.004x − 33788 | y = 21.272x − 42170 | * |
| Neuhäusel * | y = 32.292x − 63304 | y = 24.383x − 47075 | * |
| y = 44.244x − 86789 | * | ||
| Herdorf | y = 21.361x − 41677 | y = 22.953x − 44749 | * |
| Leisel | y = 14.514x − 28001 | y = 14.000x − 26714 | * |
| Wascheid | y = 21.650x − 43029 | y = 22.090x − 42731 | * |
Publisher’s Note: MDPI stays neutral with regard to jurisdictional claims in published maps and institutional affiliations. |
© 2022 by the authors. Licensee MDPI, Basel, Switzerland. This article is an open access article distributed under the terms and conditions of the Creative Commons Attribution (CC BY) license (https://creativecommons.org/licenses/by/4.0/).
Share and Cite
Eghdami, H.; Werner, W.; De Marco, A.; Sicard, P. Influence of Ozone and Drought on Tree Growth under Field Conditions in a 22 Year Time Series. Forests 2022, 13, 1215. https://doi.org/10.3390/f13081215
Eghdami H, Werner W, De Marco A, Sicard P. Influence of Ozone and Drought on Tree Growth under Field Conditions in a 22 Year Time Series. Forests. 2022; 13(8):1215. https://doi.org/10.3390/f13081215
Chicago/Turabian StyleEghdami, Hanieh, Willy Werner, Alessandra De Marco, and Pierre Sicard. 2022. "Influence of Ozone and Drought on Tree Growth under Field Conditions in a 22 Year Time Series" Forests 13, no. 8: 1215. https://doi.org/10.3390/f13081215