Article

The Strategy for Optimizing the Stand Structure of Pinus tabuliformis Carr. Forests to Enhance the Ecological Function on the Loess Plateau, China

1
College of Soil and Water Conservation, Beijing Forestry University, Beijing 100083, China
2
National Observation and Research Station, Linfen 042200, China
3
Key Laboratory of State Forestry Administration on Soil and Water Conservation, Beijing Forestry University, Beijing 100083, China
4
Beijing Engineering Research Centre of Soil and Water Conservation, Beijing Forestry University, Beijing 100083, China
*
Author to whom correspondence should be addressed.
Forests 2022, 13(8), 1217; https://doi.org/10.3390/f13081217
Submission received: 8 June 2022 / Revised: 20 July 2022 / Accepted: 31 July 2022 / Published: 2 August 2022
(This article belongs to the Section Forest Ecology and Management)

Abstract

:
The enhancement of the ecological functions of forests through stand structure optimization is a key issue for high-quality forestry and its sustainable development on the Loess Plateau. In this study, fifty standard plots of Pinus tabuliformis Carr. forest were established in the Loess Plateau of western Shanxi, China. Eleven factors of the stand structure, three topographical factors, and four functional indices of the ecological function, including 20 sub-functional indices, were investigated and monitored. The study results indicated that the stand structure and topographical conditions could significantly affect the ecological functions of the Pinus tabuliformis forest, which was primarily reflected in the water-holding function, soil improvement function, and diversity function of understory plants, but had little effect on the function of reducing runoff and sediment yield on slope. We found that the stand density and uniform angle index could be used to achieve the optimal regulation of the stand structure to enhance the ecological functions of the Pinus tabuliformis forest. Overall, the optimization strategy for the stand structure of Pinus tabuliformis on the Loess Plateau should be to (1) determine the characteristics of the regulation target by understanding the stand structure and its ecological function characteristics through stand surveys on the altitude of the stand, stand density, uniform angle index of the individual trees in the sample plot, and average uniform angle index of the sample plot; (2) determine the optimization target by quantifying and analyzing the ecological functions of the stand, selecting a certain functional index as the optimization target, and specifying the degree of improvement in the functional index; and (3) substitute the optimization target and elevation of the stand into the corresponding stand structure optimization model and determine the regulation direction and regulation range of the stand density, uniform angle index, and specific stand structure regulation measures. The results of this study serve as a guide for optimizing the stand structure on the Loess Plateau.

1. Introduction

China’s Loess Plateau is one of the most severely eroded regions in the world, with an average erosion modulus of 5000–10,000 t km−2 [1]. Afforestation is a common technique to prevent soil degradation and restore landscapes that have been severely affected by soil erosion [2]. To retain soil erosion and reduce land degradation, the central and local government initialed a series of afforestation programs in the Loess Plateau and neighboring areas of northern China in the late 1970s, including the “Three North” Shelterbelt Development Program, the Natural Forest Conservation Program, and the Grain for Green Program [3,4,5]. Through years of unremitting efforts, relevant forestry ecological projects have played a great role. Yang et al. [6] noted that the conversion of agricultural land to grasslands and woodlands in the Yan River basin resulted in a 13.8% reduction in watershed runoff and a 50.7% reduction in sediment during 2000–2015. Furthermore, Xin et al. [7] noted that the annual sediment yield decreased from 3887.0 t km·yr1 in the 1950s to 174.7 t km·yr1 in the 2000s, a 95% reduction, and annual sediment emissions decreased by 597 × 106 t·yr1 from 2000 to 2010.
However, the effects of large-scale afforestation programs on water and soil resources have also attracted widespread attention [8,9,10,11,12,13,14]. For instance, Cao et al. [8] found that artificial afforestation consumed much more water than natural afforestation, and they concluded that the current afforestation policy did not match the regional climate (precipitation) conditions. Therefore, artificial afforestation might exacerbate water shortages and offset the effectiveness of ecological restoration. Additionally, Zhang et al. [10] compared the costs of water allocation between afforestation and natural vegetation conservation and obtained the opportunity cost of afforestation, which was much higher than the ecosystem service value. Furthermore, Jia et al. [11,12] and Deng et al. [4] argued that artificial afforestation depletes soil moisture, which leads to the formation of a dry soil layer. Thus, they concluded that natural restoration was a better option for maintaining the stability of water resources in arid and semi-arid regions, which led to the forestry development of the Loess Plateau being considered a “dilemma”. On the one hand, forest and vegetation cover should be increased expeditiously to improve the poor ecological environment. On the other hand, merely increasing forest and vegetation cover may exacerbate the local soil moisture deficit and even affect vegetation stability [13]. Hence, scientifically improving the ecological functions of these forests, without causing new environmental problems, such as the irreversible consumption of soil moisture, is the future for the ecological development of forestry on the Loess Plateau [14].
Growing evidence supports the effects of forest structure on ecosystem functioning/services, such as biodiversity, habitat suitability, water conservation, forest productivity, aboveground biomass, and carbon storage [15,16,17,18]. Most studies have focused on the structure and functions of the ecosystem of the Loess Plateau and other ecologically sensitive areas. For example, Zhang et al. [19] created a reasonable density model for planted black locust (Robinia pseudoacacia L.) and Chinese pine (Pinus tabuliformis Carr.) forests on the Loess Plateau based on the soil moisture conditions. Furthermore, Hacisalihoglu [20] evaluated the effects of Anatolian black pine (Pinus nigra) on soil erosion and properties and found that vegetation could reduce soil loss. Then, Lucas-Borja et al. [21] investigated the effects of stand age and forest structure on the microbiological soil properties, enzymatic activities, and nutrient contents. However, existing studies have only targeted a few factors, such as water and nutrients, and were unable to express the multi-factor coupling relationship between the stand structure and ecological functions in a multi-faceted manner. In addition, although there are some studies on the relationship between stand structure and the ecological function of forests, many critical problems have not reached a consensus. There are key factors that still need to be determined, including what configuration of the stand structure could most effectively utilize the ecological functions of forests and the regulation of the stand structure to improve the ecological functions [14].
Therefore, we conducted a study on the optimization of the stand structure to enhance the ecological functions of a Pinus tabuliformis forest on the Loess Plateau, China. Due to severe soil erosion on the Loess Plateau, the ecological functions of these forests mainly include the water-holding function (WF), soil improvement function (SF), the function of reducing runoff and sediment yield on the slope (RF), and diversity function of the understory plants (PF) [22]. To realize the site-specific regulation of the stand structure of the Pinus tabuliformis forest on the Loess Plateau, we introduced topographical factors into the study to investigate the coupling relationship between the stand structure and topographical factors (SSTFs) and the functional indices of ecological function (EFFIs) of the Pinus tabuliformis forest. The objectives of our study were to (1) assess the ecological functions of Pinus tabuliformis and calculate the weights of different EFFIs; (2) study the coupling relationships between the SSTFs and EFFIs and screen out the key SSTFs that could significantly affect the EFFIs; and (3) construct optimization models of the stand structure to enhance the ecological functions and propose strategies for regulating the stand structure of Pinus tabuliformis on the Loess Plateau.

2. Materials and Methods

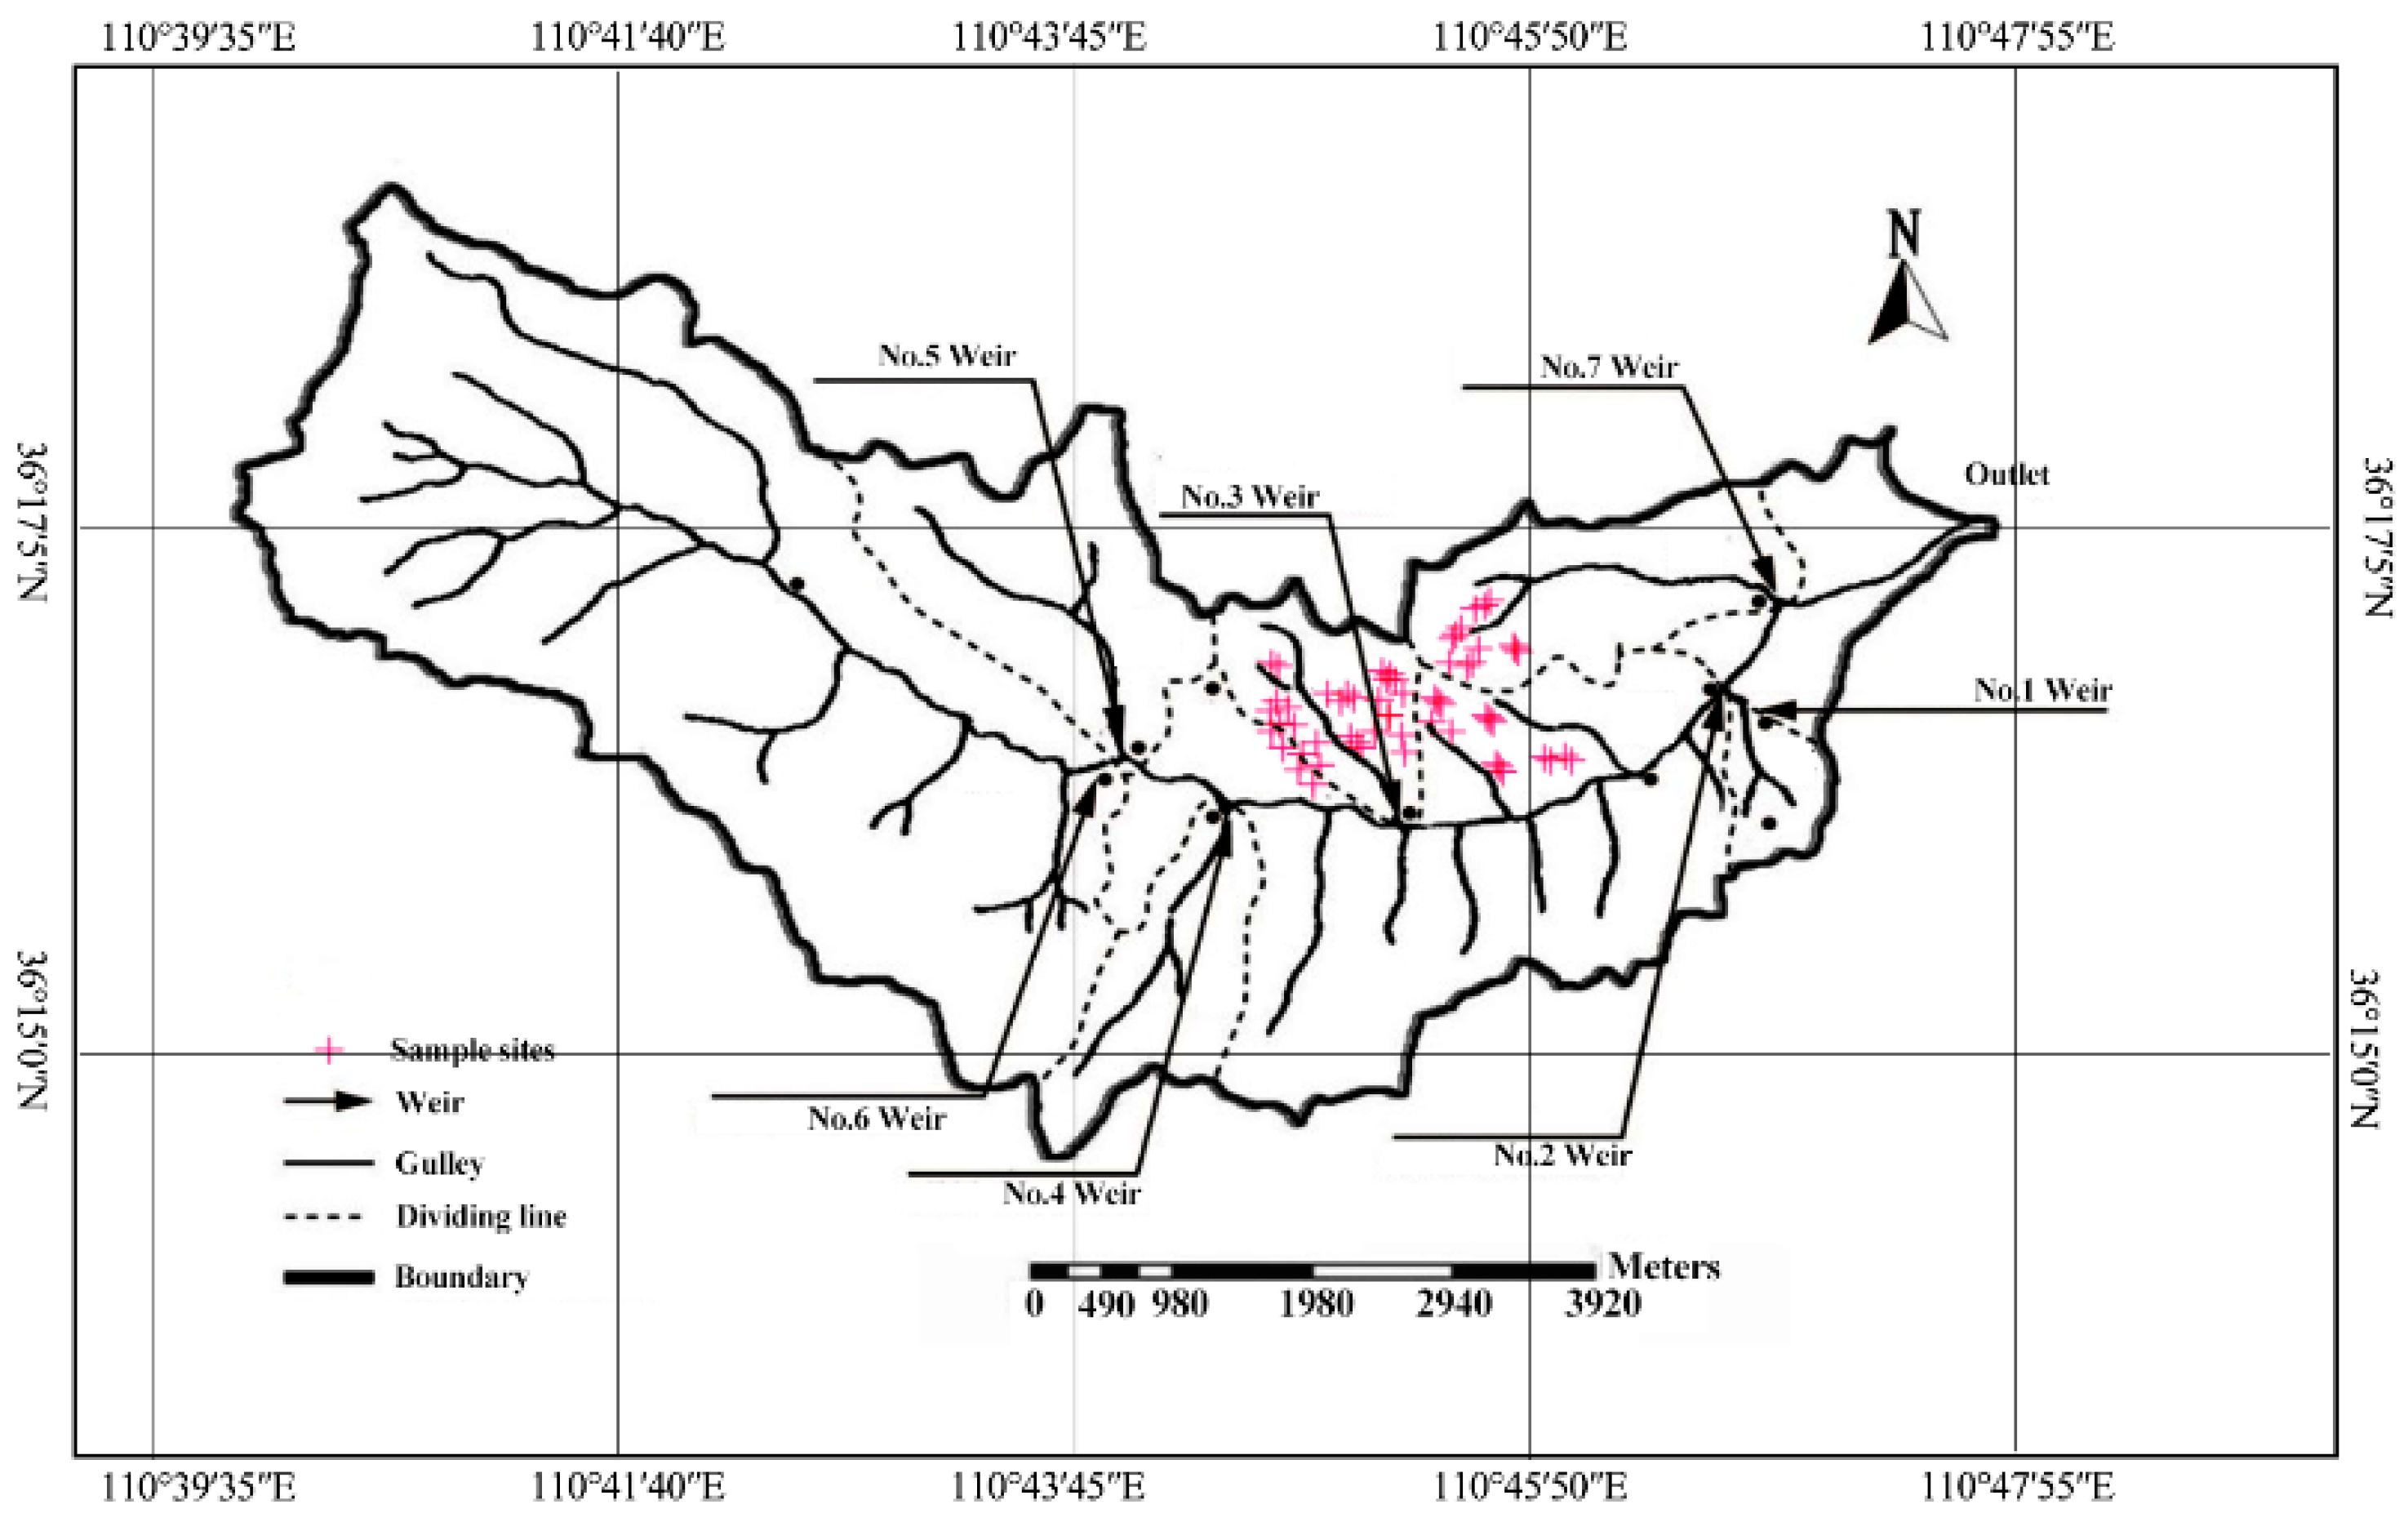
2.1. Site Description

The study area is located in the Caijiachuan watershed (36°14′–36°18′ N, 110°39′–110° 47′ E), Jixian County, Shanxi Province (Figure 1). The area of the watershed is 40 km2, with an elevation of 903–1568 m. The climate is a warm, temperate, continental monsoon, with a mean annual temperature of 10 °C and a mean annual rainfall of 579.5 mm. According to the soil classification of the Food and Agriculture Organization of the United Nations, the soil type in the region is mainly Haplic Luvisols, which are mostly alkaline. The main tree species for afforestation are black locust (Robinia pseudoacacia L.) and Chinese pine (Pinus tabulaeformis Carr.) with a shrub layer dominated by Manchu rose (Rosa xanthina Lindl.), Hawthornleaf raspberry (Rubus crataegifolius Bunge), and Periploca sepium (Periploca sepium Bunge). Large-scale afforestation was carried out in 1994, and the stand is mainly artificial pure forest [23].

2.2. Investigation of the Stand Structure and Topographical Factors and Functional Indices of Ecological Function

In this study, 50 standard plots (20 × 20 m2) were established in a Pinus tabuliformis forest. The stand structure factors included the diameter at breast height (DBH; 1.3 m above ground level), tree height, stand density, uniform angle index, neighborhood comparison, crown area, canopy density, leaf area index (LAI), the number of young trees renewed (NYTR), stand competition index, and stand layer index. The DBH, crown area, tree height, LAI, and NYTR were derived from individual field measurements of the plots and the other factors were calculated. The LAIs were determined with the vegetation canopy analyzer LAI-2000 (LI-COR Company, Lincoln, NE, USA).
The local neighborhood spatial distribution was quantified using the uniform angle index [24]. The uniform angle index was calculated as follows (1):
W i = 1 n j = 1 4 Z i j
with Z i j = { 1 , t h e   a - a n g l e   j   i s   s m a l l e r   t h a n   a 0 0 ,   o t h e r w i s e     and   0 W 1 .
A uniform angle index value of less than 0.475 means that the local neighborhood follows a uniform distribution, a uniform angle value exceeding 0.517 indicates an aggregated distribution, and a uniform angle value between 0.475 and 0.517 indicates a random distribution [24]. The smaller the uniform angle index is, the more uniform the local neighborhood distribution around a focal tree.
Neighborhood comparison is generally used to measure the strengths and weaknesses of individual trees in a stand. In previous studies, the DBH, stand height, or stand crown width were usually used as indices for the neighborhood comparison [24]. In this study, the calculation of the neighborhood comparison was performed using the DBH with Equation (2):
U i = 1 n j = 1 4 K i j
with K i j = { 1 , t h e   r e f e r e n c e   t r e e   i   i s   l a r g e r   t h a n   n e i g h b o r i n g   t r e e   j 0 ,   t h e   r e f e r e n c e   t r e e   i   i s   s m a l l e r   t h a n   n e i g h b o r i n g   t r e e   j   .
The Hegyi competition index calculation Equation (3) was used in this study:
S C I = i = 1 N ( D i D j ) × 1 L i j
where SCI is the stand competition index, Dj and Di are the DBH of the sample plant j and the competing plant i, Lij is the distance between the sample plant j and the competing plant i, and N is the number of i plants.
The stand layer index was calculated as follows (4):
H i = Z i 3 × 1 n × j = 1 n H i j
H i j = { 1 , w h e n   t h e   s u r v e y   t r e e   a n d   t h e   r e f e r e n c e   c e n t e r   t r e e   a r e   l o c a t e d   a t   d i f f e r e n t   l e v e l s 0 ,   w h e n   t h e   s u r v e y   s t a n d   a n d   t h e   r e f e r e n c e   c e n t e r   s t a n d   a r e   l o c a t e d   a t   t h e   s a m e   l e v e l  
where Zi is the number of stand layers in the spatial structural unit of the central wood i.
The topographic factors included the altitude, slope, and aspect of the stands. The aspects were defined as sunny, semi-sunny, semi-shady, and shady slopes and were numbered 4, 3, 2, and 1, respectively.
Four EFFIs (WF, SF, RF, and PF) of the Pinus tabuliformis forest, including 20 sub-functional indices, were investigated and monitored. Tipping-bucket self-measuring rain gauges were used to determine the rainfall inside and outside the forest and the trunk flow. The canopy interception rate of the forests was determined by the water balance principle. Then, soil samples were collected using the ring knife method and mixed thoroughly (0–200 cm). The soil moisture content was determined using the drying method. The maximum water-holding capacity was determined using the infiltration soil method [25]. Additionally, the soil samples were sieved at 0.25 mm and the soil organic matter content was determined using the potassium dichromate dilution heat method. The contents of the total nitrogen, total phosphorus, ammonia-nitrogen, nitrate nitrogen, and available phosphorus were measured using the SmartChem-200 automatic intelligent chemical analyzer (AMS/Alliance Instruments, Paris, France). Small quadrats (30 × 30 cm2) were randomly selected on the upper, middle, and lower slopes of the sample plots to investigate the litter layer. The water retention rate of the undecomposed and semi-decomposed layers was measured using the indoor soaking method. The soil infiltration rate was determined using the double-loop infiltration method. The standard runoff plots were used to observe the amount of rainfall and sand production in the sample site. The understory plant diversity indices, including the Shannon diversity index, Simpson diversity index, and Pielou uniformity index, were determined using the classic formulas [26]. The characteristics of the SSTFs and EFFIs of the studied Pinus tabuliformis plots are summarized in Table 1.

2.3. Statistical Analysis

In information theory, entropy is a measure of the degree of disorder in a system and it measures the amount of valid information provided by the data. Therefore, entropy can be used to determine the weighting. When the difference between the values of the evaluation objects on a certain index is larger, the entropy value is smaller, which means that the effective information provided by the index is larger and the weight of the index should be larger. In contrast, if the difference between the values of a certain index is smaller, the entropy value is larger, which means that the information provided by the index is smaller and the weight of the index should be smaller. Thus, the entropy weighting method was used to determine the weights of the different EFFIs of the Pinus tabuliformis forest [14].
Normalization was conducted on the raw data. When the index was positive, the standardized equation was as follows (5); when the index was negative, the standardized equation was as follows (6):
z i j = x i j min ( x i j ) max ( x i j ) min ( x i j )
z i j = max ( x i j ) x i j max ( x i j ) min ( x i j )
where xij is the evaluation index of i corresponding to the sample plots of j, and zij is the corresponding index value after standardization.
In an evaluation with n evaluation indices and m sample plots, the entropy value of i was as follows (7):
H j = k j = 1 m e i j ln e i j ,   i = 1 , ,   n ;   j = 1 , ,   m
where e i j = z i j i = 1 m z i j ; k = 1 ln m ; when eij = 0 and eijlneij = 0.
The weight of each index was as follows (8):
W i = 1 H i m i = 1 n H i
where 0 ≤ Wi ≤ 1; i = 1 m W i = 1 .
The SSTFs that influence the EFFIs were determined using a redundancy analysis, and this was implemented using the CANOCO v. 5.0 (Microcomputer Power, Ithaca, NY, USA). A Monte Carlo test based on random permutations was performed to test the significance of the eigenvalues. A structural equation model includes measurement and structural models, which are used to explore the coupling relationships among multiple observed variables, latent variables, and residuals in the ecosystem and to quantitatively describe the path and degree of influence of independent variables on dependent variables. Based on the observation and survey data during the study period, a structural equation model that expressed the multi-factor composite relationship between the SSTFs and EFFIs was constructed using Amos 22.0 software (IBM, Inc., Armonk, NY, USA). The path coefficients indicated the degree of association between the variables and were calculated using the likelihood estimation method.

2.4. Optimization of the Stand Structure of the Pinus tabuliformis Forest

The Response Surface Methodology is an analytical method to quickly analyze and construct model equations between multiple indices and response values. The model equations can be used to optimize all the evaluation indices given the target conditions of the response values and determine the optimal combination of the evaluation indices with their corresponding values. Thus, the Response Surface Methodology was employed to optimize the stand structure for ecological function improvement using the SAS software (version 9.1, SAS Institute Inc., Cary, NC, USA).

3. Results

3.1. Evaluation of the Functional Indices of Ecological Function

The evaluation results of the ecological functions of the Pinus tabuliformis forest showed that the weights of the EFFIs ranged from 0.062 to 0.323 (Table 2). The differences in the weights of the SF, WF, and PF were not significant, and were in the following order: SF (0.323) > WF (0.319) > PF (0.296). The weight of the RF of the Pinus tabuliformis forest was the lowest, which was only 0.062. The weights of the sub-EFFIs ranged from 0.015 to 0.127, among which the weights of the soil moisture content, total phosphorus, and water retention rate of the litter in the undecmposed layer occupied a prominent position, with weights of 0.127, 0.126, and 0.104, respectively. The weights of the soil infiltration rate, water retention rate of the litter in the semi-decomposed layer, canopy interception rate, and maximum water holding capacity were lower for the sub-EFFIs, at 0.026, 0.026, 0.023, and 0.015, respectively.

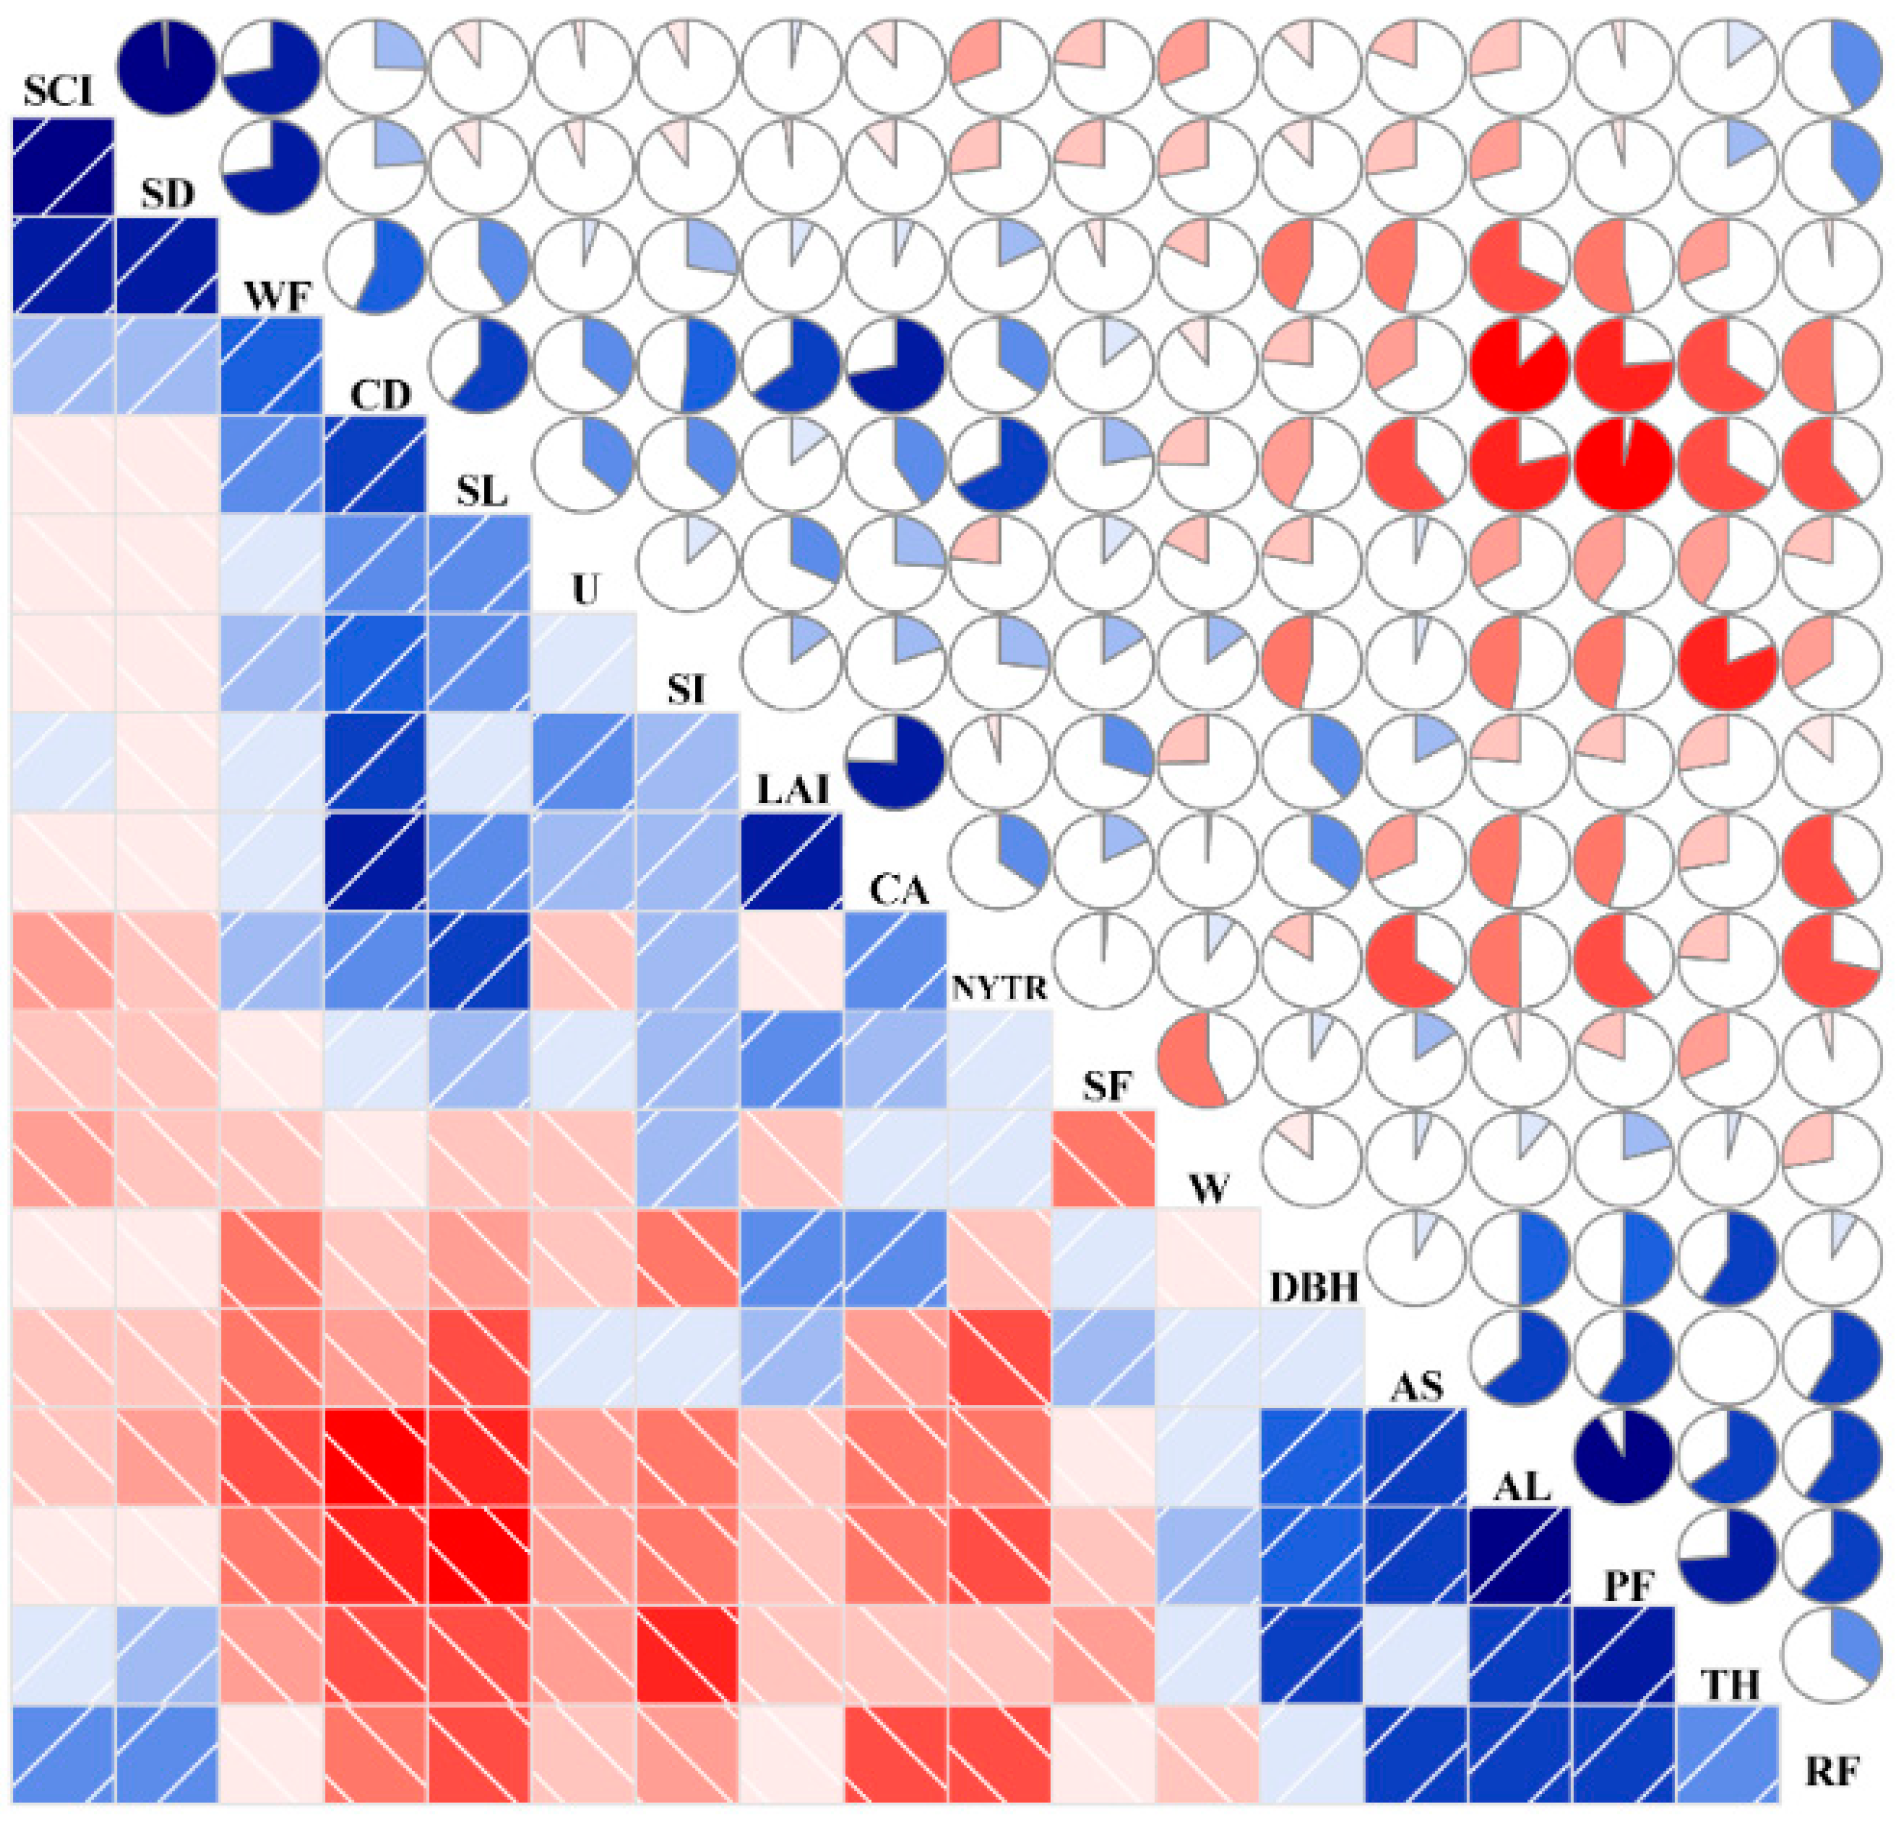
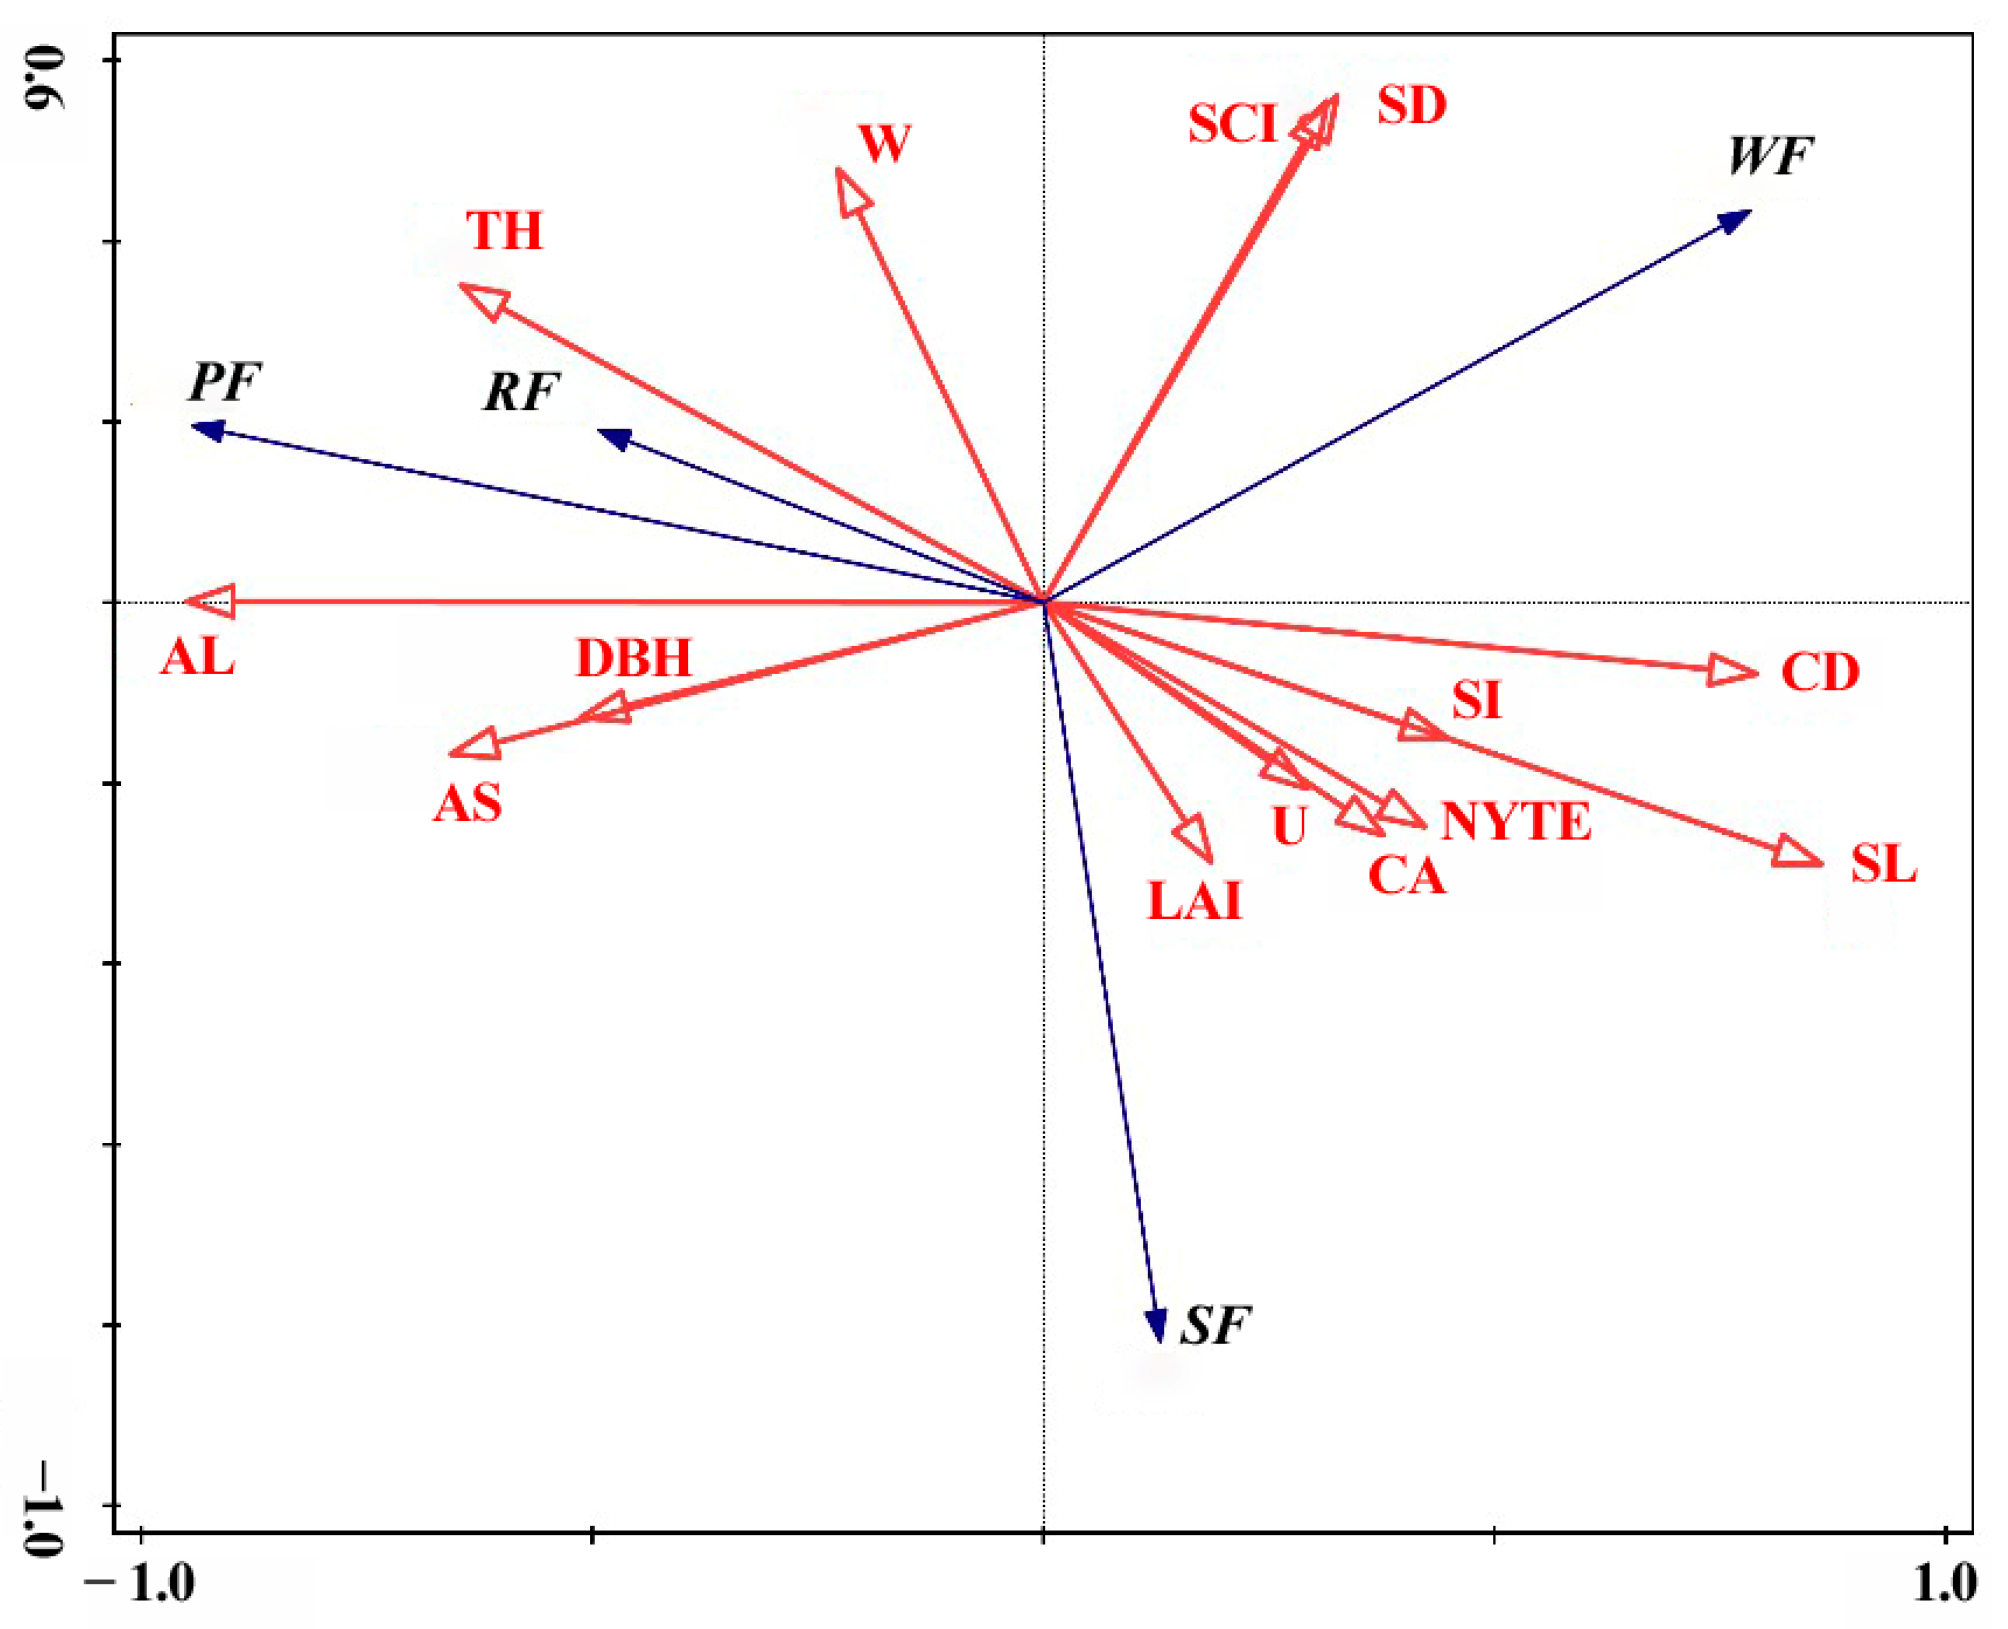
3.2. Influence of the Stand Structure and Topographical Factors on the Functional Indices of Ecological Function

The Pearson correlation results (Figure 2) showed that the WF had a significantly negative correlation with the altitude and significantly positive correlations with the stand density, canopy density, and stand competition index (p < 0.05). The correlation between the SF and the uniform angle index was significantly negative (p < 0.05). Moreover, the RF had significantly negative correlations with the slope, canopy density, NYTR, and crown area, and significantly positive correlations with the aspect and altitude (p < 0.05). The PF had significantly negative correlations with the slope, canopy density, and NYTR and significantly positive correlations with the aspect, altitude, DBH, and tree height (p < 0.05).
The redundancy analysis indicated that the SSTFs explained the variability of the EFFIs effectively. The total explanation rate of the SSTFs of the variability of the EFFIs reached 92.6% (Table 3). The first two axes of the redundancy analysis explained 82.38% of the variability of the EFFIs (Figure 3). Additionally, the Monte Carlo permutation test found that the altitude explained the EFFIs to the strongest extent at 44.5%, followed by the stand density and uniform angle index at 15.8% and 15.0%, respectively. The other SSTFs had some effects on the EFFIs, but their effects were not significant.
The structural equation model (Figure 4) indicated that the altitude, stand density, and uniform angle index had significant effects on the four EFFIs. The altitude had a significantly negative effect on the WF (p < 0.001), with an effect coefficient of −0.55, and it had significantly positive effects on the RF and PF (p < 0.001), with effect coefficients of 0.71 and 0.91, respectively. The stand density had highly significant negative effects on the WF (p < 0.001) and SF (p < 0.01), with effect coefficients of −0.10 and −0.42, respectively, and it had significantly positive effects on the RF (p < 0.001) and PF (p < 0.001), with effect coefficients of 0.52 and 0.28, respectively. The uniform angle index had a significantly negative effect on the SF (p < 0.001), with an effect coefficient of −0.63, and it had a significantly positive effect on the PF (p < 0.01), with an effect coefficient of 0.18 (p < 0.01).

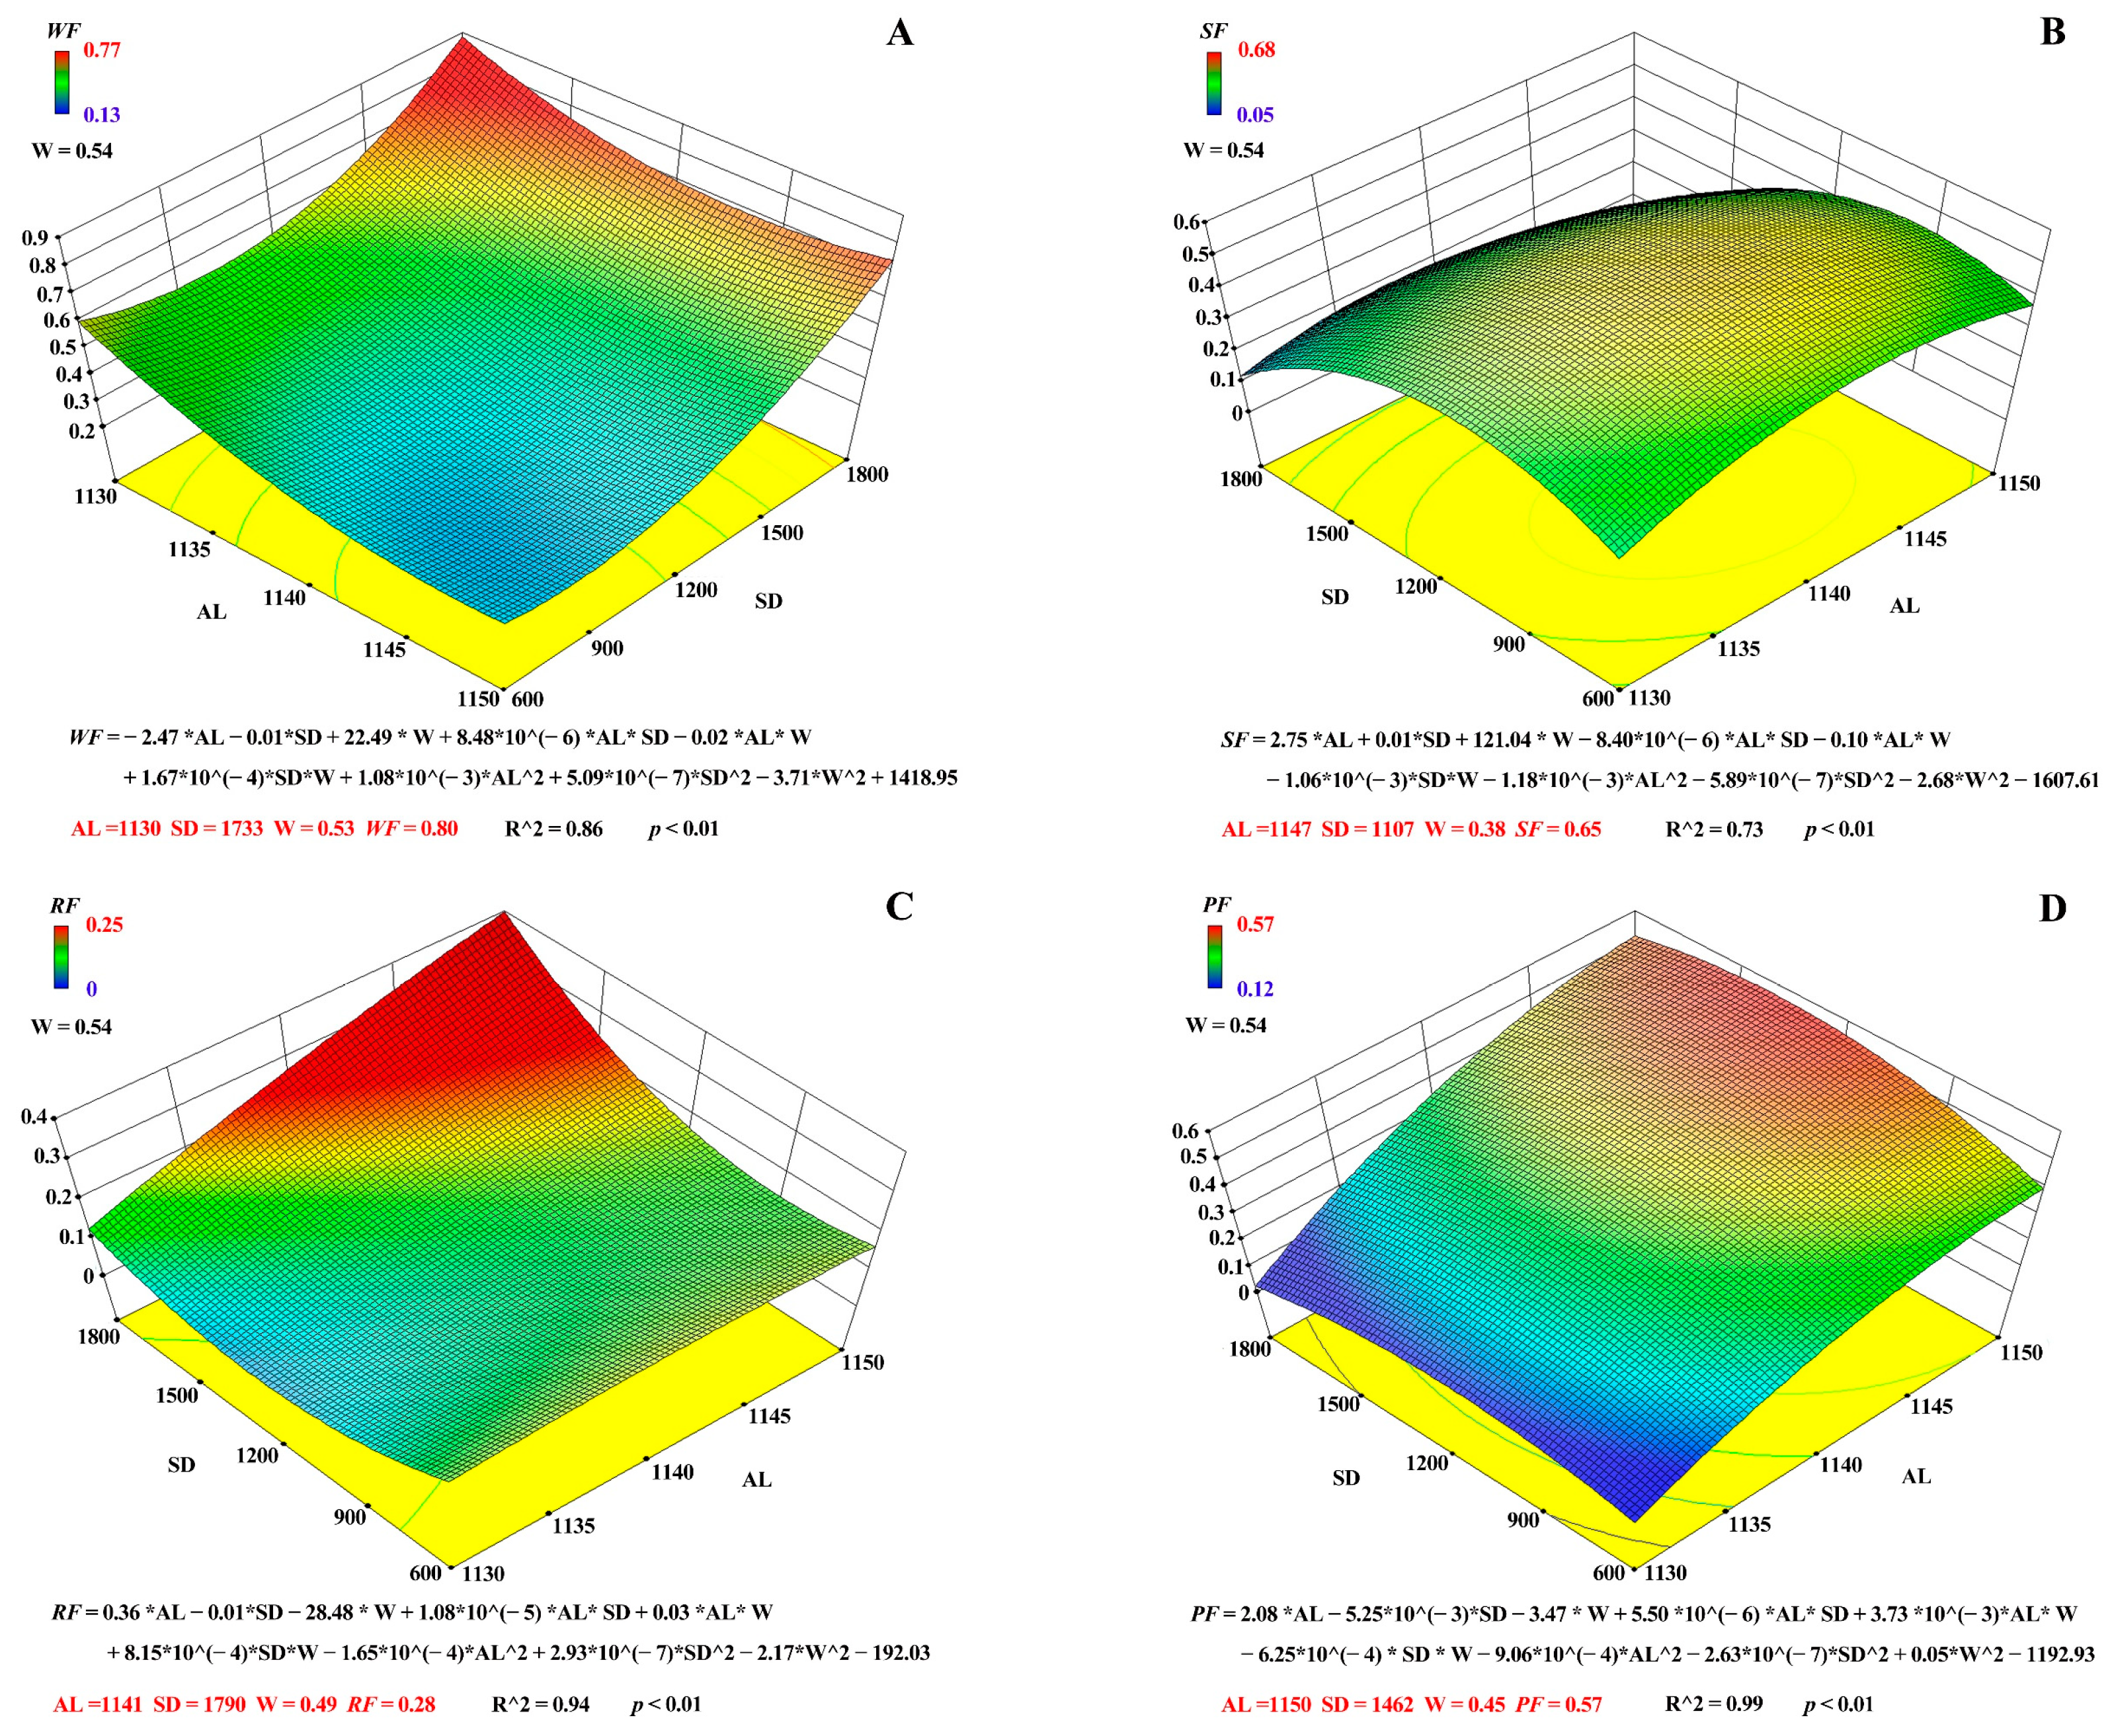
3.3. Establishment of Models for Stand Structure Optimization

The structural equation model indicated that the altitude, stand density, and uniform angle index could significantly affect the EFFIs of the Pinus tabuliformis stand. Therefore, we constructed multi-factor response surface equations with the altitude, stand density, and uniform angle index as independent variables and four EFFIs as response variables (Figure 5). The results showed that the four corresponding multi-factor response surface models fitted well (R2 > 0.7 and p < 0.01), which was consistent with the expectation that the SSTFs could better reflect the variations of the EFFIs. In addition, the multi-factor response surface models were used to predict the optimal allocation of the stand structure to enhance the corresponding EFFIs. Thus, multi-factor response surface models were established to enhance the WF (Figure 5A), SF (Figure 5B), RF (Figure 5C), and PF (Figure 5D) of the Pinus tabuliformis forest. The optimal configurations of the stand structure were WF: altitude = 1130 m, stand density = 1733 plants·hm2, and uniform angle index = 0.53; SF: altitude = 1147 m, stand density = 1107 plants·hm2, and uniform angle index = 0.38; RF: altitude = 1141 m, stand density = 1790 plants·hm2, and uniform angle index = 0.49; and PF: altitude = 1150 m, stand density = 1462 plants·hm2, and uniform angle index = 0.45.

4. Discussion

4.1. Evaluation of Ecological Functions of the Pinus tabuliformis Forest

Based on maintaining the existing afforestation area, the methods to improve the ecological functions of forests, such as water and soil conservation and runoff and sediment reduction, are key to the high-quality development of forestry on the Loess Plateau [27,28,29]. The prerequisite for achieving these goals is to quantify the ecological functions of forests scientifically and comprehensively. By evaluating the ecological functions of the Pinus tabuliformis forest, we found that the ecological functions of the stand can be significantly influenced by the stand structures and topographic conditions, except for the RF. Wei et al. [30] showed that coniferous forests are not effective in controlling slope runoff and sediment transport and preventing soil erosion when compared to broadleaf species in the watershed. Therefore, the RF of the Pinus tabuliformis forest needs to be improved by combining other control measures, such as planting other tree species in the stand. In the sub-EFFIs of the Pinus tabuliformis forest, the soil moisture content, water retention rate of the litter in the undecomposed layer, and total phosphorus were given a prominent weighting. This indicated that stand structures and topographic conditions could directly affect the water-holding characteristics of the soil and litter, which indirectly affects the WF of the Pinus tabuliformis stands. In addition, the variation in the total phosphorus content in the soil may be due to the stand structure and topographic conditions affecting the amount and decay process of the litter in the stand, which indirectly affects the SF by influencing the replenishment of the nutrients in the soil [31]. Several studies have similarly shown that different climates, topography, stand type, stand structure, and human activities affect the hydrological properties of the litter [32,33], directly influencing the performance of the ecological functions of a forest.

4.2. Effects of the Altitude, Stand Density, and Uniform Angle Index on the Functional Indices of the Ecological Function of the Pinus tabuliformis Forest

Numerous studies have shown that stand structure is strongly related to the ecological functions of forests [34,35,36,37]. In this study, the SSTFs were found to explain 92.6% of the variability of the EFFIs of the Pinus tabuliformis forest. The altitude, stand density, and uniform angle index could significantly influence the EFFIs, and the cumulative explanation rate of the three factors reached 75.3% of the variability of the EFFIs.
First, altitude, as one of the most important topographic factors, was found to significantly affect the microclimate conditions in the stands [38], which is manifested in the differences in temperature, precipitation, and solar radiation in the microclimate of the forest [39,40,41]. Studies by Griffiths et al. [42] and Song et al. [43] found that the location and environment in which the terrain was located determined the light intensity, soil temperature, and moisture, which further influenced the entire biochemical process in the soil. The soil physicochemical properties in different topography are controlled by the redistributive effects of water, light, and temperature, which results in differences in the soil moisture and nutrient status under different topographic conditions [44,45]. Additionally, Wang et al. [46] showed that differences in the vegetation diversity indices of various forests may be due to a combination of differences in the soil moisture, light, and other ecological factors that are caused by slope factors, and they also found that the overall diversity of the vegetation communities was slightly greater on shady slopes than that on sunny slopes. In this study, we found that when the altitude of the stand increased, the WF of the stand had a significant decreasing trend, while the RF and PF had an increasing trend. The reason for these trends may be that when the altitude is lower, more precipitation is retained by the forest canopy and litter, so more water enters the soil and enhances the WF of the stand. However, as the altitude rises, less precipitation collects on the slope, resulting in less runoff flow. In addition, the PF of the stand at relatively high elevations was stronger than that at low elevations, indicating that the growth habitat of the understory vegetation of Pinus tabuliformis is more suitable for growth at relatively high altitudes. The mean altitude of the study area is 1300 m, which is therefore conducive to the growth and development of the understory vegetation of Pinus tabuliformis.
Second, SD plays a crucial role in determining the ecological functions of a stand [47,48,49]. Some studies have shown that the stand density affected the other stand structure indices [50,51]. Furthermore, Li et al. [46] believed that the stand density has strong practicability when compared to the other stand structure factors. The Loess Plateau is an area with minimal vegetation coverage [52], and the main objective of afforestation projects is to increase the vegetation coverage to reinforce soil and water conservation in the arid and semiarid areas [53]. Therefore, increasing the stand density is a simple and feasible measure to achieve this objective. However, this does not mean that the ecological function of the stand can be enhanced simply by increasing the stand density. Jia et al. [54] and Jian et al. [55] also indicated that an inappropriate stand density could significantly affect the WF of the stand, which in turn would lead to a decline in the ecological functions of the stand. The results of this study showed that the stand density of the Pinus tabuliformis forest was significantly correlated with the four EFFIs, and it had negative effects on the WF and SF and positive effects on the RF and PF. The stand density had different effects on different EFFIs. In practical forestry management, it is necessary to make certain trade-offs between different EFFIs and determine a certain function indicator that needs to be improved urgently to regulate stand density.
Third, the uniform angle index is an excellent indicator for spatial pattern analysis of stands. It is characterized by its ability to express results as both the mean and individual value distributions without the use of distance and angle measurements. The spatial structure of a stand influences the distribution of light and temperature and the movement of gases in the stand. It has a very important impact on the growth and stability of the stand and the possibilities for management. Many studies have shown that according to the general vegetation succession pattern, the horizontal distribution pattern of the top community should be a random distribution pattern, and the goal of adjusting the stand pattern is to regulate the non-randomly distributed stands towards a random distribution [56,57]. Zhang et al. [58] reported that natural Pinus tabulaeformis forests develop from a cluster distribution to a random distribution. Yi et al. [59] indicated that mature natural forests appear to show a stable random distribution, with dominant tree species randomly distributed within them. This not only reduces competition among interspecific species but also decreases the effects of different dominant tree species. However, we found that when the uniform angle index of stands gradually became larger (the spatial pattern of the stands transformed from a uniform distribution to a random distribution), the WF and PF of the stands had an increasing trend. This may be because the change in the spatial pattern of the stand affected the distribution of light and precipitation within the stand, and thus, the understory vegetation could obtain more light and water, which increased the diversity of the shrubs and herbs. Nevertheless, due to the increased density of the shrubs and herbs, the consumption of the soil moisture increased. Although the change in the spatial pattern of the stand allowed more precipitation to enter the soil, resulting in soil moisture showing an increasing trend, the effect was not significant. In addition, the soil nutrients were also consumed by the increase in the density of the shrubs and herbs in the stand, resulting in a decrease in the SF of the stand. Therefore, although a random distribution pattern is a more desirable spatial pattern for the stand, it is not necessarily the best choice for the spatial pattern of the stand at this stage of the succession of the Pinus tabulaeformis stand on the Loess Plateau. The regulation of the stand spatial pattern should be more in line with the current purpose of afforestation on the Loess Plateau—to improve the present ecological environment and enhance the function of the soil and water conservation.

4.3. Optimization Strategy of the Stand Structure of the Pinus tabuliformis Forest on the Loess Plateau

From the above results, the altitude, stand density, and uniform angle index were found to significantly influence the ecological functions of the Pinus tabuliformis stands on the Loess Plateau. However, once the location of the silvicultural site is determined, the altitude of the stand becomes constant. Although it is possible to change the location of the stand through large-scale transplanting, this is simply not possible in practical stand management. Therefore, the results of this study indicate that, in the process of actual stand structure optimization and regulation, foresters should change the structural characteristics of a stand by adjusting the stand density and the spatial structure to improve the ecological functions of the stand. Thus, we conclude that the specific strategies for stand structure optimization and regulation on the Loess Plateau are:
(1)
To determine the characteristics of the regulation target by understanding the stand structure and its ecological function characteristics through stand surveys on the altitude of the stand, stand density, uniform angle index of individual trees in the sample plot, and the average uniform angle index of the sample plot.
(2)
To determine the optimization target by quantifying and analyzing the ecological functions of the stand, selecting a certain functional index as the optimization target, and specifying the degree of improvement in the functional index.
(3)
To substitute the optimization target and altitude into the corresponding stand structure optimization model and determine the regulation direction and regulation range of the stand density, spatial structure (uniform angle index), and specific stand control measures. For the regulation of the stand density, it can be increased or decreased by replanting or interplanting. For the regulation of the uniform angle index, the main purpose is to balance the proportion of clustered, random, and uniformly distributed structural units in the spatial structure of the stand. If the uniform angle index of the stand needs to be increased, single trees with a small uniform angle index in the stand should be interplanted or transplanted; if the uniform angle index of the stand needs to be reduced, single trees with a large uniform angle index in the stand should be interplanted or transplanted, so that the uniform angle index of the stand meets the requirements. Furthermore, the regulation measures of the stand structure can be changed from a stand scale to a monoculture scale.
It should be noted that optimal stand configurations determined by the response surface equation could be used as important references for foresters in the early stages of local afforestation to develop afforestation plans. In addition, the stand structure regulation factors (stand density and uniform angle index) that are derived from this study are based on the fitting of the ecological functions of the stands that need to be improved on the Loess Plateau and may not be suitable for ecological functions improvement of stands in other environmentally fragile areas. However, the research methods and regulation strategies are applicable to other regions or countries that aim to improve the ecological environment and stand quality through stand structure optimization and regulation.

5. Conclusions

This paper systematically analyzed the coupling relationship between SSTFs and EFFIs and proposed a strategy for optimizing stand structure to enhance the ecological function of the Pinus tabuliformis forest on the Loess Plateau. This study showed that differences in stand structures and topographic conditions could significantly affect the ecological functions of the Pinus tabuliformis forest, which was mainly reflected in the WF, SF, and PF, but had little effect on the RF. Thus, the stand density and uniform angle index can be used as optimal regulatory factors to regulate the stand structure of the Pinus tabuliformis forest. The stand regulation strategy that was proposed in this paper can realize the optimal regulation of the stand structure based on the enhancement of the stand ecological function and improve the fragile ecological environment of the Loess Plateau. It also has important reference significance for the regulation of stand structures in other ecologically fragile areas.

Author Contributions

Conceptualization, H.B. and N.W.; investigation, N.W., R.P., D.Z., H.Y., Z.L., D.L. and C.J.; software, N.W.; methodology, N.W.; formal analysis, N.W.; visualization, N.W.; writing—original draft preparation, N.W.; writing—review and editing, H.B. and N.W. All authors have read and agreed to the published version of the manuscript.

Funding

This research was funded by the National Natural Science Funds of China (No. 31971725, U2243202).

Conflicts of Interest

The authors declare no conflict of interest.

Abbreviation

Variable AbbreviationsVariable Name
SSTFsStand structure and topographical factors
EFFIsFunctional indices of ecological function
WFWater-holding function
SFSoil improvement function
RFFunction of reducing runoff and sediment yield on the slope
PFDiversity function of the understory plants
SLSlope
ASAspect
ALAltitude
SDStand density
CDCanopy density
NYTRNumber of young trees renewed
DBHDiameter at breast height
THTree height
CACrown area
LAILeaf area index
WUniform angle index
UNeighborhood comparison
SCIStand competition index
SIStand layer index

References

  1. Tang, K. Soil and Water Conservation in China; Chinese Science Press: Beijing, China, 2004. [Google Scholar]
  2. Nunez-Mir, G.C.; Iannone, B.V.; Curtis, K.; Fei, S. Evaluating the evolution of forest restoration research in a changing world: A “big literature” review. New For. 2015, 46, 669–682. [Google Scholar] [CrossRef]
  3. Song, X.; Peng, C.; Zhou, G.; Jiang, H.; Wang, W. Chinese Grain for Green Program led to highly increased soil organic carbon levels: A meta-analysis. Sci. Rep. 2014, 4, 4460. [Google Scholar] [CrossRef] [PubMed] [Green Version]
  4. Deng, L.; Yan, W.; Zhang, Y.; Shangguan, Z. Severe depletion of soil moisture following land-use changes for ecological restoration: Evidence from northern China. For. Ecol. Manag. 2016, 366, 1–10. [Google Scholar] [CrossRef]
  5. Feng, X.; Fu, B.; Piao, S.; Wang, S.; Ciais, P.; Zeng, Z.; Lü, Y.; Zeng, Y.; Li, Y.; Jiang, X.; et al. Revegetation in China’s Loess Plateau is approaching sustainable water resource limits. Nat. Clim. Chang. 2016, 6, 1019–1022. [Google Scholar] [CrossRef]
  6. Yang, K.; Lu, C. Evaluation of land-use change effects on runoff and soil erosion of a hilly basin—The Yanhe River in the Chinese Loess Plateau. Land Degrad. Dev. 2018, 29, 1211–1221. [Google Scholar] [CrossRef]
  7. Xin, Z.B.; Yu, B.F.; Han, Y.G. Spatiotemporal variations in annual sediment yield from the middle yellow river, China, 1950–2010. J. Hydrol. Eng. 2015, 20, 04014090. [Google Scholar] [CrossRef]
  8. Cao, S.; Zhang, J. Political risks arising from the impacts of large-scale afforestation on water resources of the Tibetan Plateau. Gondwana Res. 2015, 28, 898–903. [Google Scholar] [CrossRef]
  9. Cao, S.; Zhang, J.; Chen, L.; Zhao, T. Ecosystem water imbalances created during ecological restoration by afforestation in China, and lessons for other developing countries. J. Environ. Manag. 2016, 183, 843–849. [Google Scholar] [CrossRef] [PubMed]
  10. Zhang, J.; Zhao, T.; Jiang, C.; Cao, S. Opportunity cost of water allocation to afforestation rather than conservation of natural vegetation in China. Land Use Policy 2016, 50, 67–73. [Google Scholar] [CrossRef]
  11. Jia, X.; Shao, M.; Zhang, C.; Zhao, C. Regional temporal persistence of dried soil layer along south–north transect of the Loess Plateau, China. J. Hydrol. 2015, 528, 152–160. [Google Scholar] [CrossRef]
  12. Jia, X.; Shao, M.; Zhu, Y.; Luo, Y. Soil moisture decline due to afforestation across the Loess Plateau, China. J. Hydrol. 2017, 546, 113–122. [Google Scholar] [CrossRef]
  13. Wang, Y.H.; Xiong, W.; Yu, P.T.; Shen, Z.X.; Guo, M.C.; Guan, W.; Ma, C.M.; Ye, B.; Guo, H. Study on the evapotranspiration of forest and vegetation in dryland. Sci. Soil Water Conserv. 2006, 4, 19–25. [Google Scholar]
  14. Wang, N.; Bi, H.; Cui, Y.; Zhao, D.; Hou, G.; Yun, H.; Liu, Z.; Lan, D.; Jin, C. Optimization of stand structure in Robinia pseudoacacia Linn. based on soil and water conservation improvement function. Ecol. Indic. 2022, 136, 108671. [Google Scholar] [CrossRef]
  15. Lindenmayer, D.B.; Margules, C.R.; Botkin, D.B. Indicators of Biodiversity for Ecologically Sustainable Forest Management. Conserv. Biol. 2000, 14, 941–950. [Google Scholar] [CrossRef]
  16. Ishii, H.T.; Tanabe, S.; Hiura, T. Exploring the relationships among canopy structure, stand productivity, and biodiversity of temperature forest ecosystems. For. Sci. 2004, 50, 342–355. [Google Scholar] [CrossRef]
  17. Ribe, R.G. In-stand scenic beauty of variable retention harvests and mature forests in the U.S. Pacific Northwest: The effects of basal area, density, retention pattern and down wood. J. Environ. Manag. 2009, 91, 245–260. [Google Scholar] [CrossRef] [PubMed]
  18. Ali, A. Forest stand structure and functioning: Current knowledge and future challenges. Ecol. Indic. 2018, 98, 665–677. [Google Scholar] [CrossRef]
  19. Zhang, J.J.; He, W.; Na, L. Study on appropriate density of Pinus tabulaeformis and Robinia Pseudocacia for soil and water con-servation forests in Loess area. Sci. Soil Water Conserv. 2007, 5, 55–59. [Google Scholar]
  20. Hacisalihoglu, S. Semi-Arid Plantation by Anatolian Black Pine and Its Effects on Soil Erosion and Soil Properties. Turk. J. Agric. Food Sci. Technol. 2018, 6, 500–507. [Google Scholar] [CrossRef] [Green Version]
  21. Lucas-Borja, M.; Hedo, J.; Cerdá, A.; Candel-Pérez, D.; Viñegla, B. Unravelling the importance of forest age stand and forest structure driving microbiological soil properties, enzymatic activities and soil nutrients content in Mediterranean Spanish black pine(Pinus nigra Ar. ssp. salzmannii) Forest. Sci. Total Environ. 2016, 562, 145–154. [Google Scholar] [CrossRef]
  22. Zhu, D.J.; Wen, Z.M.; Zhang, J.; Tao, Y.; Zeng, H.W.; Tang, Y. Effects of alien species Robinia pseudoacacia on plant community functional structure in hilly-gully region of Loess Plateau, China. J. Appl. Ecol. 2018, 29, 459–466. [Google Scholar]
  23. Zhao, Y.; Li, M.; Deng, J.; Wang, B. Afforestation affects soil seed banks by altering soil properties and understory plants on the eastern Loess Plateau, China. Ecol. Indic. 2021, 126, 107670. [Google Scholar] [CrossRef]
  24. Hui, G.Y.; Klaus, V.G.; Hu, Y.B.; Xu, H. Structure-Based Forest Management; China Forestry Publishing House: Beijing, China, 2007; pp. 32–60. [Google Scholar]
  25. Xu, Z. Study on Ecological Function Evaluation and Biodiversity of Typical Forest Stands in Jinxi of the Loess Plateau. Master’s Thesis, Beijing Forestry University, Beijing, China, 2014. [Google Scholar]
  26. Mason, N.W.H.; Mouillot, D.; Lee, W.G.; Wilson, J.B. Functional richness, functional evenness and functional divergence: The primary components of functional diversity. Oikos 2005, 111, 112–118. [Google Scholar] [CrossRef]
  27. Sun, L.; Chang, X.; Yu, X.; Jia, G.; Chen, L.; Liu, Z.; Zhu, X. Precipitation and soil water thresholds associated with drought-induced mortality of farmland shelter forests in a semi-arid area. Agric. Ecosyst. Environ. 2019, 284, 106595. [Google Scholar] [CrossRef]
  28. Shi, W.-Y.; Du, S.; Morina, J.C.; Guan, J.-H.; Wang, K.-B.; Ma, M.-G.; Yamanaka, N.; Tateno, R. Physical and biogeochemical controls on soil respiration along a topographical gradient in a semiarid forest. Agric. For. Meteorol. 2017, 247, 1–11. [Google Scholar] [CrossRef]
  29. Johnson, D.W.; Curtis, P.S. Effects of forest management on soil C and N storage: Meta analysis. For. Ecol. Manag. 2001, 140, 227–238. [Google Scholar] [CrossRef]
  30. Wei, X.; Bi, H.; Liang, W.; Hou, G.; Kong, L.; Zhou, Q. Relationship between Soil Characteristics and Stand Structure of Robinia pseudoacacia L. and Pinus tabulaeformis Carr. Mixed Plantations in the Caijiachuan Watershed: An Application of Structural Equation Modeling. Forests 2018, 9, 124. [Google Scholar] [CrossRef] [Green Version]
  31. Saura-Mas, S.; Estiarte, M.; Peñuelas, J.; Lloret, F. Effects of climate change on leaf litter decomposition across post-fire plant regenerative groups. Environ. Exp. Bot. 2011, 77, 274–282. [Google Scholar] [CrossRef]
  32. Guendehou, G.H.S.; Liski, J.; Tuomi, M.; Moudachirou, M.; Sinsin, B.; Mäkipää, R. Test of validity of a dynamic soil carbon model using data from leaf litter decomposition in a West African tropical forest. Geosci. Model Dev. Discuss. 2013, 6, 3003–3032. [Google Scholar] [CrossRef]
  33. He, X.; Lin, Y.; Han, G.; Ma, T. Litterfall interception by understorey vegetation delayed litter decomposition in Cinnamomum camphora plantation forest. Plant Soil 2013, 372, 207–219. [Google Scholar] [CrossRef]
  34. Diemont, S.A.; Bohn, J.L.; Rayome, D.D.; Kelsen, S.J.; Cheng, K. Comparisons of Mayan forest management, restoration, and conservation. For. Ecol. Manag. 2011, 261, 1696–1705. [Google Scholar] [CrossRef]
  35. Chen, Y.; Wang, K.; Lin, Y.; Shi, W.; Song, Y.; He, X. Balancing green and grain trade. Nat. Geosci. 2015, 8, 739–741. [Google Scholar] [CrossRef]
  36. Mo, K.; Cong, Z.; Lei, H. Optimal vegetation cover in the Horqin Sands, China. Ecohydrology 2016, 9, 700–711. [Google Scholar] [CrossRef]
  37. Wang, S.; Fu, B.; Chen, H.; Liu, Y. Regional development boundary of China’s Loess Plateau: Water limit and land shortage. Land Use Policy 2018, 74, 130–136. [Google Scholar] [CrossRef]
  38. Ishii, R.; Higashi, M. Tree coexistence on a slope: An adaptive significance of trunk inclination. Proc. R. Soc. B Boil. Sci. 1997, 264, 133–139. [Google Scholar] [CrossRef] [Green Version]
  39. Anderson, K.E.; Furley, P.A. An assessment of the relationship between the surface properties of chalk soils and slope form using principal components analysis. J. Soil Sci. 1975, 26, 130–143. [Google Scholar] [CrossRef]
  40. Wang, J.Y.; Wang, Y.L.; Jin, B.W. Studies on regulating function of forest hydrology and microclimate in arid and semi—Arid area of west China. Sci. Silvae Sin. 2001, 37, 120–125. [Google Scholar]
  41. Wood, T.; Lawrence, D.; Clark, D.A. Determinants of Leaf Litter Nutrient Cycling in a Tropical Rain Forest: Soil Fertility Versus Topography. Ecosystems 2006, 9, 700–710. [Google Scholar] [CrossRef]
  42. Griffiths, R.; Madritch, M.; Swanson, A. The effects of topography on forest soil characteristics in the Oregon Cascade Mountains (USA): Implications for the effects of climate change on soil properties. For. Ecol. Manag. 2009, 257, 1–7. [Google Scholar] [CrossRef]
  43. Song, X.; Wang, G.; Ran, F.; Chang, R.; Song, C.; Xiao, Y. Effects of topography and fire on soil CO2 and CH4 flux in boreal forest underlain by permafrost in northeast China. Ecol. Eng. 2017, 106, 35–43. [Google Scholar] [CrossRef]
  44. Garcia-Pausas, J.; Casals, P.; Camarero, L.; Huguet, C.; Sebastià, M.T.; Thompson, R.; Romanyà, J. Soil organic carbon storage in mountain grasslands of the Pyrenees: Effects of climate and topography. Biodegradation 2007, 82, 279–289. [Google Scholar] [CrossRef]
  45. Pennock, D.J. Precision conservation for co-management of carbon and nitrogen on the Canadian prairies. J. Soil Water Conserv. 2005, 60, 305–306. [Google Scholar]
  46. Wang, M.; Zhang, W.H. Growth and Species Diversity of Pinus tabulaeformis Artificial Forest on different Slope Aspects. Acta Bot. Boreali Occident. Sin. 2009, 29, 1678–1683. [Google Scholar]
  47. Sizemskaya, M.L.; Jiao, J.Y.; Wang, N.; Sapanov, M.K.; Wu, Q.X.; Jia, Y.F.; Kolesnikov, A.V.; Liu, G.B.; Sapanov, P.M. Specificity of afforestation under conditions of moisture deficit in south of Russian plain and the Loess Plateau of China. Res. Soil Water Conserv. 2009, 16, 73–77. [Google Scholar] [CrossRef]
  48. Nan, G.W.; Wang, N.; Jiao, L.; Zhu, Y.M.; Sun, H. A new exploration for accurately quantifying the effect of afforestation on soil moisture: A case study of artificial Robinia pseudoacacia in the Loess Plateau (China). For. Ecol. Manag. 2019, 433, 459–466. [Google Scholar] [CrossRef]
  49. Hou, G.; Bi, H.; Wei, X.; Wang, N.; Cui, Y.; Zhao, D.; Ma, X.; Wang, S. Optimal configuration of stand structures in a low-efficiency Robinia pseudoacacia forest based on a comprehensive index of soil and water conservation ecological benefits. Ecol. Indic. 2020, 114, 106308. [Google Scholar] [CrossRef]
  50. Deng, L.; Zhu, G.-Y.; Tang, Z.-S.; Shangguan, Z.-P. Global patterns of the effects of land-use changes on soil carbon stocks. Glob. Ecol. Conserv. 2016, 5, 127–138. [Google Scholar] [CrossRef] [Green Version]
  51. Li, Y.; Hui, G.; Zhao, Z.; Hu, Y. The bivariate distribution characteristics of spatial structure in natural Korean pine broad-leaved forest. J. Veg. Sci. 2012, 23, 1180–1190. [Google Scholar] [CrossRef]
  52. Wei, W.; Chen, L.; Fu, B.; Chen, J. Water erosion response to rainfall and land use in different drought-level years in a loess hilly area of China. Catena 2010, 81, 24–31. [Google Scholar] [CrossRef]
  53. Fu, B.; Liu, Y.; Lü, Y.; He, C.; Zeng, Y.; Wu, B. Assessing the soil erosion control service of ecosystems change in the Loess Plateau of China. Ecol. Complex. 2011, 8, 284–293. [Google Scholar] [CrossRef]
  54. Jia, X.X.; Shao, M.A.; Yu, D.X.; Zhang, Y.; Andrew, B. Spatial variations in soilwater carrying capacity of three typical reveg-etation species on the Loess Plateau, China. Agric. Ecosyst. Environ. 2019, 273, 25–35. [Google Scholar] [CrossRef] [Green Version]
  55. Jian, S.; Zhao, C.; Fang, S.; Yu, K. Effects of different vegetation restoration on soil water storage and water balance in the Chinese Loess Plateau. Agric. For. Meteorol. 2015, 206, 85–96. [Google Scholar] [CrossRef]
  56. Sun, B.; Yang, G.T.; Li, H.; Ma, R.P. The age structure of population and community succession of Betula platyphylla Suk. J. Northeast. For. Univ. 1994, 3, 43–48. [Google Scholar]
  57. Zhang, J.C.; Chen, L.; Guo, Q.S.; Nie, D.P.; Bai, X.L.; Jiang, Y.X. Research on the change trend of dominant tree population distribution patterns during development process of climax forest communities. Chin. J. Plant Ecol. 1999, 23, 256–268. [Google Scholar]
  58. Zhang, X.; Zhao, X.; Kang, F.F.; Wang, J.W.; He, Z.B.; Ma, Q.; Li, W.M.; Yao, Z. Spatial pattern of the trees in a natural Pinus tabulaeformis forest in Taiyue Mountain. Acta Ecol. Sin. 2010, 30, 4821–4827. [Google Scholar]
  59. Yi, L.T.; Han, H.R.; Cheng, X.Q.; Kang, F.F.; Zhang, Z.J. Spatial distribution patterns of Quercus liaotungensis population in Lingkong Mountains. Acta Ecol. Sin. 2008, 28, 3254–3261. [Google Scholar]
Figure 1. The location of the sample plots at the Caijiachuan watershed of the Loess Plateau, China.
Forests 13 01217 g001
Figure 2. The correlation between the SSTFs and EFFIs. The bar and circle symbols use the same colors to indicate correlations with shading and saturation. The blue color with a diagonal line from the bottom left to the top right indicates two positively correlated variables, and the red color with a diagonal line from the top left to the bottom right indicates two negatively correlated variables. The darker the color, the greater the correlation between the variables. The blue pie chart filled clockwise from 12 o’clock indicates that the two variables are positively correlated, and the red pie chart filled counterclockwise indicates that the two variables are negatively correlated. Abbreviations: SSTFs, stand structure and topographical factors; EFFIs, functional indices of ecological function; WF, water-holding function; SF, soil improvement function; RF, function of reducing runoff and sediment yield on the slope; PF, diversity function of the understory plants; SL, slope; AS, aspect; AL, altitude; SD, stand density; CD, canopy density; NYTR, number of young trees renewed; DBH, diameter at breast height; TH, tree height; CA, crown area; LAI, leaf area index; W, uniform angle index; U, neighborhood comparison; SCI, stand competition index; and SI, stand layer index.
Forests 13 01217 g002
Figure 3. The redundancy analysis ordination diagram of the SSTFs and EFFIs. In the sequence diagram, the arrows represent the SSTFs or EFFIs; the length of the arrows reflects the strength of the relationship between the SSTFs and EFFIs; the angle between the arrows indicates the correlation. An angle less than 90° indicates a positive correlation; an angle greater than 90° indicates a negative correlation. The smaller the angle, the higher the correlation; the larger the angle, the lower the correlation. Abbreviations: SSTFs, stand structure and topographical factors; EFFIs, functional indices of ecological function; WF, water-holding function; SF, soil improvement function; RF, function of reducing runoff and sediment yield on the slope; PF, diversity function of the understory plants; AL, altitude; SD, stand density; W, uniform angle index; SL, slope; TH, tree height; SCI, stand competition index; CA, crown area; CD, canopy density; AS, aspect; DBH, diameter at breast height; NYTR, number of young trees renewed; LAI, leaf area index; SI, stand layer index; and U, neighborhood comparison.
Forests 13 01217 g003
Figure 4. The coupling relationship model of the SSTFs and EFFIs. p = 0.40; RMSEA = 0.056; CFI = 0.995; GFI = 0.860; AGFI = 0.564 NFI = 0.907; IFI = 0.995. Abbreviations: SSTFs, stand structure and topographical factors; EFFIs, functional indices of ecological function; AL, altitude; SD, stand density; W, uniform angle index; WF, water-holding function; SF, soil improvement function; RF, function of reducing runoff and sediment yield on the slope; PF, diversity function of the understory plants; ** = p < 0.01; and *** = p < 0.001. The black numbers represent the positive effect; the red numbers represent the negative effect.
Forests 13 01217 g004
Figure 5. The multi-factor response surface models for ecological function improvement in the Pinus tabuliformis forest. Note: The multi-factor response surface models were established to enhance the WF (A), SF (B), RF (C), and PF (D). Abbreviations: WF, water-holding function; SF, soil improvement function; RF, function of reducing runoff and sediment yield on the slope; PF, diversity function of the understory plants; AL, altitude; SD, stand density; and W, uniform angle index.
Forests 13 01217 g005
Table 1. The characteristics of SSTFs and EFFIs of the Pinus tabuliformis.
CategoryGrade I IndexGrade II IndexMaxMinMeanVC
SSTFsTopographic
factors
Slope (°)352629.750.112
Aspect412.500.368
Altitude (m)1150113011430.007
Stand structure
factors
Stand density (plant·hm−2)180060011060.326
Canopy density0.870.540.700.139
Number of young trees renewed (n)7.002.004.190.350
Diameter at breast height (cm)14.5511.9113.250.068
Tree height (m)8.695.787.060.121
Crown area (m2)16.747.0410.550.274
Leaf area index3.041.251.970.259
Uniform angle index0.700.380.520.187
Neighborhood comparison0.630.250.520.174
Stand competition index2.231.171.570.193
Stand layer index0.500.000.190.866
EFFIsWFCanopy interception rate (%)20.408.7015.280.216
WRRU (%)7.322.623.340.331
WRRS (%)5.402.733.720.154
Soil infiltration rate (mm/h)277.05219.30236.160.10
Soil moisture content (%)0.170.060.110.256
Maximum water holding capacity (%)0.610.260.470.172
SFTotal nitrogen (g/kg)1.760.180.710.720
Ammonia-nitrogen (mg/kg)34.4217.7225.410.196
Nitrate-nitrogen (mg/kg)13.331.566.670.422
Total phosphorus (g/kg)1.820.470.670.495
Available phosphorus (mg/kg)55.6625.5236.370.212
Soil organic matter (g/kg)18.973.499.260.417
RFAverage runoff yield (mm)78.0265.4272.520.041
Average sediment yield (t·km−2)604361462.940.184
PFShannon diversity index
of the shrubs
1.610.491.170.373
Simpson diversity index
of the shrubs
0.750.490.670.158
Pielou uniformity index
of the shrubs
0.830.680.760.089
Shannon diversity index
of the herbs
1.911.531.750.078
Simpson diversity index
of the herbs
0.800.730.770.038
Pielou uniformity index
of the herbs
0.860.800.840.029
Abbreviations: SSTFs, stand structure and topographical factors; EFFIs, functional indices of ecological function; VC, variable coefficient; WF, water-holding function; SF, soil improvement function; RF, function of reducing runoff and sediment yield on slope; PF, diversity function of the understory plants; WRRU, water retention rate of the litter in the undecomposed layer; and WRRS, water retention rate of the litter in the semi-decomposed layer.
Table 2. The weighted values of the EFFIs of the Pinus tabuliformis forest.
Grade I IndexWeightGrade II IndexWeight
WF0.319Canopy interception rate0.023
WRRU0.104
WRRS0.025
Soil infiltration rate0.026
Soil moisture content0.127
Maximum water holding capacity0.015
SF0.323Total nitrogen0.064
Ammonia-nitrogen0.035
Nitrate-nitrogen0.026
Total phosphorus0.126
Available phosphorus0.038
Soil organic matter0.034
RF0.062Average runoff yield0.026
Average sediment yield0.036
PF0.296Shannon diversity index
of the shrubs
0.046
Simpson diversity index
of the shrubs
0.042
Pielou uniformity index
of the shrubs
0.065
Shannon diversity index
of the herbs
0.045
Simpson diversity index
of the herbs
0.05
Pielou uniformity index
of the herbs
0.048
Abbreviations: EFFIs, functional indices of ecological function; WF, water-holding function; SF, soil improvement function; RF, function of reducing runoff and sediment yield on the slope; PF, diversity function of the understory plants; WRRU, water retention rate of the litter in the undecomposed layer; and WRRS, water retention rate of the litter in the semi-decomposed layer.
Table 3. The SSTFs-explained variance of the EFFIs of the Pinus tabuliformis forest.
SSTFsExplanation %Contribution %pseudo-Fp
Altitude44.548.111.20.002 **
Stand Density15.817.05.20.006 **
Uniform Angle15.016.27.30.004 **
Slope4.44.72.40.076
Tree Height2.72.91.50.246
Stand Competition Index1.31.40.70.526
Crown Area0.60.70.30.734
Canopy Density1.71.80.80.444
Aspect1.21.30.50.562
Diameter at Breast Height0.70.80.30.644
Number of Young Trees Renewed0.70.80.30.728
Leaf Area Index1.11.20.30.694
Stand Layer Index2.22.30.50.576
Neighborhood Comparison0.70.8<0.10.844
NOTE: ** = p < 0.01. Abbreviations: SSTFs, stand structure and topographical factors; EFFIs, functional indices of ecological function; and NYTR, number of young trees renewed.
Publisher’s Note: MDPI stays neutral with regard to jurisdictional claims in published maps and institutional affiliations.

