Abstract
Clear-cutting removes a stand cover suddenly, thus impacting soil-surface conditions by the expected increase in the humus breakdown rate, due to the addition of more precipitation and solar radiation. The impacts of removing a forest were studied at a site with deep sandy soils dominated by Scots pine, where three treatments, including a stand left on site, whole-tree harvesting treatment, and stem-only harvesting treatment, were established. Clear-cut precipitation and sub-canopy throughfall were measured. The non-replicated treatments were equipped with lysimeters at depths of −10 cm and −70 cm and in addition, three exploratory wells were drilled to sample groundwater in each of the treatments. The volume and chemistry of the water samples were periodically analyzed. The mean throughfall was 84% of open-area precipitation and the pH of the water penetrating the canopy was significantly lower overall, although the subcanopy samples were only slightly more acidic. Significant differences among the treatments were shown in throughfall (total organic carbon, TOC), shallow subsurface water (pH, TOC, NO3−), subsurface water at the 70-cm depth (NO3−) and also groundwater (pH, TOC, NO3−), where some of the differences had been observed before the stand parts were clear-cut. Limits for drinking water were exceeded in groundwater pH, as the values from both clear-cut sites fell below pH 6.5 following clear-cutting. TOC greater than 5 mg·L−1 was found in the Q1-2020 samples, whereas groundwater nitrate remained low, even though the three wells differed significantly from each other. Due to the non-replicated design of the experiment, generalization of the outcomes is a matter of further research.
1. Introduction
Contrary to agricultural land, a forest is capable of retaining water in the landscape, thus stabilizing runoff from a catchment (e.g., [1]). Although showing higher total evapotranspiration [2], forests contribute more to groundwater recharge (e.g., [3]) and the maintenance of groundwater storage [4], due to the minimization of surface runoff.
Based on that information, the impact of forest management on both the volume and quality of surface water [5], subsurface water [6] and groundwater have been frequently discussed (e.g., [2,7,8,9,10,11]). Negative consequences are particularly apparent in connection with clear-cutting. The main points are as follows: how much water is retained and accumulated in a forest and also how groundwater recharge rates are influenced by many factors, such as climate, meteorology, topography, properties of percolating water and soil, geology and vegetation [9].
The removal of living above-ground biomass due to clear-cutting reduces evapotranspiration and nutrient pools in an ecosystem [12]. Soil surface exposed to direct solar radiation changes with respect to topsoil temperature and moisture content, thus increasing the breakdown rate of forest-floor humus layers [13,14], to which both ground vegetation and soil biota respond [15,16]. Therefore, an impact on the volume and quantity of subsurface percolating water and groundwater can be expected.
Clear-cutting is a common practice in nutrient-poor pine forests. The removal of a stand increases the amount of water that falls onto the forest floor. Water with dissolved substances readily percolates through deep sandy soils, which have low ability to retain water [17]; these are then expected to enter deeper soil layers, potentially having an impact on groundwater properties.
Based on the monitoring of precipitation and percolation water in a forest stand and on clear-cuts, the objective of this study was to estimate the impact of clear-cutting using whole-tree and stem-only harvesting on the previously mentioned water balance components. The volume and water properties, such as pH, total organic carbon (TOC), nitrates, ammonium nitrogen and phosphates, were analyzed and we considered whether clearcutting threatened the groundwater as a theoretical source of drinking water [18].
2. Materials and Methods
2.1. Study Site
The experimental site was established in the municipal forests of Hradec Králové city in spring 2017 (50.18 N, 15.96 E). It was designed as three non-replicated research plots, comprising a forest stand left on site without any felling (Control) and two clear-cut stands (Clear-cut 1 and 2). The forest site is a “Scots pine with sessile oak on nutrient-poor soils” [19] at an altitude of 255 m (Figure 1). The age of the treatments ranged from 85 to 98 years; all stands were dominated by Scots pine, other tree species were Norway spruce growing mostly in lower-storey and also rarely Weymouth pine [19]. Scots pine forms from 91 to 93% of the stand basal area, which was 44, 42 and 42 m2 in Clear-cut 1, 2 and Control, respectively. The average height of Scots pine was from 27 to 28 m at the research plots [20]. The forest soils of the study site included unconsolidated fluvial sandy gravel sediments of a Pleistocene origin, below which Cretaceous sediments existed [21,22].
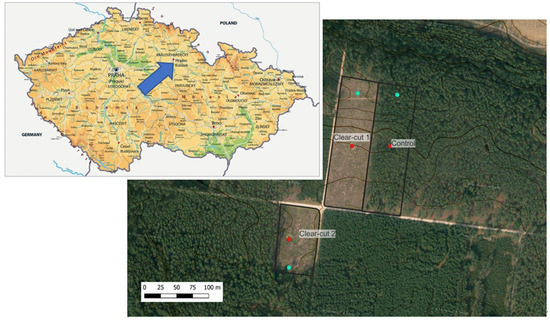
Figure 1.
Experimental site after clear cutting, showing the positions of the lysimeter probes (red dots) and groundwater wells (blue dots) and terrain contour lines of 1 m interval. Source: map of the Czech Republic: Orangesmile (https://www.orangesmile.com/common/img_country_maps_physical/czech-republic-map-physical-0.jpg accessed on 1 April 2020), Orthophoto: Mapy.cz; Contours: ZABAGED.
Each of the three treatments was equipped with ten 0.1 m2 pan lysimeters made of pan sheet that were placed into the intact soil profile at a depth of 70 cm in the middle of the plot. Besides these, three shallow-placed lysimeters (at a depth of about 10 cm) with total area of 0.3 m2 were added to catch water percolating through the forest floor below the Control treatment (see [23]). The square lysimeters with ca 5-cm-high rims were made from zinc-plated iron sheet and have cone-shaped bottom draining water caught within its area to front lower spot from which hoses collected water into barrels. Furthermore, one rain gauge was installed within the adjacent clear-cut treatment and two rain gauges were placed below the canopy of the Control stand.
According to particular geomorphology, three exploratory wells were drilled at the lowest altitudes of the research plots where the highest response of groundwater properties to above-ground conditions of the respective plot was expected. The casing inner diameter of the three wells was 12.3 cm; each well was equipped with a submersible pump. The groundwater table levels were at 4 m in wells GW_1, GW_3 and at 8 m in well GW_2 (Figure 2). The deeper drilling in GW_2 was due to the convex surface of the terrain.
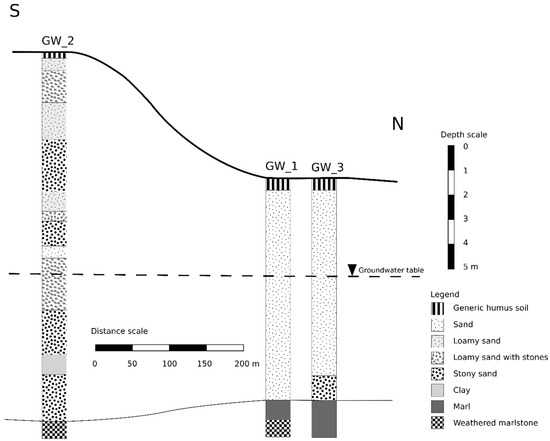
Figure 2.
Simplified geological section of the experimental site. GW–groundwater well.
In November 2017, both clear-cut treatments were established. All trees were harvested in the area of 1.1 ha and 0.6 ha in the Clear-cut 1 and Clear-cut 2 treatments, respectively and the stand was left on site on the Control plot. Logging residue removal and soil disking was conducted at the Clear-cut 1 site and windrows of logging residues were left at the Clear-cut 2 site (Figure 3). In spring 2018, both Clear-cut sites were equipped with shallow lysimeters below the forest floor at a depth of 10 cm (see Table 1). In the Clear-cut 1 treatment, the lysimeters were installed to catch percolating water below both the furrow and undisturbed topsoil, which was additionally covered with an overturned slice of forest-floor humus after disking (see [23]).
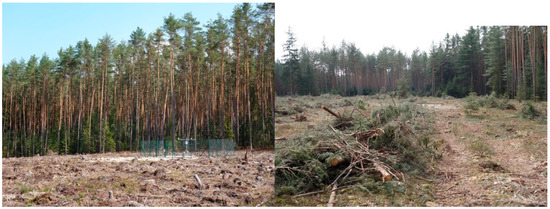
Figure 3.
Clear-cut 1 in front of Control (left) and Clear-cut 2 (right).

Table 1.
Research plots (treatments) and their equipment with abbreviations. L-10_1 and L-10_2 were installed in spring 2018, the other equipment measurements date from 2017.
2.2. Sampling and Storage of the Samples
The sums of precipitation were measured and the samples of precipitation water, lysimeter water, and also groundwater samples were taken at three-week intervals. Sampling started in May 2017. Groundwater was taken using a portable battery to power the pumps, and the water was collected after 10 min of draining (running the pump; according to ČSN EN ISO 5667-1 (757051)). In the laboratory, the lysimetric samples were filtered to reduce the amount of raw material using multi-layered filter paper. The samples were kept under dark and cold conditions (4 °C) prior to the analyses, following ČSN EN ISO 5667-3 (757051).
2.3. Chemical Analyses
pH values were measured potentiometrically using an HQ 30d multimeter (Hach Lange s.r.o., Prague, Czech Republic) with a combined electrode following ČSN ISO 10523 (757365). Total organic carbon (TOC) was measured using a Formacs TOC Analyzer (Skalar Analytical B.V., Breda, The Netherlands) with an infrared detector and 50 μL was injected according to ČSN EN 1484 (757515). The determination of ammoniacal nitrogen was performed using a UV/VIS DR 6000 spectrophotometer (Hach Lange s.r.o., Prague, Czech Republic) at 655 nm following ČSN ISO 7150-1 (75 7451). A coloring agent (4 mL) and sodium dichloroisocyanate (4 mL) were added to 40 mL of the sample and the volume was increased to 50 mL by adding deionized water. After standing for one hour, the mixture was transferred to a 4 cm cuvette and the concentration of ammoniacal nitrogen was calculated using a calibration curve.
Ion chromatography was performed via a Compact IC Flex Oven/SeS/Deg (Metrohm, Switzerland) with the following parameters: Metrosep A Supp 5 chromatographic column (150 × 4.0 mm; 5 μm), a flow rate of 0.7 mL/min, injection volume of 20 μL, and column temperature at 30 °C. The isocratic elution was set with a total run time of 20 min, where the mobile phase was deionized water containing 1 mmol/L sodium bicarbonate and 3.2 mmol/L sodium carbonate. The method was developed by Metrohm (Herisau, Switzerland). The ion chromatography system was coupled to a conductivity detector and data were acquired using Magic Net 3.2 software (Metrohm, Herisau, Switzerland). The concentrations of nitrate ions and phosphorus contained in the phosphates were determined using calibration curves that were constructed based on the area of the chromatographic peaks.
2.4. Methods of Data Analyses
Precipitation/throughfall and seepage waters on each measuring date were compared with one another to verify the functionality of the equipment and to capture any eventual disproportions. To stabilize the vegetation and humus layers in the topsoil lysimeters, seepage data from the −10 cm layer were included from the third quarter of 2018 only. The amount of precipitation in both gauges was averaged. Subsequently, the precipitation and seepage sums of each measured feature per individual quarter year were counted. The sums and their shares are presented.
Based on the exploratory analysis, the consistency of the data of the analyzed chemical parameters and their distribution was evaluated. Considering the low number of samples, significant outliers were excluded, including 2 extremely high TOC values and 1 extremely low value of NH4+ in the precipitation data; 1 high TOC value in the water percolating through forest-floor humus (L-10) data; 1 low pH, 1 high TOC and 2 high NH4+ in the water percolating at the 70-cm depth (L-70) data; and 3 high TOC in the groundwater data. The chemical data obtained in individual quarter years were compared. In prior analyses, the TOC, NO3− and NH4+ data were logarithmically transformed to improve their properties. The period declared as the post-harvesting period started in the third quarter (Q3) of 2018 to exclude the time of unbalanced conditions after clear-cutting. The data were analyzed using t-test or ANOVA (in case of heteroscedasticity with Welch’s correction) with a subsequent Tukey test, respectively. The analyses were performed using software such as MS Excel and R 4.0.3 [24]. The results were considered to be significant at p ≤ 0.05.
3. Results
3.1. Precipitation and Infiltration
The mean below-canopy throughfall was 16% lower compared to open-area precipitation. Particular throughfall values of the quarter years ranged from 4% to 26%, depending on the amount of precipitation and air temperatures. The highest amount of precipitation occurred in Q2-2020, the lowest in Q1-2018 (see Table 2). In dry 2018, the open-area precipitation totaled 465 mm and throughfall amounted to 386 mm, whereas both values were 688 mm and 593 mm in the next year, respectively.
Table 2.
Quarter sums of precipitation (PP), throughfall (PT) and percolating water ca. 10 cm (L-10) and 70 cm (L-70) below the soil surface according to treatments (1 = Clear-cut 1; 2 = Clear-cut 2; 3–Control plot). Q2 *-from 22.5.2017. L-10_1 and L-10_2 are presented after clear-cutting and stabilization of the equipment. The thick line represents the term of clear cutting.
The relative total amount of water percolating through the forest-floor humus (L-10) did not differ between the Control and Clear-cut 2 treatments; it reached 37% of throughfall (Control) and precipitation (CC2), respectively. The disking at the Clear-cut 1 site increased the amounts of percolating water L-10 in the summer months; therefore, its total reached 48% of precipitation.
The deeper lysimeters at the 70-cm depth (L-70) showed more water percolating below both clear-cut treatments compared to the Control covered with a forest stand (L-70_3), which corroborated significantly more water used for transpiration by trees compared to clear-cut vegetation. A higher total value of percolating water was observed at the Clear-cut 2 treatment (L-70_2); however, the sum of the differences from L-70_1 totaled a mere 18 mm (Table 2). The mean amounts in L-70_1, L-70_2 and L-70_3 represented 8%, 9% and 3% of the quarterly sums of precipitation, respectively. In the dry summer 2018, just 0.7% of open-area precipitation was observed to percolate through 70 cm of the soil below the forest stand left on site in the Control treatment.
3.2. Shifts of pH in Water
The mean pH in precipitation water (S) ranged from 5.8 to 7.6 in the open-area and from 5.5 to 7.5 below the Control stand. Significant differences were found only in Q1-2018 (p = 0.02), Q4-2017 and Q1-2020 (p < 0.1). The whole-period values showed significantly lower pH 6.5 in the throughfall water compared to pH 6.7 in open-area precipitation (p = 0.006, see Table 3).
Table 3.
Average pH in precipitation (PP), throughfall (PT), percolating water ca. 10 cm (L-10) and 70 cm (L-70) below the soil surface and in groundwater (GW) according to treatments (1 = Clear-cut 1; 2 = Clear-cut 2; 3–Control plot). L-10_1 and L-10_2 are presented after clear-cutting and stabilization of the equipment. The thick line represents the term of clear-cutting, while the dashed line states the beginning of the period designated as “after felling”. Different letters indicate statistically heterogeneous groups within a given characteristic and quarter.
Water percolating through the forest floor showed pH values ranging between 4.5 and 7.1. Regarding the clear-cuts, L-10_1 pH increased, whereas L-10_2 pH slightly decreased. L-10_3 pH values at the Control also slightly decreased. Significantly higher values were found between the L-10_1 and L-10_2 clear-cuts in the two last quartiles (p = 0.007 and <0.001; Table 3).
The pH of the deeper (70-cm) percolating water ranged between 5.9 and 7.6. A mean pH rise was observed between Q3 and Q4 in all years analyzed (Table 3). The statistical significance of the differences among the treatments was reduced due to the relatively low numbers of L-70 percolation events; the Control treatment did not differ compared to either clear-cut treatment (p = 0.8).
The pH of the groundwater ranged between 5.2 and 7.3 throughout the whole period. Prior to harvesting, there was no statistical difference of mean quartile groundwater pH below the three stands. After harvesting, water pH began to decrease in both clear-cut wells compared to the Control stand. Beginning in Q2-2019, the pH of the three treatments started to differ significantly from each other (Table 3). The same was also confirmed for the whole after-harvest period (p < 0.001).
3.3. TOC
Throughfall TOC ranging between 6.3 and 58.9 mg·L−1 was significantly higher (p < 0.001) compared to the open-area TOC, although the second showed a wider range (0.43–69.0 mg·L−1). Statistically significant differences were frequently observed, except for Q4-2017, Q4-2019, Q1-2020 and Q2-2020 (Table 4).
Table 4.
Average TOC (mg·L−1) concentrations in precipitation (PP), throughfall (PT), percolating water ca. 10 cm (L-10) and 70 cm (L-70) below the soil surface and in groundwater (GW) according to treatments (1 = Clear-cut 1; 2 = Clear-cut 2; 3–Control plot). L-10_1 and L-10_2 are presented after clear-cutting and stabilization of the equipment. The thick line represents the term of clear-cutting, while the dashed line states the beginning of the period designated as “after felling”. Different letters indicate statistically heterogeneous groups within a given characteristic and quarter.
Shallow subsurface water (L-10) TOC ranged between 52 and 312 mg·L−1. The Clear-cut 1 values were significantly higher compared to Clear-cut 2 at the end of 2018. However, the 2019 values decreased and the Q2–Q4 period presented by far the lowest TOC values below Clear-cut 1 (Table 4). Following clear-cutting, both treeless treatments L-10 waters were significantly lower in TOC, compared to the stand left on site (p ≤ 0.001).
Infiltrating water caught at 70-cm depths showed significant TOC differences among the treatments only in isolated cases. However, the whole after-harvest period showed significantly lower TOC below both clear-cut treatments (Table 4; p = 0.002). TOC concentrations at L-70 ranged between 9 and 64 mg·L−1.
Groundwater TOC differences were found from the very beginning of sampling, i.e., even before clear-cutting (Table 4). Particularly, the Clear-cut 1 and Control wells showed fluctuating values; a trend of increasing TOC was observed in the last three quarters. The groundwater TOC ranged from the detectable limit to 18 mg·L−1. Whole-period groundwater TOC was significantly lower in the Clear-cut 2 well compared to the others (p < 0.001); following clear-cutting, a difference was found only between both clear-cut treatments (p = 0.02).
3.4. Nitrate Concentrations
A higher mean nitrate concentration was found in throughfall (4.9 mg·L−1 with a range of 0.7–26.0 mg·L−1) compared to open-area precipitation (3.0 mg·L−1 with a range of 0.3–12.0 mg·L−1; p < 0.001). A significant difference was found only in Q1-2020 (Table 5).
Table 5.
Average NO3− (mg·L−1) concentrations in precipitation (PP), throughfall (PT), percolating water ca. 10 cm (L-10) and 70 cm (L-70) below the soil surface and in groundwater (GW) according to treatments (1 = Clear-cut 1; 2 = Clear-cut 2; 3–Control plot). L-10_1 and L-10_2 are presented after clear-cutting and stabilization of the equipment. The thick line represents the term of clear-cutting, while the dashed line states the beginning of the period designated as “after felling”. Different letters indicate statistically heterogeneous groups within a given characteristic and quarter.
At the beginning, nitrate concentrations at L-10 of the clear-cut treatments were similar to the Control. Beginning in Q4-2019, they started to be significantly higher (Table 5). The maximum concentrations reached 88 mg·L−1 in the Control plot, and 153 and 118 mg·L−1 in Clear-cut 1 and 2, respectively.
A relative (compared to the Control) and absolute increase in NO3− concentrations at L-70 of the clear-cut treatments began 1 year after felling, since Q4-2018 (Table 5). This could be connected to the intensive occurrence of game in the proximity of the lysimeters, which was assessed from their traces within the area of the -70 lysimeter placement (the lysimeters at Clear-cut 1 were fenced in). The maximum concentrations of the individual L-70 samples were 18 mg·L−1 at the Control and 76 and 178 mg·L−1 at the Clear-cut 1 and 2 treatments, respectively.
Nitrate concentrations in the ground water of Clear-cut 2 were significantly higher from the beginning of the monitoring period, i.e., already before the harvest. Following felling, the nitrate concentrations in well water significantly increased under both clear-cuts (p < 0.001, Table 5). The slope of the nitrate regression line in Clear-cut 2 was higher (0.27) than in Clear-cut 1 (0.22). The nitrate concentration of the groundwater under the Control showed no trend (p = 0.6). The maximum concentrations reached 3 mg·L−1 in the Control, and 5 and 8 mg·L−1 in Clear-cut 1 and 2, respectively.
3.5. Ammonium Nitrogen
The concentrations of ammonium nitrogen in precipitation (PP) during the monitored period ranged from 13 to 2408 µg·L−1 and they were significantly lower (p = 0.02) than throughfall concentrations (which ranged from 78 to 2054 µg·L−1). When we compared the individual quarters, only two differences between precipitation and throughfall were significant (winter quarters; Table 6).
Table 6.
Average NH4+ (µg·L−1 ) concentrations in precipitation (PP), throughfall (PT), percolating water ca. 10 cm (L-10) and 70 cm (L-70) below the soil surface and in groundwater (GW) according to treatments (1 = Clear-cut 1; 2 = Clear-cut 2; 3–Control plot). L-10_1 and L-10_2 are presented after clear-cutting and stabilization of the equipment. The thick line represents the term of clear-cutting, while the dashed line states beginning of the period designated as “after felling”. Different letters indicate statistically heterogeneous groups within a given characteristic and quarter.
With the exception of the first year, NH4+ concentrations at L-10 indicated year-round descending trends (Table 6). The values ranged from 15 to 3176 µg·L−1 with no significant differences found among the treatments.
NH4+ concentrations at L-70 showed strong variations. The values ranged from 13 to 2306 µg·L−1 without any differences either per quarter or in the data of the entire period after felling (p = 0.9; Table 6).
Ammonium nitrogen concentrations in the groundwater fluctuated between 1 and 87 µg·L−1. Higher values were observed at the beginning (until Q1-2018). No significant differences among the treatments were found (Table 6).
3.6. Phosphates
Precipitation was low in phosphates (max. 0.5 mg·L−1); however, their concentrations in throughfall were significantly higher (p < 0.001; max. 1.5 mg·L−1). Phosphates at L-10 were the highest in 2018 (up to 2.0 mg·L−1), but there were never any differences among the treatments. At the deeper lysimeters (L-70), the values were mostly below the detection level (which was 0.1 mg·L−1) with a maximum of 0.3 mg·L−1 and, again, with no differences among the treatments. The concentrations in groundwater were detectable by the method used, but again with a maximum of 0.3 mg·L−1 and with no significant differences among the treatments.
4. Discussion
The clear-cutting of forest stands significantly impacts nutrient cycles [25,26,27], as well as changes soil properties [28], especially if it is accompanied with total above-ground biomass removal when whole-tree harvesting is used (for data from the same study site, see [20]). The nutrient cycle change in a forest ecosystem is, however, also attributable to natural processes, e.g., for nitrates see [29]. For example, air-polluted [30,31], dormant [32,33] and bark beetle-infested forests [34] showed a diminished consumption of nitrates, which can be reflected in increased concentrations of nitrates in surface streams [31,34]. The deliberate harvesting of a stand ceases the function of “nutrient pump”, which also leads to increased nitrates in groundwater following clear-cutting [7,35,36]. This can be shown even over a few years following clear-cutting [37,38] and corresponds with our findings.
The different concentrations of nitrates observed in the wells of the Control and Clear-cut 1 treatments, which were close by, already from the beginning of the monitoring, were noteworthy. Both the drilling depth and geological layering of the two wells were almost the same (Figure 2). However, the presence of some rifts in the bottom Cretaceous layer with weathered marvel drilled in GW_1 was likely, which could have connected aquifers of a different origin with higher nitrate concentrations. This is, however, a question for further verification.
Precipitation acidity is a consequence of emissions and chemical processes in the atmosphere [39], whereas throughfall pH is additionally influenced by contact with the tree crown layer. Pierret et al. [40] showed that the structure and persistence of needles (they investigated spruce) enhanced the capture of particles in water, accentuating the acidity of the deposition, thus leading to the intensification of acidification processes and nutrient leaching in soils [40]. A similar impact on soil solutions was observed at L-10 from Q1-2019 in our study, at least with respect to Clear-cut 1 (Table 3).
In addition, other substance contents can increase as precipitation falling through the canopy washes out dry deposition from surfaces [41,42]. This effect can be observed on TOC and also NO3− concentrations in throughfall in our study, which also obviously influenced their concentrations in soil water solutions. The differences in TOC of throughfall and precipitation were the highest in 2018, when low precipitation sums probably led to higher concentrations of the solution. A similar situation in groundwater could be observed after about a half-year delay. The outcomes correspond to the analyses performed in a Douglas-fir stand [26]. On the other hand, broadleaves can reduce the acidity of throughfall and the acidification of soil leachates under broadleaved species would be lower compared to that below conifers [43].
As was shown in our study, clear-cutting combined with felling residue removal and soil surface ploughing can mitigate acidification of the upper soil layer to some extent. It is likely affected by furrows’ surfaces, where the infiltrating water was minimally affected by the forest floor humus. As water penetrated the deeper soil, pH levels became comparable among all treatments. On the other hand, groundwater pH dropped below both clear-cut treatments compared to the control stand. The acidification rate seems to correspond with the size of the clear-cut. Considering the different methods of harvesting and soil preparation, as well as the ambiguous progress of the pH levels at L-10 and L-70, this hypothesis can be hardly proved. Similarly, whole-profile nitrates were affected by clear-cutting; on the other hand, the trend was not so obvious for TOC. In addition, both clear-cut wells differed as they showed different layers within the profile (Figure 2). As mentioned above, neighboring GW_3 and GW_1 were similar in their profiles and differed only in the immediate roof and underlying rock of a marl layer. The more distant GW_2 differed in alternating layers of fine-grain and middle-grain slightly loamy sand. From depths of 5.6–6.8 m, the sand contained more loam compared to the overlying and underlying layers around the GW_2 well. These variations could also explain the different filtering effects of the soil profiles (compare [44]). For example, water flow moves downwards quickly through gravely layers at deeper parts of an unsaturated zone [45].
Both the acidity and the content of nitrates are important parameters of drinking water quality. Clear-cutting was found to increase acidity and nitrate concentrations due to increased nitrification [46,47]. Drinking water pH limits [18] are set between 6.5 and 9.5. The groundwater pH in our study was already near the low limit before clear-cutting; afterwards, the values slightly decreased on both clear-cuts.
Long-term acidification and/or higher nitrate concentrations in groundwater can pose a rise in increased drinking water treatment costs. The limits for nitrates (50 mg·L−1) were, however, exceeded only in infiltrating sub-surface water, whereas groundwater quality was not threatened. Based on the reported trends following clear-cutting (see e.g., [37,38]), one can estimate the restoration of soil water and groundwater properties, and the differences among the treatments will also diminish with new forest stand establishment and growth on the study site. In addition, ground vegetation, which progressively developed on the analyzed clear-cuts, contributes to the process [48]. Subsurface water is cleaned of nitrates and ammonium nitrogen as it passes through the unsaturated zones of soil [49]. Different soils, however, have different capabilities of filtering these pollutants, as was reported by Jaber et al. [50] for calcareous and sandy soils in Florida.
The average TOC values in each quarter fluctuated significantly; subsurface water showed a downward trend, whereas the groundwater TOC increased in the last period. This was likely to be attributable to carbon released from decomposing organic matter, as well as the activities of microorganisms [51] and fungi [52].
The concentrations of substances dissolved in percolating soil water are affected by the intensity and frequency of precipitation events. Organic matter accumulates, is transformed, released, and later washed out. In certain circumstances, the amounts are many times higher compared to periods with “regular” precipitation. On the other hand, sandy layers function as a filter (see e.g., [53]), an effect that was documented as subsurface water contained much more humic substances of a soil biota origin [52], changing its color to brown, compared to the clear water caught at the deeper-70 cm lysimeters installed on our study site. One of the evolution lines of groundwater properties is that it is transformed from polluted to clean water [54,55].
It should be also pointed out here again that our findings are based on the non-replicated study-site design in soil-environmental conditions typical for nutrient-poor pine forests. Single-site design limits generalization of the outcomes and their management implications. Soil and weather conditions (especially precipitation regime) impact vegetation and soil biota and can differ rates of nutrient cycle components [56,57] from the conditions of our experimental site. As compared to the analyzed sandy soils, higher participation of fine particles in soil would increase e.g., the reduction in the nutrients in seepage water through the adsorption in soil due to ion effects [58]. One of the reasons is presumably the fact that sandy soils have lower abilities to retain water [17], which more readily percolates into deeper soil layers. Therefore, the rates of the observed trends in the analyzed parameters of our study should be taken as specific to the site conditions.
5. Conclusions
This study, by monitoring precipitation and water percolation at the non-replicated treatments such as Scots pine stand and two clear-cuts located on deep sandy-gravel soils, showed that clear-cutting and the method of soil preparation represented only a limited extent of the changes in the soil water and groundwater chemistry. It was particularly due to the relatively small increase in the amounts of water percolating to the groundwater below the clear-cut areas. As compared to throughfall, clear-cut precipitation was less acidic with lower TOC, nitrate, and ammonium nitrogen contents. The lower acidity of percolating water was observed two years after felling only in the sub-surface layer of the clear-cut area with ploughed soil. Contrarily, groundwater pH after felling decreased. The lower input of TOC in clear-cut precipitation also gradually influenced its concentration in percolating water; however, its concentrations in groundwater remained apparently independent of the changes that occurred above. Nitrate concentrations in the percolating water of clear-cut areas significantly increased with greater decomposition. This increase was also observed in groundwater. On the other hand, concentrations of both ammonium nitrogen and phosphorus showed no relation to clear-cutting.
Considering the potential of groundwater as a source of drinking water, three years after clear-cutting, groundwater acidity was threatened, making it harder for it to be used as a source of drinking water. However, the other evaluated parameters remained far below the permitted limits. No negative impact of soil ploughing was observed. The subsequent growth of new forest stands is expected to slowly restore the water cycle processes in the forest. Due to the non-replicated design of the experiment, generalization of the conclusions is limited. Application of the observed changes outside the conditions of the study site is a question for further research.
Author Contributions
O.Š., D.K. and J.P. designed the experiment, J.P. led and supervised sampling and chemical analyses, P.P. directed sampling and chemical analyses, Z.R. directed maintenance of the equipment, O.Š. analyzed the data and wrote the body of the article and D.K. led the discussion. All authors have read and agreed to the published version of the manuscript.
Funding
The study was supported by the Ministry of Agriculture of the Czech Republic, institutional support MZE-RO0118.
Data Availability Statement
Not applicable.
Acknowledgments
We would like to thank our technical staff for their help with equipment maintenance, sampling and chemical analyses. We would also like to thank our librarian Jitka Součková for the help with unpopular (and worthless) specific laborious formatting of the references, formats which should be already definitively unified at the scientific field.
Conflicts of Interest
The authors declare no conflict of interest. The funders had no role in the design of the study; in the collection, analyses, or interpretation of data; in the writing of the manuscript, or in the decision to publish the results.
References
- Pekarova, P.; Miklanek, P.; Onderka, M.; Kohnova, S. Water balance comparison of two small experimental basins with different vegetation cover. Biologia 2009, 64, 487–491. [Google Scholar] [CrossRef]
- Dias, L.C.P.; Macedo, M.N.; Costa, M.H.; Coe, M.T.; Neill, C. Effects of land cover change on evapotranspiration and streamflow of small catchments in the Upper Xingu River Basin, Central Brazil. J. Hydrol. Reg. Stud. 2015, 4, 108–122. [Google Scholar] [CrossRef]
- Ilstedt, U.; Bargues Tobella, A.; Bazie, H.R.; Bayala, J.; Verbeeten, E.; Nyberg, G.; Malmer, A. Intermediate tree cover can maximize groundwater recharge in the seasonally dry tropics. Sci. Rep. 2016, 6, 21930. [Google Scholar] [CrossRef] [PubMed]
- Pačes, T. Základy Hydrochemie Vod; Academia: Praha, Czech Republic, 1983; 304p. [Google Scholar]
- Nieminen, M. Export of dissolved organic carbon, nitrogen and phosphorus following clear-cutting of three Norway spruce forests growing on drained peatlands in southern Finland. Silva Fenn. 2004, 38, 123–132. [Google Scholar] [CrossRef]
- Staaf, H.; Olsson, B.A. Effects of slash removal and stump harvesting on soil water chemistry in a clearcutting in SW Sweden. Scand. J. For. Res. 1994, 9, 305–310. [Google Scholar] [CrossRef]
- Henriksen, A.; Kirkhusmo, L.A. Effects of clear-cutting of forests on the chemistry of a shallow groundwater aquifer in southern Norway. Hydrol. Earth Syst. Sci. 2000, 4, 323–331. [Google Scholar] [CrossRef]
- Mannerkoski, H.; Finér, L.; Piirainen, S.; Starr, M. Effect of clear-cutting and site preparation on the level and quality of groundwater in some headwater catchments in eastern Finland. For. Ecol. Manag. 2005, 220, 107–117. [Google Scholar] [CrossRef]
- Neary, D.G.; Ice, G.G.; Jackson, C.R. Linkages between forest soils and water quality and quantity. For. Ecol. Manag. 2009, 258, 2269–2281. [Google Scholar] [CrossRef]
- Hedwall, P.-O.; Grip, H.; Linder, S.; Lövdahl, L.; Nilsson, U.; Bergh, J. Effects of clearcutting and slash removal on soil water chemistry and forest-floor vegetation in a nutrient optimised Norway spruce stand. Silva Fenn. 2013, 47, 933. [Google Scholar] [CrossRef]
- Vicente, E.; Vilagrosa, A.; Ruiz-Yanetti, S.; Manrique-Alba, A.; Gonzalez-Sanchis, M.; Moutahir, H.; Bellot, J. Water balance of Mediterranean Quercus ilex L. and Pinus halepensis Mill. forests in semiarid climates: A review in a climate change context. Forests 2018, 9, 426. [Google Scholar] [CrossRef]
- Vangansbeke, P.; De Schrijver, A.; De Frenne, P.; Verstraeten, A.; Gorissen, L.; Verheyen, K. Strong negative impacts of whole tree harvesting in pine stands on poor, sandy soils: A long-term nutrient budget modelling approach. For. Ecol. Manag. 2015, 356, 101–111. [Google Scholar] [CrossRef]
- Finer, L.; Jurgensen, M.; Palviainen, M.; Piirainen, S.; Page-Dumroese, D. Does clear-cut harvesting accelerate initial wood decomposition? A five-year study with standard wood material. For. Ecol. Manag. 2016, 372, 10–18. [Google Scholar] [CrossRef]
- Jamroz, E.; Jerzykiewicz, M. Humic fractions as indicators of soil organic matter responses to clear-cutting in mountain and lowland conditions of southwestern Poland. Land Degrad. Dev. 2022, 33, 368–378. [Google Scholar] [CrossRef]
- Cesoniene, L.; Daubaras, R.; Tamutis, V.; Kaskoniene, V.; Kaskonas, P.; Stakenas, V.; Zych, M. Effect of clear-cutting on the understory vegetation, soil and diversity of litter beetles in scots pine-dominated forest. J. Sustain. For. 2019, 38, 791–808. [Google Scholar] [CrossRef]
- Marshall, V.G. Impacts of forest harvesting on biological processes in northern forest soils. For. Ecol. Manag. 2000, 133, 43–60. [Google Scholar] [CrossRef]
- Shahnazari, H.; Laloui, L.; Kouzegaran, S.; Jafarian, Y. Prediction and experimental evaluation of soil-water retention behavior of skeletal calcareous soils. Bull. Eng. Geol. Environ. 2020, 79, 2395–2410. [Google Scholar] [CrossRef]
- The Council of the European Union. Council Directive 98/83/EC of 3 November 1998 on the quality of water intended for human consumption. Off. J. L 1998, 330, 32–54. [Google Scholar]
- Viewegh, J.; Kusbach, A.; Mikeska, M. Czech forest ecosystem classification. J. For. Sci. 2003, 49, 74–82. [Google Scholar] [CrossRef]
- Špulák, O.; Kacálek, D. How different approaches to logging residues handling affected retention of nutrients at poor-soil Scots pine site after celar-cutting? A case study. J. For. Sci. 2020, 66, 461–470. [Google Scholar] [CrossRef]
- Peřina, V. Přeměny Borových Monokultur na Plistocenních Terasách; SZN: Praha, Czech Republic, 1960; 210p, (In Czech with Russian, German and English summaries). [Google Scholar]
- Zemánková, T.; Pokorný, R. Historie a současnost těžby štěrkopísku východně od Týniště nad Orlicí [The history and present of sandy gravel mining east of Týniště nad Orlicí]. Orlické Hory Podorlicko 2018, 25, 89–105, (In Czech with English abstract). [Google Scholar]
- Špulák, O.; Kacálek, D.; Leugner, J. Hydrické poměry na stanovišti chudého boru—založení experimentu a první výsledky [Water conditions at nutrient-poor Scots pine site—experiment establishment and first results]. In Silviculture in Central Europe. Proceedings of Scientific Studies at the Occasion of the 19th International Meeting of Central European Silviculturists, Doksy, Czech Republic, 4–5 September 2018; Baláš, M., Podrázský, V., Gallo, J., Eds.; Česká Zemědělská Univerzita v Praze: Praha, Czech Republic, 2018; pp. 166–173. ISBN 978-80-213-2866-2. [Google Scholar]
- R Core Team. R: A language and environment for statistical computing. R Foundation for Statistical Computing: Vienna, Austria. Available online: https://www.R-project.org/ (accessed on 20 April 2022).
- Binkley, D.; Fisher, R.F. Ecology and Management of Forest Soils, 5th ed.; John Wiley & Sons: New York, NY, USA, 2019; 456p. [Google Scholar]
- Ranger, J.; Loyer, S.; Gelhaye, D.; Pollier, B.; Bonnaud, P. Effects of the clear-cutting of a Douglas-fir plantation (Pseudotsuga menziesii F.) on the chemical composition of soil solutions and on the leaching of DOC and ions in drainage waters. Ann. For. Sci. 2007, 64, 183–200. [Google Scholar] [CrossRef]
- Palviainen, M.; Peltomaa, E.; Laurén, A.; Kinnunen, N.; Ojala, A.; Berninger, F.; Zhu, X.; Pumpanen, J. Water quality and the biodegradability of dissolved organic carbon in drained boreal peatland under different forest harvesting intensities. Sci. Total Environ. 2022, 806, 150919. [Google Scholar] [CrossRef]
- Picchio, R.; Mederski, P.; Tavankar, F. How and how much, do harvesting activities affect forest soil, regeneration and stands? Curr. For. Rep. 2020, 6, 115–128. [Google Scholar]
- Vitousek, P.M.; Gosz, J.R.; Grier, C.C.; Melillo, J.M.; Reiners, W.A.; Todd, R.L. Nitrate losses from disturbed ecosystems: Interregional comparative studies show mechanisms underlying forest ecosystem response to disturbance. Science 1979, 204, 469–474. [Google Scholar] [CrossRef] [PubMed]
- Kolář, T.; Čermák, P.; Oulehle, F.; Trnka, M.; Štěpánek, P.; Cudlín, P.; Hruška, J.; Büntgen, U.; Rybníček, M. Pollution control enhanced spruce growth in the “Black Triangle” near the Czech–Polish border. Sci. Total Environ. 2015, 538, 703–711. [Google Scholar] [CrossRef] [PubMed]
- Godek, M.; Sobik, M.; Błaś, M.; Polkowska, Ż.; Owczarek, P.; Bokwa, A. Tree rings as an indicator of atmospheric pollutant deposition to subalpine spruce forests in the Sudetes (Southern Poland). Atmos. Res. 2015, 151, 259–268. [Google Scholar] [CrossRef]
- Alexander, R.B.; Boyer, E.W.; Smith, R.A.; Schwarz, G.E.; Moore, R.B. The role of headwater streams in downstream water quality. J. Am. Water Resour. Assoc. 2007, 43, 41–59. [Google Scholar] [CrossRef] [PubMed]
- Bettez, N.D.; Duncan, J.M.; Groffman, P.M.; Band, L.E.; O’Neil-Dunne, J.; Kaushal, S.S.; Belt, K.B.; Law, N. Climate variation overwhelms efforts to reduce nitrogen delivery to coastal waters. Ecosystems 2015, 18, 1319–1331. [Google Scholar] [CrossRef]
- Beudert, B.; Bässler, C.; Thorn, S.; Noss, R.; Schröder, B.; Dieffenbach-Fries, H.; Foullois, N.; Müller, J. Bark beetles increase biodiversity while maintaining drinking water quality. Conserv. Lett. 2015, 8, 272–281. [Google Scholar] [CrossRef]
- Kubin, E. Leaching of nitrate nitrogen into the groundwater after clear felling and site preparation. Boreal Environ. Res. 1998, 3, 3–8. [Google Scholar]
- Fujii, K.; Funakawa, S.; Hayakawa, C.; Kosaki, T. Effects of clearcutting and girdling on soil respiration and fluxes of dissolved organic carbon and nitrogen in a Japanese cedar plantation. For. Ecol. Manag. 2021, 498, 119520. [Google Scholar] [CrossRef]
- Rusanen, K.; Finér, L.; Antikainen, N.; Korkka-Niemi, K.; Backman, B.; Britschgi, R. The effect of forest cutting on the quality of groundwater in large aquifers in Finland. Boreal Environ. Res. 2004, 9, 253–261. [Google Scholar]
- McHale, M.R.; Burns, D.A.; Lawrence, G.B.; Murdoch, P.S. Factors controlling soil water and stream water aluminum concentrations after a clearcut in a forested watershed with calcium-poor soils. Biogeochemistry 2007, 84, 311–331. [Google Scholar] [CrossRef]
- Möller, D.; Zierath, R. On the composition of precipitation water and its acidity. Tellus B Chem. Phys. Meteorol. 1986, 38, 44–50. [Google Scholar] [CrossRef][Green Version]
- Pierret, M.C.; Viville, D.; Dambrine, E.; Cotel, S.; Probst, A. Twenty-five year record of chemicals in open field precipitation and throughfall from a medium-altitude forest catchment (Strengbach—NE France): An obvious response to atmospheric pollution trends. Atmos. Environ. 2019, 202, 296–314. [Google Scholar] [CrossRef]
- Vícha, Z.; Lachmanová, Z.; Fadrhonsová, V.; Lochman, V.; Bíba, M. Vývoj depozice látek a chemismu vody povrchových zdrojů na povodích v Moravskoslezských Beskydech [Deposition and water chemistry development in the surface water sources of the watersheds in the Moravian-Silesian Beskids Mts., Czech Republic]. Zprávy Lesnického Výzkumu/Rep. For. Res. 2013, 58, 218–225. [Google Scholar]
- Van Stan, J.T.; Stubbins, A. Tree-DOM: Dissolved organic matter in throughfall and stemflow. Limnol. Oceanogr. Lett. 2018, 3, 199–214. [Google Scholar] [CrossRef]
- Růžek, M.; Myška, O.; Kučera, J.; Oulehle, F. Input-output budgets of nutrients in adjacent Norway spruce and European beech monocultures recovering from acidification. Forests 2019, 10, 68. [Google Scholar] [CrossRef]
- BIO Intelligence Service. Soil and Water in a Changing Environment, Final Report Prepared for European Commission (DG ENV), with Support from HydroLogic; BIO Intelligence Service: Paris, France, 2014; 100p. [Google Scholar]
- Bracic Zeleznik, B.; Souvent, P.; Cencur Curk, B.; Zupanc, V. Groundwater recharge measurements in gravel sandy sediments with monolith lysimeter. Geophys. Res. Abstr. 2013, 15, EGU2013-9648. [Google Scholar]
- Smolander, A.; Kitunen, V.; Mälkönen, E. Dissolved soil organic nitrogen and carbon in a Norway spruce stand and an adjacent clear-cut. Biol. Fertil. Soils 2001, 33, 190–196. [Google Scholar] [CrossRef]
- Smolander, A.; Tormanen, T.; Kitunen, V.; Lindroos, A.J. Dynamics of soil nitrogen cycling and losses under Norway spruce logging residues on a clear-cut. For. Ecol. Manag. 2019, 449, 117444. [Google Scholar] [CrossRef]
- Fiala, K.; Tůma, I.; Holub, P.; Jandák, J. The role of Calamagrostis communities in preventing soil acidification and base cation losses in a deforested mountain area affected by acid deposition. Plant Soil 2005, 268, 35–49. [Google Scholar] [CrossRef]
- Wang, C.; Wang, P.-F. Migration of infiltrated NH4 and NO3 in a soil and groundwater system simulated by a soil tank. Pedosphere 2008, 18, 628–637. [Google Scholar] [CrossRef]
- Jaber, F.H.; Shukla, S.; Stoffella, P.J.; Obreza, T.A.; Hanlon, E.A. Impact of organic amendments on groundwater nitrogen concentrations for sandy and calcareous soils. Compost Sci. Util. 2005, 13, 194–202. [Google Scholar] [CrossRef]
- Liu, M.H.; Sui, X.; Hu, Y.B.; Feng, F.J. Microbial community structure and the relationship with soil carbon and nitrogen in an original Korean pine forest of Changbai Mountain, China. BMC Microbiol. 2019, 19, 218. [Google Scholar] [CrossRef] [PubMed]
- Collado, S.; Oulego, P.; Suarez-Iglesias, O.; Diaz, M. Biodegradation of dissolved humic substances by fungi. Appl. Microbiol. Biotechnol. 2018, 102, 3497–3511. [Google Scholar] [CrossRef]
- Keesstra, S.D.; Geissen, V.; Mosse, K.; Piiranen, S.; Scudiero, E.; Leistra, M.; van Schaik, L. Soil as a filter for groundwater quality. Curr. Opin. Environ. Sustain. 2012, 4, 507–516. [Google Scholar] [CrossRef]
- Stuyfzand, P.J. Patterns in groundwater chemistry resulting from groundwater flow. Hydrogeol. J. 1999, 7, 15–27. [Google Scholar] [CrossRef]
- Kezik, U.; Hacisalihoglu, S. Water quality alterations from canopy to soil pathway in forest ecosystems. Fresenius Environ. Bulletin. 2022, 31, 4068–4081. [Google Scholar]
- Knoepp, J.D.; See, C.R.; Vose, J.M.; Miniat, C.F.; Clark, J.S. Total C and N Pools and Fluxes Vary with Time, Soil Temperature, and Moisture Along an Elevation, Precipitation, and Vegetation Gradient in Southern Appalachian Forests. Ecosystems 2018, 8, 1623–1638. [Google Scholar] [CrossRef]
- Santiago, L.S.; Schuur, E.A.G.; Silvera, K. Nutrient cycling and plant-soil feedbacks along a precipitation gradient in lowland Panama. J. Trop. Ecol. 2005, 21, 461–470. [Google Scholar] [CrossRef]
- Chung, S.; Choi, I.; Woo, H.; Choung, Y. The reduction of nutrients by riparian silty soil and sandy soil: Comparison and analysis. Desalination Water Treat. 2011, 1, 309–315. [Google Scholar] [CrossRef]


Publisher’s Note: MDPI stays neutral with regard to jurisdictional claims in published maps and institutional affiliations. |
© 2022 by the authors. Licensee MDPI, Basel, Switzerland. This article is an open access article distributed under the terms and conditions of the Creative Commons Attribution (CC BY) license (https://creativecommons.org/licenses/by/4.0/).