Intra- and Interspecific Variability of Non-Structural Carbohydrates and Phenolic Compounds in Flowers of 70 Temperate Trees and Shrubs


Abstract
:1. Introduction
2. Materials and Methods
2.1. Study Site
2.2. Data Collection
2.3. Chemical Analysis
2.4. Data Analysis
3. Results
4. Discussion
5. Conclusions
Author Contributions
Funding
Data Availability Statement
Acknowledgments
Conflicts of Interest
References
- Roddy, A.B.; Martínez-Perez, C.; Teixido, A.L.; Cornelissen, T.G.; Olson, M.E.; Oliveira, R.S.; Silveira, F.A.O. Towards the flower economics spectrum. New Phytol. 2021, 229, 665–672. [Google Scholar] [CrossRef] [PubMed]
- Gao, J.; Xiong, Y.-Z.; Huang, S.-Q. Effects of floral sexual investment and dichogamy on floral longevity. J. Plant Ecol. 2015, 8, 116–121. [Google Scholar] [CrossRef] [Green Version]
- van der Niet, T.; Johnson, S. Phylogenetic evidence for pollinator-driven diversification of angiosperms. Trends Ecol. Evol. 2012, 27, 353–361. [Google Scholar] [CrossRef]
- Roddy, A.B.; Jiang, G.-F.; Cao, K.; Simonin, K.A.; Brodersen, C.R. Hydraulic traits are more diverse in flowers than in leaves. New Phytol. 2019, 223, 193–203. [Google Scholar] [CrossRef] [PubMed]
- Kattge, J.; Bönisch, G.; Díaz, S.; Lavorel, S.; Prentice, I.C.; Leadley, P.; Tautenhahn, S.; Werner, G.D.A.; Aakala, T.; Abedi, M.; et al. TRY plant trait database—Enhanced coverage and open access. Glob. Chang. Biol. 2020, 26, 119–188. [Google Scholar] [CrossRef] [PubMed] [Green Version]
- Kleyer, M.; Bekker, R.M.; Knevel, I.C.; Bakker, J.P.; Thompson, K.; Sonnenschein, M.; Poschlod, P.; van Groenendael, J.M.; Klimeš, L.; Klimešová, J.; et al. The LEDA Traitbase: A database of life-history traits of the Northwest European flora. J. Ecol. 2008, 96, 1266–1274. [Google Scholar] [CrossRef]
- Campetella, G.; Chelli, S.; Simonetti, E.; Damiani, C.; Bartha, S.; Wellstein, C.; Giorgini, D.; Puletti, N.; Mucina, L.; Cervellini, M.; et al. Plant functional traits are correlated with species persistence in the herb layer of old-growth beech forests. Sci. Rep. 2020, 10, 19253. [Google Scholar] [CrossRef]
- Dyderski, M.K.; Jagodziński, A.M. Impacts of invasive trees on alpha and beta diversity of temperate forest understories. Biol. Invasions 2021, 23, 235–252. [Google Scholar] [CrossRef]
- Tecco, P.A.; Díaz, S.; Cabido, M.; Urcelay, C. Functional traits of alien plants across contrasting climatic and land-use regimes: Do aliens join the locals or try harder than them? J. Ecol. 2010, 98, 17–27. [Google Scholar] [CrossRef]
- Albert, C.H.; Thuiller, W.; Yoccoz, N.G.; Soudant, A.; Boucher, F.; Saccone, P.; Lavorel, S. Intraspecific functional variability: Extent, structure and sources of variation. J. Ecol. 2010, 98, 604–613. [Google Scholar] [CrossRef]
- Farré-Armengol, G.; Filella, I.; Llusia, J.; Peñuelas, J. Floral volatile organic compounds: Between attraction and deterrence of visitors under global change. Perspect. Plant Ecol. Evol. Syst. 2013, 15, 56–67. [Google Scholar] [CrossRef]
- Gong, B.; Zhang, G. Interactions between plants and herbivores: A review of plant defense. Acta Ecol. Sin. 2014, 34, 325–336. [Google Scholar] [CrossRef]
- Frachon, L.; Stirling, S.A.; Schiestl, F.P.; Dudareva, N. Combining biotechnology and evolution for understanding the mechanisms of pollinator attraction. Curr. Opin. Biotechnol. 2021, 70, 213–219. [Google Scholar] [CrossRef]
- Venjakob, C.; Ruedenauer, F.A.; Klein, A.; Leonhardt, S.D. Variation in nectar quality across 34 grassland plant species. Plant Biol. 2021, 24, 134–144. [Google Scholar] [CrossRef] [PubMed]
- Nakano, S.; Oguro, M.; Itagaki, T.; Sakai, S. Florivory defence: Are phenolic compounds distributed non-randomly within perianths? Biol. J. Linn. Soc. 2020, 131, 12–25. [Google Scholar] [CrossRef]
- Gervasi, D.D.L.; Schiestl, F. Real-time divergent evolution in plants driven by pollinators. Nat. Commun. 2017, 8, 14691. [Google Scholar] [CrossRef] [Green Version]
- Knauer, A.C.; Schiestl, F. The effect of pollinators and herbivores on selection for floral signals: A case study in Brassica rapa. Evol. Ecol. 2016, 31, 285–304. [Google Scholar] [CrossRef]
- Strauss, S.Y. Floral characters link herbivores, pollinators, and plant fitness. Ecology 1997, 78, 1640–1645. [Google Scholar] [CrossRef]
- Burns, J.H.; Strauss, S.Y. Effects of competition on phylogenetic signal and phenotypic plasticity in plant functional traits. Ecology 2012, 93, S126–S137. [Google Scholar] [CrossRef]
- Martin, A.R.; Thomas, S.C.; Zhao, Y. Size-dependent changes in wood chemical traits: A comparison of neotropical saplings and large trees. AoB PLANTS 2013, 5, plt039. [Google Scholar] [CrossRef]
- Chanderbali, A.S.; Berger, B.A.; Howarth, D.G.; Soltis, P.S.; Soltis, D.E. Evolving ideas on the origin and evolution of flowers: New perspectives in the genomic era. Genetics 2016, 202, 1255–1265. [Google Scholar] [CrossRef] [Green Version]
- Karolewski, P.; Giertych, M.J.; Żmuda, M.; Jagodziński, A.M.; Oleksyn, J. Season and light affect constitutive defenses of understory shrub species against folivorous insects. Acta Oecol. 2013, 53, 19–32. [Google Scholar] [CrossRef] [Green Version]
- Roddy, A.B. Energy balance implications of floral traits involved in pollinator attraction and water balance. Int. J. Plant Sci. 2019, 180, 944–953. [Google Scholar] [CrossRef]
- Paź-Dyderska, S.; Dyderski, M.K.; Nowak, K.; Jagodziński, A.M. On the sunny side of the crown—Quantification of intra-canopy SLA variation among 179 taxa. For. Ecol. Manag. 2020, 472, 118254. [Google Scholar] [CrossRef]
- Cedro, A.; Iszkuło, G. Do females differ from males of European yew (Taxus baccata L.) in dendrochronological analysis? Tree-Ring Res. 2011, 67, 3–11. [Google Scholar] [CrossRef]
- Pérez-Harguindeguy, N.; Díaz, S.; Garnier, E.; Lavorel, S.; Poorter, H.; Jaureguiberry, P.; Bret-Harte, M.S.; Cornwell, W.K.; Craine, J.M.; Gurvich, D.E.; et al. New handbook for standardised measurement of plant functional traits worldwide. Aust. J. Bot. 2013, 61, 167–234. [Google Scholar] [CrossRef]
- Roddy, A.B.; Brodersen, C.R.; Dawson, T.E. Hydraulic conductance and the maintenance of water balance in flowers. Plant Cell Environ. 2016, 39, 2123–2132. [Google Scholar] [CrossRef] [PubMed]
- Zhang, F.-P.; Yang, Y.-J.; Yang, Q.-Y.; Zhang, W.; Brodribb, T.J.; Hao, G.-Y.; Hu, H.; Zhang, S.-B. Floral mass per area and water maintenance traits are correlated with floral longevity in Paphiopedilum (Orchidaceae). Front. Plant Sci. 2017, 8, 501. [Google Scholar] [CrossRef] [Green Version]
- Łukowski, A.; Giertych, M.J.; Mąderek, E.; Adamczyk, D.; Karolewski, P. Effect of Scots pine needle age on preference, performance, and overwintering of pine-tree lappet larvae—The distaste for the oldest foliage. Acta Oecol. 2022, 116, 103836. [Google Scholar] [CrossRef]
- Wyka, T.P.; Karolewski, P.; Żytkowiak, R.; Chmielarz, P.; Oleksyn, J. Whole-plant allocation to storage and defense in juveniles of related evergreen and deciduous shrub species. Tree Physiol. 2016, 36, 536–547. [Google Scholar] [CrossRef] [PubMed] [Green Version]
- Zadworny, M.; McCormack, M.L.; Żytkowiak, R.; Karolewski, P.; Mucha, J.; Oleksyn, J. Patterns of structural and defense investments in fine roots of Scots pine (Pinus sylvestris L.) across a strong temperature and latitudinal gradient in Europe. Glob. Chang. Biol. 2017, 23, 1218–1231. [Google Scholar] [CrossRef]
- Hansen, J.; Møller, I. Percolation of starch and soluble carbohydrates from plant tissue for quantitative determination with anthrone. Anal. Biochem. 1975, 68, 87–94. [Google Scholar] [CrossRef]
- Haissig, B.E.; Dickson, R.E. Starch measurement in plant tissue using enzymatic hydrolysis. Physiol. Plant. 1979, 47, 151–157. [Google Scholar] [CrossRef]
- Johnson, G.; Schaal, L.A. Accumulation of phenolic substances and ascorbic acid in potato tuber tissue upon injury and their possible role in disease resistance. Am. Potato J. 1957, 34, 200–209. [Google Scholar] [CrossRef]
- Singleton, V.L.; Rossi, J.A. Colorimetry of total phenolics with phosphomolybdic-phosphotungstic acid reagents. Am. J. Enol. Vitic. 1965, 16, 144–158. [Google Scholar]
- Karolewski, P.; Zadworny, M.; Mucha, J.; Napierała-Filipiak, A.; Oleksyn, J. Link between defoliation and light treatments on root vitality of five understory shrubs with different resistance to insect herbivory. Tree Physiol. 2010, 30, 969–978. [Google Scholar] [CrossRef] [Green Version]
- Łukowski, A.; Giertych, M.J.; Adamczyk, D.; Mąderek, E.; Karolewski, P. Preference and performance of the pine-tree lappet Dendrolimus pini on various pine species. Forests 2021, 12, 1261. [Google Scholar] [CrossRef]
- Wickham, H.; Francois, R.; Henry, L.; Müller, K. Dplyr: A Grammar of Data Manipulation. 2020. Available online: https://cran.r-project.org/web/packages/dplyr/index.html (accessed on 7 June 2022).
- Wickham, H.; Chang, W.; Henry, L.; Pedersen, T.L.; Takahashi, K.; Wilke, C.; Woo, K.; Yutani, H. Ggplot2: Create Elegant Data Visualisations Using the Grammar of Graphics. 2020. Available online: https://cran.r-project.org/web/packages/ggplot2/index.html (accessed on 7 June 2022).
- Revell, L.J. Phytools: Phylogenetic Tools for Comparative Biology (and Other Things). 2020. Available online: https://cran.r-project.org/web/packages/phytools/index.html (accessed on 7 June 2022).
- Jin, Y.; Qian, H.V. PhyloMaker: An R package that can generate very large phylogenies for vascular plants. Ecography 2019, 42, 1353–1359. [Google Scholar] [CrossRef] [Green Version]
- Blomberg, S.P.; Garland, T.; Ives, A.R. Testing for phylogenetic signal in comparative data: Behavioral traits are more labile. Evolution 2003, 57, 717–745. [Google Scholar] [CrossRef]
- Keck, F. Phylosignal: Exploring the Phylogenetic Signal in Continuous Traits. 2020. Available online: https://cran.r-project.org/web/packages/phylosignal/index.html (accessed on 7 June 2022).
- Molina-Venegas, R.; Rodríguez, M.A. Revisiting phylogenetic signal; strong or negligible impacts of polytomies and branch length information? BMC Evol. Biol. 2017, 17, 53. [Google Scholar] [CrossRef] [Green Version]
- Chen, C.; Cao, Y.; Chen, H.; Ni, M.; Yu, F. Floral scent compounds and emission patterns of three Styrax species. Dendrobiology 2021, 85, 30–38. [Google Scholar] [CrossRef]
- Ortiz, P.L.; Fernández-Díaz, P.; Pareja, D.; Escudero, M.; Arista, M. Do visual traits honestly signal floral rewards at community level? Funct. Ecol. 2021, 35, 369–383. [Google Scholar] [CrossRef]
- Lussu, M.; De Agostini, A.; Cogoni, A.; Marignani, M.; Cortis, P. Does size really matter? A comparative study on floral traits in orchids with two different pollination strategies. Plant Biol. 2019, 21, 961–966. [Google Scholar] [CrossRef] [PubMed]
- Juillet, N.; Scopece, G. Does floral trait variability enhance reproductive success in deceptive orchids? Perspect. Plant Ecol. Evol. Syst. 2010, 12, 317–322. [Google Scholar] [CrossRef]
- Zhang, C.; Li, J.; Willis, C.G.; Ma, Z. Among-population variation in seed mass for 190 Tibetan plant species: Phylogenetic pattern and ecological correlates. Glob. Ecol. Conserv. 2020, 23, e01163. [Google Scholar] [CrossRef]
- Martin, A.R.; Doraisami, M.; Thomas, S.C. Global patterns in wood carbon concentration across the world’s trees and forests. Nat. Geosci. 2018, 11, 915–920. [Google Scholar] [CrossRef]
- Castro, S.A.; Silveira, F.A.; Marcato, M.S.; Lemos-Filho, J.P. So close, yet so different: Divergences in resource use may help stabilize coexistence of phylogenetically-related species in a megadiverse grassland. Flora 2018, 238, 72–78. [Google Scholar] [CrossRef]
- Reich, P.B.; Walters, M.B.; Ellsworth, D.S. Leaf age and season influence the relationships between leaf nitrogen, leaf mass per area and photosynthesis in maple and oak trees. Plant Cell Environ. 1991, 14, 251–259. [Google Scholar] [CrossRef]
- Ernst, W.H.O.; Kuiters, A.T.; Nelissen, H.J.M.; Tolsma, D.J. Seasonal variation in phenolics in several savanna tree species in Botswana. Acta Bot. Neerl. 1991, 40, 63–74. [Google Scholar] [CrossRef]
- Kenis, J.D.; Silvente, S.T.; Trippi, V.S. Nitrogen metabolism and senescence-associated changes during growth of carnation flowers. Physiol. Plant. 1985, 65, 455–459. [Google Scholar] [CrossRef]
- McMann, N.; Peichel, A.; Savage, J.A. Early spring flowers rely on xylem hydration but are not limited by stem xylem conductivity. New Phytol. 2022, 233, 838–850. [Google Scholar] [CrossRef]
- Siatka, T.; Kašparová, M. Seasonal variation in total phenolic and flavonoid contents and DPPH scavenging activity of Bellis perennis L. flowers. Molecules 2010, 15, 9450–9461. [Google Scholar] [CrossRef] [PubMed] [Green Version]
- Petruzzellis, F.; Palandrani, C.; Savi, T.; Alberti, R.; Nardini, A.; Bacaro, G. Sampling intraspecific variability in leaf functional traits: Practical suggestions to maximize collected information. Ecol. Evol. 2017, 7, 11236–11245. [Google Scholar] [CrossRef] [Green Version]
- Albert, C.H.; Grassein, F.; Schurr, F.M.; Vieilledent, G.; Violle, C. When and how should intraspecific variability be considered in trait-based plant ecology? Perspect. Plant Ecol. Evol. Syst. 2011, 13, 217–225. [Google Scholar] [CrossRef]
- Violle, C.; Enquist, B.J.; McGill, B.J.; Jiang, L.; Albert, C.H.; Hulshof, C.; Jung, V.; Messier, J. The return of the variance: Intraspecific variability in community ecology. Trends Ecol. Evol. 2012, 27, 244–252. [Google Scholar] [CrossRef] [PubMed]
- Violle, C.; Navas, M.-L.; Vile, D.; Kazakou, E.; Fortunel, C.; Hummel, I.; Garnier, E. Let the concept of trait be functional! Oikos 2007, 116, 882–892. [Google Scholar] [CrossRef]
- Datta, R.; Chamusco, K.C.; Chourey, P.S. Starch biosynthesis during pollen maturation is associated with altered patterns of gene expression in maize. Plant Physiol. 2002, 130, 1645–1656. [Google Scholar] [CrossRef] [PubMed] [Green Version]
- Monteiro, J.A.; Nell, T.A.; Barrett, J.E. Effects of exogenous sucrose on carbohydrate levels, flower respiration and longevity of potted miniature rose (Rosa hybrida) flowers during postproduction. Postharvest Biol. Technol. 2002, 26, 221–229. [Google Scholar] [CrossRef] [Green Version]
- Ranwala, A.P.; Miller, W.B. Comparison of the dynamics of non-structural carbohydrate pools in cut tulip stems supplied with sucrose or trehalose. Postharvest Biol. Technol. 2009, 52, 91–96. [Google Scholar] [CrossRef]
- Petersen, M. Rosmarinic acid: New aspects. Phytochem. Rev. 2013, 12, 207–227. [Google Scholar] [CrossRef]


| Species | Family | Soluble Carbohydrates (%) | Starch (%) | TNC (%) | TPh (μM of Chlorogenic Acid g−1 Dry Mass) |
|---|---|---|---|---|---|
| Acer pensylvanicum L. | Sapindaceae | 11.370 | 0.908 | 12.278 | 151.140 |
| Acer pseudoplatanus L. | Sapindaceae | 9.937 | 0.784 | 10.721 | 462.983 |
| Aesculus glabra Willd. | Sapindaceae | 16.541 | 0.947 | 17.487 | 148.197 |
| Aesculus hippocastanum L. | Sapindaceae | 24.097 | 0.889 | 24.985 | 118.706 |
| Aesculus parviflora Walter | Sapindaceae | 14.290 | 0.838 | 15.128 | 180.177 |
| Aesculus turbinata Blume | Sapindaceae | 17.239 | 0.983 | 18.222 | 106.805 |
| Ailanthus altissima (Mill.) Swingle | Simaroubaceae | 3.206 | 0.791 | 3.997 | 163.528 |
| Asimina triloba (L.) Dunal | Annonaceae | 10.415 | 10.323 | 20.738 | 306.558 |
| Berberis amurensis Rupr. | Berberidaceae | 14.147 | 0.849 | 14.996 | 199.478 |
| Berberis aquifolium Pursh | Berberidaceae | 9.477 | 0.813 | 10.290 | 308.063 |
| Berberis julianae C.K.Schneid. | Berberidaceae | 18.214 | 0.829 | 19.043 | 268.745 |
| Calycanthus fertilis Walter | Calycanthaceae | 10.683 | 1.875 | 12.558 | 411.063 |
| Carpinus orientalis Mill. | Betulaceae | 17.830 | 0.945 | 18.774 | 264.294 |
| Castanea sativa Mill. | Fagaceae | 12.040 | 0.846 | 12.885 | 294.083 |
| Catalpa bignonioides Walter | Bignoniaceae | 27.039 | 0.780 | 27.819 | 316.005 |
| Cercidiphyllum japonicum Siebold & Zucc. | Cercidiphyllaceae | 3.822 | 0.895 | 4.717 | 897.379 |
| Cercis chinensis Bunge | Fabaceae | 15.134 | 0.869 | 16.003 | 140.805 |
| Cornus florida L. | Cornaceae | 10.661 | 0.894 | 11.555 | 132.362 |
| Cornus mas L. | Cornaceae | 16.460 | 0.827 | 17.287 | 391.879 |
| Cornus officinalis Siebold & Zucc. | Cornaceae | 12.840 | 0.873 | 13.714 | 320.996 |
| Corylopsis platypetala Rehder & E.H.Wilson | Hamamelidaceae | 9.597 | 0.829 | 10.426 | 300.624 |
| Corylopsis sinensis Hemsl. | Hamamelidaceae | 11.029 | 0.916 | 11.944 | 278.399 |
| Corylus avellana L. | Betulaceae | 5.492 | 0.787 | 6.279 | 177.459 |
| Corylus colurnoides C.K.Schneid. | Betulaceae | 5.604 | 0.876 | 6.481 | 207.546 |
| Crataegus holmesiana Ashe | Rosaceae | 14.759 | 0.785 | 15.544 | 638.765 |
| Crataegus submollis Sarg. | Rosaceae | 13.385 | 0.860 | 14.244 | 253.148 |
| Cydonia oblonga Mill. | Rosaceae | 16.109 | 0.894 | 17.003 | 410.986 |
| Davidia involucrata Baill. | Nyssaceae | 13.765 | 0.902 | 14.667 | 405.669 |
| Euonymus atropurpureus Jacq. | Celastraceae | 23.851 | 0.816 | 24.667 | 289.730 |
| Exochorda korolkowii Lavallée | Rosaceae | 8.334 | 0.885 | 9.219 | 102.092 |
| Exochorda racemosa (Lindl.) Rehder | Rosaceae | 5.739 | 0.917 | 6.656 | 180.500 |
| Forsythia giraldiana Lingelsh. | Oleaceae | 15.786 | 0.804 | 16.590 | 170.925 |
| Fothergilla major (Sims) Lodd. | Hamamelidaceae | 3.338 | 0.890 | 4.228 | 353.830 |
| Halesia carolina L. | Styracaceae | 7.710 | 0.979 | 8.689 | 168.546 |
| Hamamelis mollis Oliv. | Hamamelidaceae | 5.127 | 0.961 | 6.087 | 288.367 |
| Jasminum fruticans L. | Oleaceae | 20.717 | 1.823 | 22.540 | 224.298 |
| Kolkwitzia amabilis Graebn. | Caprifoliaceae | 15.240 | 0.815 | 16.055 | 192.775 |
| Laburnum anagyroides Medik. | Fabaceae | 14.179 | 0.899 | 15.078 | 46.147 |
| Lonicera standishii Jacques | Caprifoliaceae | 13.208 | 0.899 | 14.106 | 149.106 |
| Magnolia kobus DC. | Magnoliaceae | 10.648 | 0.880 | 11.529 | 106.566 |
| Magnolia stellata (Siebold & Zucc.) Maxim. | Magnoliaceae | 6.634 | 0.855 | 7.489 | 130.447 |
| Magnolia tripetala (L.) L. | Magnoliaceae | 8.162 | 1.239 | 9.400 | 134.390 |
| Malus baccata (L.) Moench | Rosaceae | 11.795 | 0.879 | 12.674 | 207.765 |
| Malus ×hartwigii Koehne | Rosaceae | 8.746 | 0.904 | 9.650 | 187.132 |
| Parrotia persica (DC.) C.A.Mey. | Hamamelidaceae | 5.089 | 0.852 | 5.940 | 394.519 |
| Paulownia tomentosa (Thunb.) Steud. | Paulowniaceae | 13.154 | 0.756 | 13.910 | 849.438 |
| Prunus incisa Thunb. | Rosaceae | 9.114 | 0.823 | 9.937 | 128.512 |
| Prunus laurocerasus L. | Rosaceae | 18.476 | 0.882 | 19.358 | 125.202 |
| Prunus padus L. | Rosaceae | 22.316 | 1.146 | 23.462 | 576.903 |
| Prunus serrulata Lindl. | Rosaceae | 15.747 | 0.859 | 16.606 | 160.956 |
| Quercus rubra L. | Fagaceae | 3.832 | 0.783 | 4.615 | 471.303 |
| Rhododendron luteum Sweet | Ericaceae | 8.809 | 0.978 | 9.787 | 621.978 |
| Rhus aromatica Aiton | Anacardiaceae | 11.372 | 0.935 | 12.307 | 430.295 |
| Salix gracilistyla Miq. | Salicaceae | 6.805 | 0.921 | 7.726 | 187.302 |
| Sambucus siberica Nakai | Adoxaceae | 5.189 | 0.772 | 5.961 | 161.683 |
| Sorbus aucuparia L. | Rosaceae | 9.004 | 0.756 | 9.760 | 313.785 |
| Sorbus torminalis (L.) Crantz | Rosaceae | 8.478 | 0.743 | 9.222 | 1085.734 |
| Spiraea longigemmis Maxim. | Rosaceae | 19.226 | 1.335 | 20.561 | 677.810 |
| Spiraea media F.Schmidt | Rosaceae | 14.617 | 0.840 | 15.457 | 488.532 |
| Spiraea ×nudiflora Zabel | Rosaceae | 25.608 | 0.896 | 26.504 | 526.887 |
| Staphylea pinnata L. | Staphyleaceae | 11.984 | 0.950 | 12.935 | 97.215 |
| Syringa josikaea J.Jacq. ex Rchb. | Oleaceae | 19.131 | 0.850 | 19.981 | 802.407 |
| Syringa meyeri C.K.Schneid. | Oleaceae | 22.174 | 0.744 | 22.918 | 378.130 |
| Syringa vulgaris L. | Oleaceae | 11.067 | 0.896 | 11.963 | 149.656 |
| Tilia cordata Mill. | Malvaceae | 13.510 | 0.773 | 14.283 | 414.117 |
| Viburnum carlesii Hemsl. ex Forbes & Hemsl. | Adoxaceae | 20.033 | 0.797 | 20.830 | 274.190 |
| Viburnum lantana L. | Adoxaceae | 15.060 | 0.867 | 15.928 | 139.919 |
| Viburnum sieboldii Miq. | Adoxaceae | 10.450 | 0.739 | 11.189 | 133.098 |
| Weigela florida (Bunge) A.DC. | Caprifoliaceae | 16.514 | 0.883 | 17.397 | 76.666 |
| Zelkova serrata (Thunb.) Makino | Ulmaceae | 5.180 | 4.403 | 9.583 | 875.596 |
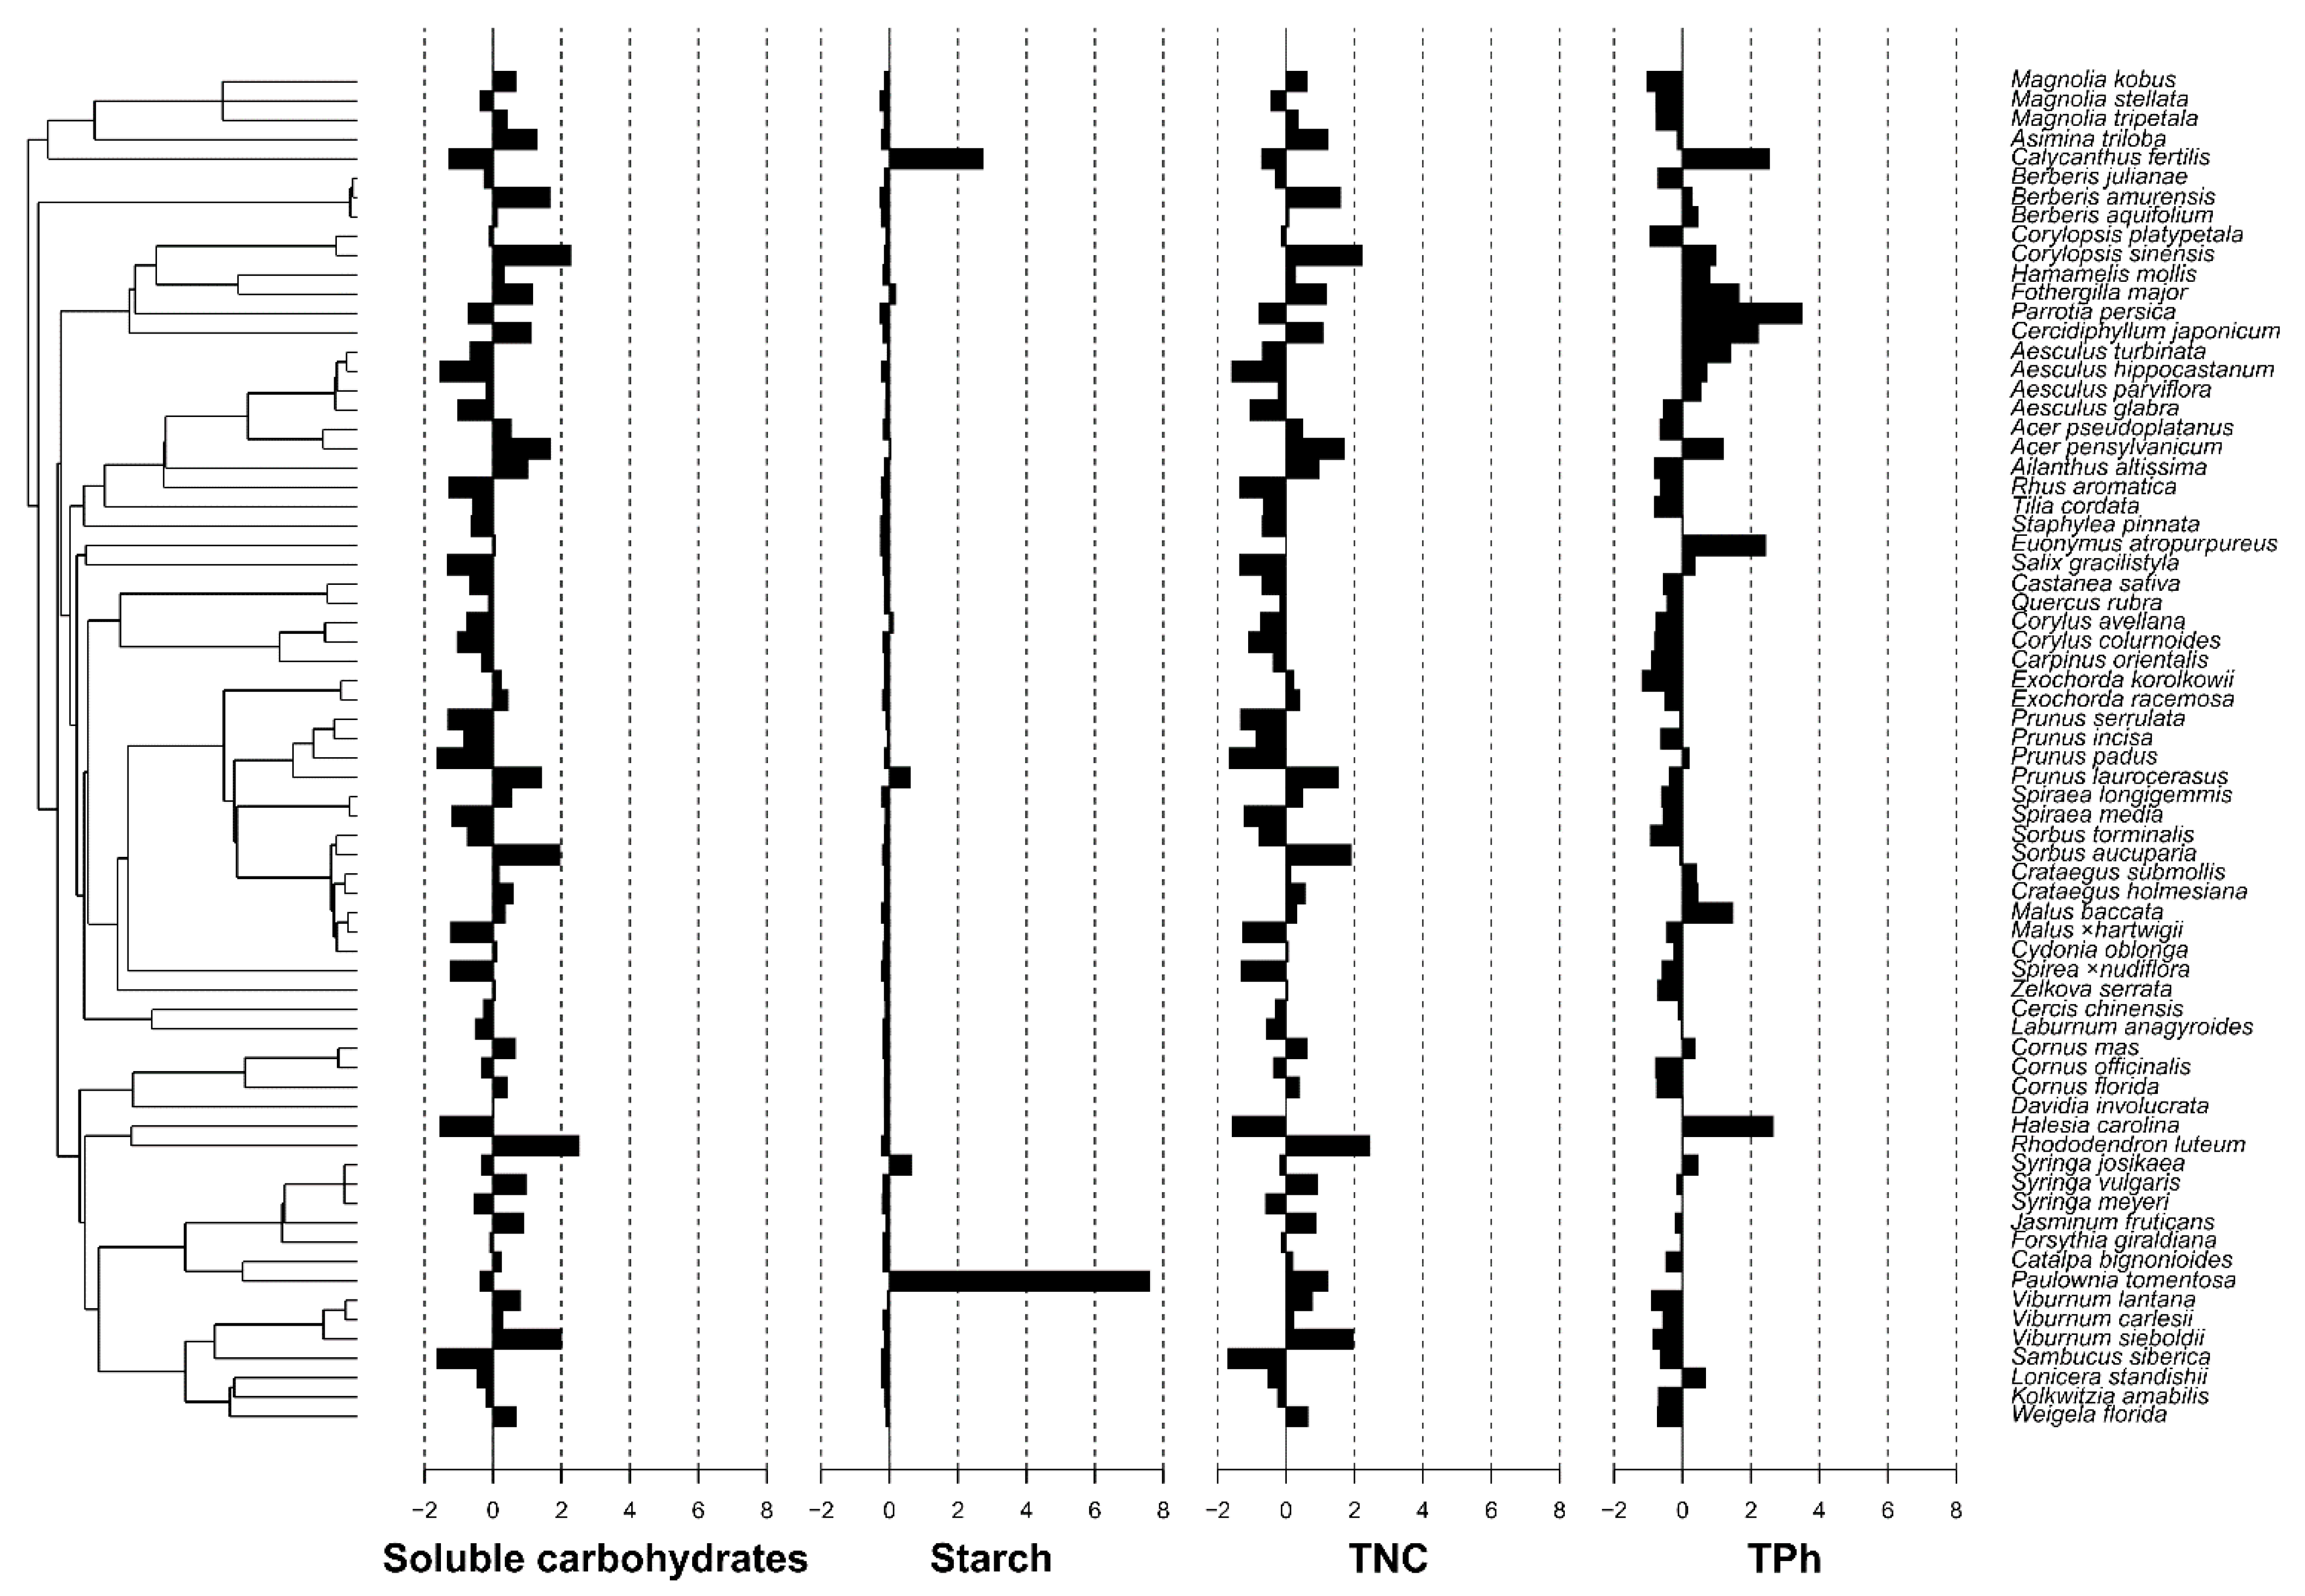
| Parameter Studied | Cmean | I | K | K.star | Lambda |
|---|---|---|---|---|---|
| Soluble carbohydrates | −0.067 | −0.007 | 0.135 | 0.143 | 6.70 × 10⁻⁵ |
| Starch | −0.033 | −0.011 | 0.550 | 0.567 | 1.011 |
| TNC | −0.051 | −0.007 | 0.138 | 0.146 | 6.70 × 10⁻⁵ |
| TPh | 0.207 | 0.000 | 0.275 | 0.268 | 6.78 × 10⁻¹ |
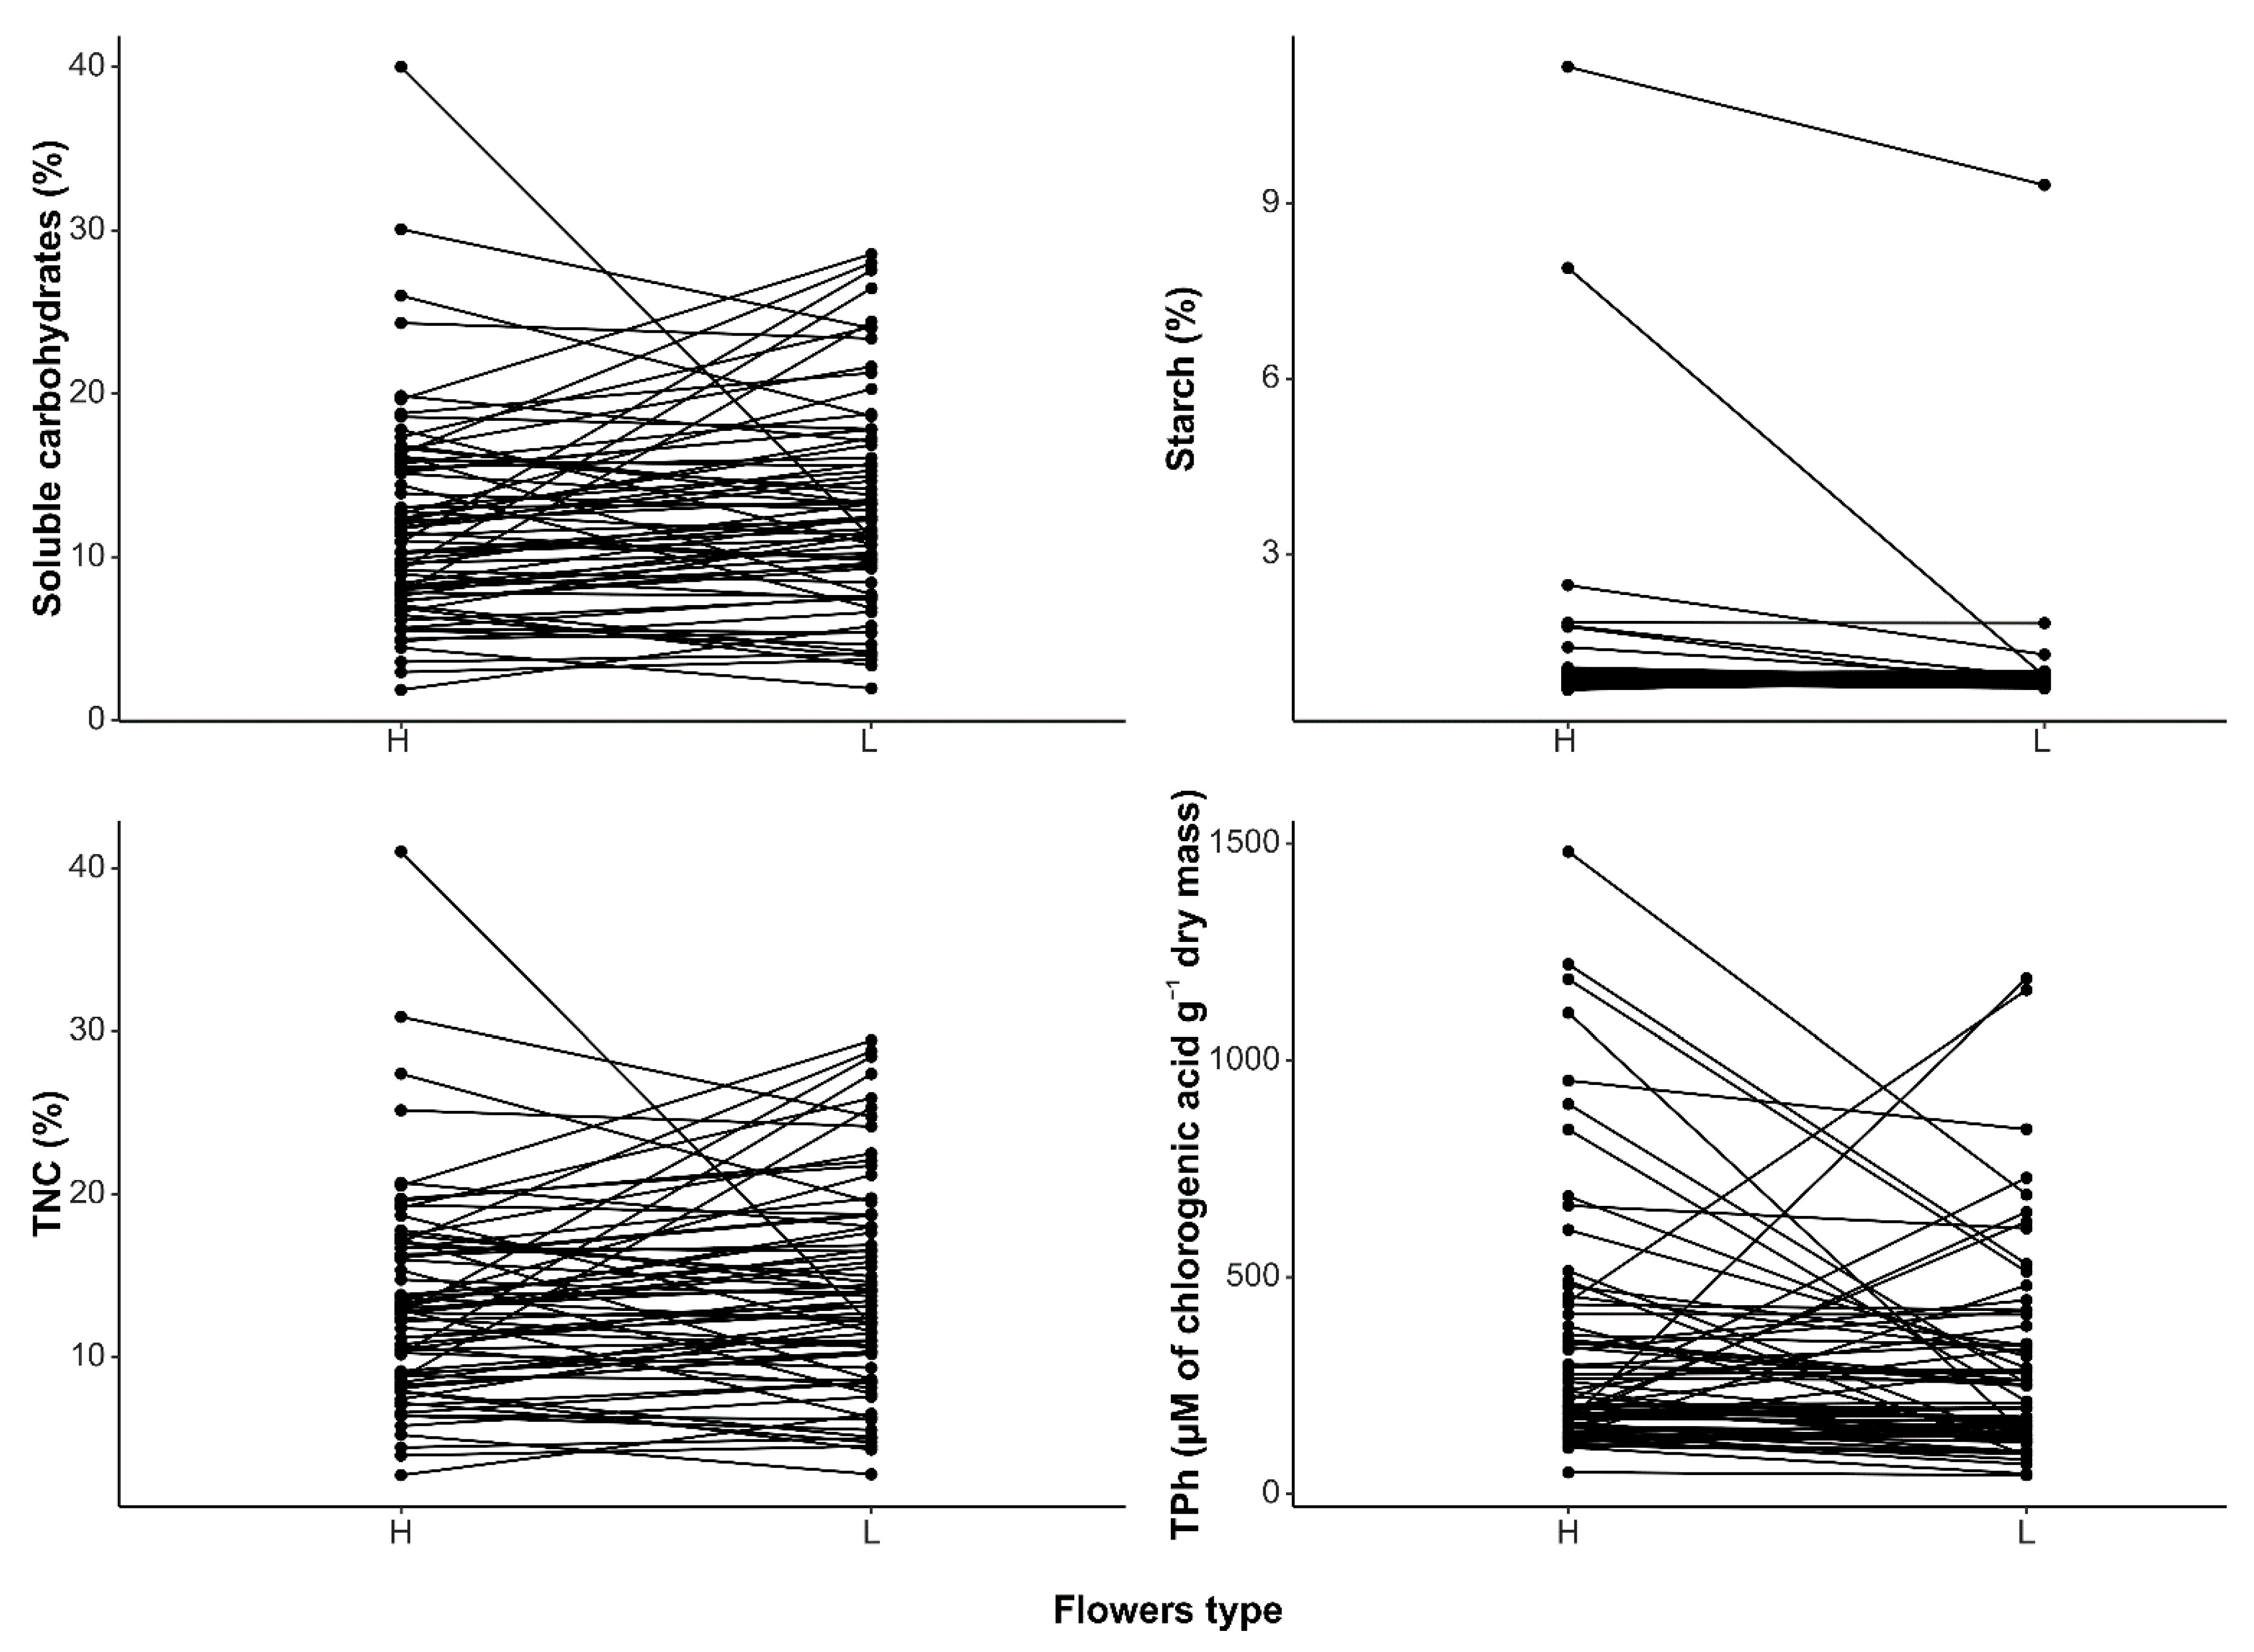
| Phylogenetic Mean Difference | 95% CI | t | p-Value | |
|---|---|---|---|---|
| Soluble carbohydrates | −0.996 | −2.410, 0.419 | −1.379 | 0.172 |
| Starch | 0.448 | −0.295, 1.192 | 1.182 | 0.241 |
| TNC | −0.807 | −2.239, 0.624 | −1.106 | 0.273 |
| TPh | 51.069 | −172.195, 274.333 | 0.448 | 0.655 |
Publisher’s Note: MDPI stays neutral with regard to jurisdictional claims in published maps and institutional affiliations. |
© 2022 by the authors. Licensee MDPI, Basel, Switzerland. This article is an open access article distributed under the terms and conditions of the Creative Commons Attribution (CC BY) license (https://creativecommons.org/licenses/by/4.0/).
Share and Cite
Paź-Dyderska, S.; Żytkowiak, R.; Jagodziński, A.M. Intra- and Interspecific Variability of Non-Structural Carbohydrates and Phenolic Compounds in Flowers of 70 Temperate Trees and Shrubs. Forests 2022, 13, 1256. https://doi.org/10.3390/f13081256
Paź-Dyderska S, Żytkowiak R, Jagodziński AM. Intra- and Interspecific Variability of Non-Structural Carbohydrates and Phenolic Compounds in Flowers of 70 Temperate Trees and Shrubs. Forests. 2022; 13(8):1256. https://doi.org/10.3390/f13081256
Chicago/Turabian StylePaź-Dyderska, Sonia, Roma Żytkowiak, and Andrzej M. Jagodziński. 2022. "Intra- and Interspecific Variability of Non-Structural Carbohydrates and Phenolic Compounds in Flowers of 70 Temperate Trees and Shrubs" Forests 13, no. 8: 1256. https://doi.org/10.3390/f13081256