
How Did the Mild and Humid Areas of China Turn Green? A Case Study on Chongqing

Abstract
:1. Introduction
2. Data and Methods
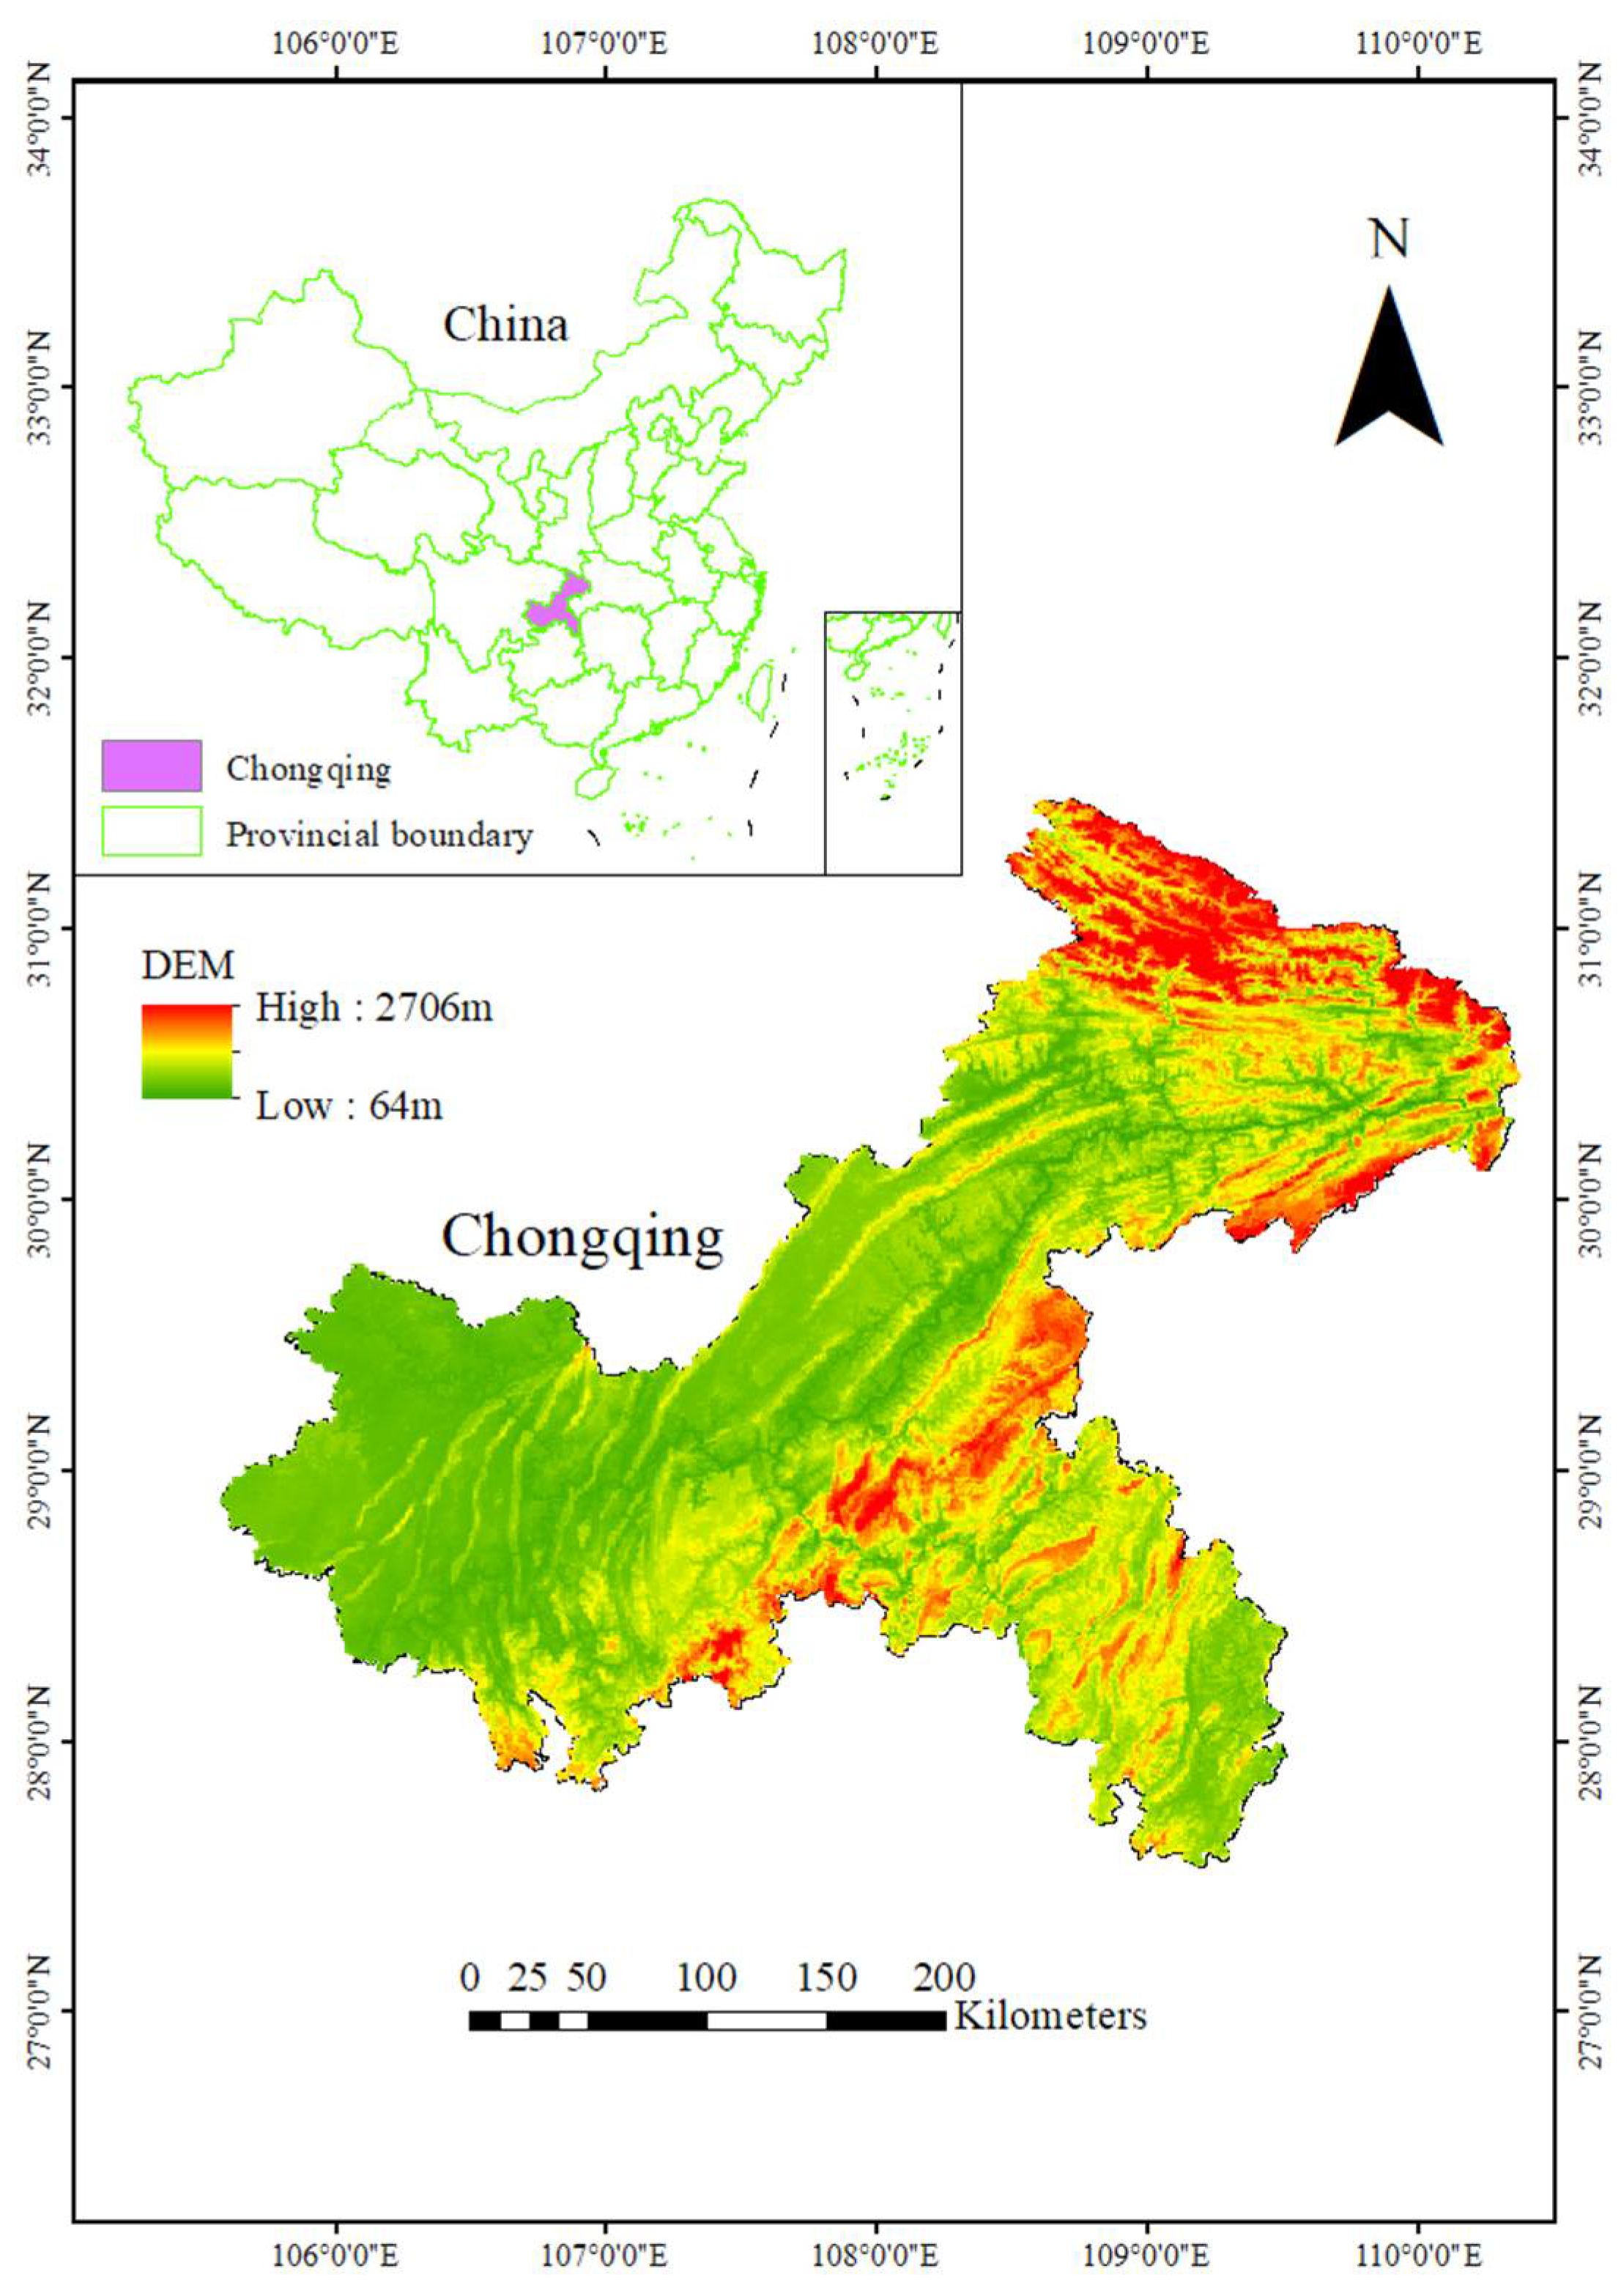
2.1. Study Area
2.2. Data Sources and Preprocessing
2.3. Methods
2.3.1. Research Framework
2.3.2. Maximum Value Compositing
2.3.3. Theil–Sen Slope Analysis and Mann–Kendall Test
2.3.4. Pearson Correlation Analysis
2.3.5. Residual Trend Analysis
2.3.6. Analysis of Relative Roles
2.3.7. Complex Network Model
- (1)
- Betweenness centrality
- (2)
- Average shortest path length
2.3.8. Hurst Index
3. Results
3.1. Spatial and Temporal Variations in Vegetation Cover
3.2. Response of Vegetation Cover to Climatic Factors
3.3. Response of Vegetation Cover to Human Activity
3.4. Relative Contribution of Climate Change and Human Activities to Changes in Vegetation Cover
3.4.1. Analysis of the Spatial Distribution of Driving Forces Affecting Vegetation-Cover Changes
3.4.2. Relative Contribution of Drivers in Areas of Decreased Vegetation Cover
3.4.3. Relative Contributions of Drivers in Areas with Increased Vegetation Cover
3.5. Impact of Afforestation Policies on Changes in Vegetation Cover
3.5.1. Analysis of Vegetation-cover Change Based on Complex Network Models
3.5.2. Effect of Afforestation Area on Vegetation Cover
3.6. Analysis of Future Vegetation Cover Trends
4. Discussion
4.1. Afforestation Policies
4.2. Urban Development and Improvement of Vegetation Cover
5. Conclusions
Author Contributions
Funding
Data Availability Statement
Conflicts of Interest
Appendix A


| Vegetation Cover Trends | Cultivated Land | Forest | Grassland | Water Area | Construction Land | Unused Land |
|---|---|---|---|---|---|---|
| Significant increase | 19,881 | 23,184 | 8736 | 369 | 244 | 11 |
| Non-significant increase | 11,120 | 5576 | 2407 | 318 | 146 | 2 |
| Non-significant decrease | 5124 | 1145 | 550 | 173 | 115 | 2 |
| Significant decrease | 2567 | 440 | 135 | 67 | 92 | 0 |
| Total | 38,692 | 30,345 | 11,828 | 927 | 597 | 15 |
| Vegetation Cover Trends | Cultivated Land | Forest | Grassland | Water Area | Construction Land | Unused Land |
|---|---|---|---|---|---|---|
| Significant increase | 19,897 | 25,610 | 5927 | 490 | 454 | 7 |
| Non-significant increase | 11,035 | 6328 | 1339 | 477 | 371 | 4 |
| Non-significant decrease | 4879 | 1208 | 271 | 248 | 496 | 0 |
| Significant decrease | 1660 | 388 | 55 | 94 | 1077 | 1 |
| Total | 37,471 | 33,534 | 7592 | 1309 | 2398 | 12 |


References
- Nesbitt, L.; Hotte, N.; Barron, S.; Cowan, J.; Sheppard, S.R.J. The social and economic value of cultural ecosystem services provided by urban forests in North America: A review and suggestions for future research. Urban For. Urban Green. 2017, 25, 103–111. [Google Scholar] [CrossRef]
- Huang, F.; Xu, S.L. Spatio-Temporal Variations of Rain-Use Efficiency in the West of Songliao Plain, China. Sustainability 2016, 8, 308. [Google Scholar] [CrossRef] [Green Version]
- Chu, H.S.; Venevsky, S.; Wu, C.; Wang, M.H. NDVI-based vegetation dynamics and its response to climate changes at Amur-Heilongjiang River Basin from 1982 to 2015. Sci. Total Environ. 2019, 650, 2051–2062. [Google Scholar] [CrossRef] [PubMed]
- Liu, S.Y.; Huang, S.Z.; Xie, Y.Y.; Wang, H.; Huang, Q.; Leng, G.Y.; Li, P.; Wang, L. Spatial-temporal changes in vegetation cover in a typical semi-humid and semi-arid region in China: Changing patterns, causes and implications. Ecol. Indic. 2019, 98, 462–475. [Google Scholar] [CrossRef]
- Liu, H.; Zheng, L.; Yin, S.J. Multi-perspective analysis of vegetation cover changes and driving factors of long time series based on climate and terrain data in Hanjiang River Basin, China. Arab. J. Geosci. 2018, 11, 16. [Google Scholar] [CrossRef] [Green Version]
- Dardel, C.; Kergoat, L.; Hiernaux, P.; Mougin, E.; Grippa, M.; Tucker, C.J. Re-greening Sahel: 30 years of remote sensing data and field observations (Mali, Niger). Remote Sens. Environ. 2014, 140, 350–364. [Google Scholar] [CrossRef]
- Fensholt, R.; Rasmussen, K.; Nielsen, T.T.; Mbow, C. Evaluation of earth observation based long term vegetation trends—Intercomparing NDVI time series trend analysis consistency of Sahel from AVHRR GIMMS, Terra MODIS and SPOT VGT data. Remote Sens. Environ. 2009, 113, 1886–1898. [Google Scholar] [CrossRef]
- He, G.X.; Zhen, X.J.; Li, Z.L.; Shen, W.S.; Han, J.; Zhang, L.; Li, X.; Zhang, R. Influence of Variations of Hydrothermal Conditions on Normalized Difference Vegetation Index in Typical Temperature Zones Along the East Coast of China. Front. Earth Sci. 2020, 8, 574101. [Google Scholar] [CrossRef]
- Mao, D.H.; Wang, Z.M.; Luo, L.; Ren, C.Y. Integrating AVHRR and MODIS data to monitor NDVI changes and their relationships with climatic parameters in Northeast China. Int. J. Appl. Earth Obs. Geoinf. 2012, 18, 528–536. [Google Scholar] [CrossRef]
- Fang, J.Y.; Piao, S.L.; Zhou, L.M.; He, J.S.; Wei, F.Y.; Myneni, R.B.; Tucker, C.J.; Tan, K. Precipitation patterns alter growth of temperate vegetation. Geophys. Res. Lett. 2005, 32, 5. [Google Scholar] [CrossRef] [Green Version]
- Nicholson, S.E.; Farrar, T.J. The influence of soil type on the relationships between NDVI, rainfall, and soil-moisture in semiarid Botswana. 1. NDVI response to rainfall. Remote Sens. Environ. 1994, 50, 107–120. [Google Scholar] [CrossRef]
- Deng, S.F.; Yang, T.B.; Zeng, B.; Zhu, X.F.; Xu, H.J. Vegetation cover variation in the Qilian Mountains and its response to climate change in 2000–2011. J. Mt. Sci. 2013, 10, 1050–1062. [Google Scholar] [CrossRef]
- Bagnoud, N.; Pitman, A.J.; McAvaney, B.J.; Holbrook, N.J. The contribution of the land surface energy balance complexity to differences in means, variances and extremes using the AMIP-II methodology. Clim. Dyn. 2005, 25, 171–188. [Google Scholar] [CrossRef]
- Blanken, P.D.; Black, T.A.; Neumann, H.H.; den Hartog, G.; Yang, P.C.; Nesic, Z.; Lee, X. The seasonal water and energy exchange above and within a boreal aspen forest. J. Hydrol. 2001, 245, 118–136. [Google Scholar] [CrossRef]
- Ding, B.H.; Yang, K.; Qin, J.; Wang, L.; Chen, Y.Y.; He, X.B. The dependence of precipitation types on surface elevation and meteorological conditions and its parameterization. J. Hydrol. 2014, 513, 154–163. [Google Scholar] [CrossRef]
- Fatima, Z.; Ahmed, M.; Hussain, M.; Abbas, G.; Ul-Allah, S.; Ahmad, S.; Ahmed, N.; Ali, M.A.; Sarwar, G.; Iqbal, P.; et al. The fingerprints of climate warming on cereal crops phenology and adaptation options. Sci. Rep. 2020, 10, 21. [Google Scholar] [CrossRef]
- Myers-Smith, I.H.; Kerby, J.T.; Phoenix, G.K.; Bjerke, J.W.; Epstein, H.E.; Assmann, J.J.; John, C.; Andreu-Hayles, L.; Angers-Blondin, S.; Beck, P.S.A.; et al. Complexity revealed in the greening of the Arctic. Nat. Clim. Chang. 2020, 10, 106–117. [Google Scholar] [CrossRef] [Green Version]
- Jiao, K.W.; Gao, J.B.; Wu, S.H. Climatic determinants impacting the distribution of greenness in China: Regional differentiation and spatial variability. Int. J. Biometeorol. 2019, 63, 523–533. [Google Scholar] [CrossRef]
- Peng, S.S.; Chen, A.P.; Xu, L.; Cao, C.X.; Fang, J.Y.; Myneni, R.B.; Pinzon, J.E.; Tucker, C.J.; Piao, S.L. Recent change of vegetation growth trend in China. Environ. Res. Lett. 2011, 6, 13. [Google Scholar] [CrossRef]
- Zhou, J.H.; Cai, W.T.; Qin, Y.; Lai, L.M.; Guan, T.Y.; Zhang, X.L.; Jiang, L.H.; Du, H.; Yang, D.W.; Cong, Z.T.; et al. Alpine vegetation phenology dynamic over 16 years and its covariation with climate in a semi-arid region of China. Sci. Total Environ. 2016, 572, 119–128. [Google Scholar] [CrossRef]
- Wu, Y.Z.; Tang, G.P.; Gua, H.; Liu, Y.L.; Yang, M.Z.; Sun, L. The variation of vegetation greenness and underlying mechanisms in Guangdong province of China during 2001–2013 based on MODIS data. Sci. Total Environ. 2019, 653, 536–546. [Google Scholar] [CrossRef] [PubMed]
- Wang, X.M.; Hua, T.; Lang, L.L.; Ma, W.Y. Spatial differences of aeolian desertification responses to climate in arid Asia. Glob. Planet. Chang. 2017, 148, 22–28. [Google Scholar] [CrossRef] [Green Version]
- Xue, T.T.; Tang, G.P.; Sun, L.; Wu, Y.Z.; Liu, Y.L.; Dou, Y.F. Long-term trends in precipitation and precipitation extremes and underlying mechanisms in the US Great Basin during 1951–2013. J. Geophys. Res.-Atmos. 2017, 122, 6152–6169. [Google Scholar] [CrossRef]
- Zhu, L.; Gong, H.L.; Dai, Z.X.; Xu, T.B.; Su, X.S. An integrated assessment of the impact of precipitation and groundwater on vegetation growth in arid and semiarid areas. Environ. Earth Sci. 2015, 74, 5009–5021. [Google Scholar] [CrossRef] [Green Version]
- Madelene, O.A.; Chen, D.L. Land-use change: Impacts of climate variations and policies among small-scale farmers in the Loess Plateau, China. Land Use Policy 2006, 23, 361–371. [Google Scholar] [CrossRef]
- Xiu, L.N.; Yan, C.Z.; Li, X.S.; Qian, D.W.; Feng, K. Changes in wetlands and surrounding land cover in a desert area under the influences of human and climatic factors: A case study of the Hongjian Nur region. Ecol. Indic. 2019, 101, 261–273. [Google Scholar] [CrossRef]
- Baniya, B.; Tang, Q.H.; Huang, Z.W.; Sun, S.A.; Techato, K.A. Spatial and Temporal Variation of NDVI in Response to Climate Change and the Implication for Carbon Dynamics in Nepal. Forests 2018, 9, 329. [Google Scholar] [CrossRef] [Green Version]
- Nanzad, L.; Zhang, J.H.; Tuvdendorj, B.; Nabil, M.; Zhang, S.; Bai, Y. NDVI anomaly for drought monitoring and its correlation with climate factors over Mongolia from 2000 to 2016. J. Arid. Environ. 2019, 164, 69–77. [Google Scholar] [CrossRef]
- Piao, S.L.; Wang, X.H.; Park, T.; Chen, C.; Lian, X.; He, Y.; Bjerke, J.W.; Chen, A.P.; Ciais, P.; Tommervik, H.; et al. Characteristics, drivers and feedbacks of global greening. Nat. Rev. Earth Environ. 2020, 1, 14–27. [Google Scholar] [CrossRef]
- Feng, D.R.; Bao, W.K.; Yang, Y.Y.; Fu, M.C. How do government policies promote greening? Evidence from China. Land Use Policy 2021, 104, 19. [Google Scholar] [CrossRef]
- Blackman, A. Evaluating forest conservation policies in developing countries using remote sensing data: An introduction and practical guide. Forest Policy Econ. 2013, 34, 1–16. [Google Scholar] [CrossRef]
- Gullison, R.E.; Frumhoff, P.C.; Canadell, J.G.; Field, C.B.; Nepstad, D.C.; Hayhoe, K.; Avissar, R.; Curran, L.M.; Friedlingstein, P.; Jones, C.D.; et al. Tropical forests and climate policy. Science 2007, 316, 985–986. [Google Scholar] [CrossRef] [PubMed]
- Chazdon, R.L.; Brancalion, P.H.S.; Lamb, D.; Laestadius, L.; Calmon, M.; Kumar, C. A Policy-Driven Knowledge Agenda for Global Forest and Landscape Restoration. Conserv. Lett. 2017, 10, 125–132. [Google Scholar] [CrossRef]
- Suding, K.; Higgs, E.; Palmer, M.; Callicott, J.B.; Anderson, C.B.; Baker, M.; Gutrich, J.J.; Hondula, K.L.; LaFevor, M.C.; Larson, B.M.H.; et al. Committing to ecological restoration. Science 2015, 348, 638–640. [Google Scholar] [CrossRef] [PubMed] [Green Version]
- Cao, S.X.; Xu, C.G.; Chen, L.; Wang, X.Q. Attitudes of farmers in China’s northern Shaanxi Province towards the land-use changes required under the Grain for Green Project, and implications for the project’s success. Land Use Policy 2009, 26, 1182–1194. [Google Scholar] [CrossRef]
- Liu, J.G.; Li, S.X.; Ouyang, Z.Y.; Tam, C.; Chen, X.D. Ecological and socioeconomic effects of China’s policies for ecosystem services. Proc. Natl. Acad. Sci. USA 2008, 105, 9477–9482. [Google Scholar] [CrossRef] [Green Version]
- Li, G.; Sun, S.B.; Han, J.C.; Yan, J.W.; Liu, W.B.; Wei, Y.; Lu, N.; Sun, Y.Y. Impacts of Chinese Grain for Green program and climate change on vegetation in the Loess Plateau during 1982–2015. Sci. Total Environ. 2019, 665, 1190–1191. [Google Scholar] [CrossRef]
- Wang, S.S.; Gao, Y.N.; Li, Q.; Gao, J.F.; Zhai, S.H.; Zhou, Y.; Cheng, Y.H. Long-term and inter-monthly dynamics of aquatic vegetation and its relation with environmental factors in Taihu Lake, China. Sci. Total Environ. 2019, 651, 367–380. [Google Scholar] [CrossRef]
- Feng, D.R.; Wang, J.M.; Fu, M.C.; Liu, G.C.; Zhang, M.; Tang, R.B. Spatiotemporal variation and influencing factors of vegetation cover in the ecologically fragile areas of China from 2000 to 2015: A case study in Shaanxi Province. Environ. Sci. Pollut. Res. 2019, 26, 28977–28992. [Google Scholar] [CrossRef]
- Hopfner, C.; Scherer, D. Analysis of vegetation and land cover dynamics in north-western Morocco during the last decade using MODIS NDVI time series data. Biogeosciences 2011, 8, 3359–3373. [Google Scholar] [CrossRef] [Green Version]
- Zewdie, W.; Csaplovics, E.; Inostroza, L. Monitoring ecosystem dynamics in northwestern Ethiopia using NDVI and climate variables to assess long term trends in dryland vegetation variability. Appl. Geogr. 2017, 79, 167–178. [Google Scholar] [CrossRef]
- Dan, W.; Wei, H.; Zhang, S.W.; Kun, B.; Bao, X.; Yi, W.; Yue, L. Processes and prediction of land use/land cover changes (LUCC) driven by farm construction: The case of Naoli River Basin in Sanjiang Plain. Environ. Earth Sci. 2015, 73, 4841–4851. [Google Scholar] [CrossRef]
- Zuo, Y.; Cheng, J.; Fu, M. Analysis of Land Use Change and the Role of Policy Dimensions in Ecologically Complex Areas: A Case Study in Chongqing. Land 2022, 11, 627. [Google Scholar] [CrossRef]
- Morone, F.; Makse, H.A. Influence maximization in complex networks through optimal percolation. Nature 2015, 524, 65–68. [Google Scholar] [CrossRef] [PubMed] [Green Version]
- Wang, L.S.; Song, R.; Qu, Z.; Zhao, H.; Zhai, C.M. Study of China’s Publicity Translations Based on Complex Network Theory. IEEE Access 2018, 6, 35753–35763. [Google Scholar] [CrossRef]
- Jansen, V.S.; Kolden, C.A.; Schmalz, H.J. The Development of Near Real-Time Biomass and Cover Estimates for Adaptive Rangeland Management Using Landsat 7 and Landsat 8 Surface Reflectance Products. Remote Sens. 2018, 10, 1057. [Google Scholar] [CrossRef] [Green Version]
- Peng, S.Z.; Ding, Y.X.; Liu, W.Z.; Li, Z. 1 km monthly temperature and precipitation dataset for China from 1901 to 2017. Earth Syst. Sci. Data 2019, 11, 1931–1946. [Google Scholar] [CrossRef] [Green Version]
- Chen, J.; Xu, C.; Lin, S.; Wu, Z.; Qiu, R.; Hu, X. Is There Spatial Dependence or Spatial Heterogeneity in the Distribution of Vegetation Greening and Browning in Southeastern China? Forests 2022, 13, 840. [Google Scholar] [CrossRef]
- Yang, C.; Fu, M.C.; Feng, D.R.; Sun, Y.Y.; Zhai, G.H. Spatiotemporal Changes in Vegetation Cover and Its Influencing Factors in the Loess Plateau of China Based on the Geographically Weighted Regression Model. Forests 2021, 12, 673. [Google Scholar] [CrossRef]
- Zhang, M.; Wang, J.M.; Li, S.J. Tempo-spatial changes and main anthropogenic influence factors of vegetation fractional coverage in a large-scale opencast coal mine area from 1992 to 2015. J. Clean Prod. 2019, 232, 940–952. [Google Scholar] [CrossRef]
- Volkova, L.; Adinugroho, W.C.; Krisnawati, H.; Imanuddin, R.; Weston, C.J. Loss and Recovery of Carbon in Repeatedly Burned Degraded Peatlands of Kalimantan, Indonesia. Fire 2021, 4, 64. [Google Scholar] [CrossRef]
- Xofis, P.; Spiliotis, J.A.; Chatzigiovanakis, S.; Chrysomalidou, A.S. Long-Term Monitoring of Vegetation Dynamics in the Rhodopi Mountain Range National Park-Greece. Forests 2022, 13, 377. [Google Scholar] [CrossRef]
- Holben, B.N. Characteristics of maximum-value composite images from temporal avhrr data. Int. J. Remote Sens. 1986, 7, 1417–1434. [Google Scholar] [CrossRef]
- van Leeuwen, W.J.D.; Huete, A.R.; Laing, T.W. MODIS vegetation index compositing approach: A prototype with AVHRR data. Remote Sens. Environ. 1999, 69, 264–280. [Google Scholar] [CrossRef]
- Peng, J.; Li, Y.; Tian, L.; Liu, Y.X.; Wang, Y.L. Vegetation Dynamics and Associated Driving Forces in Eastern China during 1999–2008. Remote Sens. 2015, 7, 13641–13663. [Google Scholar] [CrossRef] [Green Version]
- Fensholt, R.; Langanke, T.; Rasmussen, K.; Reenberg, A.; Prince, S.D.; Tucker, C.; Scholes, R.J.; Le, Q.B.; Bondeau, A.; Eastman, R.; et al. Greenness in semi-arid areas across the globe 1981–2007—An Earth Observing Satellite based analysis of trends and drivers. Remote Sens. Environ. 2012, 121, 144–158. [Google Scholar] [CrossRef]
- Li, Y.; Xie, Z.X.; Qin, Y.C.; Zheng, Z.C. Estimating Relations of Vegetation, Climate Change, and Human Activity: A Case Study in the 400 mm Annual Precipitation Fluctuation Zone, China. Remote Sens. 2019, 11, 1159. [Google Scholar] [CrossRef] [Green Version]
- Gocic, M.; Trajkovic, S. Analysis of changes in meteorological variables using Mann-Kendall and Sen’s slope estimator statistical tests in Serbia. Glob. Planet. Chang. 2013, 100, 172–182. [Google Scholar] [CrossRef]
- Fuller, D.O.; Wang, Y. Recent Trends in Satellite Vegetation Index Observations Indicate Decreasing Vegetation Biomass in the Southeastern Saline Everglades Wetlands. Wetlands 2014, 34, 67–77. [Google Scholar] [CrossRef]
- Cao, R.; Jiang, W.G.; Yuan, L.H.; Wang, W.J.; Lv, Z.L.; Chen, Z. Inter-annual variations in vegetation and their response to climatic factors in the upper catchments of the Yellow River from 2000 to 2010. J. Geogr. Sci. 2014, 24, 963–979. [Google Scholar] [CrossRef] [Green Version]
- Li, C.L.; Leal, W.; Wang, J.; Yin, J.; Fedoruk, M.; Bao, G.; Bao, Y.H.; Yin, S.; Yu, S.; Hu, R.C. An assessment of the impacts of climate extremes on the vegetation in Mongolian Plateau: Using a scenarios-based analysis to support regional adaptation and mitigation options. Ecol. Indic. 2018, 95, 805–814. [Google Scholar] [CrossRef]
- Kang, C.; Zhang, Y.L.; Wang, Z.F.; Liu, L.S.; Zhang, H.M.; Jo, Y. The Driving Force Analysis of NDVI Dynamics in the Trans-Boundary Tumen River Basin between 2000 and 2015. Sustainability 2017, 9, 2350. [Google Scholar] [CrossRef] [Green Version]
- Mo, K.L.; Chen, Q.W.; Chen, C.; Zhang, J.Y.; Wang, L.; Bao, Z.X. Spatiotemporal variation of correlation between vegetation cover and precipitation in an arid mountain-oasis river basin in northwest China. J. Hydrol. 2019, 574, 138–147. [Google Scholar] [CrossRef]
- Li, S.S.; Yang, S.N.; Liu, X.F.; Liu, Y.X.; Shi, M.M. NDVI-Based Analysis on the Influence of Climate Change and Human Activities on Vegetation Restoration in the Shaanxi-Gansu-Ningxia Region, Central China. Remote Sens. 2015, 7, 11163–11182. [Google Scholar] [CrossRef] [Green Version]
- Jiang, L.L.; Jiapaer, G.; Bao, A.M.; Guo, H.; Ndayisaba, F. Vegetation dynamics and responses to climate change and human activities in Central Asia. Sci. Total Environ. 2017, 599, 967–980. [Google Scholar] [CrossRef] [PubMed]
- Li, A.; Wu, J.G.; Huang, J.H. Distinguishing between human-induced and climate-driven vegetation changes: A critical application of RESTREND in inner Mongolia. Landsc. Ecol. 2012, 27, 969–982. [Google Scholar] [CrossRef]
- Li, H.; Liu, L.; Liu, X.C.; Li, X.P.; Xu, Z.X. Greening Implication Inferred from Vegetation Dynamics Interacted with Climate Change and Human Activities over the Southeast Qinghai-Tibet Plateau. Remote Sens. 2019, 11, 2421. [Google Scholar] [CrossRef] [Green Version]
- Yang, H.; Hu, J.; Zhang, S.; Xiong, L.; Xu, Y. Climate Variations vs. Human Activities: Distinguishing the Relative Roles on Vegetation Dynamics in the Three Karst Provinces of Southwest China. Front. Earth Sci. 2022, 10, 17. [Google Scholar] [CrossRef]
- Evans, J.; Geerken, R. Discrimination between climate and human-induced dryland degradation. J. Arid. Environ. 2004, 57, 535–554. [Google Scholar] [CrossRef]
- Sun, W.Y.; Song, X.Y.; Mu, X.M.; Gao, P.; Wang, F.; Zhao, G.J. Spatiotemporal vegetation cover variations associated with climate change and ecological restoration in the Loess Plateau. Agric. For. Meteorol. 2015, 209, 87–99. [Google Scholar] [CrossRef]
- He, L.; Guo, J.B.; Jiang, Q.N.; Zhang, Z.Y.; Yu, S.P. How did the Chinese Loess Plateau turn green from 2001 to 2020? An explanation using satellite data. Catena 2022, 214, 15. [Google Scholar] [CrossRef]
- Wen, S.; Jiang, J.J.; Liu, B.; Xiang, Y.; Zhou, W.L. Using epidemic betweenness to measure the influence of users in complex networks. J. Netw. Comput. Appl. 2017, 78, 288–299. [Google Scholar] [CrossRef]
- Newman, M.E.J. A measure of betweenness centrality based on random walks. Soc. Networks 2005, 27, 39–54. [Google Scholar] [CrossRef] [Green Version]
- Brandes, U. A faster algorithm for betweenness centrality. J. Math. Sociol. 2001, 25, 163–177. [Google Scholar] [CrossRef]
- Wang, Y.; Li, X.M.; Li, J.F.; Huang, Z.D.; Xiao, R.B. Impact of Rapid Urbanization on Vulnerability of Land System from Complex Networks View: A Methodological Approach. Complexity 2018, 18, 8561675. [Google Scholar] [CrossRef] [Green Version]
- Zhang, D.J.; Ge, W.Y.; Zhang, Y. Evaluating the vegetation restoration sustainability of ecological projects: A case study of Wuqi County in China. J. Clean Prod. 2020, 264, 17. [Google Scholar] [CrossRef]
- Jiang, W.G.; Yuan, L.H.; Wang, W.J.; Cao, R.; Zhang, Y.F.; Shen, W.M. Spatio-temporal analysis of vegetation variation in the Yellow River Basin. Ecol. Indic. 2015, 51, 117–126. [Google Scholar] [CrossRef]
- He, B.; Chen, A.F.; Wang, H.L.; Wang, Q.F. Dynamic Response of Satellite-Derived Vegetation Growth to Climate Change in the Three North Shelter Forest Region in China. Remote Sens. 2015, 7, 9998–10016. [Google Scholar] [CrossRef] [Green Version]
- Niu, Q.F.; Xiao, X.M.; Zhang, Y.; Qin, Y.W.; Dang, X.H.; Wang, J.; Zou, Z.H.; Doughty, R.B.; Brandt, M.; Tong, X.W.; et al. Ecological engineering projects increased vegetation cover, production, and biomass in semiarid and subhumid Northern China. Land Degrad. Dev. 2019, 30, 1620–1631. [Google Scholar] [CrossRef] [Green Version]
- Gao, J.B.; Wang, H.; Zuo, L.Y. Spatial gradient and quantitative attribution of karst soil erosion in Southwest China. Environ. Monit. Assess. 2018, 190, 13. [Google Scholar] [CrossRef]
- Zheng, X.; Zhu, J.J.; Xing, Z.F. Assessment of the effects of shelterbelts on crop yields at the regional scale in Northeast China. Agric. Syst. 2016, 143, 49–60. [Google Scholar] [CrossRef]
- Normile, D. Ecology—Getting at the roots of killer dust storms. Science 2007, 317, 314–316. [Google Scholar] [CrossRef] [PubMed]
- Feng, D.R.; Fu, M.C.; Sun, Y.Y.; Bao, W.K.; Zhang, M.; Zhang, Y.F.; Wu, J.J. How Large-Scale Anthropogenic Activities Influence Vegetation Cover Change in China? A Review. Forests 2021, 12, 320. [Google Scholar] [CrossRef]
- Li, Q.; Wang, F.; Yu, Y.; Huang, Z.C.; Li, M.T.; Guan, Y.T. Comprehensive performance evaluation of LID practices for the sponge city construction: A case study in Guangxi, China. J. Environ. Manag. 2019, 231, 10–20. [Google Scholar] [CrossRef] [PubMed]
- Peng, Y.; Wang, Q.H.; Fan, M. Identification of the key ecological factors influencing vegetation degradation in semi-arid agro-pastoral ecotone considering spatial scales. Acta Oecol.-Int. J. Ecol. 2017, 85, 62–68. [Google Scholar] [CrossRef]


| Partition | Relative Contribution of Climatic Factors (%) | Relative Contribution of Human Activities (%) | Driving Forces | |||
|---|---|---|---|---|---|---|
| Scenario | ||||||
| >0 | Scenario 1 | >0 | >0 | climatic factors and human activity | ||
| Scenario 2 | >0 | <0 | 100 | 0 | climatic factors | |
| Scenario 3 | <0 | >0 | 0 | 100 | human activity | |
| <0 | Scenario 1 | <0 | <0 | climatic factors and human activity | ||
| Scenario 2 | <0 | >0 | 100 | 0 | climatic factors | |
| Scenario 3 | >0 | <0 | 0 | 100 | human activity | |
| Trend | Area (km2) | Proportion (%) |
|---|---|---|
| Significant increase | 52,425 | 63.62 |
| Non-significant increase | 19,569 | 23.75 |
| Non-significant decrease | 7109 | 8.63 |
| Significant decrease | 3301 | 4.01 |
| Type | Precipitation | Temperature | ||
|---|---|---|---|---|
| Area (km2) | Proportion (%) | Area (km2) | Proportion (%) | |
| Negative correlation (p < 0.05) | 1839 | 2.23 | 1319 | 1.60 |
| Negative correlation (p > 0.05) | 15986 | 19.40 | 31873 | 38.68 |
| Positive correlation (p > 0.05) | 47955 | 58.19 | 45605 | 55.34 |
| Positive correlation (p < 0.05) | 16624 | 20.17 | 3607 | 4.38 |
| Trend | Area (km2) | Proportion (%) |
|---|---|---|
| Significant increase | 39,176 | 47.54 |
| Non-significant increase | 29,522 | 35.83 |
| Non-significant decrease | 11,532 | 13.99 |
| Significant decrease | 2174 | 2.64 |
| Partition | Area (km2) | Proportion (%) | |
|---|---|---|---|
| Area | Driving Forces | ||
| Areas of increased vegetation cover | CV * | 4056 | 4.94 |
| CV and HA | 59,051 | 71.95 | |
| HA * | 8814 | 10.74 | |
| Areas of decreased vegetation cover | CV | 765 | 0.93 |
| CV and HA | 6055 | 7.38 | |
| HA | 3336 | 4.06 | |
| Land-Use Type | Significant Increase | Non-Significant Increase | Non-Significant Decrease | Significant Decrease |
|---|---|---|---|---|
| Cultivated land | 1.75 | 3.0 | 1.5 | 0.0 |
| Forest | 1.75 | 0.0 | 0.0 | 0.0 |
| Grassland | 0.0 | 1.5 | 0.0 | 0.0 |
| Water area | 0.25 | 1.5 | 1.5 | 0.0 |
| Construction land | 0.25 | 0.0 | 0.0 | 0.0 |
| Unused land | 0.0 | 0.0 | 0.0 | 0.0 |
| Vegetation Cover Trends | Average Shortest Path |
|---|---|
| Significant increase | 1.133 |
| Non-significant increase | 1.2 |
| Non-significant decrease | 1.12 |
| Significant decrease | 1 |
| Period | Area (km2) | Proportion (%) |
|---|---|---|
| 2000–2004 | 8639.68 | 23.40 |
| 2005–2009 | 4572.41 | 12.38 |
| 2010–2014 | 11,249.78 | 30.47 |
| 2015–2019 | 12,462.78 | 33.75 |
| Year | The Natural Forest Resources Protection Project Afforestation Area (km2) | The Grain for Green Program Afforestation Area (km2) |
|---|---|---|
| 2008 | 812.42 | 200 |
| 2009 | 426.67 | 366.71 |
| 2010 | 600 | 303.12 |
| 2011 | 326.69 | 262.69 |
| 2012 | 246.69 | 230.02 |
| 2013 | 236.68 | 243.35 |
| 2014 | 70.48 | 40.01 |
| 2015 | 315.53 | 676.02 |
| 2016 | 220.01 | 656.58 |
| 2017 | 226.67 | 487.24 |
| 2018 | 174.64 | 1000 |
| 2019 | 156.16 | 695.95 |
| Cumulative value | 3812.64 | 5161.69 |
| Future Vegetation Cover Trends | Hurst Index | |
|---|---|---|
| Strong sustainability and degradation | 0.65 ≤ H < 1.00 | degradation |
| Slight sustainability and degradation | 0.5 ≤ H < 0.65 | degradation |
| Slight anti-sustainability and degradation | 0.35 ≤ H < 0.5 | degradation |
| Strong anti-sustainability and degradation | 0.00 ≤ H < 0.35 | degradation |
| Strong anti-sustainability and improvement | 0.00 ≤ H < 0.35 | improvement |
| Slight anti-sustainability and improvement | 0.35 ≤ H < 0.5 | improvement |
| Slight sustainability and improvement | 0.5 ≤ H < 0.65 | improvement |
| Strong sustainability and improvement | 0.65 ≤ H < 1.00 | improvement |
| Future Vegetation Cover Trends | Area (km2) | Proportion (%) |
|---|---|---|
| Strong sustainability and degradation | 630 | 0.77% |
| Slight sustainability and degradation | 3227 | 3.93% |
| Slight anti-sustainability and degradation | 5170 | 6.29% |
| Strong anti-sustainability and degradation | 1192 | 1.45% |
| Strong anti-sustainability and improvement | 12,756 | 15.52% |
| Slight anti-sustainability and improvement | 43,311 | 52.70% |
| Slight sustainability and improvement | 15,043 | 18.30% |
| Strong sustainability and improvement | 855 | 1.04% |
Publisher’s Note: MDPI stays neutral with regard to jurisdictional claims in published maps and institutional affiliations. |
© 2022 by the authors. Licensee MDPI, Basel, Switzerland. This article is an open access article distributed under the terms and conditions of the Creative Commons Attribution (CC BY) license (https://creativecommons.org/licenses/by/4.0/).
Share and Cite
Zuo, Y.; Cheng, J.; Zhang, H.; Tang, F.; Fu, M. How Did the Mild and Humid Areas of China Turn Green? A Case Study on Chongqing. Forests 2022, 13, 1257. https://doi.org/10.3390/f13081257
Zuo Y, Cheng J, Zhang H, Tang F, Fu M. How Did the Mild and Humid Areas of China Turn Green? A Case Study on Chongqing. Forests. 2022; 13(8):1257. https://doi.org/10.3390/f13081257
Chicago/Turabian StyleZuo, Yiting, Jie Cheng, Hongjie Zhang, Feng Tang, and Meichen Fu. 2022. "How Did the Mild and Humid Areas of China Turn Green? A Case Study on Chongqing" Forests 13, no. 8: 1257. https://doi.org/10.3390/f13081257