Article

Identifying Suitable Restoration and Conservation Areas for Dracaena cinnabari Balf.f. in Socotra, Yemen

1
Department of Environmental Biology, Sapienza University of Rome, Piazzale Aldo Moro 5, 00185 Rome, Italy
2
Department of Forest Botany, Dendrology and Geobiocoenology, Faculty of Forestry and Wood Technology (FFWT), Mendel University in Brno (MENDELU), Zemědělská 3, 613 00 Brno, Czech Republic
3
Department of Forest Management and Applied Geoinformatics, Faculty of Forestry and Wood Technology (FFWT), Mendel University in Brno (MENDELU), Zemědělská 3, 613 00 Brno, Czech Republic
4
Centre for Academic Heritage and Archives & Ghent University Botanical Garden, Ghent University, K.L. Ledeganckstraat 35, 9000 Ghent, Belgium
*
Author to whom correspondence should be addressed.
Forests 2022, 13(8), 1276; https://doi.org/10.3390/f13081276
Submission received: 8 June 2022 / Revised: 5 August 2022 / Accepted: 7 August 2022 / Published: 12 August 2022
(This article belongs to the Special Issue New Knowledge in Dragon Tree Research)

Abstract

:
We examine the distribution of Dracaena cinnabari, the Socotran Dragon’s Blood Tree, an endangered species endemic to the island of Socotra (Yemen)—and we propose an accessibility approach to its conservation, taking the proximity of local communities and land users into account. Using the present occurrence of D. cinnabari, we applied a machine learning algorithm (random forest classifier) to estimate the potential distribution of the species across the island (overall validation accuracy of 0.91) based on available climatic and physiographic parameters. In parallel, we used an accessibility methodology to generate a map of the energy cost of accessing potential areas from the villages. This community-focused accessibility map, combined with the potential distribution map of Dracaena cinnabari, could contribute to decision-making processes related to long-term ecological restoration and reforestation activities. With our case study, we wish to emphasize that user-focused efforts and the implementation of sustainable land practices should play key roles in conserving endangered tree species.

1. Introduction

Dragon trees are a small group of arborescent Dracaena taxa [1] among the more than 190 species in the genus [2]. Most dragon tree species are endangered, and often endemic with isolated, insular populations with low abundances [3]. Dracaena cinnabari Balf.f. is an endemic Cenozoic relict of the main island of Socotra (Yemen), well known for its red resin called dragon’s blood used since ancient time [4,5]. The population of this species is currently estimated at ca. 80,000 individuals [6], but the age structure is unbalanced, with a prevalence of overmature trees [7,8,9]. Juvenile trees are missing across the island due to a long-term population decline caused by overgrazing [10,11,12], resin harvesting [4], and manifestation of global climate change [6,13]. Miller [14] assessed D. cinnabari as vulnerable according to IUCN criteria (IUCN Red List). This species is not threatened with extinction in the coming years [15]; however general models of future population development predict a decline by 40% in 100 years and extinction over maximally ca. 500 years [6,16].
The iconic Socotran Dragon’s Blood trees provides a wide range of ecosystem services [3]. Rejžek, et al. [17] considered D. cinnabari as a nurse tree with high ecological importance for biodiversity maintenance; every fallen tree can lead to decreases in the populations of other endemic plant species. Due to its ability to capture horizontal precipitation, the decline of the D. cinnabari population may increase aridification of the land which, in addition to overgrazing, makes natural regeneration even more difficult even though this species is well adapted to droughts [12,18,19]. Furthermore, D. cinnabari plays a crucial cultural role for the indigenous communities of Socotra, providing valuable resin and other non-timber plant products that have a wide range of medicinal and other ethnobotanical uses [5].
Other authors referred to the decline of different dragon tree species populations in the 20th century [13,15,20,21,22,23,24,25], for different reasons. Hence, there is a clear need for conservation activities to support natural regeneration or artificial reforestation [3]. A recent interesting recovery of Dracaena ombet in Baryakay (Sudan) was documented after mass death events in the 20th century with a shift of saplings to the higher altitudes and coastal areas compared to the distribution of adult trees [21]. Moreover, in an exclosure experiment on the island of Socotra, natural regeneration of Dracaena cinnabari was reported [26]. Regarding artificial afforestation, there are only a few examples of rescue programs [3]. For D. tamaranae, an effective rescue conservation program has been running in Gran Canaria (Spain) for over 15 years [27]. On the Canary Islands [28] and on the Cape Verde Islands [29], many dragon trees (Dracaena draco s.l.) have been cultivated near houses, hotels, in garden and in parks. On Socotra, efforts to reforest D. cinnabari in situ have been documented since 2006, when more than 700 three-year old seedlings were planted in the Ras Ayre area [12].
Taking into account the ongoing decline of the terrestrial ecosystems on Socotra for various reasons, ecological restoration and reforestation activities of this endemic tree species are urgently needed [12,30,31]. To identify the most suitable areas for such interventions, a model, based on the Dragon tree as a case study and applicable to other species, integrating suitability and accessibility analyses is proposed in this study.

2. Materials and Methods

2.1. Datasets

Although lacking detailed resolution, remote sensing products containing climatic data are currently widely available [32]. For this study we used bioclimatic variables [33], due to their prompt availability as a collection in Google Earth Engine (Table 1).
Topographic parameters are key in describing species distribution across the landscape. This is relevant for Socotra, where physiography plays a key role in creating different microclimates across the island [5]. We used the Shuttle Radar Topography Mission (SRTM) digital elevation data, at a resolution of 1 arc-second (approximately 30 m), to derive slope, elevation, and aspect to be considered in the distribution model [34]. To complement the selected variables, three soil-related variables were included to evaluate their potential contribution to increase the model’s accuracy. Soil characteristics can also facilitate the stratification of potential restoration sites and allow for more tailored restoration practices and recommendations (Table 2).
In order to harmonize all environmental layers, we used bicubic interpolation neighbor embedding for interpolating data points to create a collection of “super high resolution” images for analysis (Supplementary Figure S1) [35]. This operation was performed using Google Earth Engine, and is available through the code in the Results section [36].

2.2. Data Analysis—Species Distribution

To model the potential distribution of Dracaena cinnabari on Socotra, we used Google Earth Engine to process the layers, create testing and training sample plots, train a Random Forest classifier, and display the accuracy and final results. Multicollinearity tests were performed using STATISTICA Version 12 [37].
Individual trees were identified using visual interpretation of satellite images, corrected with ground truthing, and then used to map the current distribution of Dracaena cinnabari on Socotra (Supplementary Figure S2) [6]. This database, containing 80,247 tree occurrences, was transformed into a categorical image of the presence and absence of Dracaena cinnabari trees [6]. The operation was performed applying a 100 m buffer from the tree location (presence = 1), and mapping the remaining pixels as zero (absence = 0).
First, a systematic grid of plots was created, spaced at 100 × 100 m from one another. These plots (368,707 in total) were exported from Google Earth Engine to be tested for multicollinearity (Table 3). This test of predicting variables was performed using tolerance and the variance inflation factor (VIF) [38,39,40,41,42].
Considering the above results and the ecological coherence of the variables, highly correlated variables and others with high VIF values (i.e., above 10) were discarded, prioritizing variables that are commonly recorded in weather stations and ensuring that both temperature and precipitation were considered in the final selection. Simulations with different variables and combinations were also performed to assist with variable selection. Upon selecting the variables (“bio01”, “bio04”, “bio15”, “cec”, “ph”, “dist”, “sand”, “slope”), another multicollinearity test was performed [42]. When considering only the selected variables, the multicollinearity was drastically reduced to values below VIF = 10 (Table 4).
Google Earth Engine was used to run a Random Forest (RF) classifier and test its accuracy in estimating the potential distribution of the species. 24,646 training plots were used for training and 10,524 plots for testing; 500 decision tree iterations were used in the training of the model.
The number of plots predicted by the classifier (RF) with presence from the training sample was 17,585, while the number of plots predicted with absence was 351,122. Previous studies found that RF improved its performance with balanced classes, and there was a relevant disproportion between the two classes, with the absence class being over-represented [43,44]. An under-sampling method was used to balance the datasets by limiting the number of absence plots as a function of the number of presence plots [45,46] and cross-validation was applied dividing the training and testing sample data into a 70:30 proportion, of which 70% were used to “train” the model (training data set) and the remaining 30% (validation data set) were used to evaluate its predictive capacity. According to the confusion matrix, reported in Table 5, the overall validation accuracy was 0.91.
The traditional metric of overall accuracy is no longer adequate for describing classifier performance [45,47]; therefore, the confusion matrix and its values were used to calculate some performance metrics. In the confusion matrix, the precision (TP/TP + FN) is the number of correctly-identified presence divided by the total number of times the model predicted presence, while the recall (TN/TN + FP) is the ratio of actual absence plots that were predicted incorrectly as presence. The results were precision = 0.87 and recall = 0.96. Therefore, in 87% of the cases, RF correctly predicts presence and in 96% of cases, it correctly predicted absence. Precision and recall cannot be high at the same time; if an optimization is performed on one, then the other will decrease. Therefore, when applying these metrics, we must choose which of them we want to be more precise.
For the objectives of this research a better prediction of true presence is a priority compared to the prediction of true absence, especially considering the difficulty of reaching some areas of the island. A high probability of success is required in order to efficiently allocate efforts and resources. A greater significance of precision is supported by the analysis of Peterson et al. [48], who states that “in a niche-modeling framework, a model that errors by omitting known points of presence is more seriously flawed than one that predicts areas not known to be inhabited”.
This is also the reason we decided to use precision and recall instead of specificity and sensitivity—two other performance metrics commonly used in studies on species distribution models [47]. Precision focuses on true presence, while it overlooks true absence.
Therefore, an 87% degree of correct predictions of true presence allows for a theoretical framework identifying the suitable areas for Dracaena reforestation projects; however, further experiments could be implemented with different sampling strategies [49], or different algorithms as also recommended by Qiao et al. [50], to obtain a higher precision value and consequently a better prediction capacity.

2.3. Data Analysis—Accessibility

In addition to the current Dracaena cinnabari distribution map, this study proposes an accessibility model focused on the locations of villages/settlements on Socotra which are relevant to help in choosing the most suitable restoration and conservation areas for these trees. With these two maps in hand, decision makers can start to plan interventions and investments for reforestation/conservation activities taking into consideration the metabolic energy cost for the land users.
For an accessibility map to be focused on the local human population, we first need to take into consideration how far the settlements are from other points of the island. The distance from settlements to other parts of the island in meters was calculated using recent available geolocation data of villages across the islands of Socotra (Vahalík et al., in preparation).
Similarly to Riccardi et al. [51], we developed an accessibility model focused on the location of villages/settlements on Socotra to identify the areas most suitable for reforestation/conservation actions. Even though we are aware that not all villages/settlements are occupied throughout the year and that local people often move from and to different areas for part of the year, we considered the maximal potential occupancy of villages at this point in time. First, the distance from settlements to other parts of the island, in meters, was calculated (Supplementary Figure S3).
Considering the trade-offs in place regarding the time available to allocate for restoration efforts, we can assume that land users weigh the costs of accessing a site based on the distance from their household. Any restoration activity must rely on the contribution of its surrounding communities to achieve success. This can be in the form of active contribution—such as tree planting and maintenance, improved management practices, degradation controls, etc.—or indirectly—for example, the exclusion of livestock and people through fencing. Aside from distance, terrain ruggedness is also a discouraging factor for moving through a landscape. In order to account for this factor, a metabolic energy cost image was created based on slope.
Slope and its links to the energy required to move have been extensively researched [52,53,54]. In this study, we used an equation proposed by Minetti et al. [54] to relate the metabolic energy cost of walking to slope, as follows:
Cw = 280.5 m5 − 58.7 m4 − 76.8 m3 + 51.9 m2 + 19.6 m + 2.5
where m is the slope and Cw (J⋅kg−1⋅m−1) is the energy cost of moving one unit of mass a horizontal distance equivalent to one unit of vertical displacement. Notice that due to the polynomial formulation, this equation is valid for a range of slopes approximately between −0.5 and 0.5, outside of which the behavior of the function becomes counterintuitive [55]. The above approach was implemented using Google Earth Engine for image processing and SRTM as the base elevation model for the calculation of slope (resampled) (Supplementary Figure S1).
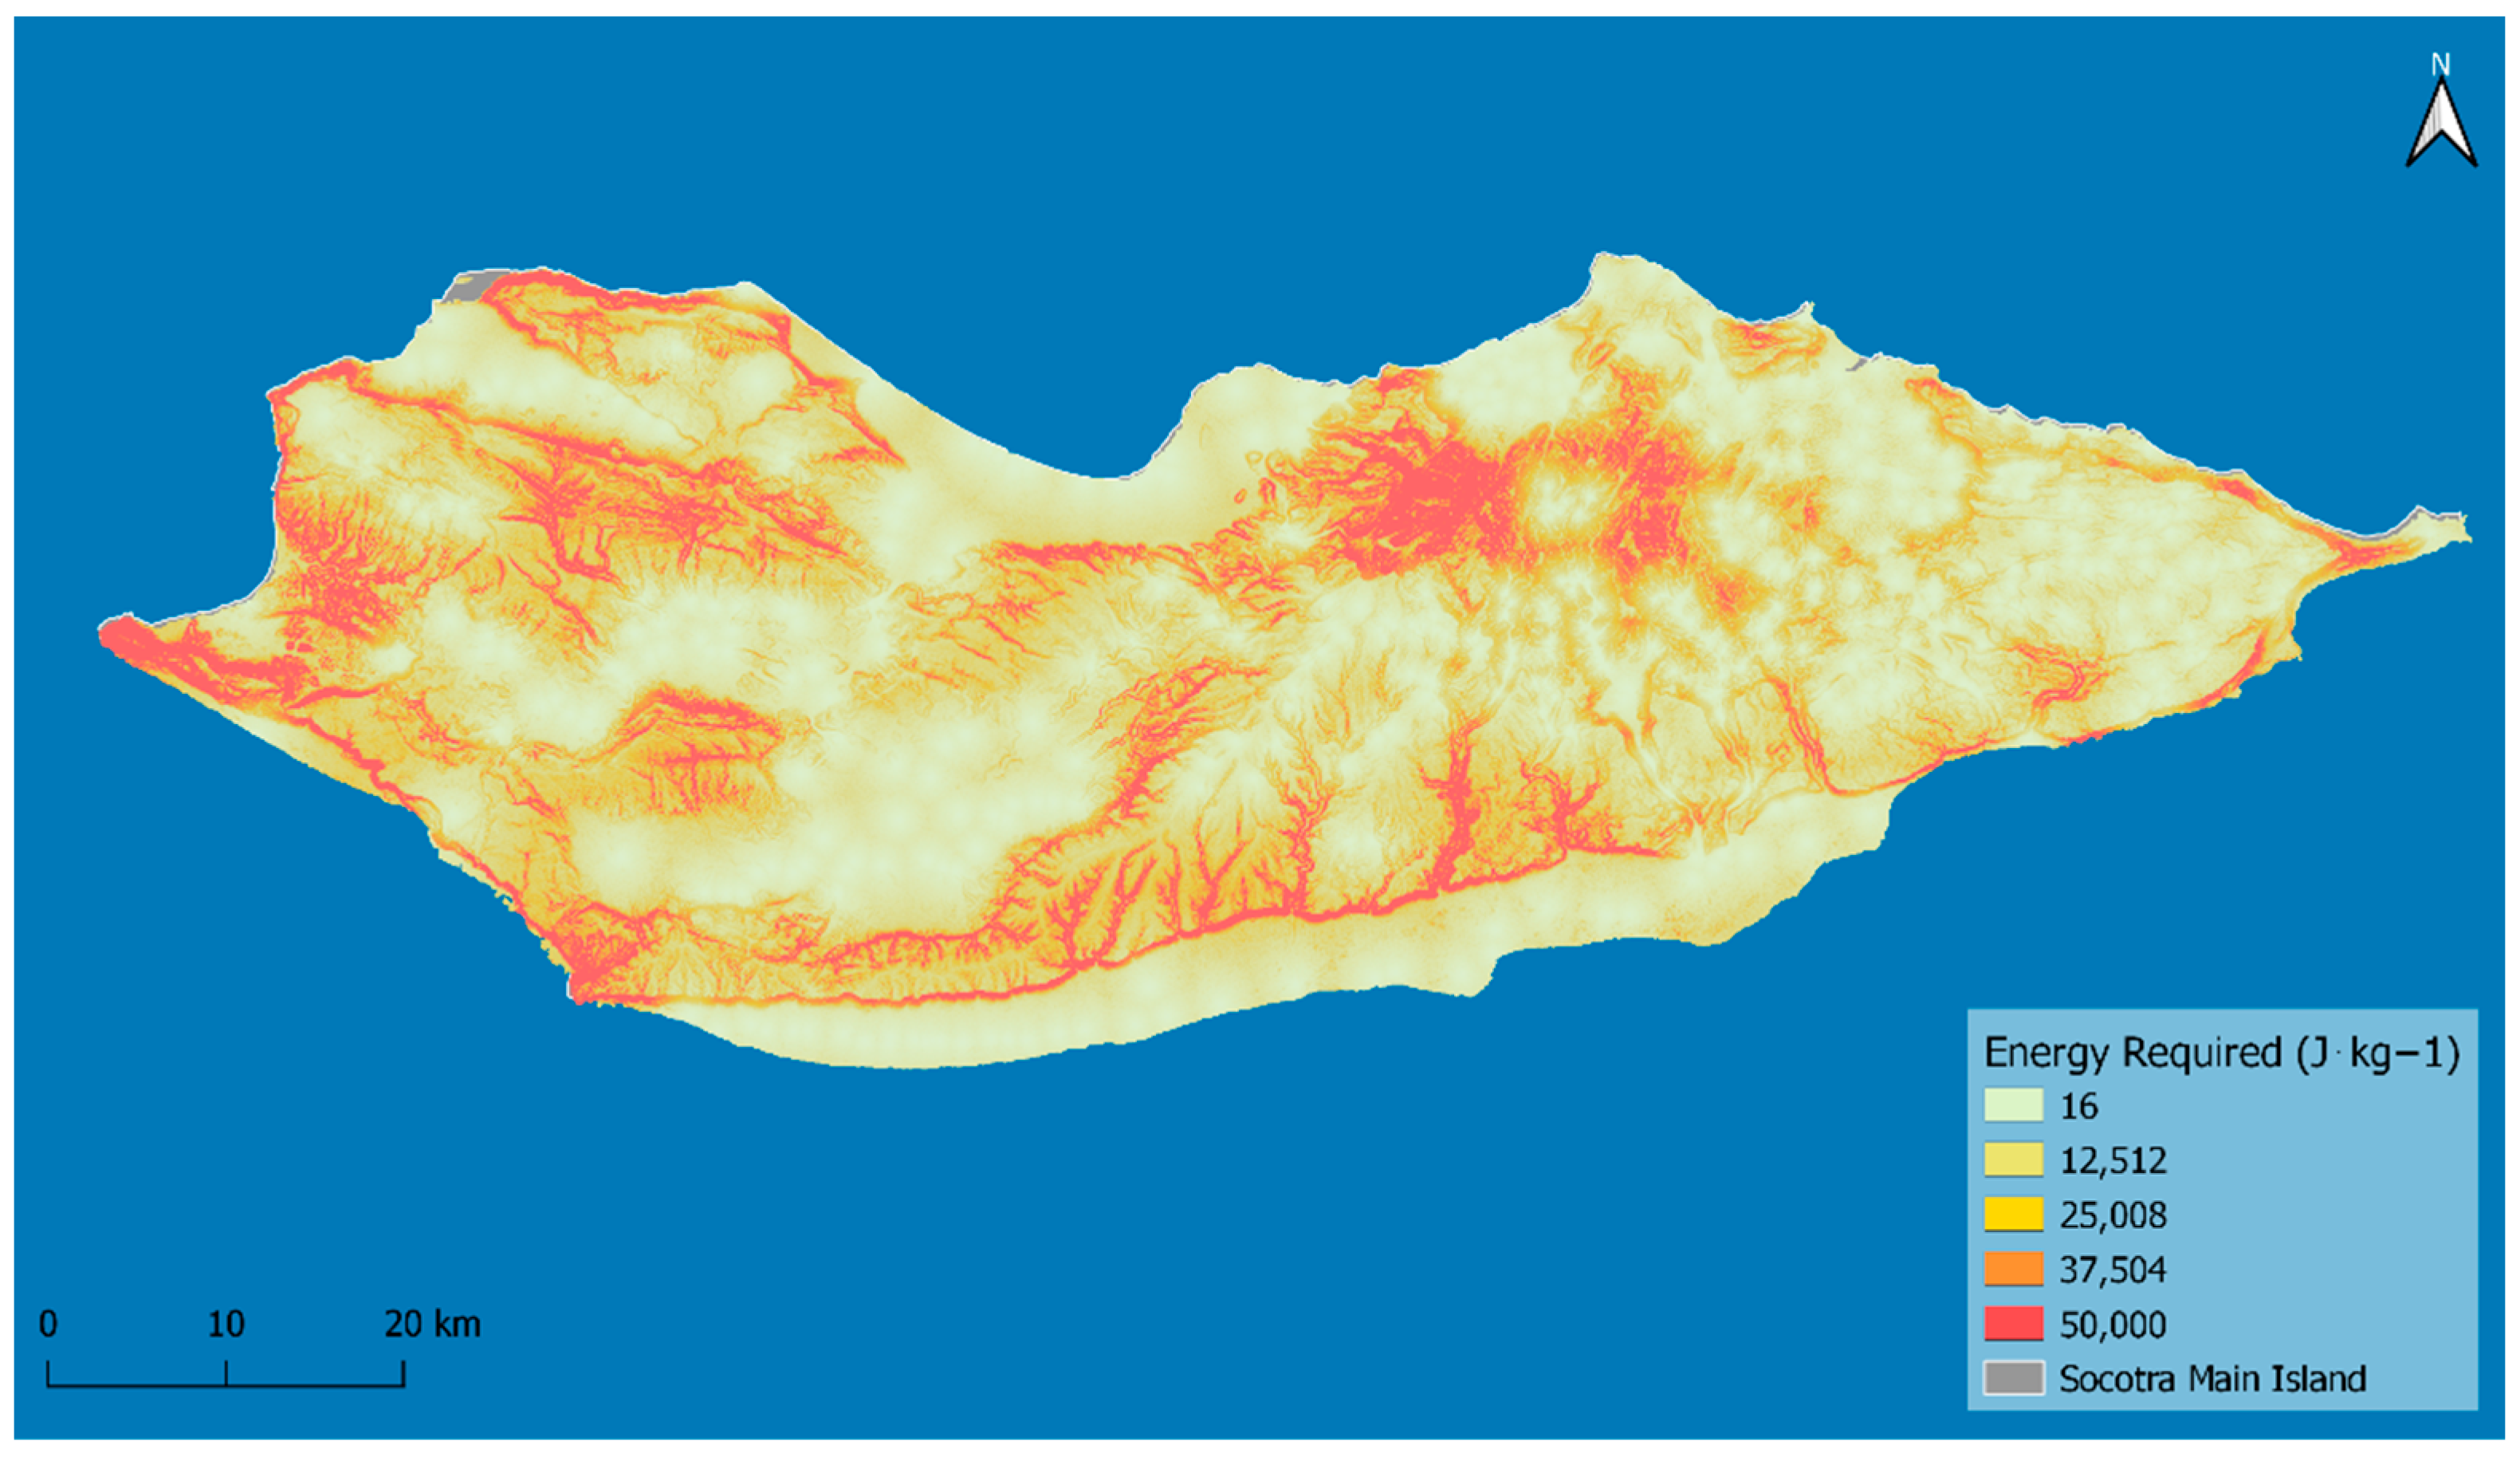
Multiplying the distance to settlements by the metabolic energy cost (Supplementary Figure S4), we estimate the energy required for moving one unit of mass (1 kg) outwards from the settlements’ center points. We assume that the higher the energy required to access an area, the lower the probability of community individuals commuting to it for reforestation and ecological restoration purposes (Figure 1).
The areas of Socotra with the highest energy requirement for the local populations to access are the Hageher Mountains, the escarpments along the southern part of the island, and the rugged mountain ranges in the west of the island. Flat areas both on the coast and inland, where many population centers are found, have the estimated lowest energy requirements to access.

3. Results

Random Forest proved to be an efficient classifier, with an overall validation accuracy of 0.91. Among the predictors, pH was identified as the most important, followed by the precipitation of the wettest quarter, maximum temperature of the warmest month, annual mean temperature, cation exchange capacity, sand content, and slope (Table 6).
The area where Dracaena cinnabari can potentially occur is over 25% of the total area of the island (Figure 2). The potential distribution of Dragon’s blood trees overlaps with more than 80 settlement locations.
By overlapping the potential distribution map (Figure 2) with that of accessibility from villages calculated as the energy requirement (Figure 1), a map of suitability/accessibility for Dracaena cinnabari was produced (Figure 3).
The most suitable areas for theoretical community-driven ecological restoration and reforestation interventions for Dracaena cinnabari are shown in Figure 3. Notice that although the island has vast areas of easy accessibility (Figure 1, white to yellow colors), the average energy required to access areas where our modeling indicates the potential for Dracaena cinnabari distribution is 20% higher than that of the total island area. This is due to the overall physiography of the landscape (mainly steep valleys, gorges, cliffs and the Hageher Mountains), coupled with fewer and more disperse settlements.

4. Discussion

4.1. Why Attempt Reforestation of Socotran Dragon’s Blood Trees?

Based on circumstantial evidence, the forests of Dragon Blood trees in the island were most likely distributed over a substantially larger area in the past [13,56]. The decline of D. cinnabari forests can be attributed to the combination of long-term harvesting of resin [4], rapid growth of the human population on Socotra after the Second World War (resulting in land-use changes), and the effects of current climate change [3,13]. Using niche modelling, Attorre et al. [13] developed a first model of the potential distribution of this species, which extends far beyond its current distribution. Some areas currently without these trees are areas of potential previous occurrence according to a survey using phytotoponyms [56]. Our model of the potential distribution of Dracaena on Socotra shows a relatively smaller area than the first one published by Attorre et al. [13], possibly due to the input of different and updated parameters. In addition, it is also possible that global climate change resulted in the input of different climate characteristics as the models were updated. Reforestation is a major strategy to stop the decline of the tree population to avoid the risk of extinction of this endemic species.
Moreover, these trees play an important ecological role for the entire island. This tree species helps to maintain biodiversity, has broad ethnobotanical uses and, as a part of cloud forests brings huge input of water for the hydrogeological cycle of Socotra [5,18,57]. The unique umbrella-shape of the crown constitutes a fundamental natural system that traps humidity brought by the ocean breeze and helps recharge the shallow aquifers of the island [18]. Therefore, the disappearance of these dragon’s blood trees would have a significant impact on the freshwater resources [18], biodiversity [58], and touristic attractiveness of Socotra [30], in addition to the potential loss of key human–nature linkages that the island is known for.
The major cause of the decline of these trees is the absence of natural regeneration due to overgrazing, resulting in an unbalanced age structure of the entire population [6,8,9]. Without regeneration the forest decline will continue towards global extinction through the gradual disappearance of local subpopulations [6,16].

4.2. Suitability Models

Suitability models are becoming widely used to guide and support conservation and reforestation programs targeting endangered tree species. These models are particularly relevant when considering the current and future impacts of climate change [59,60,61,62]. However, when such models include the involvement of local communities for their implementation, an estimation of the accessibility of suitable areas must be considered. In this study, we applied an approach similar to that of Riccardi et al. [51], based on an assessment of the energy required to access an area from the surrounding villages (Figure 1). Based on the model, about 25% of Socotra is potentially suitable for Dracaena cinnabari (Figure 2), but the accessibility varies greatly depending on the slope and distance from settlements (Figure 3).

4.3. Reforestation and Conservation Programs

Intense reforestation programs, using a community forestry approach in the most accessible areas, should be urgently implemented based on the findings of exclosure experiments, which have already been established in several areas on the island [6,12,26]. Considering time that it takes for these trees to escape browsing risk from goats, care by local communities is a long-term commitment (of several decades, or perhaps even a century) [12]. Different methods must be applied to protect natural regeneration, as well as seedlings produced in local nurseries, until these plants can escape the browsing zone and the effects of drought [12,26,31]. These methods include fences, agroforestry, individual protection, walling, and watering, but potentially also other approaches assisting natural regeneration and, above all, long-term community involvement [63,64].
Conversely, in less accessible areas, such as the Hageher Mountains, which were already considered a potential refugium of Dracaena cinnabari [5,13], strict conservation measures would be best put in place together with the revision of the Socotra Conservation Zoning Plan [31] to enlarge the boundaries of the nature sanctuaries and include all of the remaining dragon tree forests on the island. Based on the Socotra Conservation Zoning Plan, it is important to enable local communities to participate in the development and implementation of such management plans to foster ownership and secure sustainability of the interventions [65].

5. Conclusions

Dracaena cinnabari is experiencing a fast change related to ecosystem dynamics, and recent studies have predicted its extinction if the current trends are not reversed. This methodology seeks to enhance science-based approaches to improve the selection of areas for restoration and conservation of Dracaena cinnabari, with a strong focus on community engagement and participatory processes.

Supplementary Materials

The following supporting information can be downloaded at: https://www.mdpi.com/article/10.3390/f13081276/s1, Figure S1. Slope imagery showing (a) the original layer (slope with a resolution of 30 m [66]); (b) high-resolution image of the area [67]; (c) resampled slope image applying a bicubic interpolation function in Google Earth Engine. See the Supplementary Materials section for an interactive geoportal. Figure S2. Current distribution of Dracaena cinnabari in Socotra, based on [6]. Figure S3. Relative distance from human settlements (blue = close to settlement, orange = far from settlements), modified based on [51]. Figure S4. Metabolic energy cost (J⋅kg−1⋅m−1) for land users on the island of Socotra, based on slope.

Author Contributions

Conceptualization, M.R., F.A., P.M. and K.V.D.; methodology, M.R., T.R., P.V. and L.M.; software, M.R. and G.S.; validation, M.R., P.M. and K.V.D.; formal analysis, M.R., F.A. and L.M.; investigation, M.R., K.V.D., H.H. and P.M.; resources, M.R., H.H., P.V. and P.M.; data curation, M.R. and P.V.; writing—original draft preparation, M.R., F.A. and P.M.; writing—review and editing, M.R., K.V.D., M.D.S., F.A. and L.M.; visualization, M.R.; supervision, F.A., P.M. and K.V.D.; project administration, F.A., P.M. and K.V.D.; funding acquisition, F.A. and P.M. All authors have read and agreed to the published version of the manuscript.

Funding

This research was partly funded by the Franklinia Foundation (2020–2023) “Conservation of the endangered endemic Boswellia trees on Socotra Island (Yemen)”, grant number 2020-03.

Informed Consent Statement

Informed consent was obtained from all subjects involved in the study.

Data Availability Statement

The datasets used in this study can be accessed directly in Google Earth Engine, available at https://developers.google.com/earth-engine/datasets/ (accessed on 10 August 2022). Settlement locations used in the study are not yet publicly available.

Conflicts of Interest

The authors declare no conflict of interest.

References

  1. Marrero, A.; Almeida, S.R.; Martín-González, M. A new species of the wild dragon tree, Dracaena (Dracaenaceae) from Gran Canaria and its taxonomic and biogeographic implications. Bot. J. Linn. Soc. 1998, 128, 291–314. [Google Scholar] [CrossRef]
  2. Govaerts, R.; Zonneveld, B.J.M.; Zona, S.A. World checklist of Asparagaceae. Facilitated by the Royal Botanic Gardens, Kew. Available online: http://apps.kew.org/wcsp/ (accessed on 4 November 2021).
  3. Maděra, P.; Forrest, A.; Hanáček, P.; Vahalík, P.; Gebauer, R.; Plichta, R.; Jupa, R.; Van Rensburg, J.J.; Morris, M.; Nadezhdina, N.; et al. What We Know and What We Do Not Know about Dragon Trees? Forests 2020, 11, 236. [Google Scholar] [CrossRef]
  4. Al-Okaishi, A. Local Management System of Dragon’s Blood Tree (Dracaena cinnabari Balf. f.) Resin in Firmihin Forest, Socotra Island, Yemen. Forests 2020, 11, 389. [Google Scholar] [CrossRef]
  5. Miller, A.G.; Morris, M.; Diccon, A.; Atkinson, R. Ethnoflora of the Soqotra Archipelago, 1st ed.; Royal Botanic Garden: Edinburgh, UK, 2004; p. 759.
  6. Maděra, P.; Volařík, D.; Patočka, Z.; Kalivodová, H.; Divín, J.; Rejžek, M.; Vybíral, J.; Lvončík, S.; Jeník, D.; Hanáček, P.; et al. Sustainable Land Use Management Needed to Conserve the Dragon’s Blood Tree of Socotra Island, a Vulnerable Endemic Umbrella Species. Sustainability 2019, 11, 3557. [Google Scholar] [CrossRef]
  7. Adolt, R.; Habrova, H.; Madera, P. Crown age estimation of a monocotyledonous tree species Dracaena cinnabari using logistic regression. Trees-Struct. Funct. 2012, 26, 1287–1298. [Google Scholar] [CrossRef]
  8. Adolt, R.; Maděra, P.; Abraham, J.; Čupa, P.; Svátek, M.; Matula, R.; Šebesta, J.; Čermák, M.; Volařík, D.; Koutecký, T.; et al. Field Survey of Dracaena cinnabari Populations in Firmihin, Socotra Island: Methodology and Preliminary Results. J. Landsc. Ecol. 2013, 6, 7–34. [Google Scholar] [CrossRef]
  9. Adolt, R.; Pavlis, J. Age structure and growth of Dracaena cinnabari populations on Socotra. Trees-Struct. Funct. 2004, 18, 43–53. [Google Scholar] [CrossRef]
  10. Hubálková, I.; Maděra, P.; Volařík, D. Growth dynamics of Dracaena cinnabari under controlled conditions as the most effective way to protect endangered species. Saudi J. Biol. Sci. 2017, 24, 1445–1452. [Google Scholar] [CrossRef]
  11. Maděra, P.; Habrová, H.; Čermák, M.; Adolt, R.; Volařík, D. Age estimation of juvenile stages of Dracaena cinnabari Balf. F., the last stone in the mosaic of knowing its lifespan. Rend. Lincei Sci. Fis. Nat. 2020, 31, 677–686. [Google Scholar] [CrossRef]
  12. Maděra, P.; Habrová, H.; Šenfeldr, M.; Kholová, I.; Lvončík, S.; Ehrenbergerová, L.; Roth, M.; Nadezhdina, N.; Němec, P.; Rosenthal, J.; et al. Growth dynamics of endemic Dracaena cinnabari Balf. f. of Socotra Island suggest essential elements for a conservation strategy. Biologia 2019, 74, 339–349. [Google Scholar] [CrossRef]
  13. Attorre, F.; Francesconi, F.; Taleb, N.; Scholte, P.; Saed, A.; Alfo, M.; Bruno, F. Will dragonblood survive the next period of climate change? Current and future potential distribution of Dracaena cinnabari (Socotra, Yemen). Biol. Conserv. 2007, 138, 430–439. [Google Scholar] [CrossRef]
  14. Miller, A. Dracaena cinnabari. The IUCN Red List of Threatened Species 2004: E.T30428A9548491. Available online: https://www.iucnredlist.org/species/30428/9548491 (accessed on 18 November 2021). [CrossRef]
  15. Habrova, H.; Cermak, Z.; Pavlis, J. Dragon’s blood tree–Threatened by overmaturity, not by extinction: Dynamics of a Dracaena cinnabari woodland in the mountains of Soqotra. Biol. Conserv. 2009, 142, 772–778. [Google Scholar] [CrossRef]
  16. Hubálková, I. Prediction of Dragon’s Blood Tree (Dracaena cinnabari Balf.) Stand Sample Density on Soqotra Island. J. Landsc. Ecol. 2011, 4, 5–17. [Google Scholar] [CrossRef]
  17. Rejžek, M.; Svátek, M.; Šebesta, J.; Adolt, R.; Maděra, P.; Matula, R. Loss of a single tree species will lead to an overall decline in plant diversity: Effect of Dracaena cinnabari Balf. f. on the vegetation of Socotra Island. Biol. Conserv. 2016, 196, 165–172. [Google Scholar] [CrossRef]
  18. Kalivodová, H.; Culek, M.; Čermák, M.; Maděra, P.; Habrová, H. Potential importance of Socotra dragon’s blood tree cloud forests and woodlands for capturing horizontal precipitation. Rend. Lincei Sci. Fis. Nat. 2020, 31, 607–621. [Google Scholar] [CrossRef]
  19. Nadezhdina, N.; Al-Okaishi, A.; Madera, P. Sap Flow Measurements in a Socotra Dragon’s Blood Tree (Dracaena cinnabari) in its Area of Origin. Trop. Plant Biol. 2018, 11, 107–118. [Google Scholar] [CrossRef]
  20. Almeida Pérez, R.S. Dracaena draco (L.) L. In Atlas y Libro Rojo de la Flora Vascular Amenazada de España, 2nd ed.; Bañares, A., Blanca, G., Güemes, J., Moreno, J.C., Ortiz, S., Eds.; Publicaciones de O.A.P.N.: Madrid, Spain, 2004; pp. 680–681. [Google Scholar]
  21. Andersen, G.L.; Krzywinski, K.; Talib, M.; Musa, M.A.M. Endangered Dracaena ombet Population in the Red Sea Hills, Sudan, Recovers After Abrupt Change. Front. Environ. Sci. 2022, 10, 793583. [Google Scholar] [CrossRef]
  22. Bari, E. Sudan Conservation of Vegetation in Africa South of the Sahara. Acta Phytogeogr. Suec. 1968, 54, 59–64. [Google Scholar]
  23. Elnoby, S.K.; Moustafa, A.A.; Mansour, S.R. Impact of climate change on the endangered Nubian dragon tree (Dracaena ombet) in the South Eastern of Egypt. Catrina 2017, 16, 23–28. [Google Scholar] [CrossRef]
  24. Ghazaly, U. Effect of Climatic Change on the endangered Dracaena ombet tree in the Gabel Elba Protected Area in Egypt. Mt. Forum Bull. 2008, VIII, 11–12. [Google Scholar]
  25. Kamel, M.; Ghazaly, U.M.; Callmander, M.W. Conservation status of the Endangered Nubian dragon tree Dracaena ombet in Gebel Elba National Park, Egypt. Oryx 2015, 49, 704–709. [Google Scholar] [CrossRef]
  26. Habrova, H.; Pavlis, J. Dynamic response of woody vegetation on fencing protection in semi-arid areas; Case study: Pilot exclosure on the Firmihin Plateau, Socotra Island. Saudi J. Biol. Sci. 2017, 24, 338–346. [Google Scholar] [CrossRef] [PubMed]
  27. Marrero, A.; Almeida, R.S.; Roca, A. Diáspora y rescate: Acciones para la conservación del Drago de Gran Canaria, Dracaena tamaranae. In Proceedings of the V Congreso de Biología de la Conservación de Plantas, Minorca, Spain, 28 September–1 October 2011; Available online: https://www.researchgate.net/profile/Rafael-S-Perez/publication/270822517_Diaspora_y_rescate_acciones_para_la_conservacion_del_drago_de_Gran_Canaria_Dracaena_tamaranae/links/54b58bbf0cf28ebe92e7913f/Diaspora-y-rescate-acciones-para-la-conservacion-del-drago-de-Gran-Canaria-Dracaena-tamaranae.pdf (accessed on 1 January 2022).
  28. Almeida Pérez, R.S. Sobre la presencia de Dracaena draco (L.) L. En Gran Canaria (Islas Canarias): Aportación corológica, estado actual y significación biogeográfica. Bot. Macarónesica 2003, 24, 17–38. [Google Scholar]
  29. Marrero, A.; Almeida, S.R. A new subspecies, Dracaena draco (L.) L. subsp. caboverdeana Marrero Rodr. & R. Almeida (Dracaenaceae) from Cape Verde Islands. Int. J. Geobot. Res. 2012, 2, 35–40. [Google Scholar] [CrossRef]
  30. Attorre, F.; Van Damme, K. Twenty years of biodiversity research and nature conservation in the Socotra Archipelago (Yemen). Rend. Fis. Acc. Lincei 2020, 31, 563–569. [Google Scholar] [CrossRef]
  31. Van Damme, K.; Banfield, L. Past and present human impacts on the biodiversity of Socotra Island (Yemen): Implications for future conservation. Zoöl. Middle East 2011, 54, 31–88. [Google Scholar] [CrossRef]
  32. Agrillo, E.; Filipponi, F.; Pezzarossa, A.; Casella, L.; Smiraglia, D.; Orasi, A.; Attorre, F.; Taramelli, A. Earth Observation and Biodiversity Big Data for Forest Habitat Types Classification and Mapping. Remote Sens. 2021, 13, 1231. [Google Scholar] [CrossRef]
  33. Hijmans, R.J.; Cameron, S.E.; Parra, J.L.; Jones, P.G.; Jarvis, A. Very high resolution interpolated climate surfaces for global land areas. Int. J. Climatol. 2005, 25, 1965–1978. [Google Scholar] [CrossRef]
  34. Farr, T.G.; Rosen, P.A.; Caro, E.; Crippen, R.; Duren, R.; Hensley, S.; Kobrick, M.; Paller, M.; Rodriguez, E.; Roth, L.; et al. The Shuttle Radar Topography Mission. Rev. Geophys. 2007, 45, RG2004. [Google Scholar] [CrossRef]
  35. Chang, H.; Yeung, D.-Y.; Xiong, Y. Super-resolution through neighbor embedding. In Proceedings of the 2004 IEEE Computer Society Conference on Computer Vision and Pattern Recognition, Washington, DC, USA, 27 June–2 July 2004; Volume 1. [Google Scholar] [CrossRef]
  36. Gorelick, N.; Hancher, M.; Dixon, M.; Ilyushchenko, S.; Thau, D.; Moore, R. Google Earth Engine: Planetary-scale geospatial analysis for everyone. Remote Sens. Environ. 2017, 202, 18–27. [Google Scholar] [CrossRef]
  37. Weiß, C.H. StatSoft, Inc., Tulsa, OK.: STATISTICA, Version 8. AStA Adv. Stat. Anal. 2007, 91, 339–341. [Google Scholar] [CrossRef]
  38. Belsley, D.A. Conditioning Diagnostics: Collinearity and Weak Data Regression, 1st ed.; Wiley-Interscience: Baltimore, MD, USA, 1991; p. 396. [Google Scholar] [CrossRef]
  39. Craney, T.A.; Surles, J.G. Model-Dependent Variance Inflation Factor Cutoff Values. Qual. Eng. 2002, 14, 391–403. [Google Scholar] [CrossRef]
  40. Etikan, I.; Kabiru, B. Sampling and Sampling Methods. Biom. Biostat. Int. J. 2017, 5, 00149. [Google Scholar] [CrossRef]
  41. Hair, J.F. Multivariate Data Analysis with Readings, 4th ed.; Prentice Hall: Englewood Cliffs, NJ, USA, 1995; pp. 352–389. [Google Scholar]
  42. Tay, R. Correlation, variance inflation and multicollinearity in regression model. J. East. Asia Soc. Transp. Stud. 2017, 12, 2006–2015. [Google Scholar]
  43. Barbet-Massin, M.; Jiguet, F.; Albert, C.H.; Thuiller, W. Selecting pseudo-absences for species distribution models: How, where and how many? Methods Ecol. Evol. 2012, 3, 327–338. [Google Scholar] [CrossRef]
  44. Liu, C.; Newell, G.; White, M. The effect of sample size on the accuracy of species distribution models: Considering both presences and pseudo-absences or background sites. Ecography 2019, 42, 535–548. [Google Scholar] [CrossRef]
  45. Ali, A.; Shamsuddin, S.M.; Ralescu, A.L. Classification with class imbalance problem. Int. J. Adv. Soft Compu. Appl. 2013, 5, 3. [Google Scholar]
  46. Wisz, M.S.; Hijmans, R.J.; Li, J.; Peterson, A.T.; Graham, C.H.; Guisan, A.; NCEAS Predicting Species Distributions Working Group. Effects of sample size on the performance of species distribution models. Divers. Distrib. 2008, 14, 763–773. [Google Scholar] [CrossRef]
  47. Chawla, N.V.; Japkowicz, N.; Kotcz, A. Special issue on learning from imbalanced data sets. ACM SIGKDD Explor. 2004, 6, 1–6. [Google Scholar] [CrossRef]
  48. Peterson, A.T.; Papeş, M.; Soberón, J. Rethinking receiver operating characteristic analysis applications in ecological niche modeling. Ecol. Model. 2008, 213, 63–72. [Google Scholar] [CrossRef]
  49. Grimmett, L.; Whitsed, R.; Horta, A. Presence-only species distribution models are sensitive to sample prevalence: Evaluating models using spatial prediction stability and accuracy metrics. Ecol. Model. 2020, 431, 109194. [Google Scholar] [CrossRef]
  50. Qiao, H.; Soberon, J.; Peterson, A.T. No silver bullets in correlative ecological niche modelling: Insights from testing among many potential algorithms for niche estimation. Methods Ecol. Evol. 2015, 6, 1126–1136. [Google Scholar] [CrossRef]
  51. Riccardi, T.; Malatesta, L.; Van Damme, K.; Suleiman, A.S.; Farcomeni, A.; Rezende, M.; Vahalík, P.; Attorre, F. Environmental factors and human activity as drivers of tree cover and density on the Island of Socotra, Yemen. Rend. Lincei Sci. Fis. Nat. 2020, 31, 703–718. [Google Scholar] [CrossRef]
  52. Bobbert, A.C. Energy expenditure in level and grade walking. J. Appl. Physiol. 1960, 15, 1015–1021. [Google Scholar] [CrossRef]
  53. Marcaria, R. Sulla fisiologia e specialmente sul consumo energetico della marcia e della corsa a varie velocita ed inclinazioni del terreno. Atti Accad. Naz. Lincei Mem. Cl. Sci. Fis. Mat. Nat. Sez 1938, 3, 299–368. [Google Scholar]
  54. Minetti, A.E.; Moia, C.; Roi, G.S.; Susta, D.; Ferretti, G. Energy cost of walking and running at extreme uphill and downhill slopes. J. Appl. Physiol. 2002, 93, 1039–1046. [Google Scholar] [CrossRef]
  55. Páez, A.; Anjum, Z.; Dickson-Anderson, S.E.; Schuster-Wallace, C.J.; Ramos, B.M.; Higgins, C.D. Comparing distance, time, and metabolic energy cost functions for walking accessibility in infrastructure-poor regions. J. Transp. Geogr. 2020, 82, 102564. [Google Scholar] [CrossRef]
  56. Al-Okaishi, A. Exploring the historical distribution of Dracaena cinnabari using ethnobotanical knowledge on Socotra Island, Yemen. J. Ethnobiol. Ethnomed. 2021, 17, 22. [Google Scholar] [CrossRef]
  57. Mies, B.A.; Beyhl, F.E. The vegetation ecology of Soqotra. In Conservation and Sustainable Use of Biodiversity of Soqotra Archipelago, Proceedings of the First International Symposium on Soqotra Island: Present and Future, Aden, Yemen, 24–28 March 1996; Dumont, H., Ed.; UNEP/GEF Publications: New York, NY, USA, 1998; Technical Series; Volume 1, pp. 35–81. [Google Scholar]
  58. Vasconcelos, R.; Pujol-Buxó, E.; Llorente, G.A.; Saeed, A.; Carranza, S. Micro-Hotspots for Conservation: An Umbrella Tree Species for the Unique Socotran Reptile Fauna. Forests 2020, 11, 353. [Google Scholar] [CrossRef]
  59. Hu, W.; Wang, Y.; Dong, P.; Zhang, D.; Yu, W.; Ma, Z.; Chen, G.; Liu, Z.; Du, J.; Chen, B.; et al. Predicting potential mangrove distributions at the global northern distribution margin using an ecological niche model: Determining conservation and reforestation involvement. For. Ecol. Manag. 2020, 478, 118517. [Google Scholar] [CrossRef]
  60. Jensen, D.A.; Rao, M.; Zhang, J.; Grøn, M.; Tian, S.; Ma, K.; Svenning, J.-C. The potential for using rare, native species in reforestation–A case study of yews (Taxaceae) in China. For. Ecol. Manag. 2021, 482, 118816. [Google Scholar] [CrossRef]
  61. López-Tirado, J.; Vessella, F.; Schirone, B.; Hidalgo, P.J. Trends in evergreen oak suitability from assembled species distribution models: Assessing climate change in south-western Europe. New For. 2018, 49, 471–487. [Google Scholar] [CrossRef]
  62. Mateo, R.G.; Gastón, A.; Aroca-Fernández, M.J.; Broennimann, O.; Guisan, A.; Saura, S.; García-Viñas, J.I. Hierarchical species distribution models in support of vegetation conservation at the landscape scale. J. Veg. Sci. 2019, 30, 386–396. [Google Scholar] [CrossRef]
  63. Gornish, E.; Arnold, H.; Fehmi, J. Review of seed pelletizing strategies for arid land restoration. Restor. Ecol. 2019, 27, 1206–1211. [Google Scholar] [CrossRef]
  64. Moore, M.-L.; Riddell, D.; Vocisano, D. Scaling Out, Scaling Up, Scaling Deep: Strategies of Non-profits in Advancing Systemic Social Innovation. J. Corp. Citizsh. 2015, 1, 67–84. [Google Scholar] [CrossRef]
  65. Campos-Silva, J.V.; Hawes, J.E.; Freitas, C.T.; Andrade, P.C.M.; Peres, C.A. Community-Based Management of Amazonian Biodiversity Assets. In Participatory Biodiversity Conservation: Concepts, Experiences, and Perspectives; Springer: Cham, Switzerland, 2020; pp. 99–111. [Google Scholar] [CrossRef]
  66. Jarvis, A.; Reuter, H.I.; Nelson, A.; Guevara, E. Hole-Filled SRTM for the Globe Version 4: Data Grid. CGIAR Consortium for Spatial Information. 2008. Available online: http://srtm.csi.cgiar.org (accessed on 10 May 2022).
  67. Google Maps. Available online: https://www.google.com/maps/place/12%C2%B023’31.4%22N+53%C2%B059’56.1%22E/@12.3917117,53.9986001,1078m/data=!3m1!1e3!4m6!3m5!1s0x0:0x4564d658ba0e9d14!7e2!8m2!3d12.3920582!4d53.9989207 (accessed on 27 May 2021).
Figure 1. Accessibility map using energy requirement (J⋅kg−1) to access different areas of the island of Socotra.
Forests 13 01276 g001
Figure 2. Potential distribution of Dracaena cinnabari (green: presence) on Socotra (Yemen), using the parameters considered in this study.
Forests 13 01276 g002
Figure 3. Energy requirement (J⋅kg−1) within the potential distribution of Dracaena cinnabari, with warmer colors indicating relatively higher energy needed to reach the areas.
Forests 13 01276 g003
Table 1. Bioclimatic variables [33] considered in this study (if scale values equal zero, it indicates that no conversion is applied to the pixel value).
BandsDescriptionUnitScale
bio01Annual mean temperature°C0.1
bio02Mean diurnal range (mean of monthly (max–min temperature))°C0.1
bio03Isothermality (bio02/bio07)%0
bio04Temperature seasonality (standard deviation × 100)°C0.01
bio05Max temperature of warmest month°C0.1
bio06Min temperature of coldest month°C0.1
bio07Annual temperature range (bio05–bio06)°C0.1
bio08Mean temperature of wettest quarter°C0.1
bio09Mean temperature of driest quarter°C0.1
bio10Mean temperature of warmest quarter°C0.1
bio11Mean temperature of coldest quarter°C0.1
bio12Annual precipitationmm0
bio13Precipitation of wettest monthmm0
bio14Precipitation of driest monthmm0
bio15Precipitation seasonality (coefficient of variation)CoV0
bio16Precipitation of wettest quartermm0
bio17Precipitation of driest quartermm0
bio18Precipitation of warmest quartermm0
bio19Precipitation of coldest quartermm0
Table 2. Soil-related variables considered in this study.
BandsDescriptionUnitScale
CECCation-exchange capacity (at pH 7) (0–5 cm depth)mmol(c)/kg0.1
pHPotential of hydrogen (0–5 cm depth)pH*100.1
SandSand content (0–5 cm depth)g/kg0
Table 3. Multicollinearity test results, including tolerance, variance, and R-squared.
VariablesDescriptionToleranceVarianceR-Squared
AspectAspect0.98252471.01780.0174753
“bio01”Annual mean temperature0.00044002272.77890.9995600
“bio02”Mean diurnal range 0.0073897135.32310.9926103
“bio03”Isothermality (bio02/bio07)0.074273913.46370.9257261
“bio04”Max temperature of warmest month0.11347178.81280.8865283
“bio05”Min temperature of coldest month0.00063091585.00280.9993691
“bio06”Annual temperature range (bio05-bio06)0.00035362827.84920.9996464
“bio07”Mean temperature of wettest quarter0.0000000
“bio08”Mean temperature of driest quarter0.00049682012.95370.9995032
“bio09”Mean temperature of warmest quarter0.00041512408.81490.9995849
“bio10”Mean temperature of coldest quarter0.0000000
“bio11”Annual precipitation0.00035222839.05790.9996478
“bio12”Precipitation of wettest month0.0016195617.49250.9983805
“bio13”Precipitation of driest month0.0054004185.17130.9945996
“bio14”Precipitation seasonality0.064989815.38700.9350102
“bio15”Precipitation of wettest quarter0.089789111.13720.9102109
“bio16”Precipitation of driest quarter0.0016349611.67590.9983651
“bio17”Precipitation of warmest quarter0.012951477.21160.9870486
“bio18”Precipitation of coldest quarter0.0000000
“bio19”Precipitation of coldest quarter0.0026119382.86490.9973881
CECCation-exchange capacity0.22324784.47930.7767522
pH 0.10144279.85780.8985573
SandSand content0.13517827.39760.8648218
Slope 0.84710801.18050.1528920
Table 4. Multicollinearity test of preselected variables [38].
BandsDescriptionToleranceVarianceR-Squared
“bio01”Annual mean temperature0.43170742.31638370.5682926
“bio04”Max temperature of warmest month0.47341762.11230020.5265824
“bio15”Precipitation of wettest quarter0.26251593.80929300.7374841
CECCation-exchange capacity0.33581072.97786860.6641893
SandSand content0.14359306.96412760.8564070
slopeSlope0.87198411.14681000.1280159
pHpH0.10602539.43171170.8939747
Table 5. Classification matrix (testing dataset).
Classified 0Classified 1
Observed 04570740
Observed 11925022
Table 6. Classification predictor importance.
VariableImportance
pH1.000000
bio150.875614
bio040.677423
bio010.675045
CEC0.548218
Sand0.498888
Slope0.325849
Publisher’s Note: MDPI stays neutral with regard to jurisdictional claims in published maps and institutional affiliations.

