Article

Effects of Nutrient Elements on Growth and Expression of Insect-Defense Response Genes in Zanthoxylum bungeanum Maxim

1
College of Forestry, Northwest Agriculture and Forestry University, Yangling District, Xianyang 712100, China
2
College of Animal Science and Technology, Northwest Agriculture and Forestry University, Yangling District, Xianyang 712100, China
3
College of Natural Resources and Environment, Northwest Agriculture and Forestry University, Yangling District, Xianyang 712100, China
*
Author to whom correspondence should be addressed.
Forests 2022, 13(9), 1365; https://doi.org/10.3390/f13091365
Submission received: 6 July 2022 / Revised: 13 August 2022 / Accepted: 25 August 2022 / Published: 27 August 2022
(This article belongs to the Section Genetics and Molecular Biology)

Abstract

:
In China, Zanthoxylum bungeanum Maxim, known as “Huajiao,” has a pleasant, fragrant flavor and several therapeutic properties. The nutritional content of plants is necessary for their defense response to insects. In this study, we analyzed the effects of soil fertilization treatments such as nitrogen (N), phosphorus (P), potassium (K), calcium (Ca), and special compound fertilizer for pepper (HZ) on the different growth parameters and expression of insect-defense-response genes in Z. bungeanum. The results show that the height and weight of prickly ash significantly differed after the application of fertilizers with different concentrations. Additionally, seedlings that were treated with low concentrations of nutrient fertilizers (N1, P1, K1, Ca1, and HZ1) were significantly higher, and they were selected for transcriptome analysis. According to transcriptomic analysis, a total of 65,566 unigenes were discovered, among which 61,379 corresponded to annotated protein-coding genes and 4187 to transcripts of novel protein-coding genes. A total of 294 unigenes were detected as candidate genes for regulating the defense response to insects, including 204 protease inhibitors, 29 plant lectins, and 61 other defense response genes. Additionally, trypsin inhibitors, cystatin, phytepsin, metalloproteinase, MMP, caffeic acid, resveratrol, and thiol proteinase inhibitors, ACA, TDC, and 28 BES1 were enriched in Z. bungeanum. Specifically, the leaves of Z. bungeanum that were treated with Ca and HZ fertilizations were dominated by the protease inhibitors. In addition, the type of fertilizer significantly affects gene expression in plants. The functional annotations were predicted by the number of differentially expressed genes and classified by GO and KEGG ontology enrichment analysis. Moreover, according to the GO database, biological processes were the largest group and contained a high frequency of differentially expressed genes. According to KEGG pathway results, significantly enriched genes belonged to the biosynthesis of secondary metabolisms, amino acid metabolism, and folding, sorting, and degradation. Overall, it was found that the type of fertilizer with low concentrations had an effect on Z. bungeanum’s primary and secondary metabolism, and these findings provided grounds for further research in forest protection science.

1. Introduction

All over the world, there are a lot of tree species that are useful in many areas of our lives, and one such important species is the Chinese prickly ash, which belongs to the family Rutaceae [1]. Sichuan, Shaanxi, and Gansu provinces are the most important centers for producing Chinese prickly ash [2]. The Chinese prickly ash, whose Latin name is Zanthoxylum bungeanum Maxim, is widely distributed in China under the name Chinese pepper or Huajiao [3]. Z. bungeanum cultivars have a bright red pericarp, and due to this characteristic, these cultivars are also commonly known as “Hong Hua Jiao” in China [4,5]. Chinese prickly ash is used mainly for food purposes and has high value in medicine and health preservation [6]. It is used to treat diseases such as gastrointestinal disorders, toothaches, and rheumatism and is also used in the treatment of various skin diseases and dysmenorrhea [7]. In some growing regions, ground dried pericarp of Chinese prickly ash is used as a substitute for insect repellents in household products. The leaves of the Chinese prickly ash tree can be used to make pesticide, which is used to protect against pests such as Pieris rapae, mole voles, and aphids [8,9,10,11,12,13].
To achieve maximum yield, plants need balanced nutrition at every stage of development. Nitrogen, phosphorus, potassium, calcium, and macronutrients play critical functions in each living population and must be readily accessible to plants [14]. With the proper management of these nutrients, farmers can maximize economic yields without causing any damage to the environment [15]. Fertilizer usage has continuously increased over the past 50 years as a result of the requirement to boost food production volume. In 2014, global fertilizer usage containing nitrogen, potassium, and phosphorus nutrient components reached 200 million tons, among which soybeans, rice, maize, and wheat accounted for the majority of the weight [16].
Plants absorb a huge amount of macronutrients such as nitrogen, phosphorus, potassium, calcium, magnesium, and sulfur, which range from 0.2% to 4% of the overall plant dry weight, whereas micronutrients such as Cu, Fe, Mn, Ni, Cl, Zn, B, and Mo are only needed in low amounts and make up less than 0.01% [14]. Some macronutrients that are the main limiting factors for plant development include N, P, and K, as they are involved in basic vital processes and acute deficiencies of these nutrients severely limit crop yield. Phosphorus and nitrogen are the most significant components of ribonucleic acid (RNA) and deoxyribonucleic acid (DNA). Esters of phosphorus are components of lipids and are transitional in various biogenesis and breakdown pathways. By phosphorylating lipids and proteins, phosphorus also regulates cell signaling pathways during plant responses to developmental and environmental stimuli [17]. Nitrogen is the basic unit of all proteins and amino acids, which play a vital role in cellular metabolism. It accounts for 16% of total plant protein and 1.5% to 2% of the plant dry matter [14]. Potassium, unlike the other two primary elements, is not involved in the metabolic processes of plants. Its levels in plant tissue range between 1% and 3% of dried matter. It also plays a crucial role in cells as a source of electrical charges and as a catalyst for a number of critical enzymatic activities. Furthermore, potassium plays a significant role in the osmoregulation of water usage in plants as well as being involved in the plant’s resistance to stresses such as high and low temperatures, droughts, diseases, and pest attacks [18].
Generally, some plants endure difficult survival conditions since they are susceptible to environmental changes at all stages of their growth and development. Individual plants and generations must be able to adjust quickly to a variety of changing environments to survive. Plants respond to biotic and abiotic stressors in various ways, including morphological, biochemical, and physiological changes [19,20]. Low nutrient availability, salt, drought, disease, and herbivory are among the biotic and abiotic stresses affecting plant productivity and survival [21]. Terrestrial plants have developed integrated approaches integrating internal and external signaling networks to cope with many environmental challenges [22,23].
Transcriptome sequencing is a strong approach for analyzing gene expression at the mRNA level, and it can detect a wide spectrum of low abundance transcripts [24]. Recent advances in functional genomics provide an effective method for analyzing complicated physiological processes [25]. Our understanding of plant growth and development has been substantially improved by the abundance of genomic and transcriptome data, particularly in model plants like Arabidopsis and rice. In recent years, the capability of sequencing cDNA libraries has been employed in functional genomics research [26]. In particular, RNA sequencing has been extensively utilized to collect transcriptome data, profile global gene expression, and identify novel genes in both model and non-model plant species, such as rice [27], Cornus officinalis [28], and Triticum aestivum L. [29]. In this work, we analyzed RNA sequencing (RNA-seq)-based transcriptome profiles of Z. bungeanum in the presence of N, P, K, Ca, and HZ (a compound fertilizer specifically for pepper) macronutrients and discovered differentially expressed genes (DEGs) connected to the insect-defense response. Accordingly, we aimed to find candidate genes and discover more about molecular pathways that regulate the insect-defense response in Z. bungeanum. These findings will explore the new information that will be a valuable resource for future research on this species.

2. Materials and Methods

2.1. Experimental Site

The experiment was carried out in the Z. bungeanum field of the Northwest Agriculture and Forestry University, Shaanxi, China (34°20′ N, 108°24′ E) and spanned from March to August 2021. The area is located 520 m above sea level. The average annual temperature is 12.8 °C, and the average annual rainfall is 632 mm. It belongs to a warm temperate monsoon, semi-humid climate zone. The chemical properties of the soil are as follows: pH was 7.06; soil organic matter was 25.0 g/kg; available nitrogen was 53.70 mg/kg; available phosphorus was 12.1 mg/kg; available potassium (K) was 512 mg/kg; Ca was 23.2 cmol/kg; Mg was 2.3 cmol/kg; and Mn was 6.1 mg/kg.

2.2. Plant Materials and Treatment

One-year-old seedlings of Z. bungeanum with a similar average growth in the experimental field were selected for the experiment. The average plant height of Z. bungeanum was 15 cm, and the average ground diameter was 2.78 mm, and seedlings were planted on 13 March 2021.
In this study, we used five types of fertilizers, including N (applied as urea), P (applied as potassium dihydrogen phosphate), K (applied as potassium sulfate), Ca (applied as calcium nitrate), and HZ (a special compound fertilizer for peppers). HZ was developed by the pepper project team in the Professor Menglou Li Laboratory of Northwest Agriculture and Forestry University. The main ingredients of the HZ were N, P, K, Ca, Mg, S, and B macro-micronutrients. A total of 16 treatments were performed, one of which was the control group (CK), without adding any fertilizer.
The dosages (ml/tree) of the three treatments of N, P, K, and Ca fertilizers were 200, 400, and 600. The dosages of the three treatments of HZ fertilizer were 300, 500, and 1200 (Table 1). First, a stock solution was made, consisting of raw materials diluted with water with the active ingredient content. Then, the standard solution was prepared from the stock solution according to each concentration of the treatment. The total amount of solution used for each group was 4000 mL. Treatments were applied between the end of April and the start of May. Soil fertilization treatment was conducted at a weekly interval. The application was performed six times in total for each group.

2.3. Measurement and Sampling

In this study, the seedling height and diameter were taken on day 28, day 56, day 84, and day 112 after soil fertilization. Height measurements were taken with a tape measure (Lianyungang Jinsheng Company, Lianyungang, Jiangsu, China). The diameter was measured using a caliper (Guilin Guanglu Digital Measurement and Control Co., Ltd., Guilin, China) at the base of the seedling at a level of 1 cm.
Two months after the end of soil fertilization, Z. bungeanum fresh leaves from low concentration treatments (N1, P1, K1, Ca1, and HZ1) were collected individually for transcriptome analysis. Each treatment has three biological replicates. Leaf samples were taken from the plants starting with the fourth compound leaf, which was numbered from top to bottom. Before sampling, the selected seedlings were sprayed and cleaned with pure water (dH2O), and they were collected after the water had fully evaporated. After the collection, the 18 leaf samples were immediately placed in foil bags and frozen in liquid nitrogen, then transferred to a box of dry ice, and immediately sent to the laboratory for transcriptome sequencing.

2.4. Total RNA Extraction and cDNA Library Construction for RNA Sequencing

In this study, various experimental groups (CK, P, K, N, Ca, and HZ) were established for the examination of the effects of different fertilizers on the RNA expression of Z. bungeanum, and three biological replicates were generated for each experimental group. The total RNA isolated from each plant tissue sample was applied to RNA-Seq library preparation by using CTAB-pBIOZOL reagent (Hangzhou Bori Technology Co., Ltd. (BIOER), Hangzhou, China) according to the manufacturer’s protocol [30]. The library was constructed as follows: The mRNA was extracted from total RNA using oligo-dT magnetic beads, and the fragmentation buffer was randomly interrupted following the BGISEQ-500 platform (Shenzhen, China) methods [31,32]. Following that, the first-strand complementary DNA (cDNA) was synthesized from the cleaved RNA fragments using M-MLV reverse transcriptase and random primers. After that, a second-strand cDNA was created using DNA polymerase I and RNase H [33]. The NEB Next connector, with a hairpin ring shape was ligated for hybridization after the 3′ end of the DNA fragment was adonized. AMPure XP beads were used to purify the cDNA (Beckman Coulter, Beverly, CA, USA). The product was validated on the bioanalyzer (Agilent Technologies 2100) for quality control. Finally, the double-stranded PCR enrichment from the previous step was heated, denatured, and circularized (PCR conditions: 98 °C 10 s, 65 °C 30 s, 72 °C 30 s, 72 °C 5 min, 12 cycles) by the splint oligo sequence to get the final library. The single-stranded circular DNA was formatted as the final cDNA library for evaluation in a Qubit 2.0 and Agilent 2100. The cDNA library sequencing was performed using the BGISEQ-500 platform (Beijing Genomics Institute, Wuhan, China).

2.5. Transcriptome and Functional Annotation

Clean reads were obtained by removing the adapter sequences, low-quality sequences, and sequences shorter than 5% unknown base reads. The clean reads were then subjected to a de novo transcriptome analysis using the Trinity program’s short reads [34]. With an E value threshold of 10−5, assembled unigenes were annotated using BLAST (version 2.2.23) alignment against public databases, including the NCBI non-redundant protein database and KEGG (accessed on 5 August 2021; http://www.genome.jp/kegg). “Blast2GO” (version 2.5.0, default parameters) and “WEGO” programs were used to annotate GO terms and obtain GO classifications based on molecular function, biological process, and cellular component [35,36].

2.6. Differentially Expressed Gene (DEG) Analysis

The clean reads were mapped to the genome sequence using Bowtie2, and gene expression levels in each sample were calculated using RNA-Seq by Expectation Maximization (RSEM) [37]. RSEM is a software tool that calculates gene and transcription isoforms from RNA-SEQ sequences [38]. The DEGseq2 package [39] was used to assess differentially expressed genes (DEGs) in groups treated with N, P, K, Ca, and HZ, as well as control groups. Gene expression levels were calculated using fragments per kilobase of transcript sequence per million base pairs of sequenced (FPKM) nucleotides. In multiple testing with determined false discovery rates (FDR), the Benjamini–Hochberg process was employed to modify the obtained P values [40]. FDR < 0.05 was employed to determine DEGs throughout the screening procedure. Hierarchical clustering was used to examine the differentially expressed genes [41]. Genes that were expressed similarly or identically were grouped to show varied expression patterns under different experimental settings.

2.7. Screening of Insect-Desense Response Genes

The candidate insect-defense response genes were screened from the total annotated genes by the supplementary data (Table S1) using the R language programming. Then, by comparing these screened insect-defense response genes to total DEGs, differentially expressed insect-defense response genes were revealed. The significance enriched for DEGs was defined as a Q-value < 0.05. The obtained DEGs were mapped to the function enrichment of GO and KEGG using the R programming language and the “Cluster Profiler” package [42].

2.8. Statistical Analyses

All morphological tests were conducted using the Statistical Product and Service Solution statistical software program (IBM Inc., Chicago, IL, USA), and data are provided as the mean of two replicates with standard deviation (SD). The results obtained from the normal distribution were non-significant, with an average value greater than 0.05, suggesting that the collected data obtained from the experiment were normally distributed. In the next step, a one-way analysis of variance (ANOVA) was used to compare the effects of fertilization treatments on tree height and diameter. For each variable, Duncan’s multiple range test was used (note: various lower cases in the table demonstrate significant differences at the level of 0.05). Treatment means in the figure with distinct lowercases are significantly different at the level of p value < 0.05.

3. Results

3.1. Effects of Fertilizer on Growth Indicators

The morphological analysis shows that the soil fertilizer application rate affected plant growth (Table 2 and Table 3). By the 28th day, there were no significant differences in seedling height among the various concentrations and fertilizer treatments. Only N1 and CK0 seedlings were significantly higher than those of P1, K1, and Ca1 seedlings. These results indicate that fertilizer largely had no effect during the early stage of plant growth, among which the effect of the N1 treatment was best. On the other hand, the height of seedlings was not significantly different among the N1, N2, and N3 treatments at 56, 84, and 112 days, but was significantly greater than those in the CK treatment. The heights of seedlings decreased as the amount of fertilizer applied increased. By the 84th day, the seedling height of P1, Ca1, and HZ1 had increased by 32.8%, 38.3%, and 18.8%, respectively, compared with the CK0 seedlings. On the last day of measurement (112th day), the seedling height in P1, K1, and Ca1 was significantly higher than the other concentrations of the same treatments, with the highest values 35.4%, 31.1%, and 30.1% higher than the CK treatment, respectively. This finding suggests that a high concentration of fertilizer has a negative effect on plant growth (Table 2). The height of seedlings in the N and HZ treatments was not significantly different on 84 and 112 days between the low, medium, and high concentrations (1, 2, and 3), but it was significantly higher (p < 0.05) than in the CK treatment.
The diameter of seedlings under Ca1 treatment was significantly higher among the doses from the 28th to 112th days of measurement. Furthermore, P1 concentration increased significantly from the 56th day, compared with other concentrations. Moreover, the seedlings in P1 had the largest diameter, which was 25.1% larger than the seedlings in the control group (CK0) on the 112th day. The doses of N1 and HZ1 rose significantly on the 28th day, whereas K1 rose significantly on the 112th day of measurement. The diameter of the seedlings which were treated with K fertilizer showed no significant differences among the concentrations from 28 to 84 days. However, at the end of the measuring time (112th day), we found that the diameter of seedlings under the K1 treatment was significantly (p < 0.05) higher than other doses of treatment (Table 3).
In most cases, the height and diameter of seedlings under low concentrations of fertilizer were higher than under other concentrations. According to these results, leaf samples of Z. bungeanum treated with low doses of N1, P1, K1, Ca1, and HZ1 were chosen for further transcriptome analysis.

3.2. Z. bungeanum Sequencing Analysis and Annotation of Transcriptomes

The RNA-seq libraries were generated and sequenced using the BGISEQ-500 technology to gain a full overview of Z. bungeanum. All the reads of Z. bungeanum were submitted to the National Center for Biotechnology Information (NCBI) GenBank assembly accession under the number GCA_01945045.1 with BioProject PRJNA524242 (Supplementary Table S2). Thus, a total of 3979.5 Mb of valid data was acquired.
RNA sequencing libraries were created from N, P, K, Ca, and HZ treatments and control groups (CK) employing the BGISEQ-500 platform to identify a full overview of the Z. bungeanum transcriptome. After removing the adaptor sequences and low-quality reads, the Z. bungeanum transcriptomes yielded around 42.691 clean reads with an average length of 6.40 Gb. A total of 18 leaf samples were obtained, with a Q20 of 97.88% and a Q30 of more than 94.01%. The sequences were built together using Trinity software. As a result, the sequencing data’s quality and accuracy were sufficient for further analysis (Table 4).
The average of the mapped ratios to the genome and gene set was 75.28% and 60.48%, respectively. The total number of mapped genes was 58,964, among which 54,863 genes were known and 4101 were novel genes. In addition, 65,566 total protein coding genes were assembled, among which 61,379 belonged to alternatively spliced isoforms of annotated protein-coding genes and 4187 belonged to transcripts of novel protein-coding genes (Table 5). These results suggest that sequencing technology may provide short reads from these unigenes, which can then be submitted to a different type of examination [43].

3.3. Clustering and Dynamics of DEGs between Treated and Control Groups

To find the genes that were up-regulated and down-regulated between the CK and treated groups (N, P, K, Ca, and HZ) in the Z. bungeanum seedlings, we used a general chi-squared test with a false discovery rate (FDR) correction and a p-value of ≤0.05 using the DEseq6 package in R software. In total, 9249 significantly DEGs were detected from 65,566 total genes between the treated and control groups. There were 1018 up-regulated genes and 252 down-regulated genes between the N and CK groups; 3011 up-regulated and 1264 down-regulated genes between the P and CK groups; 512 up-regulated and 430 down-regulated genes between the K and CK groups; 440 up-regulated and 308 down-regulated genes between the Ca and CK groups; and 1360 up-regulated and 450 down-regulated genes between the HZ and CK groups. A large number of genes were significantly upregulated in the treated groups compared to control groups (Figure 1).

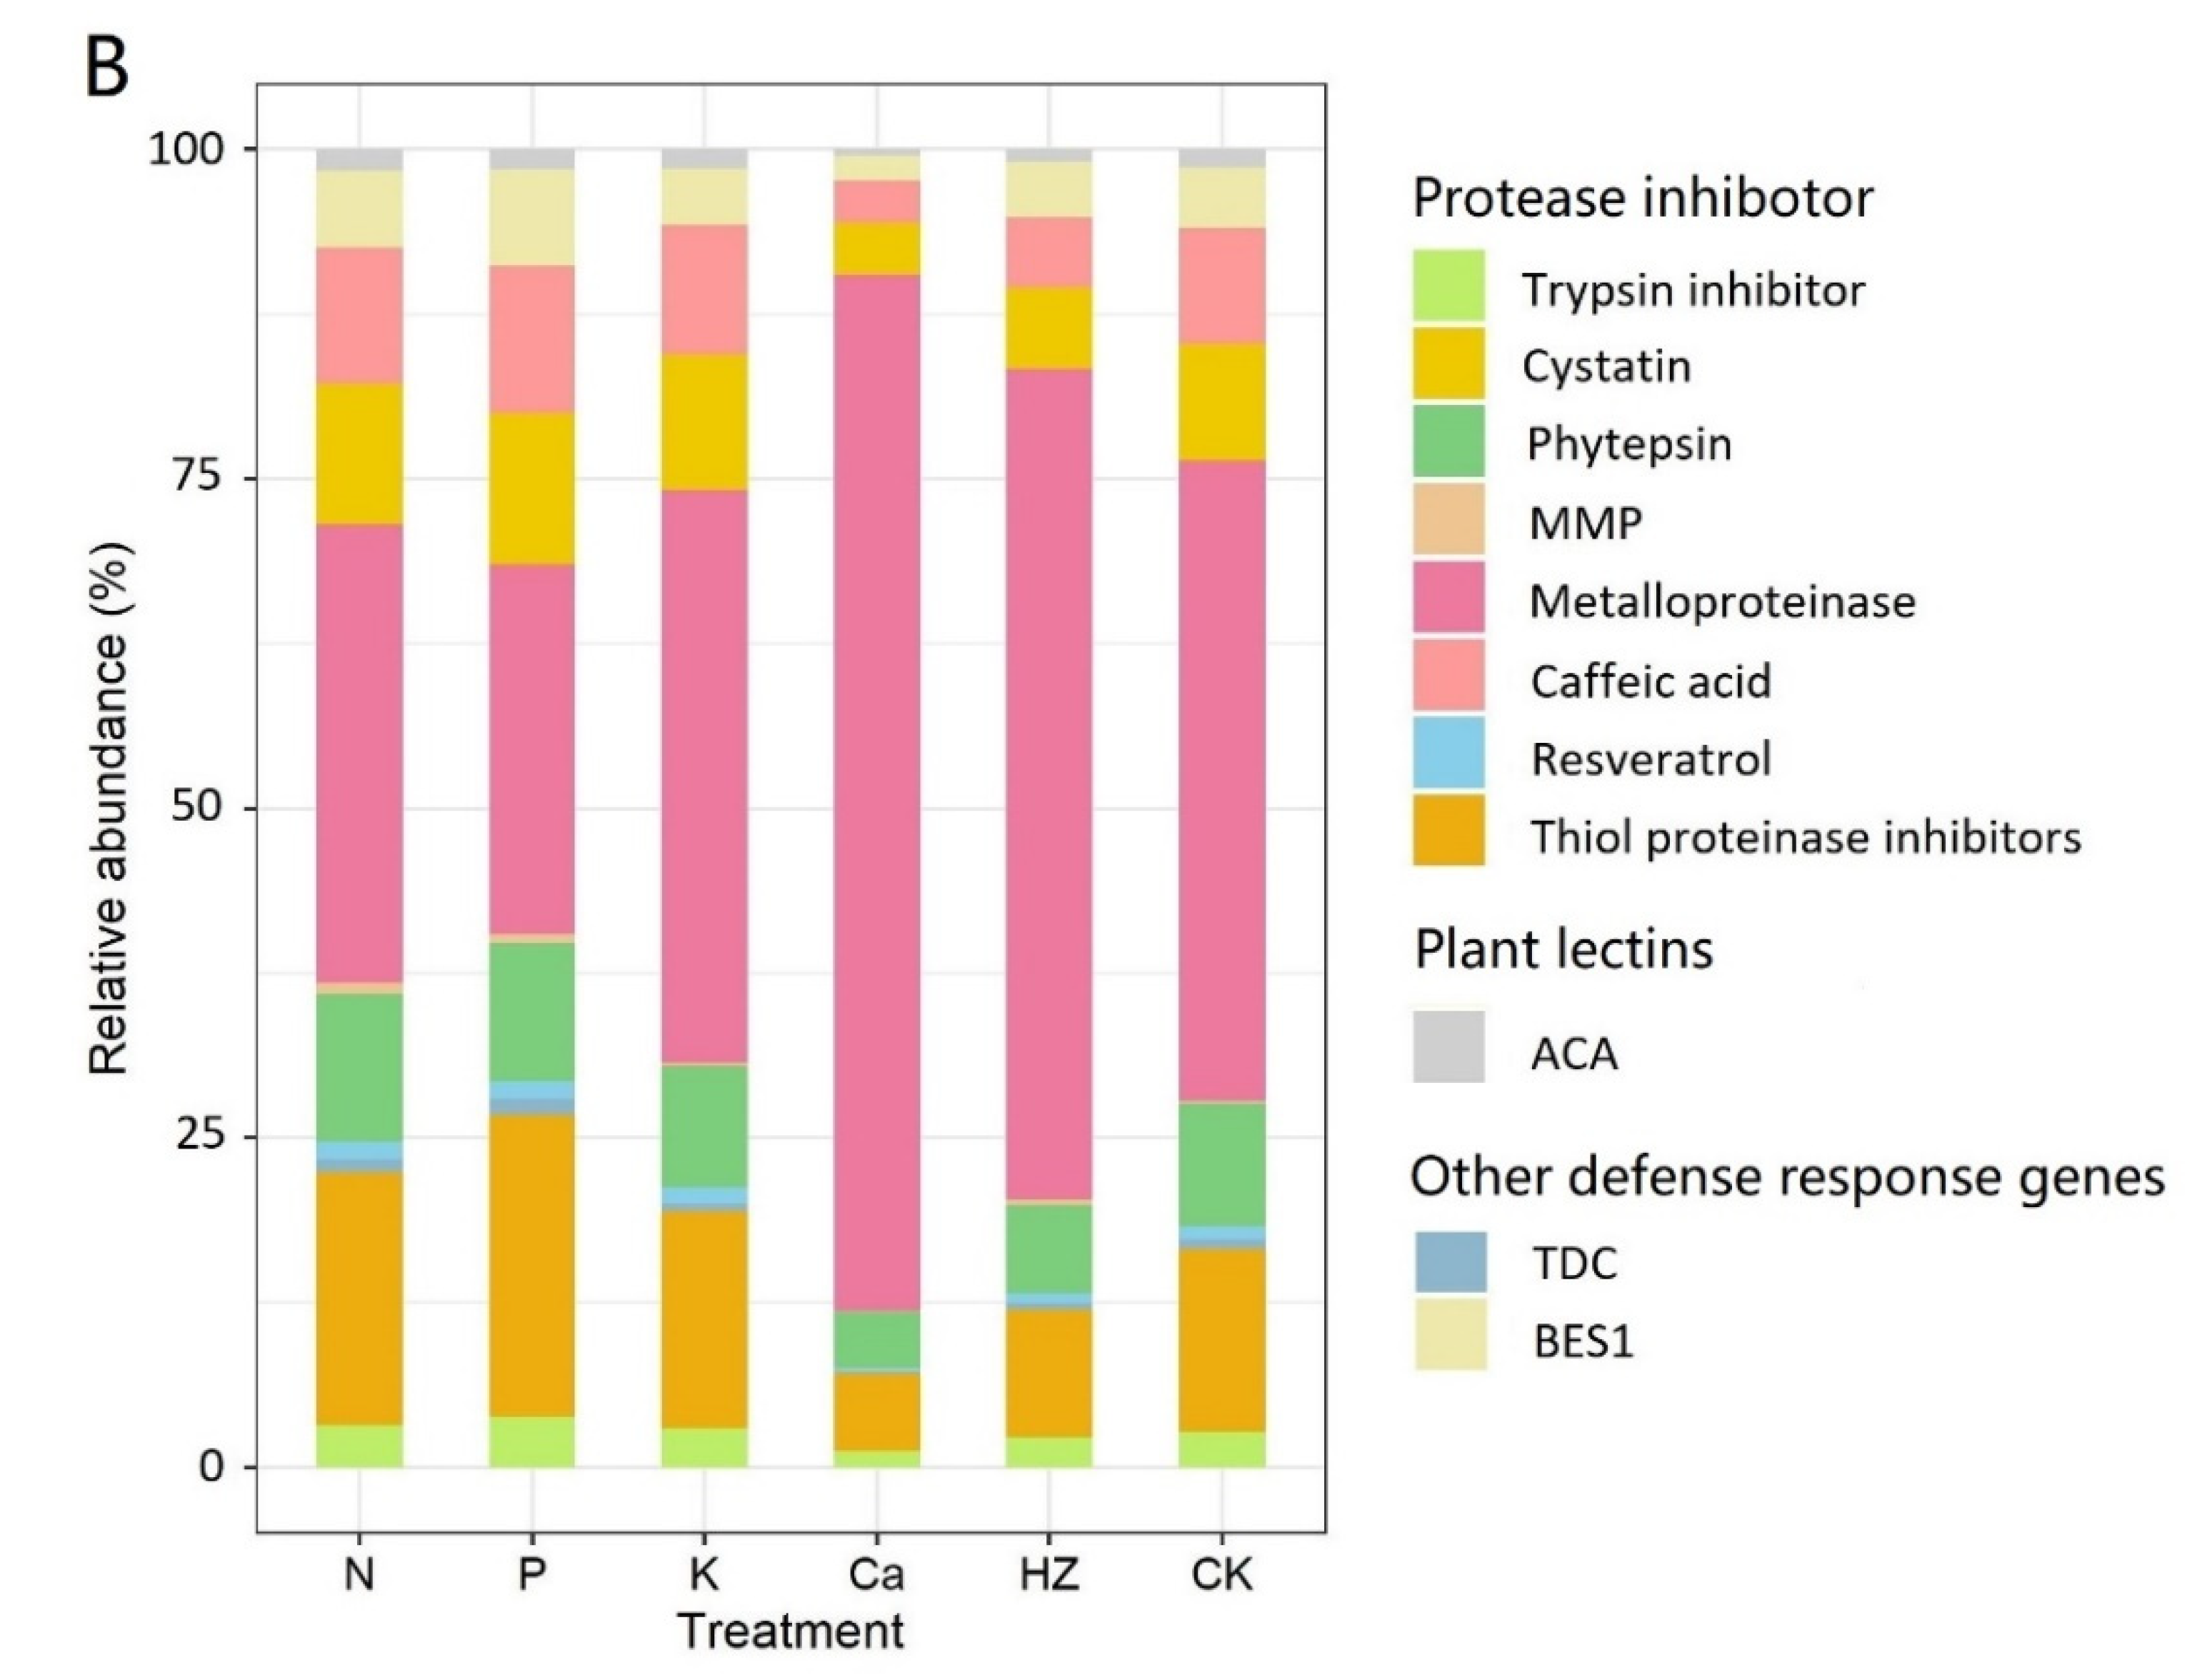
3.4. Annotation of Insect-Defense Response Genes under Different Fertilizer Treatments

In the present study, after screening with the “ClusterProfiler” R package, we found 294 candidate insect-defense response genes by annotating 65,566 total genes between N, P, K, Ca, and HZ treatments and CK groups (Table 2). Those screened genes were grouped into three families, including 204 “Protease inhibitor,” 29 “Plant lectins,” and 61 “Other defense response genes”. The 204 unigenes encoded protease inhibitor enzyme families, including 11 trypsin inhibitors, 21 cystatins, 17 phytepsin, 34 metalloproteinases, 8 MMP, 74 caffeic acids, 30 resveratrol, and 9 thiol proteinase inhibitors. Additionally, 29 ACA enzymes were detected in the plant lectin family, 33 TDC, and 28 BES1 were in other response gene families (Figure 2B). The highly expressed genes of the FPKM values in the “Protease inhibitor” family for N, P, K, Ca, HZ, and CK were 15,741.24 (91%), 13,367.8 (90%), 18,679.87 (94%), 50,334.85 (97.3%), 29,328.33 (94.3%), and 21,223.74 (93.3%), respectively (Figure 2A). Altogether, metalloproteinase was the most highly expressed gene with an FPKM value of 40,617.89 (78.5%) and 19,608.82 (63.08%) in the Ca and HZ treatments, respectively. The FPKM value of the seedlings that were treated with N (5972.24; 34.7%), P (4162.76; 28.01%), and K (8684.19; 43.55%) fertilizers was lower compared with the CK (11,050.81; 48.6%) (Figure 2B). In addition, the results suggest that the fertilizer types may significantly affect the relative abundance of genes.

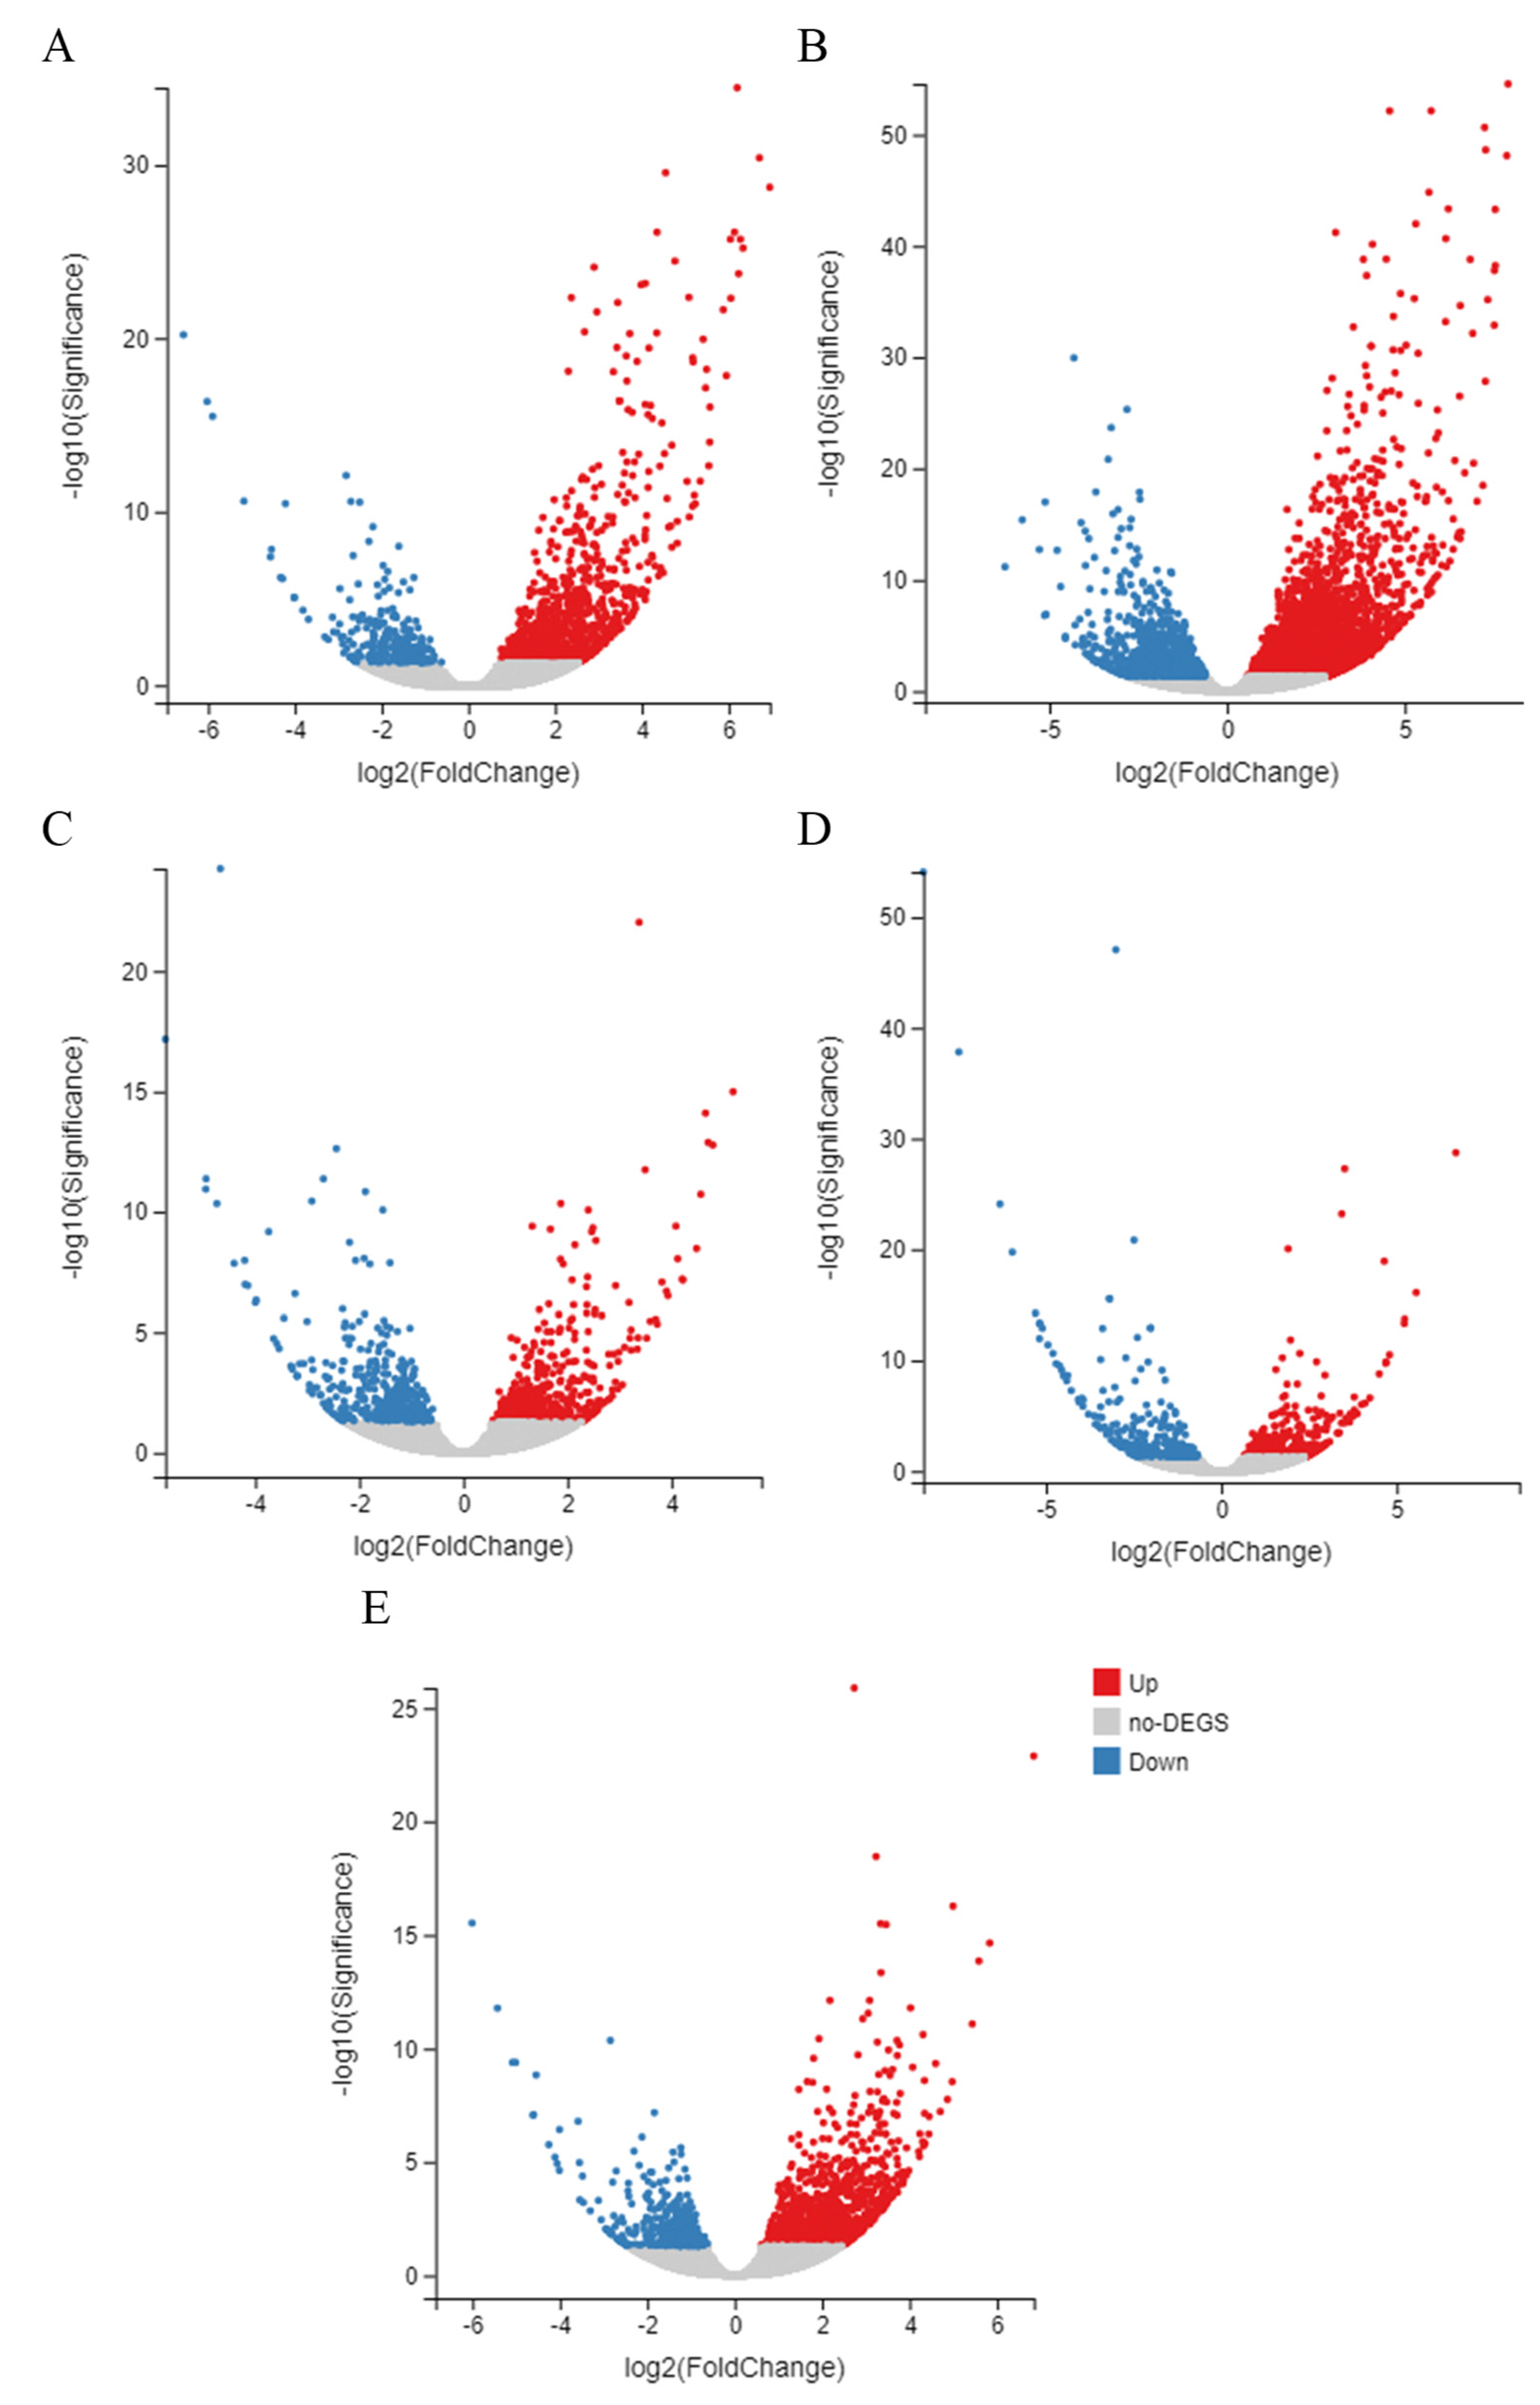
3.5. Identification of DEGs

In total, 55 DEGs were identified, meeting the criteria of p < 0.05 and |log2FC| > 1, by comparing 294 candidate insect-defense response genes with a total of 9249 differentially expressed genes in the Z. bungeanum leaves; these are shown in the Venn diagram (Figure 3).
A transcriptome comparison between CK and HZ showed 38 up-regulated genes and 17 down-regulated genes; between CK and P, there were 37 up-regulated and 18 down-regulated genes; between CK and Ca, there were 34 up-regulated and 21 down-regulated genes; between CK and N, there were 30 up-regulated and 25 down-regulated genes; and between CK and K, there were 27 up-regulated and 28 down-regulated genes. Based on the gene IDs of the DEG results, CK-vs-Ca up-regulated with BGI_novel_G002385, EVM0037938, EVM0012538, EVM0061297 (metalloproteinase), and EVM0023148 (trypsin inhibitor); CK-vs-HZ up-regulated with EVM0037938, EVM0012538 (metalloproteinase) and EVM0023148 (trypsin inhibitor); CK-vs-P up-regulated with EVM0018693 (metalloproteinase) and EVM0023148 (trypsin inhibitor); CK-vs-N up-regulated with BGI_novel_G002385 (metalloproteinase); and CK-vs-K up-regulated with EVM0031140 (caffeic acid) (Figure 4).

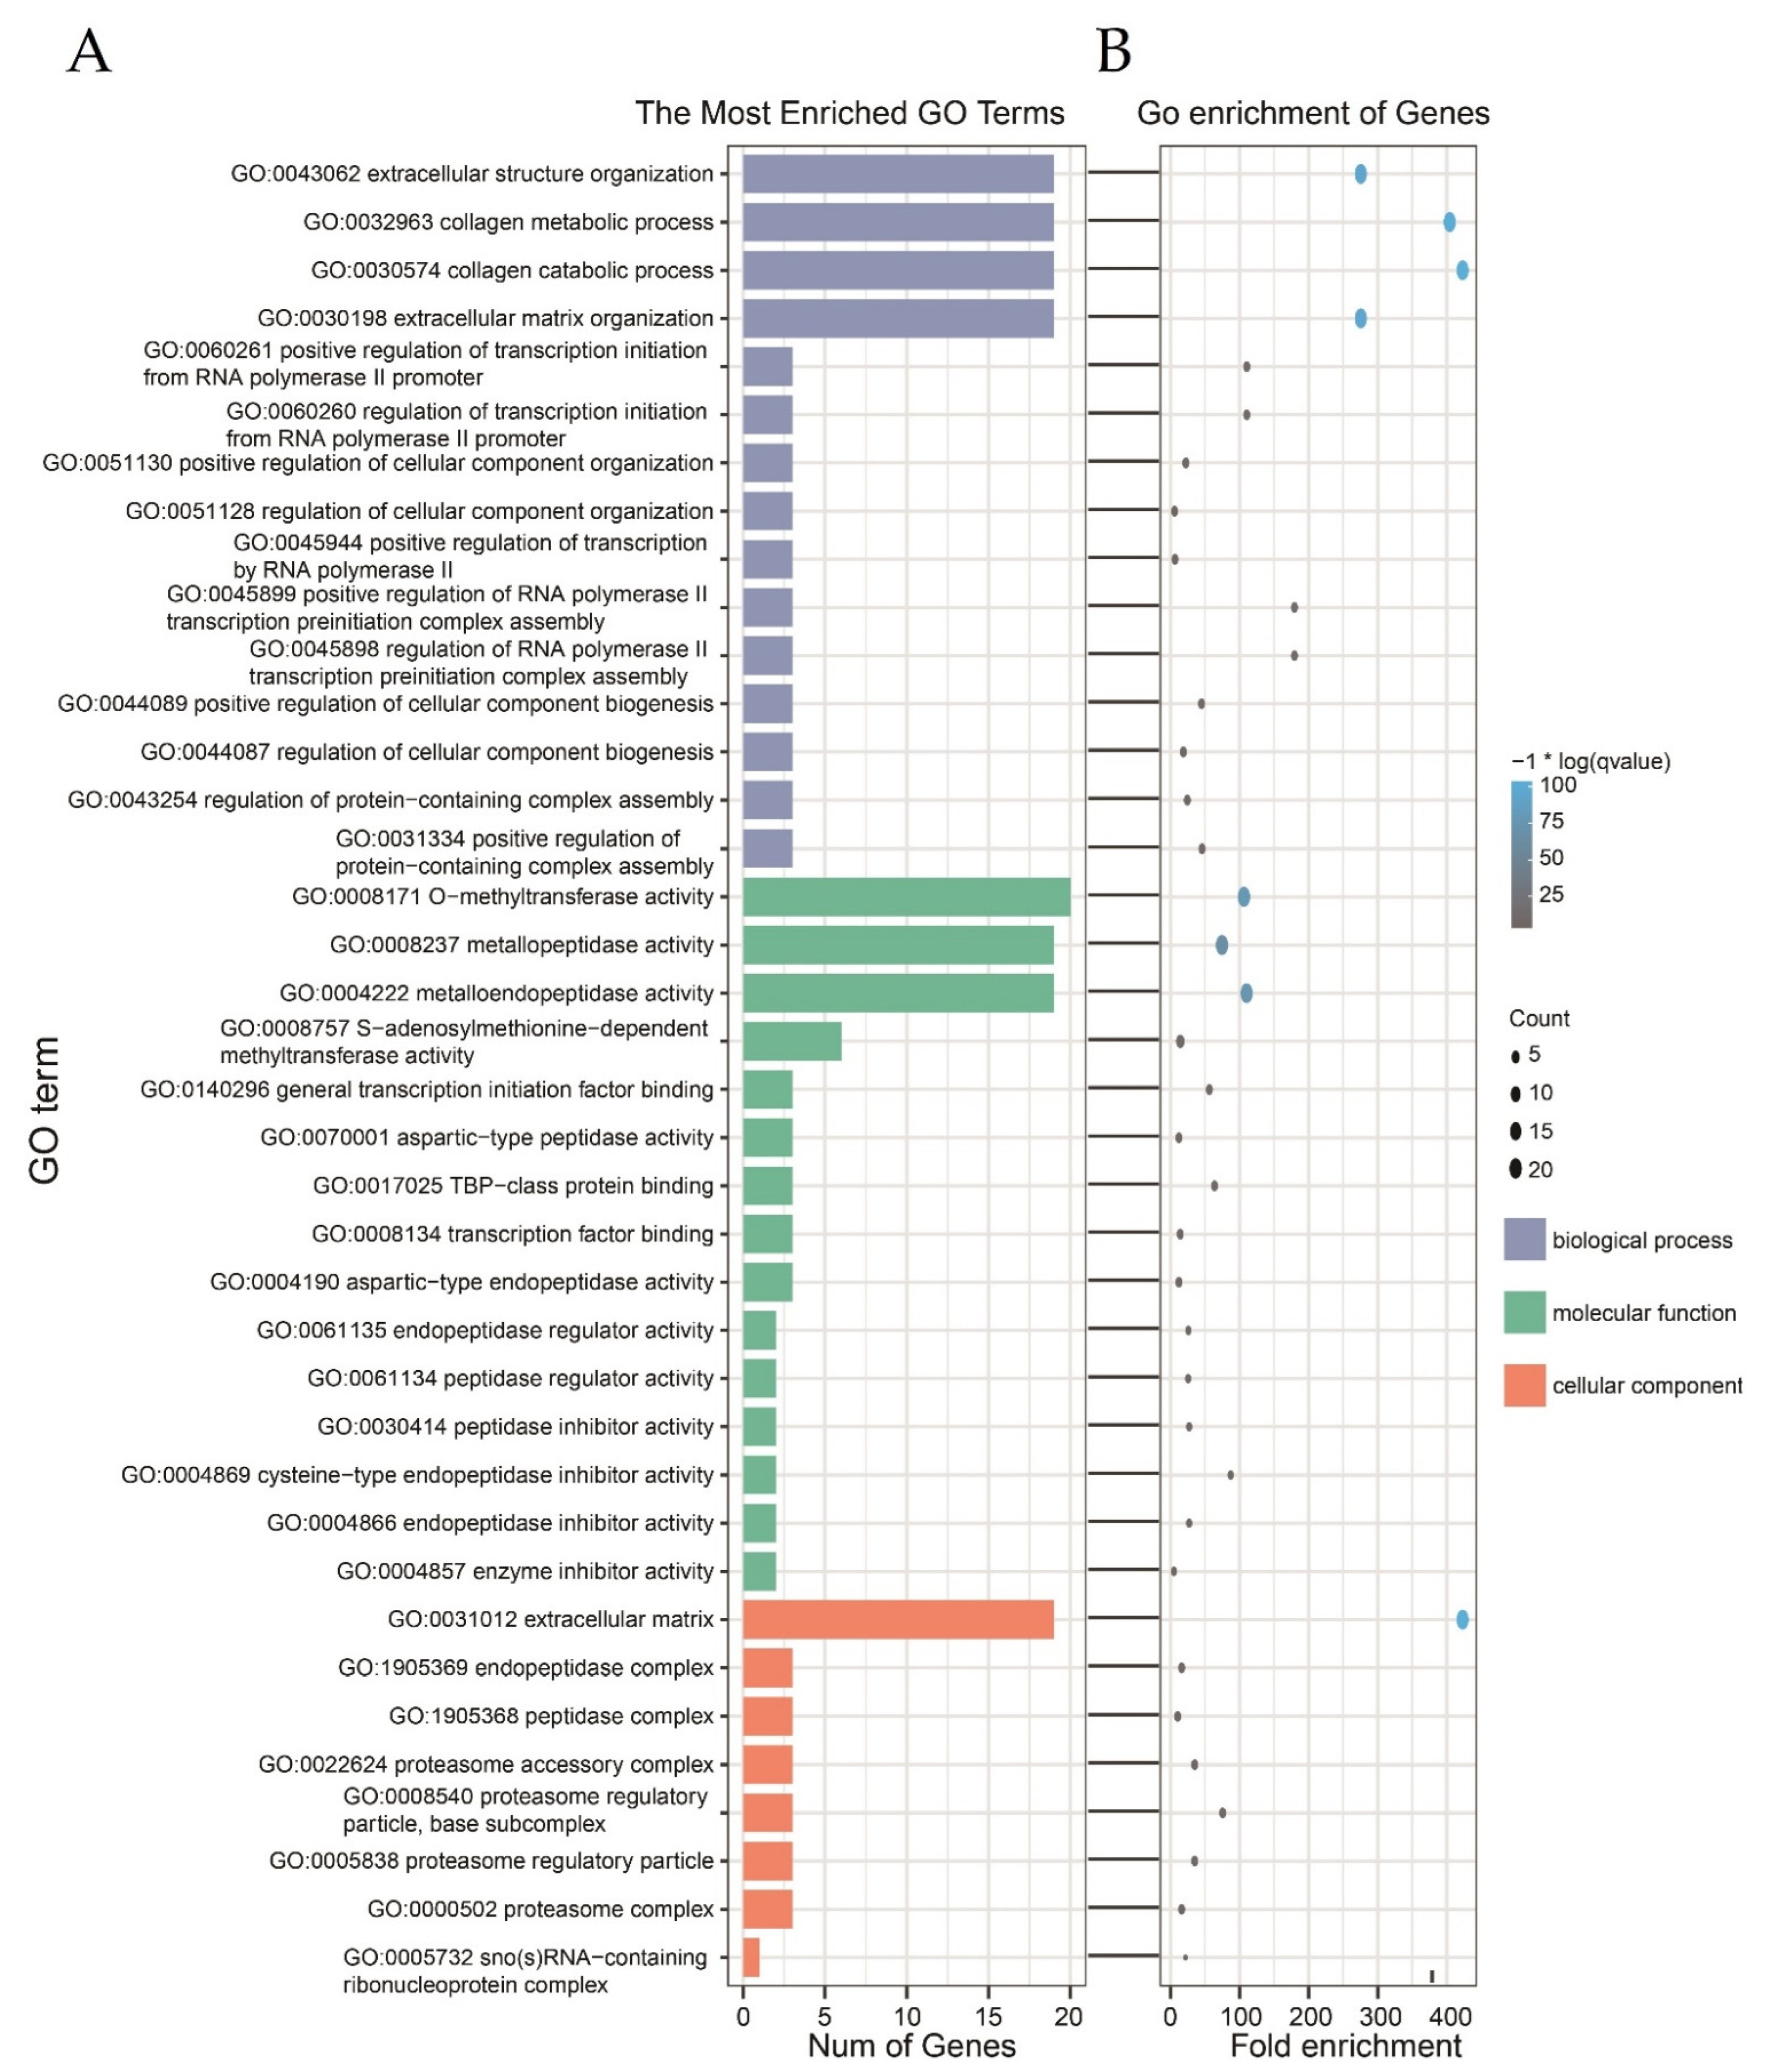
3.6. Functional Classification of Differentially Expressed Insect-Defense Response Genes by GO Analysis

To further identify the major functional categories of DEGs in Z. bungeanum, gene ontology (GO) enrichment analyses were performed (Figure 5). GO functional enrichment studies may reveal how DEGs are linked to certain biological activities, hence they were utilized to organize genes into expected functional groupings. From the statistical analysis, 113 subcategories were identified from 55 DEGs between N, P, K, Ca, and HZ treatments and CK groups, then categorized into biological processes (59%), molecular function (33%), and cellular components (8%) (Figure 5). The enriched GO terms show that 56 subcategories were enriched in the “Biological processes” category, including the extracellular structure organization (GO: 0043062), extracellular matrix organization (GO: 0030198), collagen catabolic process (GO: 0030574), and collagen metabolic process (GO: 0032963). The next enriched category was the “Molecular function” category, with 31 subcategories: O-methyltransferase activity (GO: 0004222), metalloendopeptidase activity (GO: 0004222), S-adenosylmethionine-dependent methyltransferase activity (GO: 0008757), aspartic-type endopeptidase activity (GO: 0004190), transcription factor binding (GO: 0008134), TBP-class protein binding (GO: 0017025), aspartic-type peptidase activity (GO: 0070001), general transcription initiation factor binding (GO: 0140296), enzyme inhibitor activity (GO: 0004857), endopeptidase inhibitor activity (GO: 0004866), and peptidase regulator activity (GO: 0061134). Last, was the “Cellular component” category, with the following eight subcategories: extracellular matrix (GO: 0031012), proteasome complex (GO: 0000502), proteasome regulatory particle (GO: 0005838), proteasome accessory complex (GO: 0022624), peptidase complex (GO: 1905368), and endopeptidase complex (GO: 1905369) with p-values < 0.05 (Figure 5A).
Furthermore, we performed GO enrichment analysis on differentially expressed genes related to insect-defense response of Z. bungeanum and then chose the top 38 metabolic pathways. As result, extracellular structure organization (Bg Ratio: 66), collagen metabolic process (Bg Ratio: 45), collagen catabolic process (Bg Ratio: 49), extracellular matrix organization (Bg Ratio: 66), metalloendopeptidase activity (Bg Ratio: 165), and extracellular matrix (Bg Ratio: 66) pathways were found to have high concentration classes (p-values < 0.05). In addition, it is hypothesized that these pathways can play a role in protecting plants from different plant predators and different environmental factors (Figure 5B).

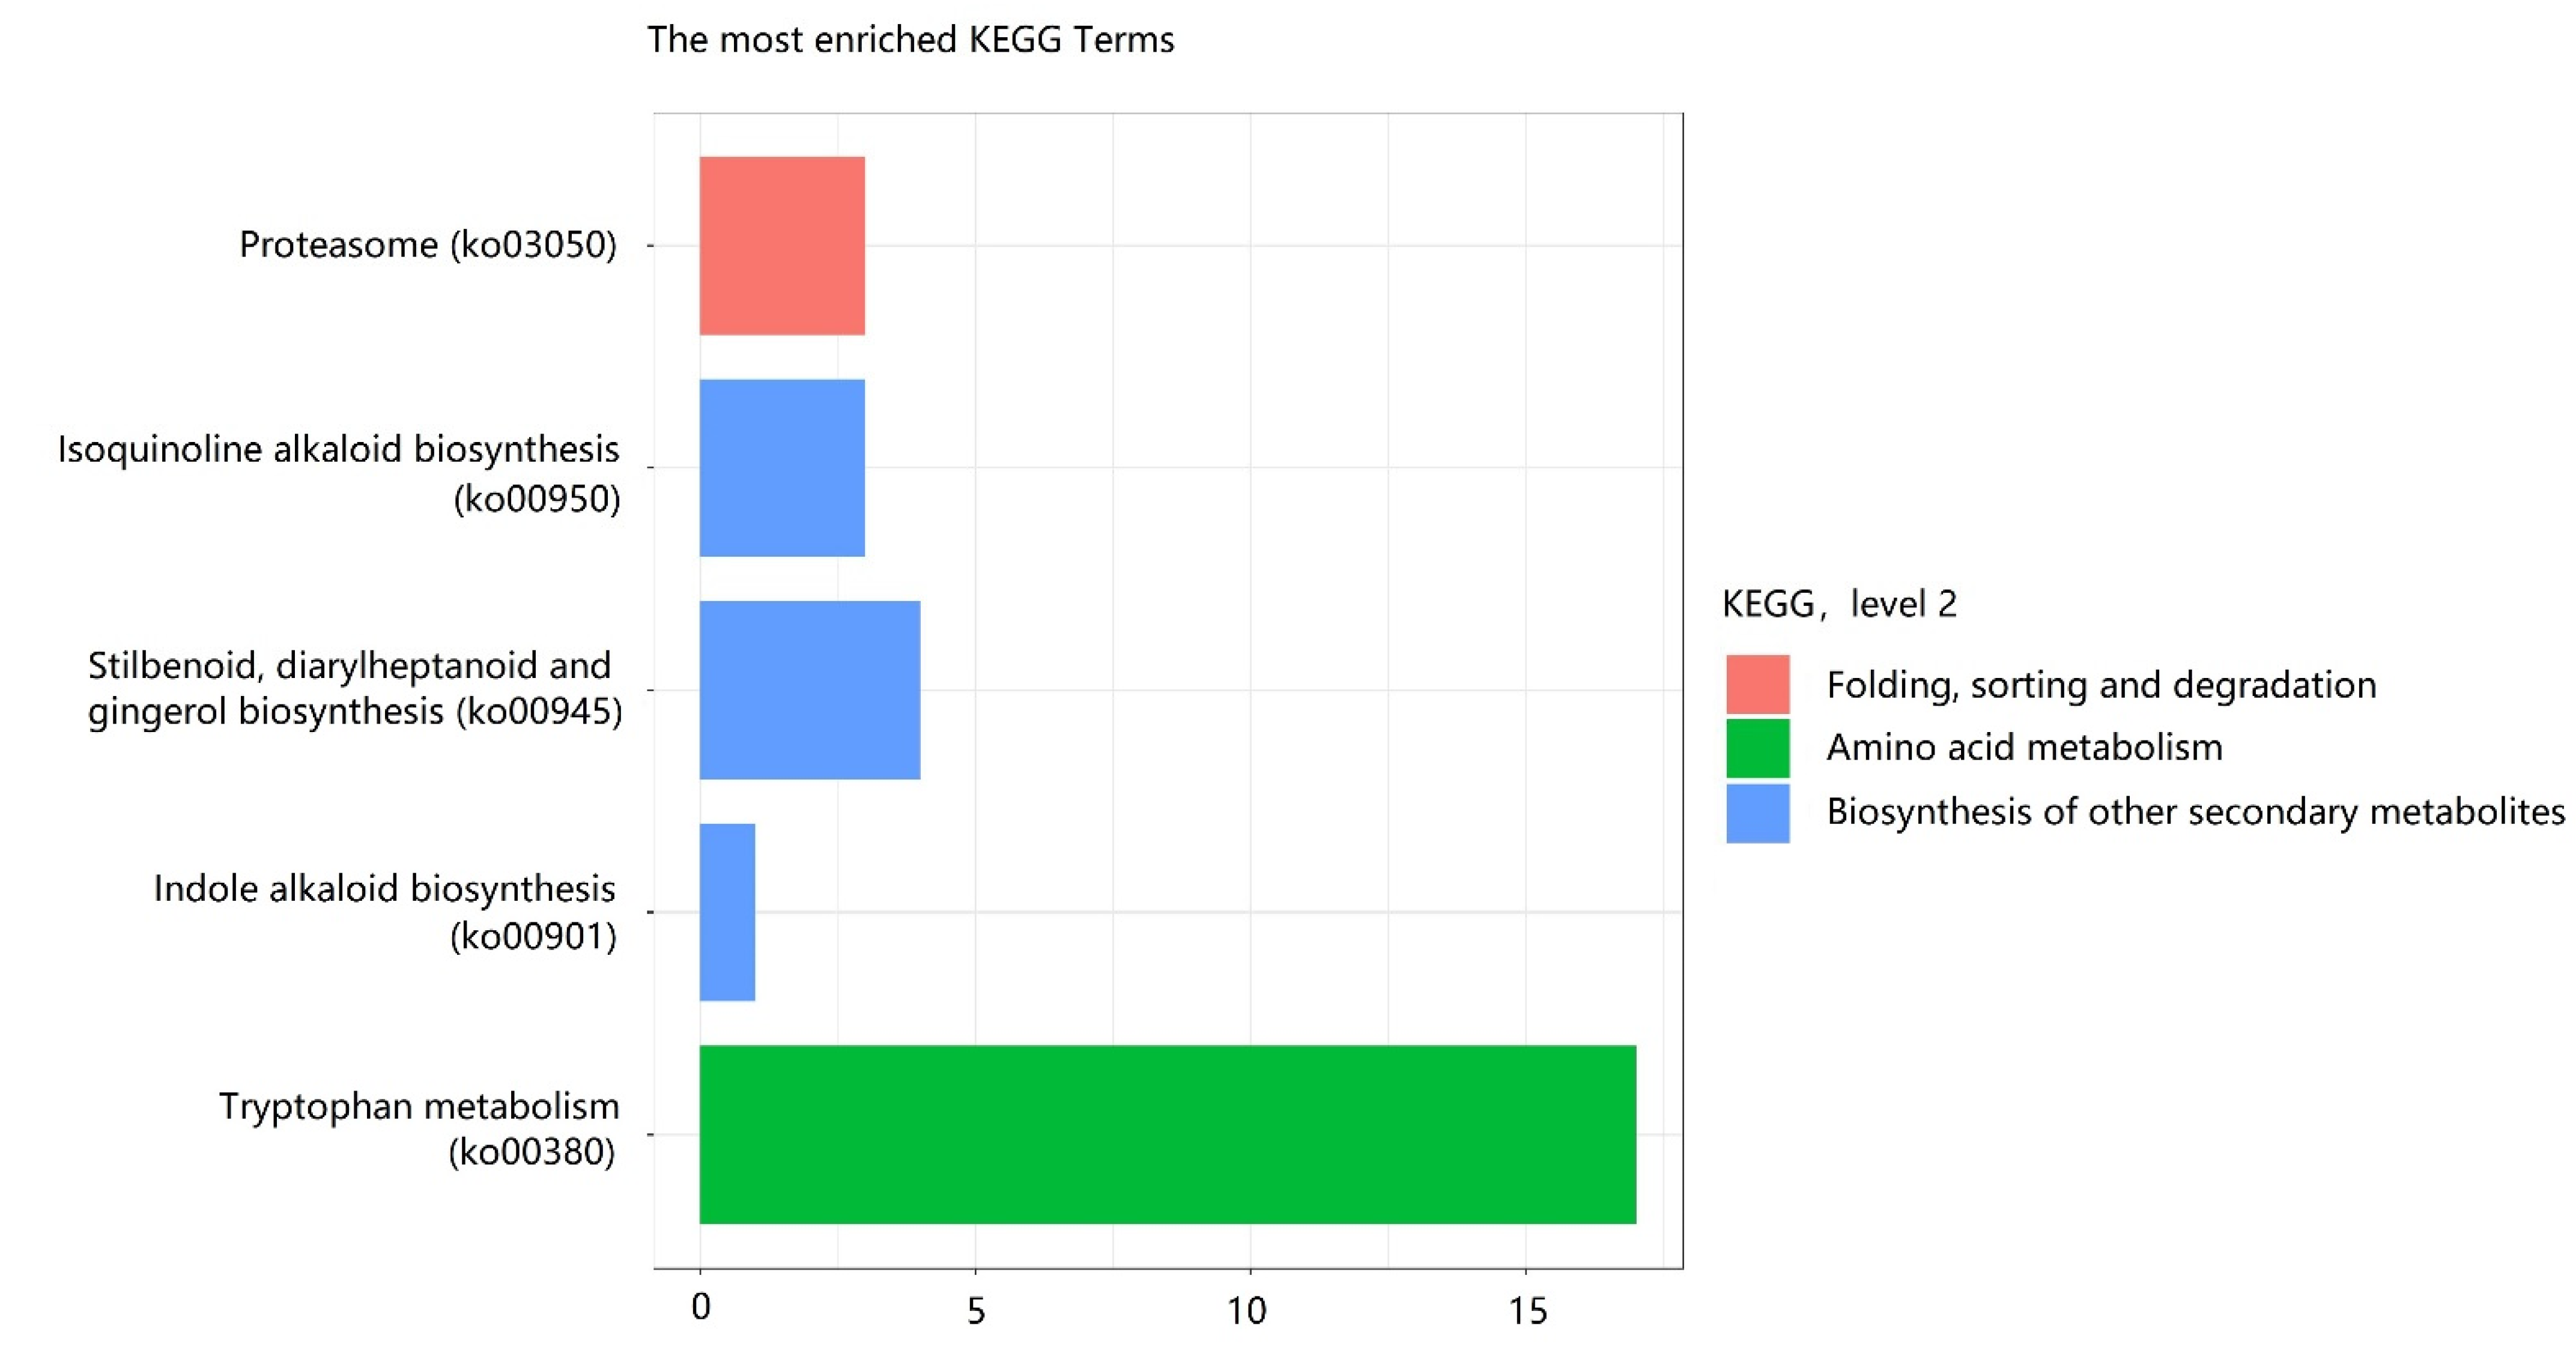
3.7. Functional Classification of Differential Expressed Insect-Defense Response Genes by KEGG Pathways

KEGG analysis was performed to obtain more information on the biochemical and genetic responses of differentially expressed genes. A total of 55 DEGs were screened and assigned to KEGG pathways, and the top five significantly enriched pathways are shown in Figure 6. KEGG pathway analysis was classified into three main categories: “Cellular processes”, “Genetic information processing”, and “Metabolism”. According to second-level KEGG pathway data, biosynthesis of other secondary metabolites, amino acid metabolism, and folding, sorting, and degradation were enriched in Z. bungeanum. The number of expressed unigenes showed high enrichment at level 3 of the KEGG pathway. In addition, metabolism of tryptophan metabolism (ko00380), stilbenoid, diarylheptanoid, and gingerol biosynthesis (ko00945), proteasome (ko03050), isoquinoline alkaloid biosynthesis (ko00950), and following with indole alkaloid biosynthesis (ko00901), and were 17, 4, 3, 3, and 1, respectively (Figure 6).

4. Discussion

In the present study, the transcriptome analysis of Z. bungeanum under the different nutrient elements was performed. Nutrient insufficiency is often regarded as the primary constraint to development, and fertilization is the primary means of compensating for this limitation. The effects of fertilization have varied depending on the amount of fertilizer used, the number of years after the treatment, and the nutritional state of the forest site [44]. In the present study, three concentrations of N, P, K, Ca, and HZ macronutrients were used. Previous research has shown that a high level of fertilizer is more suitable for tree growth [45]. However, in our study, the growth indicators have grown better with a low dose of fertilizer, and the low level concentration was chosen for transcriptome analysis to find insect-defense response genes.
Plant phenotypic diversity in nutrient content and secondary metabolite concentrations has been linked to soil fertilization effects on the insect-defense response of the plant. The nutritional quality of plants mostly determines the insect-defense response. For most plants, fertilizer, a key protein component, is a limiting nutrient. The nutritional quality of phytophagous insects’ hosts usually limits their development and reproduction, which normally rises as the treatment content of the plant increases. Insects often benefit from fertilization because it improves the nutritional quality of their host plant [46]. In recent times, transcriptome sequencing has become the best method for the differential expression analysis of RNA populations [47], including rRNAs [48], miRNAs [49], tRNAs, and other small RNAs [50]. In this study, we compared the transcriptomes of Z. bungeanum under the N, P, K, Ca, and HZ treatments and CK groups. The total of 65,566 unigenes, including 61,379 annotated and 4187 novel genes, as well as identified 9249 DEGs, is a significant resource that can be utilized in future research on plant engineering in general and Z. bungeanum shrub in particular, including an investigation into the processes underlying defense response against insects and phytopathogens. In this study, using the “Cluster Profiler” 2R software, we investigated 294 candidate insect-defense response genes, including 204 “Protease inhibitor,” 29 “Plant lectin,” and 61 “Other insect-defense response genes” families in the leaves of Z. bungeanum after they were fertilized with macronutrients and a special fertilizer for pepper. Furthermore, the expression of defense response genes of the protease inhibitor gene class, including trypsin inhibitors, cystatin, phytepsin, metalloproteinase, MMP, caffeic acid, resveratrol, and proteinase inhibitors. Moreover, allium cepa agglutinin (ACA) lectin of the plant lectin gene class and other insect resistance genes such as TDC (tryptophan decarboxylase) and BES1 (BRI1-EMS-SUPPRESSOR1) in Z. bungeanum treated with macronutrients showed abundance.
The potential of protease inhibitors as efficient anti-digestive chemicals to protect agricultural plants from predation or pathogenic infection has been described in several articles [51,52]. Therefore, those protease inhibitors act against insect pests by binding to the active sites of a variety of insect digestive proteases and blocking proteolytic action, resulting in a reduced disruption of dietary protein digestion. This action lowers the levels of critical amino acids in the insect gut, which are needed for insect growth and adult survival, as well as larval growth and development [53]. Plant protease inhibitors also play a role in cell death [54] and other plant defense mechanisms against pests and diseases [55]. Serine protease inhibitors, in particular, have been quickly recognized as possible applicants for developing defense response in transgenic plants against insects [56,57,58]. For example, increasing the production and accumulation of serine proteinase inhibitors decreases herbivore attacks on Solanum nigrum [59]. Moreover, G. max trypsin inhibitors have been shown to be toxic to Tribolum confusum [60]. In short-term assays, da Silva, et al. [61] observed that higher levels of trypsin inhibitor in Adenanthera pavonina inhibited Diatraea saccharalis larvae trypsin and chymotrypsin by 87% and 63%, respectively. Treatment of caffeic acid significantly inhibits the detoxification enzymes of insects, thus resulting in the stronger insecticidal effect [62]. Based on the high amount of caffeic acid in our study, we suggest that caffeic acid may help to improve the insecticidal potential of plants by inhibiting insect feeding [63].
Over the past several years it has gradually become clear that lectins play two major roles in plants. First, they are stores of proteins that can be mobilized for plant growth and development. Second, they are part of the plant defense against herbivores and pathogens [64]. Several studies have described that the number of metalloprotease inhibitors is very low in plants [65]. However, in our study, expression of metalloproteinases was higher in all treated plants, especially in those that were treated with Ca and HZ. We also found that when we used N, P, and K fertilizers, the level of metalloproteinases was lower than the CK group. This finding suggests that the type of fertilizer has an impact on the relative abundance of plant genes. Macedo, et al. [66] found carbohydrate-binding proteins, plant lectins that interact with glycoproteins and glycan structures in insect intestines, exhibit antinutritional or insecticidal properties. For example, Allium cepa agglutinin (ACA; onion lectin) inhibits nutrient intake and growth in a variety of insects [67]. As a result, the ACA lectin that was found in our research could play a role in Z. bungeanum defense response, as described in previous research on the other types of plants [68].
Previous research has shown that Ca treatment in plants has a significant impact on the population parameters and preferences of Frankliniella occidentalis [69] and tomato biotic stresses [70]. In this study, it is hypothesized that the high value of expressed protease inhibitor genes in Z. bungeanum that was treated with Ca and HZ (special fertilizer for peppers) nutrients, may alter insect distribution in plants by making them less interested in feeding, perhaps protecting plants from herbivores. However, there is no evidence that confirm fertilization had any effect on the ability of either species in terms of insect-defense response, and further studies need to be carried out to analyze the functional characterization of these genes.
On the other hand, Herms [46] well discussed in his review that fertilizers not only have beneficial effects, but also have a negative influence on plant growth and resistance. For example, the large number of fertilizations increases the abundance of herbivores feeding on the plants because of the increased nutritional value of plants. Moreover, fertilization has no impact and/or decreases the activity of the primary and secondary metabolisms [46]. Plant chemical molecules have typically been classified as primary and secondary metabolites. Growth, development, and reproduction are all aided by primary metabolites. Secondary metabolites, also known as bioactive specialized chemicals, defend plants from herbivory and pathogens, attract pollinators and seed-dispersing animals, and function as agents in plant–plant competition and plant–microbe symbiosis [71]. Bioactive specialized chemicals are generated constitutively, and are targeted specifically against biological systems particular to herbivores, such as the neurological, digestive, and endocrine organs [72]. In this study, GO categorizes activities of candidate genes using bioinformatic methods to assign them to molecular functions, cellular components, and biological processes. As a result, the most enriched ontologies were extracellular structure organization, collagen catabolic process, collagen metabolic process, and extracellular matrix organization in biological processes (56%). In comparison, the abundant subcategory for molecular function (33%) was metalloendopeptidase, enzyme inhibitor activity, endopeptidase inhibitor activity, peptidase inhibitor activity, and metalloendopeptidase activity, and the relative predominant subcategory in cellular component (8%) was extracellular matrix, proteasome complex, and peptidase complex (p < 0.05), which might be significant for the defense response in Z. bungeanum. The GO terms for Allium sativum’s mannose-binding insecticidal lectin genes were also predicted [73]. Plant cell walls provide a variety of physiological functions, including regulating turgor pressure, intercellular communication, and pest and pathogen protection [74]. In several studies, it has been described that aphid salivary secretions contain some cell-wall-degrading enzymes, such as polygalacturonases and pectinmethylesterases, that the insect uses for stylet penetration [75]. In this regard, the extracellular matrix may offer structural support to cells and tissues, and the biological activities and features of the plant cell wall are vital for defense [76]. Moreover, the KEGG pathway assignments were then used to provide genes in metabolic pathways with alternate functional annotations. Plant defense is influenced by the efficiency of the plant’s protective primary metabolites, such as carbohydrate and amino acid metabolisms [77]. This investigation yielded 55 DEGs related to secondary metabolites, amino acid metabolism, and folding, sorting, and degradation, 5 of which were highly enriched in Z. bungeanum after fertilization. The metabolism of particular amino acids influences plant defense response to infections and insects because many plant defense molecules are produced from amino acids [78].
Previous research showed that several amino acid metabolic pathways play a significant role in the immune system of plants [79]. In this study, unigenes involved in tryptophan metabolism stilbenoid, diarylheptanoid, and gingerol biosynthesis; proteasome; isoquinoline alkaloid biosynthesis; and indole alkaloid biosynthesis were all substantially expressed in Z. bungeanum. Among them, tyrosine and tryptophan are considered as sources of a variety of secondary metabolites that are involved in plant defense against biotic stress [80]. Iven, et al. [81] found that tryptophan metabolites influence root vascular fungus susceptibility. Moreover, high expression of tryptophan increased the defense response of poplar to Malacosoma disstria (forest tent caterpillar) by affecting feeding potential and physiology [82]. In our study, tryptophan metabolism was the most enriched biological activity, and we suppose that it can help improve the defense response activity of Z. bungeanum. Previous study demonstrated that Solanum demissum (nightshade potato) containing the alkaloid is resistant to Empoasca fabae (potato leafhopper) and Leptinotarsa decemlineata (Colorado beetle) [83]. Furthermore, some studies have shown alkaloids have played an important role in antibacterial and antifungal activities [84]. It suggests that alkaloids may be able to regulate plant defense against pathogens and herbivores. The other studies suggest that these secondary metabolites have a variety of effects on the insect, including blocking receptors and channels in the nervous system, inhibiting cellular respiration, and disrupting the insect’s hormonal balance [85].

5. Conclusions

In conclusion, the transcriptome of Z. bungeanum under different treatments (N, P, K, Ca, and HZ) was first sequenced by a BGISEQ-500 system. In this study, 65,566 unigenes, including 4187 novel genes, were assembled, and 9249 DEGs were identified. Highly expressed candidate insect-defense response genes were also identified. The expression levels of insect-defense response genes related to the protease inhibitor, plant lectin, and other insect-resistance genes were analyzed, and several genes related to them were expressed. The results demonstrated that expressed candidate 294 unigenes can play an important role in the defense response of Z. bungeanum. The GO enrichment results demonstrated that collagen catabolic process, extracellular structure organization, collagen metabolic process, extracellular matrix, metalloendopeptidase, enzyme inhibitor, endopeptidase inhibitor, peptidase inhibitor, and extracellular matrix gene activities might be significant for insect-defense response in Z. bungeanum. The KEGG pathway analysis of DEGs indicated that the tryptophan metabolism, indole and isoquinoline alkaloid biosynthesis, also might be playing a role in the defense of Z. bungeanum. We suggest that a low concentration of fertilizer is more optimal for both primary and secondary metabolism.
Our results provide valuable information for future forest protection research. Therefore, future studies should focus on the biochemistry and bioactivities of Z. bungeanum. Other plant components, such as flowers and root bark, should be explored and tested on various insect species, as well as stem bark, seeds, and leaves. The repellent and synergistic effects of component compounds should be investigated and the active compound’s method of action.

Supplementary Materials

The following supporting information can be downloaded at: https://www.mdpi.com/article/10.3390/f13091365/s1, Table S1: Insect-resistance genes. Table S2: Summary of the Zanthoxylum bungeanum transcriptome.

Author Contributions

Project design: M.L., F.L. and K.K. Data analysis: T.Z. and M.N. Manuscript preparation: K.K., Z.N. and M.N. Preparation of plant materials: K.K. All authors have read and agreed to the published version of the manuscript.

Funding

This research was funded by Science and Technology Innovation Project of Shaanxi Province, Science and Technology department (2016KTTSNY03-02).

Institutional Review Board Statement

Not applicable.

Informed Consent Statement

Not applicable.

Data Availability Statement

All the reads of Z. bungeanum were submitted to the National Center for Biotechnology Information (NCBI) GenBank assembly accession under the number GCA_01945045.1 with Bio Project PRJNA524242.

Acknowledgments

The authors gratefully acknowledge the funding support and are thankful to Rahat Sharif (College of Plant Protection), Yangzhou University, and Zaid Ashiq Khan (College of Economics and Management), Northwest A and F University, China, for the critical revision of the manuscript and improving the language of the paper.

Conflicts of Interest

The authors declare no conflict of interest.

Abbreviations

cDNA: Complementary DNA; NCBI: National Center for Biotechnology Information; KEGG: Kyoto Encyclopedia of Genes and Genomes; KO: KEGG Ontology; GO: Gene Ontology; FPKM: The Fragments per Kilobase of Transcript Sequence per Million; FC: Fold Change; DEGs: Differentially Expressed Genes; FDR: False Discovery Rate; TDC: Tryptophan decarboxylase; BES1: BRI1-EMS-SUPPRESSOR1; ACA: Allium cepa agglutinin.

References

  1. Hu, Y.; Tian, L.; Shi, J.; Tian, J.; Zhao, L.; Feng, S.; Wei, A. Genetic structure of cultivated Zanthoxylum species investigated with SSR markers. Tree Genet. Genomes 2018, 14, 89. [Google Scholar] [CrossRef]
  2. Fei, X.; Shi, Q.; Yang, T.; Fei, Z.; Wei, A. Expression Stabilities of Ten Candidate Reference Genes for RT-qPCR in Zanthoxylum bungeanum Maxim. Molecules 2018, 23, 802. [Google Scholar] [CrossRef]
  3. Sun, J.; Sun, B.; Ren, F.; Chen, H.; Zhang, N.; Zhang, Y.; Zhang, H. Effects of Storage Conditions on the Flavor Stability of Fried Pepper (Zanthoxylum bungeanum) Oil. Foods 2021, 10, 1292. [Google Scholar] [CrossRef]
  4. Yu, X.; Zheng, X.; Kan, J.; Guo, J. Evaluation of specific quality of Zanthoxylum bungeanum Maxim and Zanthoxylum schinifolium Sieb. et Zucc. Food Sci. 2009, 30, 45–48. [Google Scholar]
  5. Yang, F.X.; Su, Y.Q.; Li, X.H.; Zhang, Q.; Sun, R.C. Studies on the preparation of biodiesel from Zanthoxylum bungeanum Maxim seed oil. J. Agric. Food Chem. 2008, 56, 7891–7896. [Google Scholar] [CrossRef]
  6. Artaria, C.; Maramaldi, G.; Bonfigli, A.; Rigano, L.; Appendino, G. Lifting properties of the alkamide fraction from the fruit husks of Zanthoxylum bungeanum. Int. J. Cosmet. Sci. 2011, 33, 328–333. [Google Scholar] [CrossRef]
  7. Zhang, M.; Wang, J.; Zhu, L.; Li, T.; Jiang, W.; Zhou, J.; Peng, W.; Wu, C. Zanthoxylum bungeanum Maxim. (Rutaceae): A Systematic Review of Its Traditional Uses, Botany, Phytochemistry, Pharmacology, Pharmacokinetics, and Toxicology. Int. J. Mol. Sci. 2017, 18, 2172. [Google Scholar] [CrossRef]
  8. He, W.; Puyvelde, L.V.; Kimpe, N.D.; Verbruggen, L.; Anthonissen, K.; Flaas, M.V.d.; Bosselaers, J.; Mathenge, S.G.; Mudida, F.P. Chemical constituents and biological activities of Zanthoxylum usambarense. Phytother. Res. 2002, 16, 66–70. [Google Scholar] [CrossRef]
  9. Chen, J.-J.; Lin, Y.-H.; Day, S.-H.; Hwang, T.-L.; Chen, I.-S. New benzenoids and anti-inflammatory constituents from Zanthoxylum nitidum. Food Chem. 2011, 125, 282–287. [Google Scholar] [CrossRef]
  10. Doh, E.J.; Yang, N.; Ji, M.-G.; Lee, G.-S.; Ju, Y.-S.; Lee, J.H.; Ko, B.S.; Oh, S.-E. Discrimination of Kalopanax pictus from its varieties and other ‘Kalopanacis Cortex’plants by multiplex polymerase chain reaction (PCR). Genes Genom. 2011, 33, 711–719. [Google Scholar] [CrossRef]
  11. Wei, S.; Zhang, H.; Wang, Y.; Wang, L.; Li, X.; Wang, Y.; Zhang, H.; Xu, X.; Shi, Y. Ultrasonic nebulization extraction-heating gas flow transfer-headspace single drop microextraction of essential oil from pericarp of Zanthoxylum bungeanum Maxim. J. Chromatogr. A 2011, 1218, 4599–4605. [Google Scholar] [CrossRef] [PubMed]
  12. Tantapakul, C.; Phakhodee, W.; Ritthiwigrom, T.; Yossathera, K.; Deachathai, S.; Laphookhieo, S. Antibacterial compounds from Zanthoxylum rhetsa. Arch. Pharmacal Res. 2012, 35, 1139–1142. [Google Scholar] [CrossRef] [PubMed]
  13. Feng, S.; Yang, T.; Li, X.; Chen, L.; Liu, Z.; Wei, A. Genetic relationships of Chinese prickly ash as revealed by ISSR markers. Biologia 2015, 70, 45–51. [Google Scholar] [CrossRef]
  14. López-Arredondo, D.L.; Sánchez-Calderón, L.; Yong-Villalobos, L. Molecular and genetic basis of plant macronutrient use efficiency: Concepts, opportunities, and challenges. In Plant Macronutrient Use Efficiency; Elsevier: Amsterdam, The Netherlands, 2017; pp. 1–29. [Google Scholar]
  15. Hillel, D.; Hatfield, J.L. Encyclopedia of Soils in the Environment; Elsevier: Amsterdam, The Netherlands, 2005; Volume 3. [Google Scholar]
  16. Food and Agriculture Organization of the United Nations (FAO). FAOSTAT Statistics Database; FAO: Rome, Italy, 2017. [Google Scholar]
  17. López-Arredondo, D.L.; Leyva-González, M.A.; González-Morales, S.I.; López-Bucio, J.; Herrera-Estrella, L. Phosphate nutrition: Improving low-phosphate tolerance in crops. Annu. Rev. Plant Biol. 2014, 65, 95–123. [Google Scholar] [CrossRef]
  18. Wang, Y.; Wu, W.-H. Potassium transport and signaling in higher plants. Annu. Rev. Plant Biol. 2013, 64, 451–476. [Google Scholar] [CrossRef] [PubMed]
  19. Bass, J.; Lazar, M.A. Circadian time signatures of fitness and disease. Science 2016, 354, 994–999. [Google Scholar] [CrossRef]
  20. Zhu, J.-K. Abiotic stress signaling and responses in plants. Cell 2016, 167, 313–324. [Google Scholar] [CrossRef]
  21. Pandey, P.; Irulappan, V.; Bagavathiannan, M.V.; Senthil-Kumar, M. Impact of combined abiotic and biotic stresses on plant growth and avenues for crop improvement by exploiting physio-morphological traits. Front. Plant Sci. 2017, 8, 537. [Google Scholar] [CrossRef]
  22. Liu, Y.; He, C. A review of redox signaling and the control of MAP kinase pathway in plants. Redox Biol. 2017, 11, 192–204. [Google Scholar] [CrossRef]
  23. Qi, J.; Wang, J.; Gong, Z.; Zhou, J.-M. Apoplastic ROS signaling in plant immunity. Curr. Opin. Plant Biol. 2017, 38, 92–100. [Google Scholar] [CrossRef]
  24. Chen, L.-L.; Wang, H.-Y.; Gong, X.-C.; Zeng, Z.-H.; Xue, X.-Z.; Hu, Y.-G. Transcriptome analysis reveals effects of red and blue light-emitting diodes (LEDs) on the growth, chlorophyll fluorescence and endogenous plant hormones of potato (Solanum tuberosum L.) plantlets cultured in vitro. J. Integr. Agric. 2021, 20, 2914–2931. [Google Scholar] [CrossRef]
  25. Baginsky, S.; Hennig, L.; Zimmermann, P.; Gruissem, W. Gene Expression Analysis, Proteomics, and Network Discovery. Plant Physiol. 2010, 152, 402–410. [Google Scholar] [CrossRef] [PubMed]
  26. Fang, Y.; Huang, J.; Huang, X.; Chen, S.; Zou, P.; Li, W.; Yu, K.; Liu, Y. Generation of expressed sequence tags from a cDNA library of Coleus forskohlii for identification of genes involved in terpene biosynthesis. Biol. Plant. 2015, 59, 463–468. [Google Scholar] [CrossRef]
  27. Liao, J.-L.; Zhou, H.-W.; Peng, Q.; Zhong, P.-A.; Zhang, H.-Y.; He, C.; Huang, Y.-J. Transcriptome changes in rice (Oryza sativa L.) in response to high night temperature stress at the early milky stage. BMC Genom. 2015, 16, 18. [Google Scholar] [CrossRef]
  28. Hou, D.-Y.; Shi, L.-C.; Yang, M.-M.; Li, J.; Zhou, S.; Zhang, H.-X.; Xu, H.-W. De novo transcriptomic analysis of leaf and fruit tissue of Cornus officinalis using Illumina platform. PLoS ONE 2018, 13, e0192610. [Google Scholar] [CrossRef]
  29. Yu, X.; Wang, T.; Zhu, M.; Zhang, L.; Zhang, F.; Jing, E.; Ren, Y.; Wang, Z.; Xin, Z.; Lin, T. Transcriptome and physiological analyses for revealing genes involved in wheat response to endoplasmic reticulum stress. BMC Plant Biol. 2019, 19, 193. [Google Scholar] [CrossRef]
  30. Mu, W.; Wei, J.; Yang, T.; Fan, Y.; Cheng, L.; Yang, J.; Mu, R.; Liu, J.; Zhao, J.; Sun, W.; et al. RNA Extraction for Plant Samples Using CTAB-pBIOZOL; Protocols.io: Berkeley, CA, USA, 2017. [Google Scholar] [CrossRef]
  31. Niu, J.-Z.; Dou, W.; Ding, T.-B.; Shen, G.-M.; Zhang, K.; Smagghe, G.; Wang, J.-J. Transcriptome analysis of the citrus red mite, Panonychus citri, and its gene expression by exposure to insecticide/acaricide. Insect Mol. Biol. 2012, 21, 422–436. [Google Scholar] [CrossRef]
  32. Fang, C.; Zhong, H.; Lin, Y.; Chen, B.; Han, M.; Ren, H.; Lu, H.; Luber, J.M.; Xia, M.; Li, W.; et al. Assessment of the cPAS-based BGISEQ-500 platform for metagenomic sequencing. Gigascience 2018, 7, gix133. [Google Scholar] [CrossRef]
  33. Zhang, G.-H.; Ma, C.-H.; Zhang, J.-J.; Chen, J.-W.; Tang, Q.-Y.; He, M.-H.; Xu, X.-Z.; Jiang, N.-H.; Yang, S.-C. Transcriptome analysis of Panax vietnamensis var. fuscidicus discovers putative ocotillol-type ginsenosides biosynthesis genes and genetic markers. BMC Genom. 2015, 16, 159. [Google Scholar] [CrossRef]
  34. Grabherr, M.G.; Haas, B.J.; Yassour, M.; Levin, J.Z.; Thompson, D.A.; Amit, I.; Adiconis, X.; Fan, L.; Raychowdhury, R.; Zeng, Q.; et al. Full-length transcriptome assembly from RNA-Seq data without a reference genome. Nat. Biotechnol. 2011, 29, 644–652. [Google Scholar] [CrossRef] [Green Version]
  35. Ye, J.; Zhang, Y.; Cui, H.; Liu, J.; Wu, Y.; Cheng, Y.; Xu, H.; Huang, X.; Li, S.; Zhou, A.; et al. WEGO 2.0: A web tool for analyzing and plotting GO annotations, 2018 update. Nucleic Acids Res. 2018, 46, W71–W75. [Google Scholar] [CrossRef]
  36. Conesa, A.; Götz, S.; García-Gómez, J.M.; Terol, J.; Talón, M.; Robles, M. Blast2GO: A universal tool for annotation, visualization and analysis in functional genomics research. Bioinformatics 2005, 21, 3674–3676. [Google Scholar] [CrossRef]
  37. Langmead, B.; Salzberg, S.L. Fast gapped-read alignment with Bowtie 2. Nat. Methods 2012, 9, 357–359. [Google Scholar] [CrossRef]
  38. Li, B.; Dewey, C.N. RSEM: Accurate transcript quantification from RNA-Seq data with or without a reference genome. BMC Bioinform. 2011, 12, 323. [Google Scholar] [CrossRef]
  39. Anders, S.; Huber, W. Differential expression analysis for sequence count data. Genome Biol. 2010, 11, R106. [Google Scholar] [CrossRef]
  40. Haynes, W. Benjamini–Hochberg Method. In Encyclopedia of Systems Biology; Dubitzky, W., Wolkenhauer, O., Cho, K.-H., Yokota, H., Eds.; Springer: New York, NY, USA, 2013; p. 78. [Google Scholar]
  41. Murtagh, F.; Legendre, P. Ward’s Hierarchical Agglomerative Clustering Method: Which Algorithms Implement Ward’s Criterion? J. Classif. 2014, 31, 274–295. [Google Scholar] [CrossRef]
  42. Yu, G.; Wang, L.G.; Han, Y.; He, Q.Y. clusterProfiler: An R package for comparing biological themes among gene clusters. Omics 2012, 16, 284–287. [Google Scholar] [CrossRef]
  43. Hou, R.; Bao, Z.; Wang, S.; Su, H.; Li, Y.; Du, H.; Hu, J.; Wang, S.; Hu, X. Transcriptome sequencing and de novo analysis for Yesso scallop (Patinopecten yessoensis) using 454 GS FLX. PLoS ONE 2011, 6, e21560. [Google Scholar] [CrossRef]
  44. Moilanen, M.; Hökkä, H. The growth response of Scots pine to PK fertilization depends on the nutrient status of the stand on drained peatlands. Suo 2009, 60, 111–119. [Google Scholar]
  45. Guo, J.; Wu, Y.; Wang, B.; Lu, Y.; Cao, F.; Wang, G. The effects of fertilization on the growth and physiological characteristics of Ginkgo biloba L. Forests 2016, 7, 293. [Google Scholar]
  46. Herms, D.A. Effects of Fertilization on Insect Resistance of Woody Ornamental Plants: Reassessing an Entrenched Paradigm. Environ. Entomol. 2002, 31, 923–933. [Google Scholar] [CrossRef]
  47. Mortazavi, A.; Williams, B.A.; McCue, K.; Schaeffer, L.; Wold, B. Mapping and quantifying mammalian transcriptomes by RNA-Seq. Nat. Methods 2008, 5, 621–628. [Google Scholar] [CrossRef] [PubMed]
  48. Elekwachi, C.O.; Wang, Z.; Wu, X.; Rabee, A.; Forster, R.J. Total rRNA-Seq analysis gives insight into bacterial, fungal, protozoal and archaeal communities in the rumen using an optimized RNA isolation method. Front. Microbiol. 2017, 8, 1814. [Google Scholar] [CrossRef] [PubMed]
  49. Wang, N.; Wang, R.; Wang, R.; Tian, Y.; Shao, C.; Jia, X.; Chen, S. The integrated analysis of RNA-seq and microRNA-seq depicts miRNA-mRNA networks involved in Japanese flounder (Paralichthys olivaceus) albinism. PLoS ONE 2017, 12, e0181761. [Google Scholar]
  50. Chung, M.; Bruno, V.M.; Rasko, D.A.; Cuomo, C.A.; Muñoz, J.F.; Livny, J.; Shetty, A.C.; Mahurkar, A.; Dunning Hotopp, J.C. Best practices on the differential expression analysis of multi-species RNA-seq. Genome Biol. 2021, 22, 121. [Google Scholar] [CrossRef]
  51. Michaud, D. Recombinant Protease Inhibitors in Plants; CRC Press: Sainte-Foy, QC, Canada, 2001. [Google Scholar]
  52. Haq, S.K.; Atif, S.M.; Khan, R.H. Protein proteinase inhibitor genes in combat against insects, pests, and pathogens: Natural and engineered phytoprotection. Arch. Biochem. Biophys. 2004, 431, 145–159. [Google Scholar] [CrossRef]
  53. Stevens, J.A.; Dunse, K.M.; Guarino, R.F.; Barbeta, B.L.; Evans, S.C.; West, J.A.; Anderson, M.A. The impact of ingested potato type II inhibitors on the production of the major serine proteases in the gut of Helicoverpa armigera. Insect Biochem. Mol. Biol. 2013, 43, 197–208. [Google Scholar] [CrossRef] [PubMed]
  54. Ge, Y.; Cai, Y.M.; Bonneau, L.; Rotari, V.; Danon, A.; McKenzie, E.A.; McLellan, H.; Mach, L.; Gallois, P. Inhibition of cathepsin B by caspase-3 inhibitors blocks programmed cell death in Arabidopsis. Cell Death Differ. 2016, 23, 1493–1501. [Google Scholar] [CrossRef]
  55. Swathi, M.; Mishra, P.K.; Lokya, V.; Swaroop, V.; Mallikarjuna, N.; Dutta-Gupta, A.; Padmasree, K. Purification and Partial Characterization of Trypsin-Specific Proteinase Inhibitors from Pigeonpea Wild Relative Cajanus platycarpus L. (Fabaceae) Active against Gut Proteases of Lepidopteran Pest Helicoverpa armigera. Front. Physiol. 2016, 7, 388. [Google Scholar] [CrossRef]
  56. Hilder, V.A.; Gatehouse, A.M.; Sheerman, S.E.; Barker, R.F.; Boulter, D. A novel mechanism of insect resistance engineered into tobacco. Nature 1987, 330, 160–163. [Google Scholar] [CrossRef]
  57. Duan, X.; Li, X.; Xue, Q.; Abo-EI-Saad, M.; Xu, D.; Wu, R. Transgenic rice plants harboring an introduced potato proteinase inhibitor II gene are insect resistant. Nat. Biotechnol. 1996, 14, 494–498. [Google Scholar] [CrossRef] [PubMed]
  58. Johnson, R.; Narvaez, J.; An, G.; Ryan, C. Expression of proteinase inhibitors I and II in transgenic tobacco plants: Effects on natural defense against Manduca sexta larvae. Proc. Natl. Acad. Sci. USA 1989, 86, 9871–9875. [Google Scholar] [CrossRef]
  59. Hartl, M.; Giri, A.P.; Kaur, H.; Baldwin, I.T. Serine protease inhibitors specifically defend Solanum nigrum against generalist herbivores but do not influence plant growth and development. Plant Cell 2010, 22, 4158–4175. [Google Scholar] [CrossRef] [Green Version]
  60. Fürstenberg-Hägg, J.; Zagrobelny, M.; Bak, S. Plant Defense against Insect Herbivores. Int. J. Mol. Sci. 2013, 14, 10242–10297. [Google Scholar] [CrossRef]
  61. da Silva, D.S.; de Oliveira, C.F.; Parra, J.R.; Marangoni, S.; Macedo, M.L. Short and long-term antinutritional effect of the trypsin inhibitor ApTI for biological control of sugarcane borer. J. Insect Physiol. 2014, 61, 1–7. [Google Scholar] [CrossRef]
  62. Joshi, R.S.; Wagh, T.P.; Sharma, N.; Mulani, F.A.; Sonavane, U.; Thulasiram, H.V.; Joshi, R.; Gupta, V.S.; Giri, A.P. Way toward “dietary pesticides”: Molecular investigation of insecticidal action of caffeic acid against Helicoverpa armigera. J. Agric. Food Chem. 2014, 62, 10847–10854. [Google Scholar] [CrossRef]
  63. Peres, L.L.S.; Sobreiro, A.I.; Couto, I.F.S.; Silva, R.M.; Pereira, F.F.; Heredia-Vieira, S.C.; Cardoso, C.A.L.; Mauad, M.; Scalon, S.P.Q.; Verza, S.S.; et al. Chemical Compounds and Bioactivity of Aqueous Extracts of Alibertia spp. in the Control of Plutella xylostella L. (Lepidoptera: Plutellidae). Insects 2017, 8, 125. [Google Scholar] [CrossRef]
  64. Murdock, L.L.; Shade, R.E. Lectins and protease inhibitors as plant defenses against insects. J. Agric. Food Chem. 2002, 50, 6605–6611. [Google Scholar] [CrossRef]
  65. Cotabarren, J.; Tellechea, M.E.; Tanco, S.M.; Lorenzo, J.; Garcia-Pardo, J.; Avilés, F.X.; Obregón, W.D. Biochemical and MALDI-TOF Mass Spectrometric Characterization of a Novel Native and Recombinant Cystine Knot Miniprotein from Solanum tuberosum subsp. andigenum cv. Churqueña. Int. J. Mol. Sci. 2018, 19, 678. [Google Scholar] [CrossRef]
  66. Macedo, M.L.R.; Oliveira, C.F.; Oliveira, C.T. Insecticidal activity of plant lectins and potential application in crop protection. Molecules 2015, 20, 2014–2033. [Google Scholar] [CrossRef]
  67. Vandenborre, G.; Smagghe, G.; Van Damme, E.J. Plant lectins as defense proteins against phytophagous insects. Phytochemistry 2011, 72, 1538–1550. [Google Scholar] [CrossRef]
  68. Chung, S.H.; Bigham, M.; Lappe, R.R.; Chan, B.; Nagalakshmi, U.; Whitham, S.A.; Dinesh-Kumar, S.P.; Jander, G. A sugarcane mosaic virus vector for rapid in planta screening of proteins that inhibit the growth of insect herbivores. Plant Biotechnol. J. 2021, 19, 1713–1724. [Google Scholar] [CrossRef] [PubMed]
  69. Zeng, G.; Zhi, J.-R.; Ye, M.; Xie, W.; Zhang, T.; Li, D.-Y.; Liu, L.; Wu, X.-B.; Cao, Y. Life Table and Preference Choice of Frankliniella occidentalis (Thysanoptera: Thripidae) for Kidney Bean Plants Treated by Exogenous Calcium. Insects 2021, 12, 838. [Google Scholar] [CrossRef]
  70. Ehret, D.; Utkhede, R.; Frey, B.; Menzies, J.; Bogdanoff, C. Foliar applications of fertilizer salts inhibit powdery mildew on tomato. Can. J. Plant Pathol. 2002, 24, 437–444. [Google Scholar] [CrossRef]
  71. Engelberth, J. Secondary metabolites and plant defense. New Phytol. 1994, 127, 617–633. [Google Scholar]
  72. Rosenthal, G.A.; Janzen, D.H. Herbivores: Their Interaction with Secondary Plant Metabolites; Academic Press: New York, NY, USA, 1979. [Google Scholar]
  73. Singh, R.; Verma, S.; Mohanpuria, P.; Yadav, I.S.; Sarao, N.K. Comprehensive characterization of Allium cepa leaf lectin (ACAL1) for its potential use against sap-sucking plant pests: In silico study. J. Proteins Proteom. 2021, 12, 185–199. [Google Scholar] [CrossRef]
  74. Houston, K.; Tucker, M.R.; Chowdhury, J.; Shirley, N.; Little, A. The Plant Cell Wall: A Complex and Dynamic Structure As Revealed by the Responses of Genes under Stress Conditions. Front. Plant Sci. 2016, 7, 984. [Google Scholar] [CrossRef]
  75. Stavolone, L.; Lionetti, V. Extracellular matrix in plants and animals: Hooks and locks for viruses. Front. Microbiol. 2017, 8, 1760. [Google Scholar] [CrossRef]
  76. Kular, J.K.; Basu, S.; Sharma, R.I. The extracellular matrix: Structure, composition, age-related differences, tools for analysis and applications for tissue engineering. J. Tissue Eng. 2014, 5, 2041731414557112. [Google Scholar] [CrossRef]
  77. Rojas, C.; Senthil-Kumar, M.; Tzin, V.; Mysore, K. Regulation of primary plant metabolism during plant-pathogen interactions and its contribution to plant defense. Front Plant Sci 2014, 5, 17. [Google Scholar] [CrossRef]
  78. Zeier, J. New insights into the regulation of plant immunity by amino acid metabolic pathways. Plant Cell Env. 2013, 36, 2085–2103. [Google Scholar] [CrossRef] [PubMed]
  79. Sønderby, I.E.; Geu-Flores, F.; Halkier, B.A. Biosynthesis of glucosinolates–gene discovery and beyond. Trends Plant Sci. 2010, 15, 283–290. [Google Scholar] [CrossRef] [PubMed]
  80. Killiny, N.; Hijaz, F. Amino acids implicated in plant defense are higher in Candidatus Liberibacter asiaticus-tolerant citrus varieties. Plant Signal Behav. 2016, 11, e1171449. [Google Scholar] [CrossRef]
  81. Iven, T.; König, S.; Singh, S.; Braus-Stromeyer, S.A.; Bischoff, M.; Tietze, L.F.; Braus, G.H.; Lipka, V.; Feussner, I.; Dröge-Laser, W. Transcriptional Activation and Production of Tryptophan-Derived Secondary Metabolites in Arabidopsis Roots Contributes to the Defense against the Fungal Vascular Pathogen Verticillium longisporum. Mol. Plant 2012, 5, 1389–1402. [Google Scholar] [CrossRef] [Green Version]
  82. Gill, R.I.S.; Ellis, B.E. Over-expression of Tryptophan Decarboxylase Gene in Poplar and its Possible Role in Resistance Against Malacosoma disstria. New For. 2006, 31, 195–209. [Google Scholar] [CrossRef]
  83. Harborne, J.B. Introduction to Ecological Biochemistry; Academic Press: New York, NY, USA, 2014. [Google Scholar]
  84. Thawabteh, A.; Juma, S.; Bader, M.; Karaman, D.; Scrano, L.; Bufo, S.A.; Karaman, R. The Biological Activity of Natural Alkaloids against Herbivores, Cancerous Cells and Pathogens. Toxins 2019, 11, 656. [Google Scholar] [CrossRef] [Green Version]
  85. Divekar, P.; Kumar, P.; Suby, S. Screening of maize germplasm through antiobiosis mechanism of resistance against Chilo partellus (Swinhoe). J. Entomol. Zool. Stud. 2019, 7, 1115–1119. [Google Scholar]
Figure 1. The volcano plots of differentially expressed genes (DEGs) between the N- (A), P- (B), K- (C), Ca- (D), and HZ- (E) treated and CK (control group) groups in Z. bungeanum seedlings. Significantly up-regulated unigenes are shown by red plots, whereas significantly down-regulated unigenes are represented by blue plots (p ≤ 0.05). There is no substantial differential expression in the grey plots.
Forests 13 01365 g001
Figure 2. Identification of insect-defense response genes in Z. bungeanum. The boxplots represent the percentage of FPKM value of the “Protease inhibitor,” “Plant lectins,” and “Other defense response genes” families in Z. bungeanum for N, P, K, Ca, and HZ treatments and CK groups (A). The stacked bar represents the percentage of FPKM value of the unigenes related to “Protease inhibitor,” “Plant lectins,” and “Other defense response genes” gene families. The relative abundance of each gene in the N, P, K, Ca, HZ, and CK groups is shown by each bar with different color legends (B).
Forests 13 01365 g002aForests 13 01365 g002b
Figure 3. Venn diagram representing the number of total DEGs and insect-defense response genes in Z. bungeanum.
Forests 13 01365 g003
Figure 4. Clustering of differentially expressed insect-defense response genes. Each color reflects the expression level, FPKM with log2 in sample genes, and each row represents one sample. The results in the red region indicate up-regulated genes, whereas the blue area indicates down-regulated genes.
Forests 13 01365 g004
Figure 5. Histogram presentation of gene ontology (GO) annotation and enrichment of insect-defense response genes in Z. bungeanum. The results are summarized as three main categories: biological processes, cellular components, and molecular function. The x-axis represents the number of matched genes and the y-axis shows subgroups of molecular functions from the GO classification (A). Scatterplots of GO terms enriched in insect-defense response genes in Z. bungeanum (top 38). The size of the point represents the number of genes associated with the term in the related genes and colors represent q.adjust. Fold Enrichment is the ratio of the proportion of genes related to the term (B).
Forests 13 01365 g005
Figure 6. Significantly enriched pathways in KEGG pathway analysis of expressed insect-defense response genes. The DEGs were used to identify enriched biological pathways. These are statistically significant (p < 0.05) subcategories among the KEGG pathways.
Forests 13 01365 g006
Table 1. Fertilizer Solution Configuration Scheme.
Raw Material (%)Active Ingredient Content (%)Group NameConcentration (ppm)Fertilizer Rate (mL)
CH4N2O
(46%)
(N) 21.47% N1200 Each plant 167 mL
N2400 Each plant 167 mL
N3600Each plant 167 mL
KH2PO4
(52%)
(P) 11.84%P1200 Each plant 167 mL
P2400 Each plant 167 mL
P3600 Each plant 167 mL
K2SO4
(95%)
(K) 42.63% K1200 Each plant 167 mL
K2400 Each plant 167 mL
K3600Each plant 167 mL
Ca (NO3)2 4H2O
(25%)
(Ca) 18%Ca1200 Each plant 167 mL
Ca2400 Each plant 167 mL
Ca3600 Each plant 167 mL
HZ (special fertilizer for pepper; 72.7%) (N) 12.2%
(P) 14.7%
(K) 19.1%
(Ca) 13.6%
(Mg) 2.4%
(S) 8.8%
(B) 1.9%
HZ1300 Each plant 167 mL
HZ2500 Each plant 167 mL
HZ31200 Each plant 167 mL
CK (control group) 0%CK0Each plant 167 mL
Table 2. Seedling height of Z. bungeanum after soil fertilization.
Treatment28 d56 d84 d112 d
Height/cm Height/cmHeight/cmHeight/cm
N112.46 ± 1.99 a23.23 ± 3.14 a41.66 ± 1.73 a72.73 ± 2.02 a
N27.78 ± 2.13 bc19.34 ± 1.83 a39.31 ± 3.36 a71.29 ± 4.38 a
N37.34 ± 4.40 c18.11 ± 5.65 a38.84 ± 6.11 a69.70 ± 3.45 a
CK012.01 ± 1.13 ab19.19 ± 2.07 a32.82 ± 2.78 b56.32 ± 3.65 b
P114.24 ± 1.77 a26.97 ± 3.27 a48.87 ± 2.55 a87.30 ± 2.09 a
P213.41 ± 2.04 a25.25 ± 3.43 a40.50 ± 7.59 b65.89 ± 7.72 b
P310.78 ± 3.98 a20.54 ± 3.15 b36.86 ± 4.83 bc64.98 ± 6.75 b
CK012.01 ± 1.13 a19.19 ± 2.07 b32.82 ± 2.78 c56.32 ± 3.65 c
K112.86 ± 2.41 a22.27 ± 2.33 a45.21 ± 1.96 a82.16 ± 3.15 a
K211.25 ± 2.29 a21.73 ± 3.31 a44.18 ± 7.02 a78.77 ± 8.53 ab
K310.98 ± 1.76 a20.79 ± 2.70 a42.09 ± 4.49 a74.21 ± 5.76 b
CK012.01 ± 1.13 a19.19 ± 2.07 a32.82 ± 2.78 b56.32 ± 3.65 c
Ca114.03 ± 2.90 a27.68 ± 2.33 a53.22 ± 3.02 a80.60 ± 4.79 a
Ca213.29 ± 1.01 a23.79 ± 1.74 b39.69 ± 1.66 b66.49 ± 2.83 b
Ca312.89 ± 1.33 a20.30 ± 1.98 c37.40 ± 6.93 bc63.79 ± 8.71 b
CK012.01 ± 1.13 a19.19 ± 2.07 c32.82 ± 2.78 c56.32 ± 3.65 c
HZ114.59 ± 1.76 a24.53 ± 1.96 a40.40 ± 2.31 a68.06 ± 1.66 a
HZ212.04 ± 3.59 a23.97 ± 2.76 a38.90 ± 2.39 ab67.63 ± 3.24 a
HZ311.46 ± 1.96 a21.20 ± 2.85 ab36.24 ± 3.62 bc65.29 ± 3.11 a
CK012.01 ± 1.13 a19.19 ± 2.07 b32.82 ± 2.78 c56.32 ± 3.65 b
Note: The numbers following the fertilizer’s name represent: 0—no fertilization; 1—low concentration; 2—medium concentration; and 3—high concentration. One-way analysis of variance (ANOVA) was used to test the statistical difference (p < 0.05) among the treatments. Lower case letters in each column represent the significant differences in each fertilizer treatment.
Table 3. Seedling diameter of Z. bungeanum after soil fertilization.
Treatment28 d56 d84 d112 d
Diameter/mmDiameter/mmDiameter/mmDiameter/mm
N13.40 ± 0.16 a3.85 ± 0.14 a5.21 ± 0.11 a7.05 ± 0.25 a
N22.64 ± 0.26 bc3.19 ± 0.30 b4.85 ± 0.34 a6.84 ± 0.24 a
N32.39 ± 0.88 c3.13 ± 0.49 b4.72 ± 0.57 a6.73 ± 0.31 a
CK03.20 ± 0.10 ab3.63 ± 0.15 a5.02 ± 0.30 a6.02 ± 0.47 b
P1 3.13 ± 0.20 a4.01 ± 0.30 a5.77 ± 0.27 a8.04 ± 0.34 a
P23.11 ± 0.28 a3.58 ± 0.26 b4.88 ± 0.43 b6.26 ± 0.47 b
P32.96 ± 0.22 a3.43 ± 0.19 b4.86 ± 0.35 b6.22 ± 0.70 b
CK03.20 ± 0.10 a3.63 ± 0.15 b5.02 ± 0.30 b6.02 ± 0.47 b
K13.15 ± 0.31 a3.64 ± 0.26 a5.47 ± 0.32 a7.66 ± 0.26 a
K23.12 ± 0.40 a3.61 ± 0.46 a5.35 ± 0.58 a7.13 ± 0.78 ab
K32.85 ± 0.12 a3.55 ± 0.21 a5.05 ± 0.63 a6.68 ± 1.03 bc
CK03.20 ± 0.10 a3.63 ± 0.15 a5.02 ± 0.30 a6.02 ± 0.47 c
Ca13.51 ± 0.26 a4.20 ± 0.24 a6.30 ± 0.26 a7.85 ± 0.30a
Ca22.87 ± 0.17 c3.56 ± 0.11 b4.92 ± 0.26 b6.43 ± 0.47 b
Ca32.99 ± 0.15 bc3.50 ± 0.12 b4.90 ± 0.29 b6.37 ± 0.67 b
CK03.20 ± 0.10 b3.63 ± 0.15 b5.02 ± 0.30 b6.02 ± 0.47 b
HZ13.38 ± 0.11 a3.82 ± 0.13 a5.46 ± 0.20 a7.02 ± 0.29 a
HZ23.05 ± 0.31 b3.55 ± 0.40 a5.13 ± 0.51 a6.98 ± 0.54 a
HZ33.02 ± 0.25 b3.53 ± 0.21 a5.06 ± 0.17 a6.87 ± 0.28 a
CK03.20 ± 0.10 ab3.63 ± 0.15 a5.02 ± 0.30 a6.02 ± 0.47 b
Note: The numbers following the fertilizer’s name represent: 0—no fertilization; 1—low concentration; 2—medium concentration; and 3—high concentration. One-way analysis of variance (ANOVA) was used to test the statistical difference (p < 0.05) among the treatments. Lower case letters in each column represent the significant differences in each fertilizer treatment.
Table 4. Summary of sequencing data of Z. bungeanum transcriptome.
TreatmentNPKCaHZCKAverage Number
Total Raw Reads (M)43,8243.8243.8243.8243.8243.8243.82
Total Clean Reads (M)42.8142.4942.7142.8442.7942.7242.691
Total Clean Bases (Gb)6.396.376.406.426.426.416.40
Clean Reads Q20 (%)97.9397.8898.1297.7297.7397.9097.88
Clean Reads Q30 (%)94.2393.9794.5993.6593.6294.0494.01
Clean Reads Ratio (%)97.2396.9697.4597.7597.6497.4897.42
Table 5. Summary of novel genes and genomes.
ItemNumber
Total expressed unigenes 58,964
Annotated genes 54,863
Novel genes 4101
Coding transcript 27,533
The mapped ratio of genome (%)75.28
Total protein-coding genes 65,566
Annotated protein-coding genes 61,379
Novel protein-coding genes 4187
The mapped ratio of genes (%)60.48
Publisher’s Note: MDPI stays neutral with regard to jurisdictional claims in published maps and institutional affiliations.

