Article

Influence of the Harvesting Region on Batch Homogeneity of Ipe Wood (Tabebuia sp.) Based on Its Physical and Mechanical Properties

by
Herisson Ferreira dos Santos
1,
Matheus Henrique Morato de Moraes
2,*,
Ivanildo Amorim de Oliveira
1,
Ludmila de Freitas
1,
Vinícius Borges de Moura Aquino
2,
Isabella Silva Menezes
2,
Iuri Fazolin Fraga
2,
Francisco Antonio Rocco Lahr
3,
Fernando Júnior Resende Mascarenhas
2,
Fernando Menezes de Almeida Filho
2 and
André Luis Christoforo
2
1
Department of Engineering, Federal Institute of Rondonia, Ariquemes 76870-000, Rondonia, Brazil
2
Department of Civil Engineering, Federal University of Sao Carlos, Sao Carlos 13565-905, Sao Paulo, Brazil
3
Sao Carlos Engineering School, University of Sao Paulo, Sao Carlos 13566-590, Sao Paulo, Brazil
*
Author to whom correspondence should be addressed.
Forests 2022, 13(9), 1385; https://doi.org/10.3390/f13091385
Submission received: 28 July 2022 / Revised: 23 August 2022 / Accepted: 24 August 2022 / Published: 30 August 2022
(This article belongs to the Section Wood Science and Forest Products)

Abstract

:
This paper aims to evaluate the hypothesis regarding the homogeneity of wood batches, as provided in the Brazilian standard for wooden structures ABNT NBR 7190 through an experimental study simulating the condition of a sawmill where the control of the harvest region, location of the sample in the trunk, edaphoclimatic condition, relief, and vegetation are variables that cannot be controlled. An experimental study was performed on 15 properties (3 physical and 12 mechanical) of Ipe (Tabebuia sp.) wood. Batches from three harvesting regions (Mucajaí [RR-A], Bonfim [RR-B], and Cláudia [MT]) were used to verify the existence of significant differences between the properties of the three areas. The properties were obtained following the test methods established in ABNT NBR 7190-3, with 540 specimens being manufactured and characterized, prior to being submitted to a statistical analysis, where ANOVA was applied with the Anderson–Darling normality test, the homogeneity of variance of multiple comparisons, and the Tukey test. Statistical analysis indicated that the wood harvesting regions showed significant differences in six (40%) and non-significant differences in nine (60%) of the fifteen properties evaluated. Among the properties evaluated, the compressive strength parallel to the grain (fc0) showed significant differences. This property is used to classify the wood strength class according to the Brazilian standard ABNT NBR 7190-1. The batches from the harvesting regions RR-A, RR-B, and MT were classified using the strength classes D60, D50, and D50, respectively. These results directly impact the consideration of the homogeneity of the batches, considering that the sawmills receive samples from different regions. For future research, a numerical method can be applied to consider the influence of the wood harvesting area.

1. Introduction

Wood is widely used in construction [1,2,3,4,5,6], roof structures, bridges, and furniture applications. Wood is a natural and renewable resource, presenting a good relationship between mechanical strength and density [7,8], which makes it possible to apply wood for structural purposes [9,10].
Brazil has a significant potential for the use of wood for structural applications, owing to the diversity of wood species present in the Brazilian flora. According to Steege et al. [11], between 1707 and 2015, 11,194 tree species, 1225 genera, and 140 families were cataloged in the Amazon Basin. The Amazon Rainforest contains 6,850,476 km², with an estimated 16,000 tree species, with Brazil holding a large portion of this area (4,102,893 km²) and 7694 cataloged species (with an estimated 12,655 species). Brazil is a country of continental dimensions [12], with 8,510,295 km², which results in a diversity of climatic zones and morphostructural domains that cause different edaphoclimatic conditions for different regions of the country.
The trees of the same species planted in different harvesting regions are subjected to different soil and climate conditions, thus causing variations in their physical and mechanical properties, as noted in the research by Lahr et al. [13], Silva et al. [14], Aquino et al. [15], and Teixeira et al. [16]. They considered wood from native forests in their research. Studies developed to assess the influence within different harvesting region areas showed varying results, with significant and non-significant differences [16,17,18]. Therefore, existing studies do not answer all the questions in this area, so studying different species under different conditions is necessary.
Regarding the reforestation of woods, Moraes Neto et al. [17] analyzed the changes in wood’s physical and mechanical properties in five regions from Pinus caribaea var. Hondurensis from Central America, extracted in the Cerrado of the Federal District in Brazil, with a harvest age of 23 years. The physical properties of the wood studied were density and dimensional stability (shrinkage and expansion, as a function of water content), and the mechanical properties consisted of strength to compression, bending, tension, shear, and cracking. No significant differences were observed in all analyzed characteristics.
Fernandes et al. [19] applied provenance tests on the silvicultural behavior of the species Pinus sylvestris (Scots pine) populations. In this study, the effect of harvesting regions on wood properties was analyzed, with specimens from five forest sites in Portugal (Marão, Vinhais, Peneda, Gerês, and Serra da Estrela), with an average age of 55 years. The harvesting area significantly influenced the densities studied, as well as the other properties analyzed in this study.
Brazilian and foreign tree species have aroused the interest of several researchers interested in proving their adaptability [18,20,21,22,23], which has strengthened the application of wood in areas previously unsuitable for other species.
The Tabebuia genus has characteristics of high-density wood, high hardness, and adaptability to different conditions, allowing it to be applied in heavy construction and external structures. It constituting an essential group of neotropical species distributed from the southwest United States of America to northern Chile and Argentina [24]. There are several species of Ipes in Brazil; the species of Ipê (Tabebuia sp.) belongs to the Cerrado biome, being present in the states of Mato Grosso do Sul, Goiás, São Paulo, Minas Gerais, and Paraná. Due to its physical and mechanical characteristics, it is widely used in rural constructions and has been the object of study in several areas [25,26,27,28,29].
As discussed in the studies by Lima et al. [30], Fernandes et al. [19], Krzosek et al. [31], Tumenjargal et al. [32], You et al. [33], and Aquino et al. [15], the harvesting region is a variable that can significantly affect the physical and mechanical properties of wood. Teixeira et al. [16] claim that this condition occurs because sawmills, which sell wood for civil construction, receive species from different regions. This factor will be considered in future versions of the Brazilian standard ABNT NBR 7190 [34], which considers the batches to be homogeneous, since the harvesting region sources may impact the variability and consequently, the batch’s homogeneity.
As mentioned above, the harvesting regions may influence the wood’s physical and mechanical properties. Besides this, the Brazilian standard for wooden structures [34] considers homogeneous batches obtained from native forests. Therefore, this study aims to evaluate the homogeneity hypothesis, established by Brazilian wood structure standards [34], through an experimental study simulating the condition of a sawmill, considering that the harvesting region, location of the sample in the trunk, edaphoclimatic condition, relief, and vegetation are variables that could not be controlled. Fifteen properties (three physical and twelve mechanical) of the Ipe wood (Tabebuia sp.) were evaluated. Batches from three harvesting regions (Mucajaí-RR-A, Bonfim-RR-B, and Cláudia-MT) were considered. Statistical analysis was performed to verify the existence of significant differences among the properties of the three harvesting regions. Thus, the main goal of this work was to evaluate the premise of homogeneous batches established in the ABNT NBR 7190 standard [34].

2. Materials and Methods

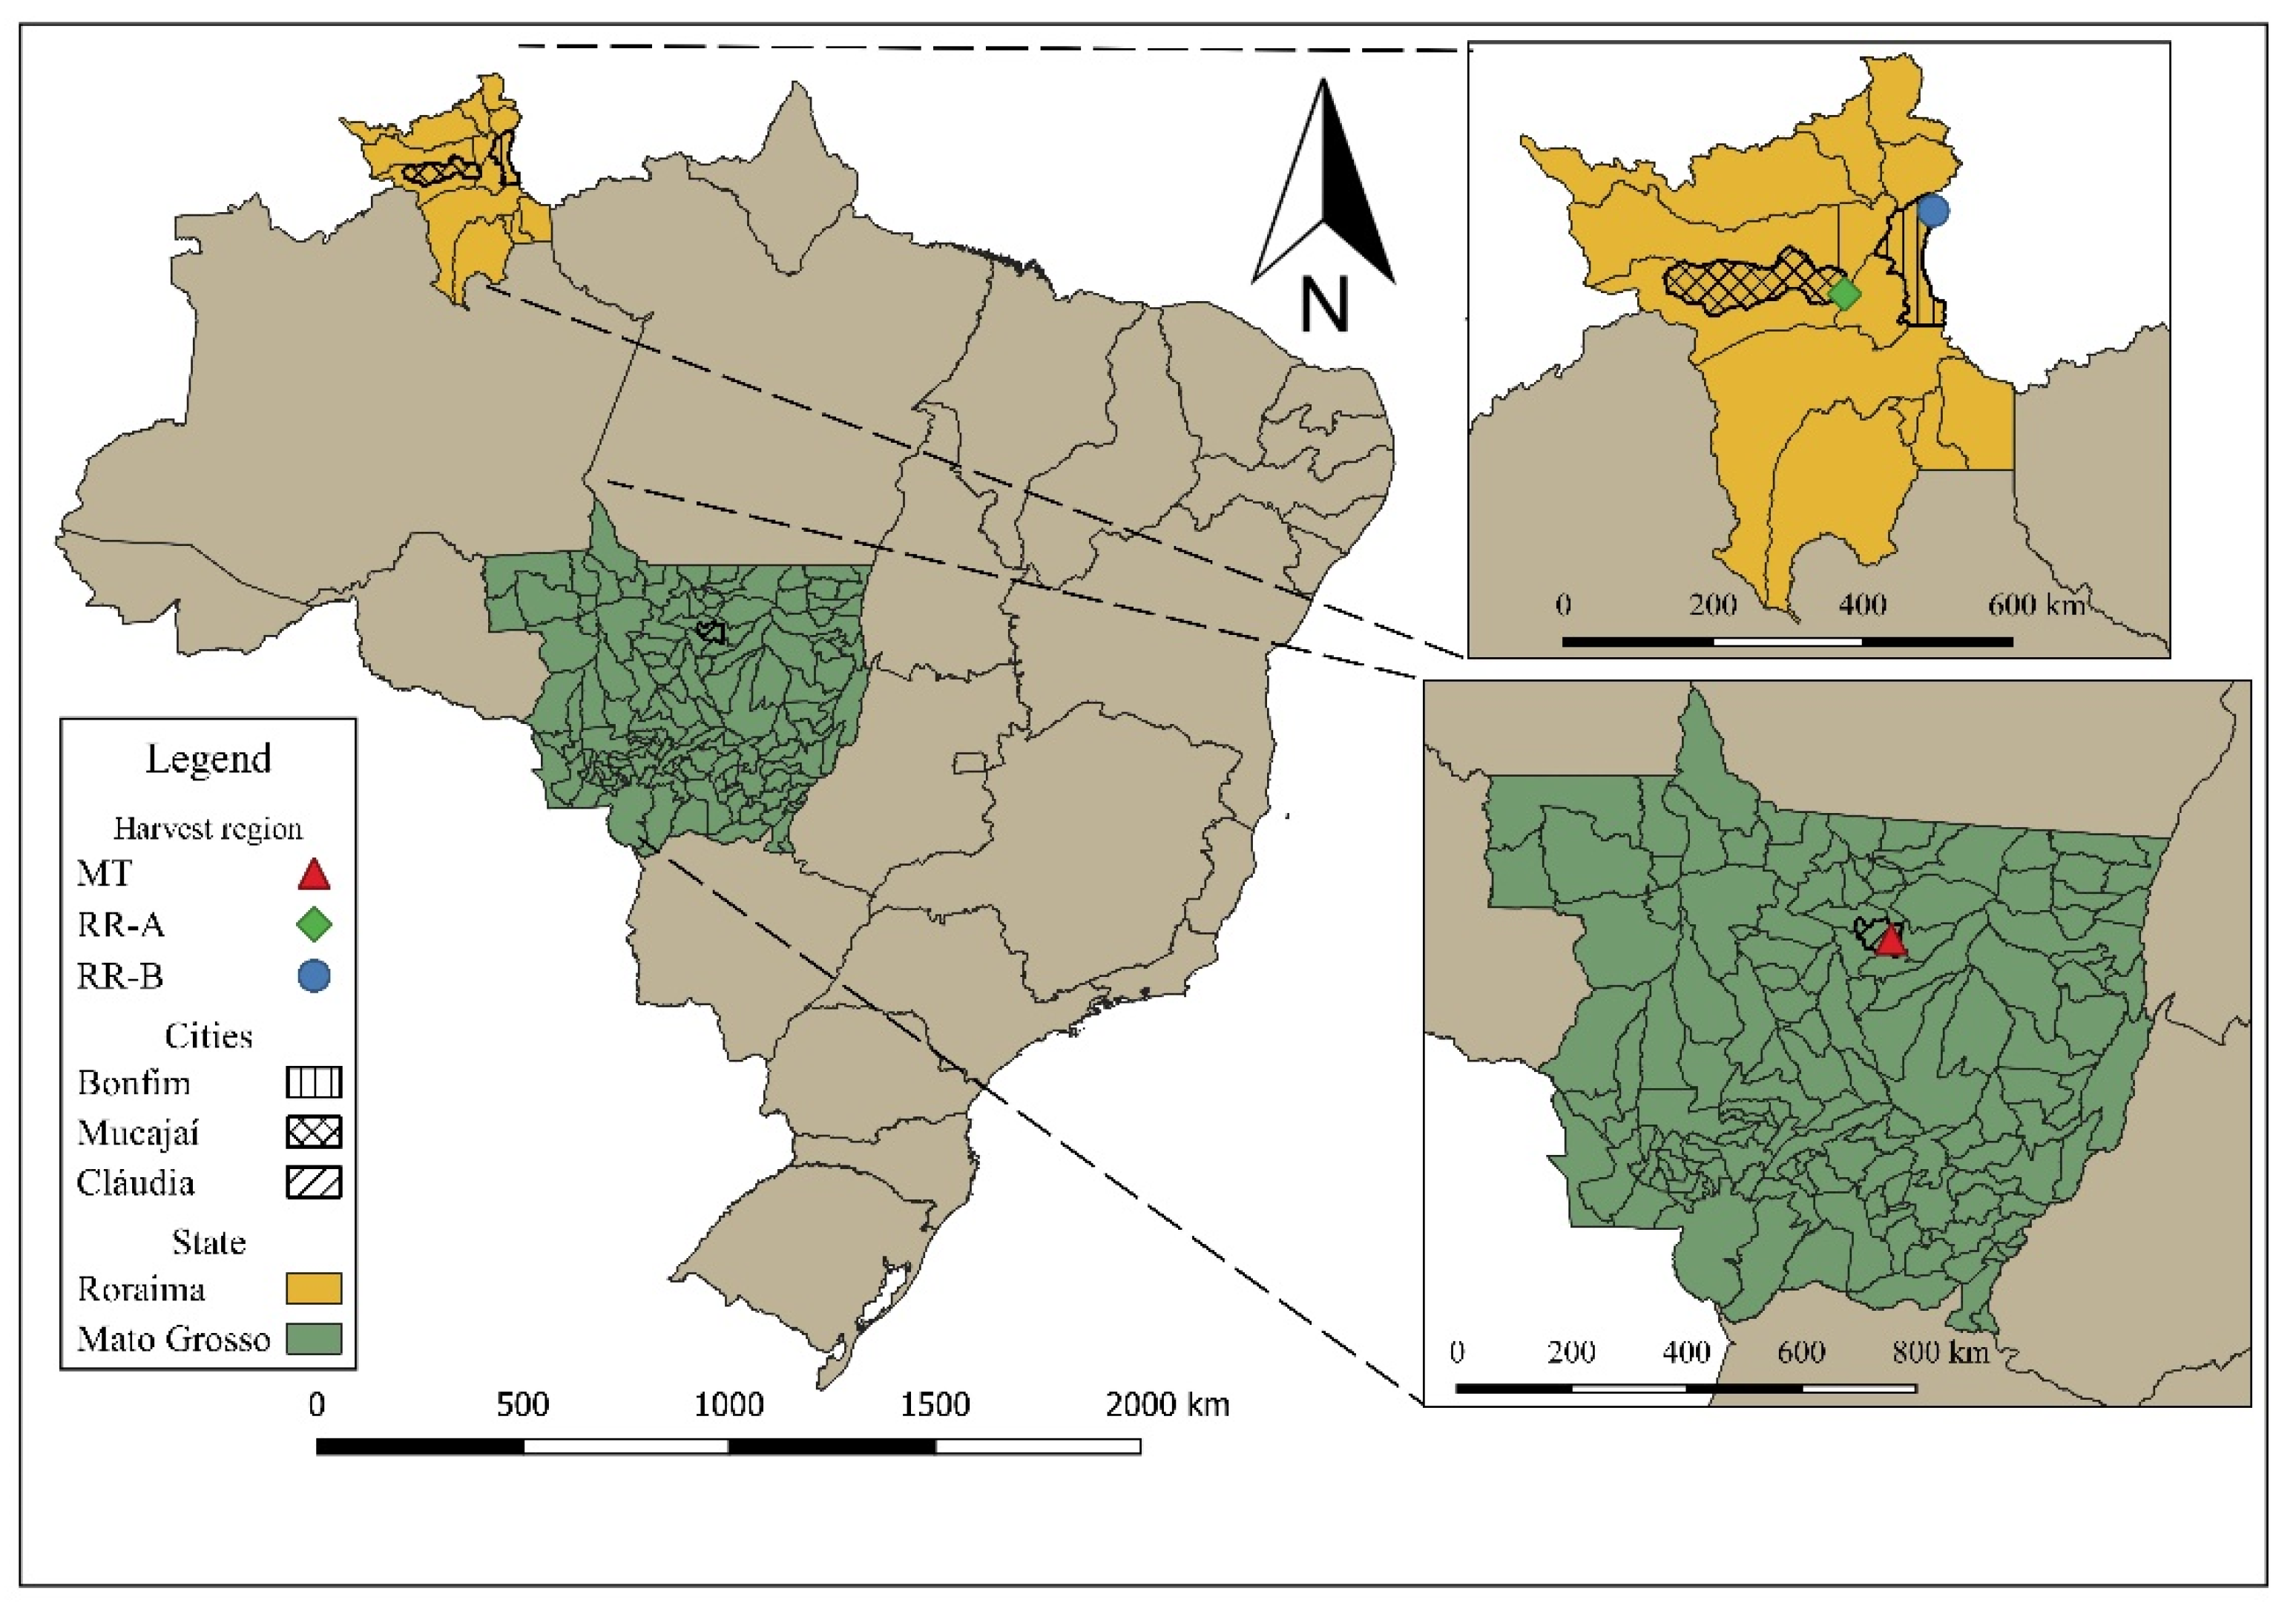
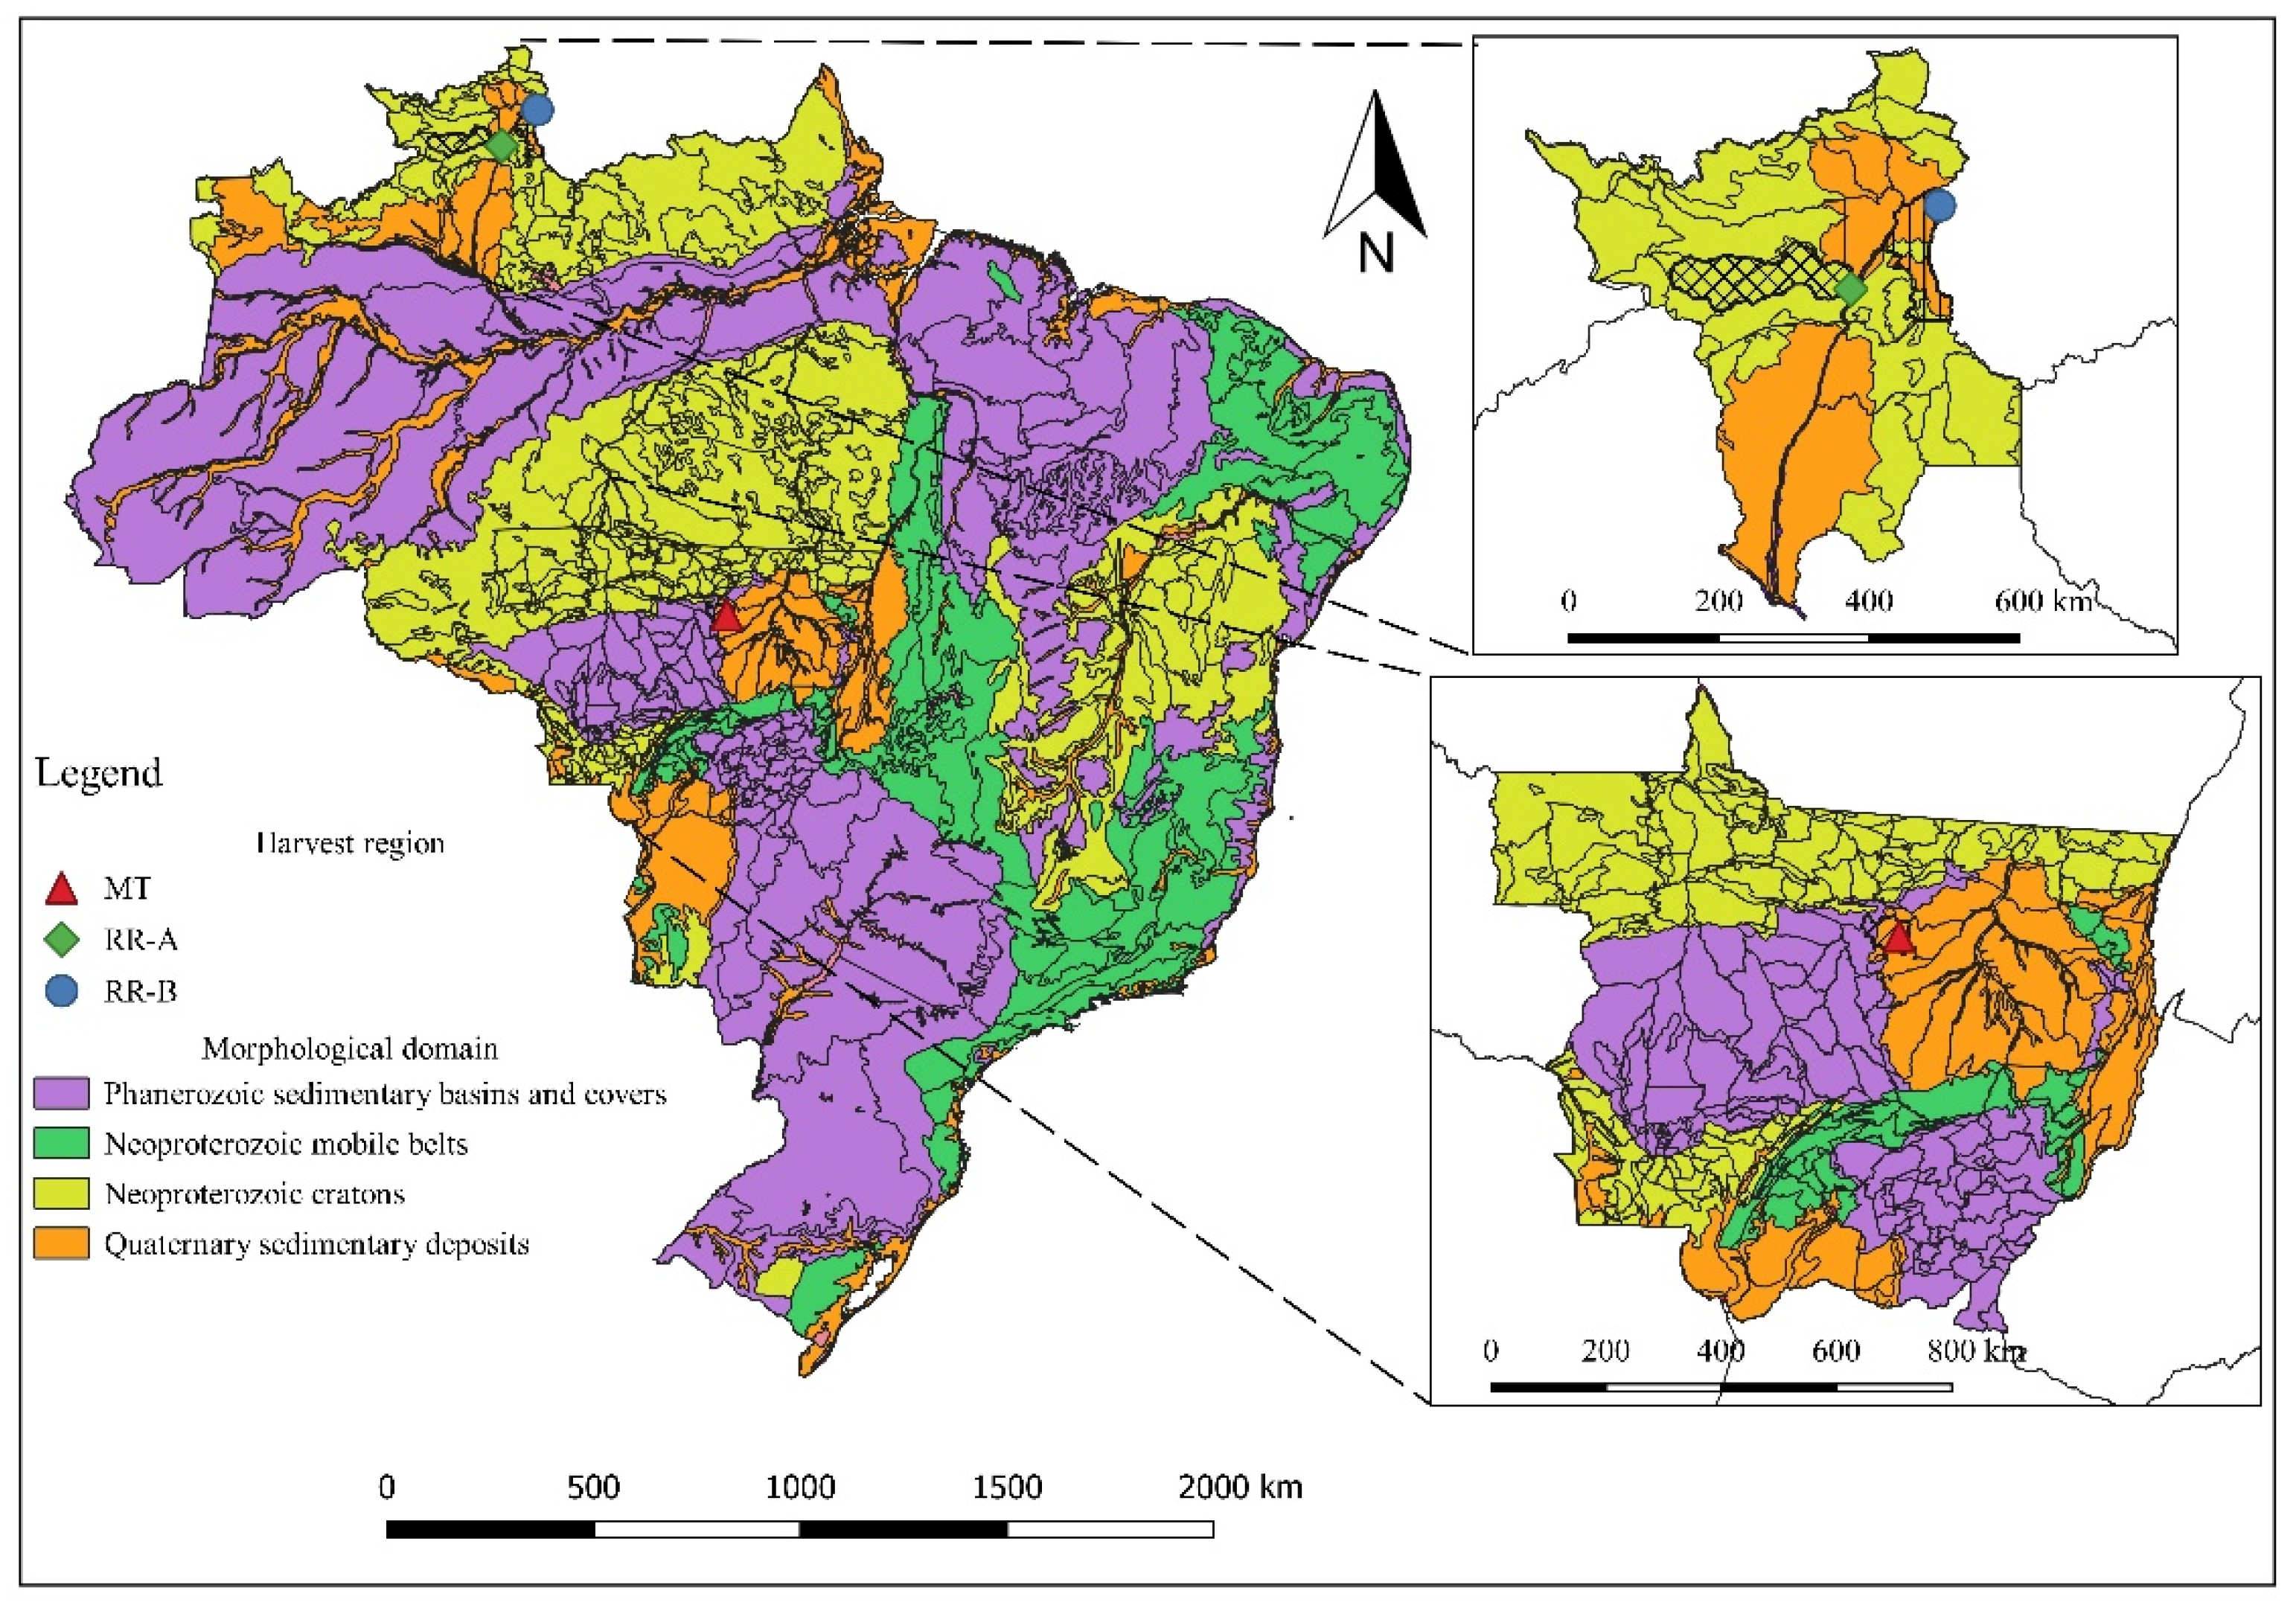
2.1. Harvesting Regions Areas

Three batches of Tabebuia sp. wood were considered to obtain their physical and mechanical properties. The batches were obtained in the Municipality of Mucajaí, Roraima [RR-A] (2°22′43″ N; 60°55′46″ W), the Municipality of Bonfim, Roraima [RR-B] (3°22′31″ N; 59°51′48″ W), and the Cláudia Municipality, Mato Grosso [MT] (11°30′12″ S; 54°51′38″ W), all of them in Brazil, as shown in Figure 1. All maps were made using software from the Geographic Information System (GIS) and the IBGE database [35]. In addition, the three harvesting regions are the legal origin of native species, and harvesting was authorized by responsible authorities and bureaus. In addition, they are located within the Legal Amazon Rainforest.
The distance between the harvesting regions RR-A and RR-B is 162.10 km; between the regions RR-A and MT, the distance is 1675.71 km, and between the regions RR-B and MT, the distance is 1736.44 km. Despite the proximity between the RR-A and RR-B harvesting regions, they differ in terms of the morphological zone. The RR-B and MT regions are similar in terms of the morphological domain of Quaternary sedimentary deposits. A morphological domain is constituted by the accumulation areas represented by the low slope plains and terraces, depressions modeled on horizontal to subterranean areas; sediment deposits of rivers; marine, fluviomarine, lagoon, and wind environments; located in coastal zones or regions of the interior of the continent [35]. The RR-A harvesting region is located in the morphological zone of Neoproterozoic cratons, which are residual plateaus and inter-planaltic depressions. Its plateaus are based on metamorphs or granitoids, with a cover of sedimentary rocks or volcanic plutons [35]. The representation of the morphological zones of each harvesting region is presented in Figure 2.
In addition, harvesting region areas are also distinguished by the climate zone in which they are located. The MT harvesting region is located in the equatorial zone, characterized by high temperatures, high air humidity, low thermal amplitude, and high rainfall throughout the year [35]. The harvesting regions RR-A and RR-B are located in the tropical climate zone of the equatorial zone, characterized by winter and summer marked by the presence or absence of rain, with rainy summers, dry winters with little rain, high temperatures, and low thermal amplitude [35]. The representation of the climatic zone of each harvesting region is presented in Figure 3.

2.2. Experimental Procedure

The batch of wood was acquired from a sawmill in São Carlos in São Paulo, Brazil. The pieces of wood from the different batches were stored in Laboratório de Madeiras e de Estruturas de Madeira (LaMEM), Department of Structural Engineering, School of Engineering of São Carlos, of the University of São Paulo, in order to guarantee moisture content close to equilibrium (12%), according to the Brazilian standard ABNT NBR 7190-1 [36]. Twelve specimens were manufactured [34] for each type of test and each harvesting region (MT, RR-A, and RR-B) to evaluate the physical and mechanical properties, resulting in 540 experimental determinations. All properties studied are described below:
  • Apparent density (at 12% moisture) ( ρ );
  • Total radial shrinkage ( ε r , r a d );
  • Total tangential shrinkage ( ε r , t g );
  • Compression strength parallel to the grain ( f c 0 );
  • Tension strength parallel to the grain ( f t 0 );
  • Shear strength perpendicular to the grain ( f t 90 );
  • Shear strength parallel to the grain ( f v 0 );
  • Splitting strength ( f s 0 );
  • Bending strength parallel to the grain ( f m );
  • Modulus of elasticity in compression parallel to the grain ( E c 0 );
  • Modulus of elasticity in tension parallel to the grain ( E t 0 );
  • Modulus of elasticity in bending ( E m );
  • Hardness parallel to the grain ( f H 0 );
  • Hardness perpendicular to the grain ( f H 90 );
  • Impact Strength in Bending ( f b w ).
To obtain the characteristic strength ( f w k ), the results from the characterization tests of the samples are placed in ascending order ( f 1 f 2 f 3 f n ), where n is the number of samples, and f 1 and f n are the lowest and highest strength obtained in the tests. It is necessary calculate the mean strength ( f m ); as shown in Equation (1), ABNT NBR 7190-3 [37] determines that if the number of samples is odd, the highest strength obtained in the tests should be disregarded.
f m = ( f 1 + f 2 + f 3 + + f n n )
As recommended by ABNT NBR 7190-3 [37], the characteristic strength value ( f w k ) was calculated according to Equation (2), where values lower than f 1 and 0.7 · f m are not allowed; nor are values higher than f m .
max [ f 1 , 0.7 · f m ] f w k = ( 2 f 1 + f 2 + + f n 2 1 n 2 1 f n 2 ) · 1.1 f m
It should be noted that the characteristic value of the compressive strength parallel to the grain is the measurement used to classify wood species into their strength classes in regards to softwood and hardwood groups.

2.3. Physical Properties

The test methodologies for determining the apparent density and shrinkage of wood are described below. All specimens were extracted from a supposedly homogeneous batch of 12 m3.

2.3.1. Apparent Density

Wood’s apparent density ( ρ ), or the conventional specific mass, is obtained from the ratio between the mass of the sample at 12% moisture content ( m 12 % ) and its respective volume ( V 12 % ), as expressed by Equation (3).
ρ = m 12 % V 12 %
To determine the apparent density, specimens measuring 20 mm × 30 mm × 50 mm, and which contained at least five growth rings, were molded. A digital caliper with a precision of 0.01 mm and a digital scale with a sensitivity of 0.001 g were used to measure the specimens.

2.3.2. Wood Shrinkage

For the shrinkage property ( ε ), the results were obtained according to the preferred directions 1, 2, and 3, corresponding to the longitudinal (axial), radial, and tangential ( n ) directions, respectively (Equation (4)).
ε r , n = ( L n , s a t L n , d r y L n , d r y ) · 100
From Equation (4), r is associated with the shrinkage property, n is the reference direction considered—1 (longitudinal), 2 (radial), or 3 (tangential)—and L is the sample size in the considered direction

2.4. Mechanical Properties

All specimens were extracted from a supposedly homogeneous batch of wood with 12 m3.

2.4.1. Compression Parallel to the Grain

The compression strength parallel to the fibers ( f c 0 ) is defined as the ratio between the maximum compressive force ( F c 0 , m a x ) obtained from the test and the cross-sectional area of sample ( A ), as expressed in Equation (5).
f c 0 = F c 0 , m a x A
The modulus of elasticity in compression parallel to the grain ( E c 0 ) is obtained from the slope of the linear stretch of the stress versus the specific strain diagram, expressed by Equation (6), where σ 10 % , σ 50 % , ε 10 % , and ε 50 % correspond to the compressive stresses and strains, respectively, corresponding to 10% and 50% of the strength f c 0 measured in the third loading cycle.
E c 0 = σ 50 % σ 10 % ε 50 % ε 10 %
The specimen for the compression test parallel to the grain must have a square section equal to 50 mm and a length equal to 150 mm in the direction of the grain.
The ABNT NBR 7190-3 [37] standard determines that the deformations measured in the specimens in compression parallel to the grain are also evaluated using dial gauges with a precision of 0.001 mm, which are nailed to the specimen using two metallic angles with a nominal distance of 100 mm between the nailing lines and 25 mm away from the ends of the specimen. The loading rate must be equal to 10 MPa·min−1, according to ABNT NBR 7190-3 [37], and must be monotonic and increasing. The distance of 25 mm from the edges of the specimen is justified because the crushing of the wood’s edges does not interfere with the measurement of deformations. Considering wood’s heterogeneity, as it is a natural material, each specimen can present different deformations [38]. The Brazilian standard ABNT NBR 7190-3 [37] allows for fixing the dial gauges on at least two sides of the specimen and assigning the characteristic deformation to the mean of the deformations recorded on each dial indicator.

2.4.2. Compression Perpendicular to the Grain

The compression strength perpendicular to the grain ( f c 90 ), Equation (7) is defined as the value of the compressive stress resulting from a maximum normal force ( F c 90 , m a x ) acting on area ( A ) for a specific deformation residual of 2 mm·m−1 ( ε 2 mm · m 1 ) in the tangential direction to the grain in a specimen.
f c 90 = F c 90 , m a x A
To determine the strength and modulus of elasticity in compression perpendicular to the grain, the Brazilian standard [37] establishes that the specimen is the same used in compression parallel to the fibers, that is, prismatic, with a square cross-section of 50 mm × 50 mm on a side and 100 mm in length in the tangential direction of the fibers, with a dimensional accuracy of 0.1 mm. The measurement of deformations in the specimen must be made on at least two of its faces. Deformations must be measured with a precision of at least 50 µm m−1, and the testing machine must apply the loading at a rate of 10 MPa min−1 in a monotonic manner. The strength to determine the modulus of elasticity perpendicular to the grain must be estimated ( f c 90 , e s t ) by destructive testing of a twin specimen obtained from the same investigated sample. Loading must be applied, with two loading and unloading cycles, following the specified procedure. Measurements of loads and deformations must be taken at each point of the loading diagram. For instrumented tests, the loading must be limited to 70% of the estimated load and taken to rupture after removal of the instruments.
Modulus of elasticity in compression perpendicular to the grain ( E c 90 ) is obtained from the slope of the linear stretch of the stress versus the specific strain diagram, determined by Equation (8). Where σ 10 % , σ 50 % ,   ε 50 % , and ε 50 % correspond to the compressive stresses and strains, corresponding, respectively, to 10% and 50% of the f c 0 measured in the third loading cycle
E c 90 = σ 50 % σ 10 % ε 50 % ε 10 %

2.4.3. Tension Parallel to the Grain

According to the Brazilian standard ABNT NBR 7190-3 [37], the tensile strength parallel to the fibers ( f t 0 ) is the maximum tensile stress applied to a standard specimen. The recording of deformations in the rectangular specimen took place on opposite faces of the side measuring 50 mm, using a dial indicator with an accuracy of 50 μm/m, and the loading applied by the testing machine on the specimen obeyed the rate of 10 MPa/min.

2.4.4. Tension Perpendicular to the Grain

According to the Brazilian standard ABNT NBR 7190-3 [37], the tension strength perpendicular to the grain ( f t 90 ) consists of the maximum tensile stress that can be applied to a standard specimen, expressed by Equation (9).
f t 90 = F t 90 , m a x A t 90
From Equation (9), F t 90 , m a x is the maximum tensile force applied to the specimen perpendicular to the grain, and A t 90 is the cross-section area of the specimens in which the perpendicular force is applied (approximately 25 mm × 50 mm).
The Brazilian standard for wooden structures ABNT NBR 7190-3 [37] does not allow this mechanical property to be considered in evaluating the safety of structures; it can only be considered for the comparative study between different wood species. The specimen is produced to an accuracy of 0.1 mm in the geometry shown. During the test, the loading should preferably be applied in the tangential direction and at a rate of 2.5 MPa/min.

2.4.5. Shear Strength

According to the Brazilian standard [37], the shear strength parallel to the fibers ( f v 0 ) is expressed by the maximum shear stress (Equation (10)) which can be applied to a standard specimen, with a dimensional accuracy of 0.1 mm and loading applied at a rate of 2.5 MPa/min.
f v 0 = F v 0 , m a x A v 0
From Equation (10), F v 0 , m a x is the maximum force applied to the specimen and A v 0 is the shear area of the specimen.

2.4.6. Splitting Parallel to the Grain

The splitting strength ( f s 0 ) (Equation (11)) consists of the ratio between the maximum applied force ( F s 0 , m a x ) and the useful section area ( A s 0 ) of approximately 75 mm × 50 mm of the standard specimen, with 0.1 mm dimensional accuracy and applied load at a rate of 2.5 MPa/min.
f s 0 = F s 0 , m a x A s 0
The Brazilian standard ABNT NBR 7190-3 [37] recommends that the strength of splitting parallel to the grain should be considered only as a standard value and used only for comparative studies between wood species.

2.4.7. Static Bending

According to the Brazilian standard, the simple bending strength ( f w M ) is obtained according to Equation (12), where M m a x is the value of the maximum bending moment, and W is the modulus of strength in static bending, which for rectangular sections is é W e = b · h 2 / 6 , where b and h are the measurements of the base and height of the cross-section of the sample, respectively.
f w M = M m a x W e
The simple bending test (structural model of three-point bending test), defined by the Brazilian standard ABNT NBR 7190-3 [37], consists of applying a concentrated load at the midpoint of a specimen supported by supports (the length between supports is 21 · h = 21 × 50 = 1050 mm) at its ends; the geometry of the sample cross-section is 50 mm × 50 mm and the length if 1150 mm.
The stiffness or modulus of elasticity ( E M ) of wood in bending (Equation (12)) is obtained by the slope of the secant line to the load curve × vertical displacement between the values corresponding to 10% and 50% of the maximum load F M , and the maximum load F M is determined by destructive testing of a twin specimen.
E M = ( F M , 50 % F M , 10 % ) · L 3 ( V 50 % V 10 % ) · b · h 3
From Equation (13), F M , 10 % and F M , 50 % are loads corresponding to 10% and 50% of the estimated maximum load ( F M ) applied in the specimen, V 10 % and V 50 % are the displacements measured in the mid-span of the specimen corresponding to 10% and 50% of the estimated maximum load ( F M ), and b , h , and L consist of the measurements of the width, height, and length of the specimen, respectively.
The estimated load ( F M ) used to determine the stiffness of the sample is the same defined by the ABNT NBR 7190-3 [37] standard as the one that causes the rupture of the twin specimen. Once the estimated strength value f M , e s t is known, the loading must be applied to the specimen in two loading and unloading cycles at a rate of 10 MPa/min. Displacements under the load application point must be measured at each point of the loading diagram by displacement transducers with an accuracy of 0.01 mm. In this case, the displacements are recorded up to 70% of the estimated load, then the measuring instrument is removed, and the load is increased until the specimen breaks.

2.4.8. Janka Hardness

This test aims to determine the hardness of wood from a homogeneous batch. The Brazilian standard establishes the method proposed by Janka as a criterion to determine the degree of hardness of a specific species. The Janka scale conventionally defines hardness ( f H ) as the maximum force ( F m a x ) of compression that acts on the face of the specimen with the penetration of a semi-sphere of diametric area ( A s e c   d i a m ) of 100 mm2 [39]. This must occur a single time, as prescribed by ABNT NBR 7190-3 [37]. Janka hardness is measured in the direction parallel ( f H 0 ) and perpendicular ( f H 90 ) to the fibers. The prismatic shape of the specimen has a cross-section measuring 50 mm × 50 mm and a parallel length of 150 mm, made with a dimensional accuracy of 0.1 mm. The scheme of the device used to determine the Janka hardness degree is proposed by ABNT NBR 7190-3 [37].

2.4.9. Tenacity and Impact Strength in Bending

This test aims to determine the Tenacity ( W ) of the wood, which consists of the energy required to fracture the specimen (20 mm × 20 mm × 300 mm). It is calculated using Equation (14), where m is the pendulum’s mass (m = 15.6 kg, P = 153 N), g is the acceleration due to gravity (9.81 m/s²), and L is the length of the arm of the Charpy pendulum, which is the maximum lift calculation of the gravitational potential energy, and L′ is the final height the pendulum reaches after the impact with the wooden specimen.
W = m · g · ( L L )
Knowing the Tenacity (W) allows for the calculation of the flexural impact strength ( f b w ), as expressed in Equation (15), where b and h are the measurements of the cross section (20 mm × 20 mm) of the specimen used. The impact strength in the bending of the wood allows a more precise analysis of the structure when dynamic actions request it.
f b w = 1000 · W b · h

2.5. Statistical Analyses

The influence of wood harvesting regions (RR-A; RR-B; MT) on batch homogeneity of the Ipe wood (Tabebuia sp.), based on its physical and mechanical properties, was investigated. An analysis of variance at 5% significance (α) was used, with the equivalence between the mean values of the properties as the null hypothesis (H0), and the non-equivalence as an alternative hypothesis (H1). A p-value lower than the significance level implies rejecting H0, and accepting it otherwise. Tukey’s multiple comparisons test was used to properly group factor levels.
For ANOVA validation, normality (Anderson–Darling test) in the distribution of responses and homogeneity of variances between factor levels (Bartlett’s test) were evaluated. Both tests were considered at 5% significance. The Anderson–Darling test indicated normality in the distributions as the null hypothesis and non-normality as an alternative hypothesis. Bartlett’s test used the equivalence of variances between treatments as the null hypothesis and non-equivalence as an alternative hypothesis. For these tests, the p-value greater than the significance level implies accepting H0, and refuting it otherwise.

3. Results and Discussion

Table 1, Table 2 and Table 3 are present the mean results ( x ¯ ) and the coefficients of variation (Cv), maximum values (Max), minimum values (Min), and confidence interval (CI-95% confidence) of the physical and mechanical properties investigated in Tabebuia sp. wood for the harvesting regions RR-A, RR-B, and MT, respectively.
An analysis of the results presented in Table 1, Table 2 and Table 3 of Ipes (Tabebuia sp.) wood are presented in this research. The apparent density ( ρ ) considering the mean values obtained for the RR-A (1.04 g cm−3), RR-B (1.11 g cm−3), and MT (1.06 g cm−3) harvesting regions are higher than those found by Ross and FPL [40] (0.92 g cm−3).
Considering the mean values of total radial shrinkage ( ε r , r a d ). The values obtained in the present study for the harvest regions RR-A (4.7%), RR-B (5.7%), and MT (5.42%) are lower than the values obtained by Ross and FPL [40] (6.6%). However, for the property of total tangential shrinkage ( ε r , t g ), the RR-B harvest region (9.39%) presented values higher than the values obtained by Ross and FPL [40] (8%), while the RR-A (6.6%) and MT (7.62%) harvest regions presented lower values.
For the compressive strength parallel to the grain ( f c 0 ), RR-A (81.3 MPa), RR-B (68.13 MPa), and MT (73.68 MPa) values were lower than those obtained by Ross and FPL [40] (89.7 MPa). When compared to the result of Branco et al. [29] (74.75 MPa) the RR-B and MT harvesting regions showed lower and RR-A higher values.
The average values of tension strength parallel to the grain ( f t 0 ) found in the RR-A regions (103.05 MPa) are higher than those obtained by Branco et al. [29] (96.45 MPa). However, the average values for the RR-B (92.05 MPa) and MT (93.25 MPa) harvest regions presented lower values.
Evaluating the shear strength parallel to the fibers ( f v 0 ) obtained in the regions of RR-A (21.42 MPa), RR-B (22.40 MPa), and MT (21.76 MPa) these values were similar to those obtained by Branco et al. [29] (21.85 MPa) and presented higher values than those obtained by Ross and FPL [40] (14.3 MPa).
The values obtained for the bending strength parallel to the grain ( f m ) in the RR-B (107.98 MPa), and MT (117.41 MPa) harvesting regions presented lower values than those obtained by Branco et al. [29] (119.25 MPa). However, the RR-A (129.74 MPa) harvesting region presented higher values.
The values obtained for the modulus of elasticity in compression parallel to the fibers (Ec0) in the regions of RR-A (16,605.22 MPa), RR-B (17,840 MPa), and MT (17,363.31 MPa) presented similar values to those obtained by Branco et al. [29] (17,252 MPa) and lower values than those obtained by Ross and FPL [40] (21,600 MPa).
The results of the modulus of elasticity in tension parallel to the grain ( E t 0 ) and modulus of elasticity in bending ( E m ) were similar to those obtained by Branco et al. [29].
In order to evaluate the strength of each harvesting region, the characteristic strength (fwk) was calculated based on Equation (2) used to classify the wood based on the strength classes established by the ABNT NBR 7190-1 [36] standard, as summarized in Table 4.
Based on Table 4, it is possible to observe different characteristic values of the strength classes for the different harvesting regions. The batches from the harvesting regions RR-A, RR-B, and MT were classified according to strength classes D60, D50, and D50, respectively. Directly impacting the design process, considering the concept of homogeneous batches for native forest wood of the standard ABNT NBR 7190-1 [36], is the fact that the sawmill conditions in regards the harvesting region, location of the sample in the trunk, soil and climate conditions, relief, and vegetation of the logs that are processed to produce structural elements are not controlled. Therefore, it is necessary to evaluate a strength correction factor that considers the factors of the harvesting region.
ANOVA, normality (Anderson–Darling [A-D]), multiple comparisons (C-M) (Bartlett’s test), and Tukey’s multiple comparisons tests were all applied to verify the influence of the harvesting region on batch homogeneity of Ipe wood (Tabebuia sp.), based on its physical and mechanical properties. Moreover, we investigated the existence of significant differences in batches, where the same letters imply treatments with equivalent methods; the results are presented in Table 5.
Tukey’s multiple comparison test showed significant differences between groups for the properties ρ , ε r , r a d , ε r , t g , f c 0 , f m , and E m . The differences were confirmed with ANOVA results that showed p-values lower than the significance level of 5%. Furthermore, it is possible to observe the non-predominance of equivalence between the harvesting region areas based on Tukey’s multiple comparisons test.
The normality test (Anderson–Darling [A-D]) showed a p-value of less than 5% for the property E m , which implies the rejection of the null hypothesis H0 of normal distribution. For the other properties, the p-value was higher than the significance level of 5%, which means that the null hypothesis H0 was accepted, and the results obtained followed the normal distribution. For the multiple comparisons test (C-M) (Bartlett’s test), all properties showed p-values greater than the significance level of 5%, which implies accepting the null hypothesis H0 and indicates the homogeneity of variance.
Tukey’s multiple comparisons test showed no significant differences for the properties f t 0 , f t 90 , f v 0 , f s 0 , E c 0 , E t 0 , f H 0 , f H 90 , and f b w . Where the properties f t 0 , f t 90 , f v 0 , f s 0 , E c 0 , E t 0 , f H 90 , and f b w had a p-value with a significance level greater than 5%, for these properties, the normality test (Anderson–Darling [A-D]) and multiple comparisons (C-M]), for all responses investigated, Table 4 and Table 5 show that the wood harvesting region was significant. The results indicated that the wood harvesting regions showed significant differences in six (40%) and non-significant differences in nine (60%) of the fifteen properties evaluated.
Silva et al. [14] evaluated Cupiúba wood in three different harvesting regions, using the test methodology of the standard ABNT NBR 7190-3 [37] (the same used in this work), evaluating the same properties. The analysis of variance verified the influence of the harvesting regions and observed a result with significant differences in 50% of the properties studied.
Aiming to evaluate the influence of the harvest region, Aquino et al. [15] evaluated Cambará wood for three different harvest regions, using the test methodology of ABNT NBR 7190-3 standard [37], studying the same properties used in this work. An analysis of variance allowed for the observation of significant differences in 11% of the properties studied.
Similarly, Teixeira et al. [15] examined Angelim Pedra wood for three different harvesting regions, using the test methodology of the ABNT NBR 7190-3 standard [37], studying the same properties as those used in the present work. They conducted a statistical analysis employing an analysis of variance and obtained results with significant differences in 15% of the properties studied. Under the same conditions, Lahr et al. [13] obtained 100% non-significant differences in the studied properties.
It can be observed that there are significant differences in the study performed, which was observed in the studies by Silva et al. [14], Aquino et al. [15], and Teixeira et al. [16]. However, in the research developed by Lahr et al. [13], no significant differences were observed for the specimens with 12% moisture conditions, which shows the importance of studying different species and conditions.
Given this, the application of a small amount of research does not resolve all questions regarding the influence of the harvesting region on batch homogeneity of the wood based on the physical and mechanical properties.

4. Conclusions

The methodology proposed in this work allowed us to observe significant differences between the three batches of Tabebuia sp. extracted from three locations, considering the statistical analysis (ANOVA, Tukey’s test, Anderson–Darling normality test, and multiple comparisons). The batches from the different regions showed significant differences in six (40%) and non-significant differences in nine (60%) of the fifteen properties evaluated.
Among the properties that resulted in significant differences, the compressive strength parallel to the grain is a crucial parameter for the design of wooden structures, being necessary to evidence possible variations for the same species according to the point of harvesting region. It directly impacts the consideration of batch homogeneity provided for in ABNT NBR 7190-1 [36], since a single batch of the same species can receive samples from different regions of the country and considering the sawmill condition where the harvesting region, location of the sample in the trunk, soil and climate conditions, relief and vegetation of the logs that are processed to produce structural elements are not controlled. Therefore, it is necessary to evaluate a strength correction factor that considers the factors of the harvesting region for future version of ABNT NBR 7190 [34].
The analysis of the influence of the harvesting region on other species, as shown, yields different results according to the species analyzed. Therefore, a proposal of regression models (with density) to estimate other wood properties for the reforestation of woods is suggested. Such action can facilitate the knowledge of the properties of these species and expand their possible applications.

Author Contributions

Conceptualization, M.H.M.d.M.; methodology, M.H.M.d.M. and V.B.d.M.A.; software, M.H.M.d.M.; validation, A.L.C., M.H.M.d.M. and F.A.R.L.; formal analysis, M.H.M.d.M.; investigation, A.L.C., F.A.R.L. and M.H.M.d.M.; resources, F.A.R.L.; data curation, M.H.M.d.M.; writing—original draft preparation, M.H.M.d.M.; writing—review and editing, M.H.M.d.M., H.F.d.S., I.A.d.O., L.d.F., V.B.d.M.A., I.F.F., I.S.M., F.A.R.L., F.J.R.M., F.M.d.A.F. and A.L.C.; visualization, A.L.C., M.H.M.d.M. and F.A.R.L.; supervision, A.L.C. and F.A.R.L.; project administration, F.A.R.L. and A.L.C.; funding acquisition, H.F.d.S., L.d.F. and I.A.d.O. All authors have read and agreed to the published version of the manuscript.

Funding

This study was financed by the Coordenação de Aperfeiçoamento de Pessoal de Nível Superior, Brasil (CAPES), finance code 001, and the Pró-Reitoria de Pesquisa, Inovação e Pós-Graduação of Instituto Federal de Rondônia (PROPESP/IFRO), finance code 002.

Informed Consent Statement

Not applicable.

Data Availability Statement

The data presented in this study are available on request from the corresponding author.

Acknowledgments

We would like to acknowledge the Pró-Reitoria de Pesquisa, Inovação e Pós-Graduação of Instituto Federal de Rondônia (PROPESP/IFRO), the Laboratório de Madeiras e de Estruturas de Madeira (LaMEM), and the Coordenação de Aperfeiçoamento de Pessoal de Nível Superior, Brazil (CAPES).

Conflicts of Interest

The authors declare no conflict of interest.

References

  1. Calil Júnior, C.; Dias, A.A. Utilização da madeira em construções rurais. Rev. Bras. Eng. Agríc. E Ambient. 1997, 1, 71–77. [Google Scholar] [CrossRef]
  2. Fonte, T.F.; Calil Júnior, C. Pontes protendidas de madeira: Alternativa técnico-econômica para vias rurais. Eng. Agríc. 2007, 27, 552–559. [Google Scholar] [CrossRef]
  3. Lahr, F.A.R.; Nogueira, M.C.J.A.; Araujo, V.A.; Vasconcelos, J.S.; Christoforo, A.L. Wood Utilization of Eucalyptus Grandis in Structural Elements: Densities and Mechanical Properties. Eng. Agríc. 2018, 38, 642–647. [Google Scholar] [CrossRef]
  4. Christoforo, A.L.; Aquino, V.B.d.M.; Wolenski, A.R.V.; Araujo, V.A.D.; Lahr, F.A.R. Evaluation of the Peltophorum vogelianum Benth. Wood Species for Structural Use. Eng. Agríc. 2019, 39, 763–768. [Google Scholar] [CrossRef]
  5. Christoforo, A.L.; Panzera, T.H.; Lahr, F.A.R. Estimation of Tensile Strength Parallel to Grain of Wood Species. Eng. Agríc. 2019, 39, 533–536. [Google Scholar] [CrossRef]
  6. Stringari, E.H.; Petrauski, A.; Petrauski, S.M.C.; Azevedo, R.L.; Savaris, G. Construction and Testing of Glued Laminated Timber Frames for Use in Laying Poultry Houses. Eng. Agríc. 2020, 40, 122–131. [Google Scholar] [CrossRef]
  7. Cavalheiro, R.S.; Almeida, D.H.; de Almeida, T.H.; Christoforo, A.L.; Lahr, F.A.R. Density as Estimator of Shrinkage for Some Brazilian Wood Species. Int. J. Mater. Eng. 2016, 6, 107–112. [Google Scholar] [CrossRef]
  8. Baar, J.; Tippner, J.; Rademacher, P. Prediction of Mechanical Properties-Modulus of Rupture and Modulus of Elasticity-of Five Tropical Species by Nondestructive Methods. Maderas Cienc. Tecnol. 2015, 17, 239–252. [Google Scholar] [CrossRef]
  9. Chen, Y.; Guo, W. Nondestructive Evaluation and Reliability Analysis for Determining the Mechanical Properties of Old Wood of Ancient Timber Structure. BioResources 2017, 12, 2310–2325. [Google Scholar] [CrossRef]
  10. Andrade Junior, J.R.A.; de Almeida, D.H.; de Almeida, T.H.; Christoforo, A.L.; Stamato, G.C.; Lahr, F.A.R. Avaliação das estruturas de cobertura em madeira de um galpão de estoque de produtos químicos. Ambiente Construído 2014, 14, 75–85. [Google Scholar] [CrossRef] [Green Version]
  11. Steege, H.T.; Prado, P.I.; Lima, R.A.F.; Pos, E.; Coelho, L.S.; Lima Filho, D.A.; Salomão, R.P.; Amaral, I.L.; Almeida Matos, F.D.; Castilho, C.V.; et al. Biased-Corrected Richness Estimates for the Amazonian Tree Flora. Sci. Rep. 2020, 10, 10130. [Google Scholar] [CrossRef] [PubMed]
  12. Fraga, I.F. Influência dos Modelos Idealizados de Ligações No Dimensionamento de Treliças Planas de Madeira. Master’s Thesis, Universidade Federal de São Carlos—UFSCar, São Carlos, Brazil, 2020. [Google Scholar]
  13. Lahr, F.A.R.; Christoforo, A.L.; Silva, C.E.G.; Andrade Junior, J.R.; Pinheiro, R.V. Avaliação de Propriedades Físicas e Mecânicas de Madeiras de Jatobá (Hymenaea Stilbocarpa Hayne) Com Diferentes Teores de Umidade e Extraídas de Regiões Distintas. Rev. Árvore 2016, 40, 147–154. [Google Scholar] [CrossRef]
  14. Silva, C.E.G.; Almeida, D.H.; Almeida, T.H.; Chahud, E.; Branco, L.A.M.N.; Campos, C.I.; Rocco Lahr, F.A.; Christoforo, A.L. Influence of the Procurement Site on Physical and Mechanical Properties of Cupiúba Wood Species. BioResources 2018, 13, 4118–4131. [Google Scholar] [CrossRef]
  15. Aquino, V.B.M.; Panzera, T.H.; Molina, J.C.; Christoforo, A.L.; Rocco Lahr, F.A. Influence of Harvest Region on Properties of Cambará Wood. Maderas Cienc. Tecnol. 2021, 23, 1–12. [Google Scholar] [CrossRef]
  16. Teixeira, J.N.; Wolenski, A.R.V.; Aquino, V.B.M.; Panzera, T.H.; Silva, D.A.L.; Campos, C.I.; Silva, S.A.M.; Lahr, F.A.R.; Christoforo, A.L. Influence of Provenance on Physical and Mechanical Properties of Angelim-Pedra (Hymenolobium Petraeum Ducke.) Wood Species. Eur. J. Wood Wood Prod. 2021, 79, 1241–1251. [Google Scholar] [CrossRef]
  17. Moraes Neto, S.; Teles, R.; Rodrigues, T.; Vale, A.; Souza, M. Propriedades Mecânicas Da Madeira de Cinco Procedências de Pinus Caribaea Var. Hondurensis Implantadas No Cerrado Do Distrito Federal, DF. Bol. Pesqui. E Desenvolv. 2009, 251, 1–20. [Google Scholar]
  18. Nascimento, H.H.C.; Nogueira, R.J.M.C.; Silva, E.C.; Silva, M.A. Análise do crescimento de mudas de jatobá (Hymenaea courbaril L.) em diferentes níveis de água no solo. Rev. Árvore 2011, 35, 617–626. [Google Scholar] [CrossRef]
  19. Fernandes, C.; Gaspar, M.; Pires, J.; Alves, A.; Simões, R.; Rodrigues, J.; Silva, M.; Carvalho, A.; Brito, J.; Lousada, J. Physical, Chemical and Mechanical Properties of Pinus Sylvestris Wood at Five Sites in Portugal. IForest Biogeosci. For. 2017, 10, 669–679. [Google Scholar] [CrossRef]
  20. Amaro, C.L.; Cunha, S.D.; Grupioni, P.H.F.; Sousa, P.V.; Abadia, K.L.D.; Barros, I.B.; Mattos, F.S. Análise do crescimento de mudas de Eucalyptus sp. submetidas a diferentes doses de giberelina. AGRI-Environ. Sci. 2017, 3, 24–29. [Google Scholar]
  21. Mizobata, K.K.G.S.; Cassiolato, A.M.R.; Maltoni, K.L. Crescimento de mudas de Baru e Gonçalo-Alves em solo degradado, suplementado com resíduo, em Ilha Solteira-SP. Ciênc. Florest. 2017, 27, 429–444. [Google Scholar] [CrossRef]
  22. Tabakova, M.A.; Arzac, A.; Martínez, E.; Kirdyanov, A.V. Climatic Factors Controlling Pinus Sylvestris Radial Growth along a Transect of Increasing Continentality in Southern Siberia. Dendrochronologia 2020, 62, 125709. [Google Scholar] [CrossRef]
  23. Aguirre, M.I.H.; Peláez, J.D.L.; Osorio, N.W.; Correa, G.A. Effects of Nutrient Deprivation on the Growth and Development of Tabebuia Rosea Seedlings. Floresta E Ambiente 2021, 28, e20190112. [Google Scholar] [CrossRef]
  24. Santos, S.R. A atual classificação do antigo gênero Tabebuia (Bignoniaceae), sob o ponto de vista da anatomia da madeira. Balduinia 2017, 10–24. [Google Scholar] [CrossRef]
  25. Dietrichs, H.H. Desoxylapachol in Tabebuia Sp. Naturwissenschaften 1964, 51, 408–409. [Google Scholar] [CrossRef]
  26. Inacio, C.A.; Dianese, J.C. Some Foliicolous Fungi on Tabebuia Species. Mycol. Res. 1998, 102, 695–708. [Google Scholar] [CrossRef]
  27. Barros, B.C.; Silva, J.A.A.; Ferreira, R.L.C.; Rebouças, A.C.M.N. Volumetria e Sobrevivência de Espécies Nativas e Exóticas No Polo Gesseiro Do Araripe, PE. Ciênc. Florest. 2010, 20, 641–647. [Google Scholar] [CrossRef]
  28. Del Menezzi, C.H.S.; Silveira, R.R.; Souza, M.R. Estimativa das propriedades de flexão estática de seis espécies de madeiras amazônicas por meio da técnica não-destrutiva de ondas de tensão. Acta Amaz. 2010, 40, 325–332. [Google Scholar] [CrossRef]
  29. Branco, L.A.M.N.; Chahud, E.; Christoforo, A.L.; Rocco Lahr, F.A.; Battistelle, R.A.G.; Valarelli, I.D. Influence of Moisture Content in Some Mechanical Properties of Two Brazilian Tropical Wood Species. Adv. Mater. Res. 2014, 1025–1026, 42–45. [Google Scholar] [CrossRef]
  30. Lima, I.L.; Longui, E.L.; Andrade, I.M.; Garcia, J.N.; Zanatto, A.C.S.; Morais, E.; Florsheim, S.M.B. Efeito da Procedência em Algumas Propriedades da Madeira de Gallesia Integrifolia (Spreng.) Harms. Effect of Provenance in Some Wood Properties of Gallesia Integrifolia (Spreng.) Harms. Rev. Inst. Florest. 2010, 22, e17. [Google Scholar]
  31. Krzosek, S.; Burawska-Kupniewska, I.; Mankowski, P. Geographical Origin and Log Quality Influence on the Mechanical Properties of Scots Pine Sawnwood. BioResources 2020, 16, 669–683. [Google Scholar] [CrossRef]
  32. Tumenjargal, B.; Ishiguri, F.; Aiso, H.; Takahashi, Y.; Nezu, I.; Takashima, Y.; Baasan, B.; Chultem, G.; Ohshima, J.; Yokota, S. Physical and Mechanical Properties of Wood and Their Geographic Variations in Larix Sibirica Trees Naturally Grown in Mongolia. Sci. Rep. 2020, 10, 12936. [Google Scholar] [CrossRef] [PubMed]
  33. You, R.; Zhu, N.; Deng, X.; Wang, J.; Liu, F. Variation in Wood Physical Properties and Effects of Climate for Different Geographic Sources of Chinese Fir in Subtropical Area of China. Sci. Rep. 2021, 11, 4664. [Google Scholar] [CrossRef]
  34. NBR 7190; Timber Structures. Associação Brasileira de Normas Técnicas—ABNT: Rio de Janeiro, Brazil, 2022.
  35. Instituto Brasileiro de Geografia e Estatística—IBGE. Mapas do Brasil; IBGE: Rio de Janeiro, Brazil, 2002. [Google Scholar]
  36. NBR 7190-1; Timber Structures Part 1: Design Criteria. Associação Brasileira de Normas Técnicas—ABNT: Rio de Janeiro, Brazil, 2022.
  37. NBR 7190-3; Timber Structures Part 3: Test Methods for Characterization of Defect-Free Specimens for Timber of Native Forests. Associação Brasileira de Normas Técnicas—ABNT: Rio de Janeiro, Brazil, 2022.
  38. Icimoto, F.H.; Ferro, F.S.; Almeida, D.H.; Cristoforo, A.L.; Rocco Lahr, F.A. Influence of Specimen Orientation on Determination of Elesticity in Static Bending. Maderas Cienc. Tecnol. 2015, 17, 229–238. [Google Scholar] [CrossRef] [Green Version]
  39. Koczan, G.; Karwat, Z.; Kozakiewicz, P. An Attempt to Unify the Brinell, Janka and Monnin Hardness of Wood on the Basis of Meyer Law. J. Wood Sci. 2021, 67, 7. [Google Scholar] [CrossRef]
  40. Ross, R.J.; Forest Products Laboratory; USDA Forest Service. Wood Handbook: Wood as an Engineering Material; U.S. Department of Agriculture, Forest Service, Forest Products Laboratory: Madison, WI, USA, 2010; pp. 1–509. [Google Scholar]
Figure 1. The geographical location of wood harvesting areas.
Forests 13 01385 g001
Figure 2. Map of morphostructural domains of harvesting regions.
Forests 13 01385 g002
Figure 3. Map of climatic zones of harvesting areas.
Forests 13 01385 g003
Table 1. Results of physical and mechanical properties tests for Tabebuia sp. wood from harvesting regions RR-A.
Property x ¯ Cv (%)MaxMinCI
ρ (g cm−3)1.044.481.120.931.01; 1.06
ε r , r a d (%)4.703.634.994.414.61; 4.8
ε r , t g (%)6.606.657.185.516.36; 6.85
f c 0 (MPa)81.739.3198.5071.9077.43; 86.04
f t 0 (MPa)103.0533.95160.8052.8083.26; 122.84
f t 90 (MPa)3.3333.224.701.202.71; 3.96
f v 0 (MPa)21.4221.3827.8012.4018.83; 24.01
f s 0 (MPa)0.6627.831.000.400.55; 0.76
f m (MPa)129.7415.28159.40101.30118.52; 140.96
E c 0 (MPa)16,597.277.8018,926.7014,116.8015,864.88; 17,329.66
E t 0 (MPa)16,605.2215.8520,969.3012,146.5015,115.62; 18,094.81
E m (MPa)16,645.4111.0121,781.7014,591.6015,608.41; 17,682.41
f H 0 (MPa)163.598.08182.00138.10156.11; 171.07
f H 90 (MPa)127.0119.27170.2076.60113.16; 140.85
f b w   (kJ/m²)34.3243.876615.8025.80; 42.84
Table 2. Results of physical and mechanical properties tests for Tabebuia sp. wood from harvesting regions RR-B.
Property x ¯ Cv (%)MaxMinCI
ρ (g cm−3)1.112.471.161.051.09; 1.12
ε r , r a d (%)5.708.686.354.795.42; 5.98
ε r , t g (%)9.3910.1410.737.518.85; 9.93
f c 0 (MPa)68.1313.5684.4055.4062.9; 73.36
f t 0 (MPa)92.0527.15151.1064.0077.91; 106.19
f t 90 (MPa)2.6647.956.301.501.94; 3.38
f v 0 (MPa)22.4014.0726.7017.6020.62; 24.18
f s 0 (MPa)0.8126.691.200.400.69; 0.94
f m (MPa)107.9817.41148.3076.5097.34; 118.61
E c 0 (MPa)17,840.0010.1920,596.6013,842.0016,811.2; 18,868.8
E t 0 (MPa)16,330.2310.4819,534.7014,038.0015,362.08; 17,298.38
E m (MPa)16,167.709.9319,463.7013,823.0015,259.75; 17,075.65
f H 0 (MPa)142.4712.05161.00107.70132.76; 152.18
f H 90 (MPa)123.5610.35142.00101.50116.32; 130.79
f b w   (kJ/m²)40.9525.6458.8820.7335.01; 46.89
Table 3. Results of physical and mechanical properties tests for Tabebuia sp. wood from harvesting regions MT.
Property x ¯ Cv (%)MaxMinCI
ρ (g cm−3)1.064.271.120.981.03; 1.08
ε r , r a d (%)5.429.576.264.865.13; 5.71
ε r , t g (%)7.6212.079.656.527.1; 8.14
f c 0 (MPa)73.6816.0488.3049.9066.99; 80.36
f t 0 (MPa)93.2520.08132.0057.8082.66; 103.84
f t 90 (MPa)3.4738.946.102.002.7; 4.23
f v 0 (MPa)21.7615.4728.7016.9019.85; 23.66
f s 0 (MPa)0.6837.971.300.300.53; 0.82
f m (MPa)117.4117.10153.2088.90106.05; 128.77
E c 0 (MPa)17,363.3114.9721,427.4013,399.5015,892.92; 18,833.7
E t 0 (MPa)18,332.1113.0322,804.9015,132.0016,980.63; 19,683.58
E m (MPa)18,052.4810.9121,400.4015,177.0016,937.98; 19,166.97
f H 0 (MPa)143.5921.78195.4098.60125.9; 161.29
f H 90 (MPa)119.3123.77172.3082.30103.26; 135.35
f b w   (kJ/m²)41.6730.4471.5020.2534.49; 48.84
Table 4. Characteristic strength and strength class for each harvesting region area.
PropertyRR-ARR-BMT
f w k Grading f w k Grading f w k Grading
f c 0 , k (MPa)78.63D6052.93D5053.37D50
f t 0 , k   (MPa)64.1562.1367.69
f t 90 , k (MPa)1.031.671.58
f v 0 , k (MPa)12.5420.2219.54
f s 0 , k (MPa)0.290.510.40
f m , k   (MPa)106.0884.6694.53
f H 0 (MPa)154.79114.4997.57
f H 90 (MPa)100.76114.9790.49
Table 5. Results of ANOVA and Tukey’s test for physical and mechanical properties of Tabebuia sp.
Propertyp-ValorTukey (Grouping)
ANOVAA-DC-MRR-ARR-BMT
ρ (g cm−3)0.0010.0530.245BAB
ε r , r a d (%)0.0010.9840.063BAA
ε r , t g (%)0.0010.9080.075ACB
f c 0 (MPa)0.0060.8140.538ABAB
f t 0 (MPa)0.5570.1900.145AAA
f t 90 (MPa)0.2500.2250.827AAA
f v 0 (MPa)0.8100.1590.415AAA
f s 0 (MPa)0.1870.2930.454AAA
f m (MPa)0.0350.8900.974ABAB
E c 0 (MPa)0.3120.7620.054AAA
E t 0 (MPa)0.0800.3740.297AAA
E m (MPa)0.0410.0190.777ABBA
f H 0 (MPa)0.0570.3490.072AAA
f H 90 (MPa)0.7130.0930.101AAA
f b w   (kJ/m²)0.3180.5160.546AAA
Publisher’s Note: MDPI stays neutral with regard to jurisdictional claims in published maps and institutional affiliations.

