Abstract
Vegetation canopy interception (Ic) of precipitation is a considerable component of the global hydrological cycles. Although the measurement and modeling of canopy interception have been explored worldwide at the individual, stand or ecosystem scale, it is still unclear how to recognize this process at the regional or global scales within the context of global climate change. In this study, a revised Gash model was employed to estimate canopy interception based on remote sensing and meteorological data. The spatial and temporal variations in Ic were investigated and the main environmental factors were explored in China for the 2000–2018 period. The results showed that the revised Gash model performed well in modeling canopy interception at the regional scale compared with the PML_V2 dataset product and the in-situ measurements. The average annual Ic in China from 2000 to 2018 was 166.55 mm, with a significant decreasing spatial pattern from the Southeastern to the Northwestern regions. The ratio of canopy interception to precipitation (Ir) displayed a similar spatial pattern, with an average value of 22.30%. At the temporal scale, the mean annual Ic significantly increased at a rate of 1.79 mm yr−1 (p < 0.01) during the study period, and the increasing trend was more pronounced during the 2000–2009 period, at a rate of 3.34 mm yr−1 (p < 0.01). In most vegetation types, except for the deciduous broad-leaved forest and temperate desert, canopy interception showed a significant increasing trend (p < 0.01). Precipitation, temperature, and the normalized differential vegetation index (NDVI) were considered to be the main factors affecting the variations of Ic in China during the last two decades, with specific dominant factors varying in different areas. Specifically, precipitation was considered to control the variations of Ic in the Northwestern regions, temperature mainly influenced the Southern regions, and the NDVI was identified as the main factor in regions where significant ecological conservation projects are established, such as the Loess Plateau. Our findings are expected to not only contribute to the understanding of regional ecohydrological cycle but also provide valuable insights into the methodology of interception modeling at the regional and global scales.
1. Introduction
Vegetation canopy interception is the process by which gross rainfall falling onto plant surfaces is captured, stored, and subsequently lost through evaporation from the canopy [1]. This process represents water loss from ecosystems and water gain for the atmosphere, and as such it plays a critical role in regulating the global hydrological cycle and land–atmosphere interactions [2,3]. It has been widely reported that canopy interception accounts for more than 20% of the gross rainfall across biomes globally [4], even exceeding 40% in some forest-covered regions [5,6]. In addition, canopy interception is also the main component of evapotranspiration, with proportion values frequently reaching up to 50% in many ecosystems [7]. Despite its importance, vegetation canopy interception has been traditionally simplified as an underestimated constant or even overlooked in many hydrological models [2], leading to great uncertainties in the modeling results and limiting our understanding of regional hydrological processes. Therefore, how to quantify the magnitude of canopy interception across different vegetation biomes has become an important scientific issue in ecohydrological studies in recent years [8,9,10].
Field observations and model simulations are two commonly used methods to estimate the canopy interception of vegetation. The first allows the calculation of interception from the in-situ monitoring throughfall (TF) and stemflow (SF) based on the water balance model, as Ic = P-TF-SF (where P is gross rainfall or precipitation) [11]. Because of its easy operability, the field observation method has been widely used to estimate interception in almost all ecosystems worldwide [4,12,13]. However, due to the randomness of precipitation and diversity of vegetation, long-term monitoring periods are generally required, which makes this method time consuming and costly [14,15]. Model simulations have contributed to addressing this problem, as they allow for estimation of canopy interception based on the available meteorological variables and vegetation canopy parameters [1,16]. Numerous interception models have subsequently been developed to accurately estimate canopy interception loss in various ecosystems, such as regression models [17], empirical models [18], stochastic models [19], and physically based models [9,20,21,22].
Among them, a simple process-based model proposed by Gash (1979), known as the Gash analytical model, has been widely applied due to its simple calculation process and good simulation ability in different ecosystems [1,23,24]. Yet, the original model usually overestimates canopy interception in sparse forests, as it contains a weakness in the description of the canopy cover fraction for this ecosystem [21]. A revised Gash model was therefore reformulated by improving boundary conditions and using evaporation per unit canopy area instead of per unit ground area [21,25]. This reformulated version of the model has been verified to have a good performance in predicting interception under various canopy coverage conditions, from sparse to closed canopy [10,26,27,28,29]. However, both the interception results obtained from field observation and simulation models are mostly limited to individual, stand, or ecosystem scales, and it is uneasy to upscale these models to the regional or global scales [30,31,32]. This limitation does not allow to include interception into global hydrological models and to consider the spatial and temporal information of interception within the current context of global change.
With the development of satellite technology, remote sensing has become a powerful tool to extract spatial and temporal information related to earth surface processes owing to its vast coverage, low costs, and applicability in ungauged areas [32]. Numerous studies employed remote sensing to estimate the flux or reveal the dynamics of water [33,34,35], nutrients [36], and heat [37] in land surfaces, which turned this tool into a conventional but indispensable method in global hydrology research. In recent years, increasing attention has been paid to the application of remote sensing to measure canopy interception at a large scale. For instance, Wu et al. [38] calculated the vegetation canopy interception of rainfall in southern China by combining observed rainfall data and leaf area index data obtained using a moderate resolution imaging spectroradiometer. Ghilain et al. [31] utilized remote sensing data to forecast canopy interception from an empirical interception model in Europe, Africa, and South America. Nevertheless, the above-mentioned studies and a number of other relevant studies mainly inversed canopy interception from remote sensing data through simple regression relationships or empirical formulas. The integration of remote sensing data to a process-based canopy interception model from the perspective of the physical mechanism is still a key technical challenge at present [39]. Although few studies have attempted to use remote sensing data to run the revised Gash model [30,32], the coupling of the remote sensing technique and process-based interception models is still at an early stage, due to the complexity of model parameters and the resolution of remote sensing products. Hence, there is an urgent need for more relevant studies, especially in regions with a wide range of vegetation types and high variability, as the model obtained from these areas have been shown to generally contain more uncertainties.
China is a vast country with a wide range of vegetation types, including forests, shrubs, herbaceous vegetation, alpine tundra, marsh and aquatic vegetation, agricultural and desert vegetation [40]. Due to climate change and ecological conservation projects, vegetation growth significantly increased in most areas of China since the 21st century [41], which contributed to a quarter of the global net increase in vegetation coverage with only 6.6% of the global vegetated area [42]. Specifically, the Loess Plateau China, where the Grain for Green Program is well established, has experienced a distinct increase vegetation coverage, with the NDVI growth rate reaching 0.008 yr−1 during the 2000–2015 period [43]. The karst area in the Guangxi-Yunnan-Guizhou region in Southwestern China, another typical area chosen for ecological conservation projects, saw a stronger vegetation greening trend during the ecological protection period (2001–2016) than during the reference period (1982–2000), and this trend was influenced by eco-engineering [44]. Therefore, within the context of these vegetation changes, it is urgent to elucidate how canopy interception varied in different ecosystems in China during the last two decades in order to understand the ecohydrological effects of vegetation under the persistent impact of climate change and ecological engineering. The objectives of this study were to (1) develop and verify a large-scale revised Gash model running by satellite observation and meteorological data; (2) investigate the spatial and temporal variations of canopy interception in various vegetation types in China since the 21st century; and (3) explore the main factors driving the variations of canopy interception in China.
2. Materials and Methods
2.1. Study Area
China presents a wide range of vegetation types, which are distributed at specific latitudinal and longitudinal zones. In Eastern China, tropical rain forests, monsoon forests, and coniferous forests consecutively occur from South to North and, as moisture decreases from East to West, the vegetation types change from forest, forest grassland, and grassland to desert. Overall, China is divided into the following eight vegetation regions (Figure 1): cold temperate coniferous forest, deciduous broad-leaved forest, Qinghai-Tibet Plateau alpine vegetation, tropical monsoon forest, rain forest, temperate grassland, temperate desert, subtropical evergreen broad-leaved forest, and temperate mixed forest.
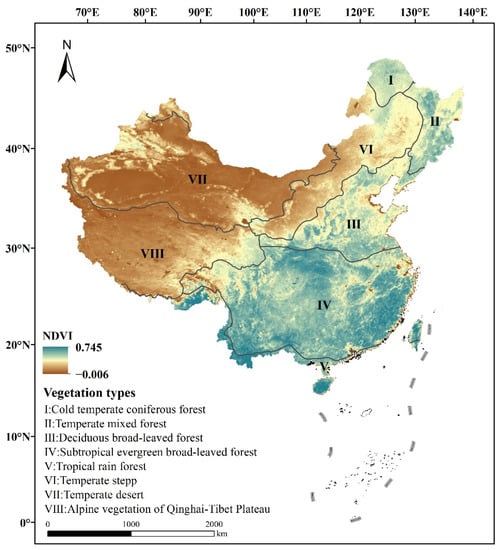
Figure 1.
Vegetation biomes and associated normalized difference vegetation index (NDVI) in China.
2.2. The Revised Gash Model
The analytical Gash model assumes that rainfall events separated by sufficiently long intervals and the intercepted water is completely evaporated before the next rainfall [45]. Three phases could be distinguished in each rainfall event: (1) the wetting phase, as rainfall reaches the canopy; (2) the saturation phase, as the canopy reaches its maximum water storage capacity; and (3) the drying phase after rainfall has ceased. Then, the model adds up the canopy interception of each phase to obtain the total canopy interception. The revised version considers leaves, branches, and crowns as a whole during the estimation of canopy interception [1,21], and introduces additional parameters, such as canopy coverage to simplify the calculation. The calculation formula is:
where m and n indicate that the vegetation is not saturated for m times and is saturated for n times of the m + n precipitation events; Ij is the canopy interception of the jth of m rainfall events; c is the canopy density; q is the number of times that the trunk reaches saturation and produces stemflow; PG,j is the gross rainfall (mm) of the jth of m rainfall events; Sc is the canopy storage capacity and ; St is the trunk storage capacity (mm); is the averaged evaporation rate (mm/h) and ; is the average rainfall rate (mm/h); St is the trunk storage capacity (mm); and Pt is the stem runoff coefficient.
Several studies have attempted to develop the remote sensing based Gash model, and successfully applied it to simulate canopy interception in large-scale regions [30,32,46]. The calculation formula is:
where Ii is the canopy interception of the ith subpixel; Fvc is the vegetation coverage; PG is the gross rainfall; is the rainfall threshold for saturation; is the ratio of the mean evaporation rate to the mean rainfall rate, which is selected on the assumption that the evaporation of the saturated canopy and trunk are the same. The calculation formula of is as follows:
where Sveg is the canopy and stem storage capacity, and it is assumed to be linearly related to the vegetation area index (VAI).
2.3. Data Preparation
The NDVI data were reconstructed from the moderate resolution imaging spectroradiometer (MODIS) products to estimate FVC. In brief, the spatial resolution of the MODIS NDVI product is 500 m and the temporal resolution is 16 days, with the criteria of low clouds, low view angle, and highest NDVI value. The leaf area index (LAI) data-set with a resolution of 500 m in spatial and 8 days in temporal, respectively, were collected from the MODIS LAI product (MYD15A2) to estimate the VAI based on Equation (4):
where LAIg is the leaf area index provided by MODIS LAI product; Ls is the area index of dead leaves, branches, stem, and trunk. In addition, Ls was estimated according to its relationship with the LAI as described in Zeng et al. (2002) [47].
The landcover product (MCD12Q1), which contains 17 landcover types based on the International Geosphere Biosphere Programme (IGBP) classification, was collected to separate different vegetation types. As these vary, the input vegetation parameters changed during the model simulation [32,46].
In the present study, 3-h precipitation intensity data sourced from China’s meteorological forcing dataset, which was supported by the National Tibetan Plateau Scientific Data Center, were used to run the revised Gash model. The dataset was based on tropical rainfall measuring mission (TRMM) precipitation data and reanalysis data, such as Princeton reanalysis data, global land data assimilation system (GLDAS) data, and radiation data from global energy and water exchanges project-surface radiation budget (GEWEX-SRB), and it integrated the conventional meteorological observation data of the China Meteorological Administration, which has a better accuracy of 0.1° [48,49]. A monthly potential evapotranspiration dataset from the National Earth System Science Data Center (http://www.geodata.cn/ accessed on 21 January 2022) was also used to run the model. The data were calculated using the Hargreaves potential evapotranspiration equation with a temporal resolution of 1 mon and a spatial resolution of 1 km [50].
The canopy interception evaporation data (Ei) used for validation were derived from the PML_V2 global evapotranspiration (ET) and gross primary production, which is obtained from the National Qinghai-Tibet Plateau Science Data Center (https://data.tpdc.ac.cn/ accessed on 24 January 2022) [51]. Based on the Penman-Monteith-Leuning (PML) model, PML_V2 coupled the GPP process according to the stomatal conductance theory, which greatly improved the accuracy of the ET simulation. The resolution in spatial and temporal scale were 0.05° and 8 days, respectively. Data from 2003 to 2018 were used for this validation.
2.4. Data Analysis
2.4.1. Model Validation
The validation of the revised Gash model was assessed by comparing the canopy interception both with those acquired from the PML_V2 dataset by randomly selecting 400 sites and with the results of in-situ measurements from 53 sites in 35 peer-reviewed journal articles in China during the 2000–2018 period (File S1). We set the interception from the PML_V2 dataset or in-situ measurements as the benchmark and employed normalized root mean square error (NRMSE), the mean relative error (MRE), and determination coefficient (R2) to assess Gash model’s performance. MRE and NRMSE were calculated using the following equations:
where Yi is the canopy interception simulated by the revised Gash model, Xi is the interception obtained from the PML_V2 dataset or in-situ measurement, n is the number of simulation datasets.
2.4.2. Analysis of Canopy Interception Variation
The spatial and temporal variations in canopy interception were investigated by the Mann-Kendal (MK) test, which is a non-parametric method recommended by the World Meteorological Organization. This test is frequently utilized to determine the long-term trend and variation of precipitation, temperature and runoff because it does not need to obey the same probability distribution [35].
The MK test was calculated using Equations (7) and (8), assuming that the runoff sequence is . Sk represents the cumulative number of the first sample and it is defined as:
where is a step function. The statistical variable Z is defined as:
where Z obeys a normal distribution. Z > 0 indicates an upward trend, while Z < 0 means a downward trend. When is greater than 1.96, the serial trend passes the 95% significance test.
2.4.3. Analysis of the Environmental Factors Influencing Canopy Interception
Canopy interception is mainly affected by vegetation characteristics (vegetation species, canopy structure, etc.) and environmental factors (precipitation characteristics, wind speed, temperature, etc.) [11,52]. The NDVI can reflect the physiological characteristics of vegetation. Thus, temporal evolution was revealed to identify the impacts of environmental variables on canopy interception. The stepwise multiple regression analysis was employed to estimate the relative contribution of each variable to canopy interception, and it specifically included temperature (T), precipitation (P), relative humidity (RH), wind speed (WS), solar radiation (SR), air pressure (AP), potential evapotranspiration (PE), and NDVI. The significance of the multiple regression model was examined by the F-test, which could be reflected by the determination coefficient R2, and the candidate variables were selected for the model based on a 0.05 significance level [53]. All data were normalized before applying the method. The spatial distribution of the relative contributions of these factors in China was obtained by calculating eight environmental variables to canopy interception in each pixel using GIS technology.
Finally, the stepwise multiple regression method was applied by setting the normalized canopy interception as the dependent variable and the normalized environmental variables as predictors (independent variables). The contribution of each influencing factor to the change of precipitation interception was calculated using the following equations:
where Y is the dependent variable, are the independent variables, are the coefficients of this regression equation, and is the relative contribution ratio of each dependent variable to the variations in canopy interception.
3. Results
3.1. Validation of the Revised Gash Model
The canopy interception of the revised Gash model displayed a significantly correlation both with the PML_V2 dataset product (r = 0.8, p < 0.01, Figure 2a) and the in-situ measurements (r = 0.66, p < 0.01, Figure 2b). The points in Figure 2 mainly distributed around the 1:1 line and the NRMSE were both less than 15%, indicating that simulated results of the revised Gash model were relatively robust compared to those obtained from the existing remote sensing products and in-situ measurements.
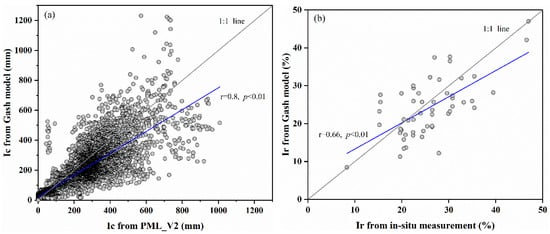
Figure 2.
Comparison of (a) canopy interception (Ic) between the revised Gash model and PML_V2 product and (b) ratio of canopy interception to precipitation (Ir) between the revised Gash model and in-situ measurement.
3.2. Spatial Patterns of Canopy Interception in China
The mean annual canopy interception in China ranged from 0.98 mm to 1423.47 mm (with an average value of 166.55 ± 160.61 mm) from 2000 to 2018 (Figure 3a), showing a significant decreasing pattern from the Southeastern to Northwestern regions. For example, the highest lowest mean annual canopy interception was measured in the tropical rainforest (section VIII) and temperate desert regions, with values of 461.1 ± 161.25 mm and 18.07 ± 22.34 mm, respectively (Figure 4). The ratio of interception to precipitation displayed similar spatial patterns (Figure 3b), with mean annual values ranging from 0.12% to 60.21% and an average value of 22.30 ± 11.45%. In contrast, in the cold temperate coniferous forest region, the Ir was relatively higher, while the Ic was relatively lower.
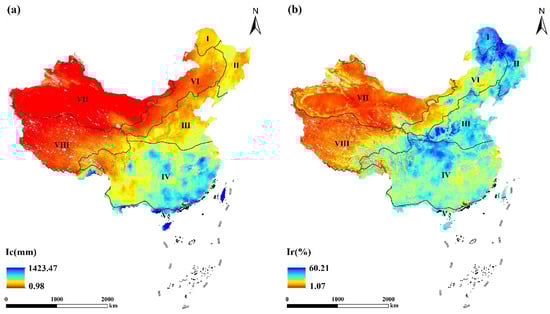
Figure 3.
Spatial patterns of mean annual (a) canopy interception (Ic) and (b) the ratio of interception to precipitation (Ir) from 2000 to 2018. I: cold temperate coniferous forest; II: temperate mixed forest; III: deciduous broad-leaved forest; IV: subtropical evergreen broad-leaved forest; V: tropical rain forest; VI: temperate steppe; VII: temperate desert; VIII: alpine vegetation of Qinghai-Tibet Plateau.
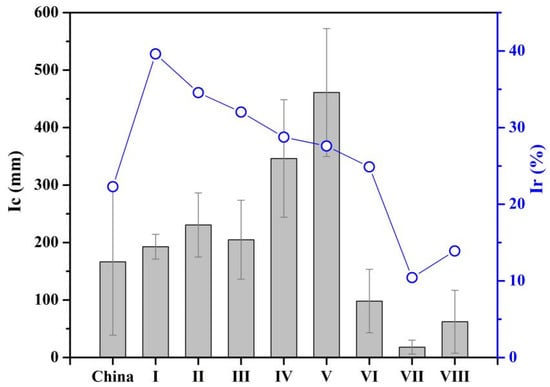
Figure 4.
The canopy interception (Ic) and ratio of interception to precipitation (Ir) of eight vegetation types present in China. The histogram and point plot mean the Ic and Ir, respectively. I: cold temperate coniferous forest; II: temperate mixed forest; III: deciduous broad-leaved forest; IV: subtropical evergreen broad-leaved forest; V: tropical rain forest; VI: temperate steppe; VII: temperate desert; VIII: alpine vegetation of Qinghai-Tibet Plateau.
3.3. Temporal Variation of Canopy Interception in China
The mean annual canopy interception in China significantly increased from 2000 to 2018 (Figure 5), at a rate of 1.79 mm yr−1 (p < 0.01). The increasing trend was more pronounced during the 2000–2009 period, with rates of 3.34 mm yr−1 (p < 0.01), despite a decrease down to 1.14 mm yr−1 observed from 2009 to 2018. In terms of seasonal patterns, canopy interception in summer not only accounted for the largest proportion of annual interception but it also obviously increased, especially between 2000 and 2009, at a rate of 2.26 mm yr−1 (p < 0.01). Canopy interception in spring also increased significantly (p < 0.01), causing a certain impact on annual interception.
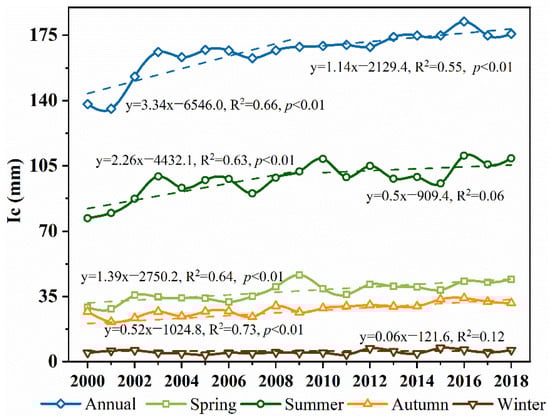
Figure 5.
Interannual variations of the mean canopy interception in China from 2000 to 2018.
The results of the MK test (Figure 6a) showed that in many regions canopy interception displayed an increasing trend during the 2000–2009 period, especially in Northeastern China and in the Loess Plateau, where the increase was significant (p < 0.01). During the 2009–2018 period, the temporal variations were not obvious, except in Southern China (Figure 6b), where a significant increasing trend (p < 0.01) was detected.
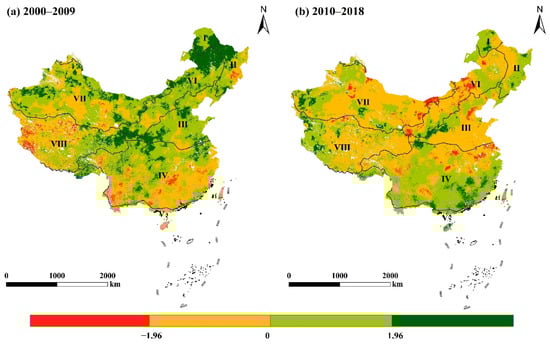
Figure 6.
Spatial distribution of MK test in canopy interception in China (a) from 2000 to 2009 and (b) from 2010 to 2018. I: cold temperate coniferous forest; II: temperate mixed forest; III: deciduous broad-leaved forest; IV: subtropical evergreen broad-leaved forest; V: tropical rain forest; VI: temperate steppe; VII: temperate desert; VIII: alpine vegetation of Qinghai-Tibet Plateau.
In particular, except for the deciduous broad-leaved forest and temperate desert vegetation, the other six vegetation types almost displayed a significant increasing trend (p < 0.01) of canopy interception during the 2000–2018 period (Figure 7I,II,IV–VI,VIII). Among them, the cold temperate coniferous forest and the temperate steppe showed a significantly higher increasing rate (p < 0.01) of canopy interception between 2000 and 2009 than between 2009 and 2018 (Figure 7I,VI), while the remaining four types displayed a significant increasing trend (p < 0.01) during the whole period. Similar with the mean annual value, the canopy interception in summer dominated the most proportion of the annual interception in almost all the vegetation types (Figure S1).
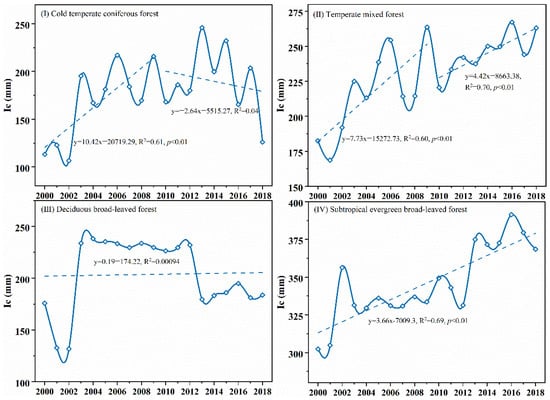
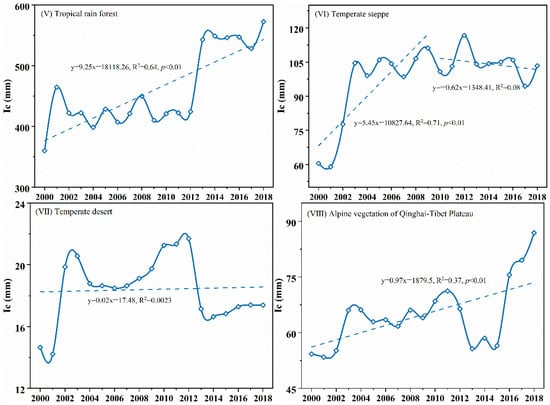
Figure 7.
Interannual variations of canopy interception of eight vegetation types from 2000 to 2018.
3.4. Environmental Factors Affecting Canopy Interception
The results of stepwise multiple regression analysis exhibited precipitation, NDVI, temperature, relative humidity, and solar radiation explained 82% of the variance in canopy interception in China over the past 20 years (Table 1). Among these factors, precipitation, NDVI, and temperature were the main contributors to the variations, and they were also significantly correlated with interception based on the partial correlation analysis (Table S1).

Table 1.
The coefficients of stepwise multiple regression and associating relative contributions of environmental factors on canopy interception.
Specifically, the spatial distributions of the relative contribution of environmental factors have been explicitly visualized to show the main factors influencing canopy interception across the entire country (Figure 8). Precipitation was the dominant variable in Northwestern China, with a relative contribution of over 40% in most of the areas (Figure 8a). In some regions of Xinjiang Province, the relative contribution of precipitation reached even 80–100%. The NDVI was the main environmental factor in the Loess Plateau and some regions of the Tibet Plateau, with relative contribution values approaching 40–60% (Figure 8b). Temperature contributed more than 40% in some Southern regions of China (Figure 8c). Other factors, including wind speed, relative humidity, and solar radiation, contributed less than 20% to the variation of interception in most parts of China (Figure 8d–f).
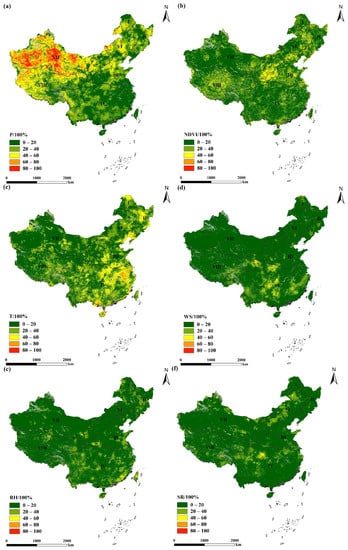
Figure 8.
Spatial pattern of the relative contributions of (a) NDVI, (b) P, (c) RH, (d) SR, (e) T, and (f) WS to canopy interception in China. P: precipitation; NDVI: normal difference vegetation index; T: temperature; WS: wind speed; RH: relative humidity; SR: solar radiation. I: cold temperate coniferous forest; II: temperate mixed forest; III: deciduous broad-leaved forest; IV: subtropical evergreen broad-leaved forest; V: tropical rain forest; VI: temperate steppe; VII: temperate desert; VIII: alpine vegetation of Qinghai-Tibet Plateau.
Overall, the spatial patterns of the dominant environmental factors were obtained to display which ones affected canopy interception the most in China (Figure 9). Based on the results, precipitation, temperature, and NDVI were the predominant variables affecting 47.09%, 25.12%, and 16.29% of China, respectively.
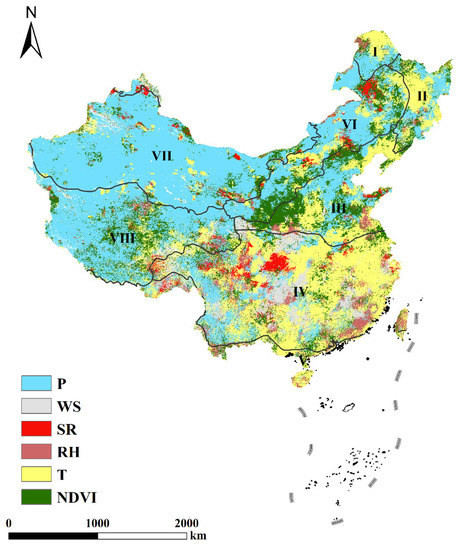
Figure 9.
Dominant environmental factors affecting canopy interception in China. P: precipitation; NDVI: normal difference vegetation index; T: temperature; WS: wind speed; RH: relative humidity; SR: solar radiation. I: cold temperate coniferous forest; II: temperate mixed forest; III: deciduous broad-leaved forest; IV: subtropical evergreen broad-leaved forest; V: tropical rain forest; VI: temperate steppe; VII: temperate desert; VIII: alpine vegetation of Qinghai-Tibet Plateau.
4. Discussion
The validation results of the revised Gash model (Figure 2) meant that the model performed well in estimating canopy interception at the regional scale compared with other products and in-situ measurements [30,32]. The model results revealed that the Ic and Ir in China during the last two decades were 166.55 mm and 22%, respectively (Figure 3), which are in line with the values obtained in previous related studies [54,55]. For example, Zhang et al. [56] conducted a review study by collecting canopy interception data from 86 studies conducted in 47 different research sites located in China and concluded that the Ic and Ir were 209.8 mm and 25.5%, respectively. The results published in this paper are slightly higher than those in present study, which may be due to the scale gaps of different methods. The interception data used in Zhang et al. [56] was based on rainfall event at site scale, and thereby analyzed by the meta-analysis method. Moreover, our study found that the Ir in the coniferous and broadleaved mixed forest in temperate zone of China was 34.56 ± 6.58%, which was close to the result of Zhang et al. [56] (i.e., 35.00 ± 10.50%). Despite the slight differences, the simulated results of canopy interception in the present study were generally in line with those of previous studies.
The results revealed a significant decreasing spatial pattern of the mean annual canopy interception from Southeastern to Northwestern regions in China (Figure 3). This pattern was mainly determined by the spatial distributions of precipitation and vegetation types [4,6]. From Southeast to Northwest, precipitation significantly decreased with the effect of the monsoon climate [57]. In addition, the vegetation type changed from tropical or subtropical forest to temperate steppe or temperate desert (Figure 1), which are characterized by a sparser canopy structure that can retain less rainwater [58]. A similar spatial pattern was also detected in the ratio of interception to precipitation (Figure 3b), except for the cold temperate coniferous forest, which exhibited a relatively higher interception ratio but lower canopy interception. This was mainly because coniferous plants generally present a higher total plant leaf area due to their needle leaf form [4,59]. Magliano et al. [52] collected data on 68 woody plant species worldwide and found that the Ir in needle leaf form was significantly higher than in broad leaf or pinnate leaf forms.
At the temporal scale, the mean annual canopy interception in China increased significantly from 2000 to 2018 (Figure 5) at a rate of 1.79 mm yr−1 (p < 0.01). This increasing trend was most pronounced during the 2000–2009 periods (Figure 5 and Figure 6), with a rate of 1.79 mm yr−1 (p < 0.01). This phenomenon was also reflected in the interception changes observed in most vegetation types (Figure 7I,II,IV–VI,VIII). For instance, in the temperate steppe, the increases in canopy interception were significantly more pronounced between 2000 and 2009, but the trend almost stabilized or even decreased during the 2010–2018 period (Figure 7VI). The subtropical evergreen broad-leaved forest and tropical monsoon forest (Figure 7IV,V), the two vegetation types with the highest canopy interception in China, also experienced a significant increasing trend of canopy interception. In addition, Wu et al. [38] estimated that the mean annual canopy interception gradually increased from 2004 to 2016 in Guangdong Province, China.
Our attribution analysis showed that precipitation, NDVI, temperature, relative humidity, and solar radiation could explain 82% of the variance in canopy interception in China over the last two decades (Table 1). Among these factors, precipitation, NDVI, and temperature were considered as generally predominant in China (Figure 8 and Figure 9), while more specifically dominant factors varied depending on the region. In Northwestern China, precipitation was considered to affect the variation of canopy interception most, with a relative contribution of over 40% in most of the areas or even reaching to 80–100% in some regions (Figure 8a and Figure 9). This is consistent with the results of previous studies reporting that the arid and semiarid regions in Northwestern China have been experiencing an upward trend in precipitation since the 1990s [60,61]. Such increases in precipitation might mean that more rainwater could be intercepted by the vegetation canopy as, in these dry regions, canopies do not easily saturate due to the high potential evapotranspiration [62,63,64]. Temperature was considered as the main dominant factor affecting interception in the subtropical or tropical forest regions of China (Figure 8c and Figure 9). It has been previously reported that temperature in Southern China increased significantly since 1998; specifically, the average daily mean temperature increased by 0.7 °C in 2009–2018 compared to 1961–1970 [65]. The elevated temperature would accelerate the canopy’s evaporation rate, thus improving the interception storage of the vegetation canopy [12,24].
Our results identified the NDVI as another main factor affecting the variation of interception in China (Table 1), especially in the Loess Plateau (Figure 8b and Figure 9). This index has been widely used as a proxy to indicate variations in vegetation coverage [66]. It has been shown that the establishment of a series of ecological conservation projects in the past decades has contributed to widely increasing vegetation coverage in many regions of China [41,42,67], especially in the Loess Plateau where the Grain for Green Project has been implemented since the 1990s [35,68]. For instance, Chen et al. [69] reported that during the 1999–2013 period, the vegetation coverage obviously increased from 31.6% to 59.6%. Such increases might facilitate the growth of vegetation canopy and enhance canopy interception of rainwater [70]. Although the NDVI could be used as a good indicator of regional vegetation changes, many other canopy structure variables still influence the rainfall interception process, including leaf shape, canopy thickness, canopy surface area, and canopy forms [11,52,58,71]. Ignoring these variables would limit the accuracy of the model results for regional canopy interception, therefore they should be considered when modeling regional canopy interception in future studies.
5. Conclusions
This study investigated the spatial and temporal variations in canopy interception by applying a revised Gash model to remote sensing and meteorological data collected in China from 2000 to 2018. The impacts of the main environmental variables on interception were also explored. The results showed that the revised Gash model had a good performance in simulating canopy interception at the regional scale compared with the PML_V2 dataset product and the in situ measurements. The average annual canopy interception was 166.55 ± 160.61 mm during the 2000–2018 period, showing a significant decreasing pattern from Southeastern to Northwestern China. The ratio of canopy interception to precipitation presented similar spatial patterns, with the average value of 22.30 ± 11.45%. At the temporal scale, the mean annual canopy interception over the last two decades increased significantly, at a rate of 1.79 mm yr−1 (p < 0.01), and the increasing trend was more pronounced in the 2000–2009 period, with a rate of 3.34 mm yr−1 (p < 0.01). Except for the deciduous broad-leaved forest and temperate desert, most vegetation types have experienced a significant increasing trend (p < 0.01) of canopy interception. The variations of precipitation, NDVI, temperature, relative humidity, and solar radiation explained 82% of the variations in canopy interception of rainwater. Among these variables, precipitation, temperature, and NDVI predominantly controlled the vegetation canopy interception in China during the last two decades. Overall, the present study successfully applied the revised Gash model at the national scale and provided direct evidence of the spatial and temporal variations of canopy interception in China. The results obtained could greatly improve our understanding of the regional ecohydrological processes and contribute to the development of comprehensive global hydrological models.
Supplementary Materials
The following supporting information can be downloaded at: https://www.mdpi.com/article/10.3390/f13091404/s1, Figure S1: Interannual variations of canopy interception of eight vegetation types in different seasons from 2000 to 2018; Table S1: Partial correlation coefficients between interception and the environmental factors; File S1: A list of selected papers from which the data were extracted from field studies for validation.
Author Contributions
Conceptualization, Z.-Y.J. and W.H.; methodology, Z.-Y.J., W.H., C.-M.L. and Y.J.; software, W.H., Y.J., Y.Y., J.-H.P. and Y.-D.Z.; validation, Z.-Y.J., C.-M.L. and G.-L.H.; data curation, Y.Y. and J.-H.P.; writing—original draft preparation, Z.-Y.J., W.H. and Y.J.; writing—review and editing, Z.-Y.J., W.H. and Y.J.; visualization, Y.Y. and S.-Y.Z.; supervision, Z.-Y.J.; project administration, Z.-Y.J.; funding acquisition, Z.-Y.J. All authors have read and agreed to the published version of the manuscript.
Funding
This research was funded by National Natural Science Foundation of China (Grant No. 41901027) and the Natural Science Foundation of Guangdong Province, China (Grant No. 2021A1515012208).
Institutional Review Board Statement
Not applicable.
Informed Consent Statement
Not applicable.
Data Availability Statement
The data presented in this study are available on request from the corresponding author.
Acknowledgments
The authors would like to thank Yao-Kui Cui and Chao-Lei Zheng for assistance with model development and data analysis and are grateful for the support of the Pearl River Delta Forest Ecosystem Research Station. We also appreciate the handing editor and the anonymous reviewers for their valuable comments to improve this manuscript.
Conflicts of Interest
The authors declare no conflict of interest.
References
- Muzylo, A.; Llorens, P.; Valente, F.; Keizer, J.J.; Domingo, F.; Gash, J.H. A review of rainfall interception modelling. J. Hydrol. 2009, 370, 191–206. [Google Scholar] [CrossRef]
- Savenije, H.H.G. The importance of interception and why we should delete the term evapotranspiration from our vocabulary. Hydrol. Process. 2004, 18, 1507–1511. [Google Scholar] [CrossRef]
- Sun, S.; Xiang, W.; Ouyang, S.; Hu, Y.; Zhao, Z.; Xu, X.; Yue, K.; Chen, L.; Zeng, Y.; Lei, P.; et al. Higher canopy interception capacity of forests restored to the climax stage in subtropical China. Hydrol. Process. 2022, 36, e14538. [Google Scholar] [CrossRef]
- Yue, K.; De Frenne, P.; Fornara, D.A.; Van Meerbeek, K.; Li, W.; Peng, X.; Ni, X.Y.; Peng, Y.; Wu, F.Z.; Yang, Y.S.; et al. Global patterns and drivers of rainfall partitioning by trees and shrubs. Global Chang. Biol. 2021, 27, 3350–3357. [Google Scholar] [CrossRef] [PubMed]
- Price, A.G.; Carlyle-Moses, D.E. Measurement and modelling of growing-season canopy water fluxes in a mature mixed deciduous forest stand, southern Ontario, Canada. Agric. For. Meteorol. 2003, 119, 69–85. [Google Scholar] [CrossRef]
- Llorens, P.; Domingo, F. Rainfall partitioning by vegetation under Mediterranean conditions. A review of studies in Europe. J. Hydrol. 2007, 335, 37–54. [Google Scholar] [CrossRef]
- Ringgaard, R.; Herbst, M.; Friborg, T. Partitioning forest evapotranspiration: Interception evaporation and the impact of canopy structure, local and regional advection. J. Hydrol. 2014, 517, 677–690. [Google Scholar] [CrossRef]
- Van Dijk, A.; Gash, J.H.; van Gorsel, E.; Blanken, P.D.; Cescatti, A.; Emmel, C.; Gielen, B.; Harman, I.N.; Kiely, G.; Merbold, L.; et al. Rainfall interception and the coupled surface water and energy balance. Agric. For. Meteorol. 2015, 214, 402–415. [Google Scholar] [CrossRef]
- Návar, J. Modelling rainfall interception loss components of forests. J. Hydrol. 2020, 584, 124449. [Google Scholar] [CrossRef]
- Wang, D.; Wang, L.; Zhang, R. Measurement and modeling of canopy interception losses by two differently aged apple orchards in a subhumid region of the Yellow River Basin. Agric. Water Manag. 2022, 269, 107667. [Google Scholar] [CrossRef]
- Crockford, R.H.; Richardson, D.P. Partitioning of rainfall into throughfall, stemflow and interception: Effect of forest type, ground cover and climate. Hydrol. Process. 2000, 14, 2903–2920. [Google Scholar] [CrossRef]
- Dunkerley, D. Measuring interception loss and canopy storage in dryland vegetation: A brief review and evaluation of available research strategies. Hydrol. Process. 2000, 14, 669–678. [Google Scholar] [CrossRef]
- Wang, D.; Wang, L. Canopy interception of apple orchards should not be ignored when assessing evapotranspiration partitioning on the Loess Plateau in China. Hydrol. Process. 2018, 33, 372–382. [Google Scholar] [CrossRef]
- Cuartas, L.A.; Tomasella, J.; Nobre, A.D.; Hodnett, M.G.; Waterloo, M.J.; Múnera, J.C. Interception water-partitioning dynamics for a pristine rainforest in Central Amazonia: Marked differences between normal and dry years. Agric. For. Meteorol. 2007, 145, 69–83. [Google Scholar] [CrossRef]
- Zimmermann, A.; Zimmermann, B. Requirements for throughfall monitoring: The roles of temporal scale and canopy complexity. Agric. For. Meteorol. 2014, 189, 125–139. [Google Scholar] [CrossRef]
- Rutter, A.J.; Morton, A.J.; Robins, P.C. A predictive model of rainfall interception in forests II: Generalization of the model and comparison with observations in some coniferous and hardwood stands. J. Appl. Ecol. 1975, 12, 367–380. [Google Scholar] [CrossRef]
- Grunicke, S.; Queck, R.; Bernhofer, C. Long-term investigation of forest canopy rainfall interception for a spruce stand. Agric. For. Meteorol. 2020, 292, 108125. [Google Scholar] [CrossRef]
- Magliano, P.N.; Whitworth-Hulse, J.I.; Cid, F.D.; Leporati, J.L.; Van Stan, J.T.; Jobbágy, E.G. Global rainfall partitioning by dryland vegetation: Developing general empirical models. J. Hydrol. 2022, 607, 127540. [Google Scholar] [CrossRef]
- Calder, I.R. Rainfall interception and drop size-development and calibration of the two-layer stochastic interception model. Tree Physiol. 1996, 16, 727–732. [Google Scholar] [CrossRef]
- Rutter, A.J.; Kershaw, K.A.; Robins, P.C.; Morton, A.J. A predictive model of rainfall interception in forests I: Derivation of the model from observations in a plantation of Corsican pine. J. Agric. Meteorol. 1971, 9, 367–384. [Google Scholar] [CrossRef]
- Gash, J.H.C.; Lloyd, C.R.; Lachaud, G. Estimating sparse forest rainfall interception with an analytical model. J. Hydrol. 1995, 170, 79–86. [Google Scholar] [CrossRef]
- Pereira, F.L.; Valente, F.; David, J.S.; Jackson, N.; Minunno, F.; Gash, J.H. Rainfall interception modelling: Is the wet bulb approach adequate to estimate mean evaporation rate from wet/saturated canopies in all forest types? J. Hydrol. 2016, 534, 606–615. [Google Scholar] [CrossRef][Green Version]
- Gash, J.H.C.; Wright, I.R.; Lloyd, C.R. Comparative estimates of interception loss from three coniferous forests in Great Britain. J. Hydrol. 1980, 48, 89–105. [Google Scholar] [CrossRef]
- Herbst, M.; Rosier, P.T.W.; McNeil, D.D.; Harding, R.J.; Gowing, D.J. Seasonal variability of interception evaporation from the canopy of a mixed deciduous forest. Agric. For. Meteorol. 2008, 148, 1655–1667. [Google Scholar] [CrossRef]
- Sadeghi, S.M.M.; Attarod, P.; Van Stan, J.T.; Pypker, T.G.; Dunkerley, D. Efficiency of the reformulated Gash’s interception model in semiarid afforestations. Agric. For. Meteorol. 2015, 201, 76–85. [Google Scholar] [CrossRef]
- Valente, F.; David, J.S.; Gash, J.H.C. Modelling interception loss for two sparse eucalypt and pine forests in central Portugal using reformulated Rutter and Gash analytical models. J. Hydrol. 1997, 190, 141–162. [Google Scholar] [CrossRef]
- Návar, J. The performance of the reformulated Gash’s interception loss model in Mexico’s northeastern temperate forests. Hydrol. Process. 2013, 27, 1626–1633. [Google Scholar] [CrossRef]
- Su, L.; Zhao, C.; Xu, W.; Xie, Z. Modelling interception loss using the revised Gash model: A case study in a mixed evergreen and deciduous broadleaved forest in China. Ecohydrology 2016, 9, 1580–1589. [Google Scholar] [CrossRef]
- Zhang, S.Y.; Li, X.Y.; Jiang, Z.Y.; Li, D.Q.; Lin, H. Modelling of rainfall partitioning by a deciduous shrub using a variable parameters Gash model. Ecohydrology 2018, 11, e2011. [Google Scholar] [CrossRef]
- Miralles, D.G.; Gash, J.H.; Holmes, T.R.H.; de Jeu, R.A.M.; Dolman, A.J. Global canopy interception from satellite observations. J. Geophys. Res. 2010, 115, D16122. [Google Scholar] [CrossRef]
- Ghilain, N.; Arboleda, A.; Barrios, J.M.; Gellens-Meulenberghs, F. Water interception by canopies for remote sensing based evapotranspiration models. Int. J. Remote Sens. 2020, 41, 2934–2945. [Google Scholar] [CrossRef]
- Zheng, C.; Jia, L. Global canopy rainfall interception loss derived from satellite earth observations. Ecohydrology 2020, 13, e2186. [Google Scholar] [CrossRef]
- AghaKouchak, A.; Farahmand, A.; Melton, F.S.; Teixeira, J.; Anderson, M.C.; Wardlow, B.D.; Hain, C.R. Remote sensing of drought: Progress, challenges and opportunities. Rev. Geophys. 2015, 53, 452–480. [Google Scholar] [CrossRef]
- Babaeian, E.; Sadeghi, M.; Jones, S.B.; Montzka, C.; Vereecken, H.; Tuller, M. Ground, proximal, and satellite remote sensing of soil moisture. Rev. Geophys. 2019, 57, 530–616. [Google Scholar] [CrossRef]
- Jiang, Z.Y.; Yang, Z.G.; Zhang, S.Y.; Liao, C.M.; Hu, Z.M.; Cao, R.C.; Wu, H.W. Revealing the spatio-temporal variability of evapotranspiration and its components based on an improved Shuttleworth-Wallace model in the Yellow River Basin. J. Environ. Manag. 2020, 262, 110310. [Google Scholar] [CrossRef] [PubMed]
- Angelopoulou, T.; Tziolas, N.; Balafoutis, A.; Zalidis, G.; Bochtis, D. Remote sensing techniques for soil organic carbon estimation: A review. Remote Sens. 2019, 11, 676. [Google Scholar] [CrossRef]
- Zhou, D.; Xiao, J.; Bonafoni, S.; Berger, C.; Deilami, K.; Zhou, Y.; Frolking, S.; Yao, R.; Qiao, Z.; Sobrino, J.A. Satellite remote sensing of surface urban heat islands: Progress, challenges, and perspectives. Remote Sens. 2019, 11, 48. [Google Scholar] [CrossRef]
- Wu, J.; Liu, L.; Sun, C.; Su, Y.; Wang, C.; Yang, J.; Liao, J.; He, X.; Li, Q.; Zhang, C.; et al. Estimating rainfall interception of vegetation canopy from MODIS imageries in Southern China. Remote Sens. 2019, 11, 2468. [Google Scholar] [CrossRef]
- Gutmann, E.D. Global modelling of precipitation partitioning by vegetation and their applications. In Precipitation Partitioning by Vegetation: A Global Synthesis; Van Stan, J.T., Gutmann, E., Friesen, J., Eds.; Springer: Berlin/Heidelberg, Germany, 2020. [Google Scholar]
- Fang, J.Y.; Guo, K.; Wang, G.H.; Tang, Z.Y.; Xie, Z.Q.; Shen, Z.H.; Wang, R.Q.; Qiang, S.; Liang, C.Z.; Da, L.J.; et al. Vegetation classification system and classification of vegetation types used for the compilation of vegetation of China. Chin. J. Plant Ecol. 2020, 44, 96–110. (In Chinese) [Google Scholar] [CrossRef]
- Piao, S.L.; Yin, G.D.; Tan, J.G.; Cheng, L.; Huang, M.T.; Li, Y.; Liu, R.G.; Mao, J.F.; Myneni, R.B.; Peng, S.S.; et al. Detection and attribution of vegetation greening trend in China over the last 30 years. Glob. Chang. Biol. 2015, 21, 1601–1609. [Google Scholar] [CrossRef]
- Chen, C.; Park, T.; Wang, X.; Piao, S.; Xu, B.; Chaturvedi, R.K.; Fuchs, R.; Brovkin, V.; Ciais, P.; Fensholt, R.; et al. China and India lead in greening of the World through land-use management. Nat. Sustain. 2019, 2, 122–129. [Google Scholar] [CrossRef] [PubMed]
- Li, J.; Peng, S.; Li, Z. Detecting and attributing vegetation changes on China’s Loess Plateau. Agric. For. Meteorol. 2017, 247, 260–270. [Google Scholar] [CrossRef]
- Zhang, X.; Yue, Y.; Tong, X.; Wang, K.; Qi, X.; Deng, C.; Brandit, M. Eco-engineering controls vegetation trends in southwest China karst. Sci. Total Environ. 2021, 770, 145160. [Google Scholar] [CrossRef] [PubMed]
- Gash, J.H.C. Analytical model of rainfall interception by forests. Q. J. Roy. Meteor. Soc. 1979, 105, 43–55. [Google Scholar] [CrossRef]
- Cui, Y.K.; Jia, L. A Modified Gash Model for Estimating Rainfall Interception Loss of Forest Using Remote Sensing Observations at Regional Scale. Water 2014, 6, 993. [Google Scholar] [CrossRef]
- Zeng, X.; Shaikh, M.; Dai, Y.; Dickinson, R.E.; Myneni, R. Coupling of the common land model to the NCAR community climate model. J. Clim. 2002, 15, 1832–1854. [Google Scholar] [CrossRef]
- Yang, K.; He, J.; Tang, W.; Qin, J.; Cheng, C. On downward shortwave and longwave radiations over high altitude regions: Observation and modeling in the Tibetan Plateau. Agric. For. Meteorol. 2010, 150, 38–46. [Google Scholar] [CrossRef]
- He, J.; Yang, K.; Tang, W.; Lu, H.; Qin, J.; Chen, Y.; Li, X. The first high-resolution meteorological forcing dataset for land process studies over China. Sci. Data. 2020, 7, 25. [Google Scholar] [CrossRef]
- Peng, S.; Ding, Y.; Wen, Z.; Chen, Y.; Cao, Y.; Ren, J. Spatiotemporal change and trend analysis of potential evapotranspiration over the Loess Plateau of China during 2011–2100. Agric. For. Meteorol. 2017, 233, 183–194. [Google Scholar] [CrossRef]
- Zhang, Y.; Kong, D.; Gan, R.; Chiew, F.; McVicar, T.; Zhang, Q.; Yang, Y. Coupled estimation of 500 m and 8-day resolution global evapotranspiration and gross primary production in 2002–2017. Remote Sens. Environ. 2019, 222, 165–182. [Google Scholar] [CrossRef]
- Magliano, P.N.; Whitworth-Hulse, J.I.; Baldi, G. Interception, throughfall and stemflow partition in drylands: Global synthesis and meta-analysis. J. Hydrol. 2019, 568, 638–645. [Google Scholar] [CrossRef]
- Grinsted, A.; Moore, J.C.; Jevrejeva, S. Application of the cross wavelet transform and wavelet coherence to geophysical time series. Nonlinear Proc. Geoph. 2004, 11, 561–566. [Google Scholar] [CrossRef]
- Wen, Y.G.; Liu, S.R. Quantitative analysis of the characteristics of rainfall interception of main forest ecosystems in China. Sci. Silva. Sinicae. 1995, 31, 289–298. (In Chinese) [Google Scholar]
- Liu, S.R.; Sun, P.S.; Wen, Y.G. Comparative analysis of hydrological functions of major forest ecosystems in China. Chin. J. Plant Ecol. 2003, 27, 16–22. (In Chinese) [Google Scholar]
- Zhang, Q.; Lv, X.; Yu, X.; Ni, Y.; Ma, L.; Liu, Z. Species and spatial differences in vegetation rainfall interception capacity: A synthesis and meta-analysis in China. Catena 2022, 213, 106223. [Google Scholar] [CrossRef]
- Zhai, P.M.; Zhang, X.B.; Wan, H.; Pan, X.H. Trends in total precipitation and frequency of daily precipitation extremes over China. J. Clim. 2005, 18, 1096–1108. [Google Scholar] [CrossRef]
- Tu, L.; Xiong, W.; Wang, Y.; Yu, P.; Liu, Z.; Han, S.; Yu, Y.; Shi, Z.; Guo, H.; Li, Z.; et al. Integrated effects of rainfall regime and canopy structure on interception loss: A comparative modelling analysis for an artificial larch forest. Ecohydrology 2021, 14, e2283. [Google Scholar] [CrossRef]
- Barbier, S.; Balandier, P.; Gosselin, F. Influence of several tree traits on rainfall partitioning in temperate and boreal forests: A review. Ann. Forest Sci. 2009, 66, 602. [Google Scholar] [CrossRef]
- Peng, D.; Zhou, T. Why was the arid and semiarid northwest China getting wetter in the recent decades? J. Geophys. Res.-Atmos. 2017, 122, 9060–9075. [Google Scholar] [CrossRef]
- Lu, C.; Ma, L.; Liu, T.; Huang, X.; Sun, G. Quantitative response relationships between annual precipitation in China from 1951 to 2018 and its influencing factors. Hydrol. Res. 2022, 53, 766–781. [Google Scholar] [CrossRef]
- Wang, X.; Zhang, Y.; Hu, R.; Pan, Y.; Berndtsson, R. Canopy storage capacity of xerophytic shrubs in Northwestern China. J. Hydrol. 2012, 454, 152–159. [Google Scholar] [CrossRef]
- Zhang, Y.; Wang, X.; Hu, R.; Pan, Y.; Paradelouc, M. Rainfall partitioning into throughfall, stemflow and interception loss by two xerophytic shrubs within a rain-fed re-vegetated desert ecosystems, northwestern China. J. Hydrol. 2015, 527, 1084–1095. [Google Scholar] [CrossRef]
- Zabret, K.; Rakovec, J.; Šraj, M. Influence of meteorological variables on rainfall partitioning for deciduous and coniferous tree species in urban area. J. Hydrol. 2018, 558, 29–41. [Google Scholar] [CrossRef]
- Song, Y.; Wang, C.; Linderholm, H.W.; Fu, Y.; Cai, W.; Xu, J.; Zhuang, L.; Wu, M.; Shi, Y.; Wang, G.; et al. The negative impact of increasing temperatures on rice yields in southern China. Sci. Total Environ. 2022, 820, 153262. [Google Scholar] [CrossRef] [PubMed]
- Pettorelli, N.; Vik, J.O.; Mysterud, A.; Gaillard, J.M.; Tucker, C.J.; Stenseth, N.C. Using the satellite-derived NDVI to assess ecological responses to environmental change. Trends Eco. Evol. 2005, 20, 503–510. [Google Scholar] [CrossRef]
- Peng, S.; Chen, A.; Xu, L.; Cao, C.; Fang, J.; Myneni, R.B.; Pinzon, J.E.; Tucker, C.J.; Piao, S. Recent change of vegetation growth trend in China. Environ. Res. Lett. 2011, 6, 044027. [Google Scholar] [CrossRef]
- Feng, X.; Fu, B.; Piao, S.; Wang, S.; Ciais, P.; Zeng, Z.; Lü, Y.; Zeng, Y.; Li, Y.; Jiang, X.; et al. Revegetation in China’s Loess Plateau is approaching sustainable water resource limits. Nat. Clim. Chang. 2016, 6, 1019–1022. [Google Scholar] [CrossRef]
- Chen, Y.; Wang, K.; Lin, Y.; Shi, W.; Song, Y.; He, X. Balancing green and grain trade. Nat. Geosci. 2015, 8, 739–741. [Google Scholar] [CrossRef]
- Yan, T.; Wang, Z.; Liao, C.; Xu, W.; Wan, L. Effects of the morphological characteristics of plants on rainfall interception and kinetic energy. J. Hydrol. 2021, 592, 125807. [Google Scholar] [CrossRef]
- Holder, C.D.; Gibbes, C. Influence of leaf and canopy characteristics on rainfall interception and urban hydrology. Hydrol. Sci. J. 2017, 2, 182–190. [Google Scholar] [CrossRef]


Publisher’s Note: MDPI stays neutral with regard to jurisdictional claims in published maps and institutional affiliations. |
© 2022 by the authors. Licensee MDPI, Basel, Switzerland. This article is an open access article distributed under the terms and conditions of the Creative Commons Attribution (CC BY) license (https://creativecommons.org/licenses/by/4.0/).