Review

A Review of Forest Fire Combating Efforts, Challenges and Future Directions in Peninsular Malaysia, Sabah, and Sarawak

1
Faculty of Information Science and Technology, Multimedia University, Jalan Ayer Keroh Lama, Melaka 75450, Malaysia
2
College of Engineering and Computer Science, VinUniversity, Hanoi 100000, Vietnam
*
Author to whom correspondence should be addressed.
Forests 2022, 13(9), 1405; https://doi.org/10.3390/f13091405
Submission received: 26 July 2022 / Revised: 10 August 2022 / Accepted: 28 August 2022 / Published: 1 September 2022
(This article belongs to the Section Natural Hazards and Risk Management)

Abstract

:
The land surface of Malaysia mostly constitutes forest cover. For decades, forest fires have been one of the nation’s most concerning environmental issues. With the advent of machine learning, many studies have been conducted to resolve forest fire issues. However, the findings and results have been very case-specific. Most experiments have focused on particular regions with independent methodology settings, which has hindered the ability of others to reproduce works. Another major challenge is lack of benchmark datasets in this domain, which has made benchmark comparisons almost impossible to conduct. To our best knowledge, no comprehensive review and analysis have been performed to streamline the research direction for forest fires in Malaysia. Hence, this paper was aimed to review all works aimed to combat forest fire issues in Malaysia from 1989 to 2021. With the proliferation of publicly accessible satellite data in recent years, a new direction of utilising big data platforms has been postulated. The merit of this approach is that the methodology and experiments can be reproduced. Thus, it is strongly believed that the findings and analysis shown in this paper will be useful as a baseline to propagate research in this domain.

1. Introduction

Fire is considered an environmental factor in the Mediterranean climate, having played an obvious evolutionary role in the structure and function of Mediterranean climate ecosystems. In the aftermath of wildfires, accelerated erosion occurs [1,2], thus threatening the natural regeneration process. Additionally, it is well-acknowledged that water erosion, biodiversity, and biotic natural capital affect recovery [3,4]. To that end, emergency post-wildfire erosion-mitigation treatments are required to enhance ecosystem sustainability as in highly fire-prone ecosystems featuring losses of biodiversity, ecosystem function, or services following wildfire events occurring with unnaturally high frequencies, the magnitude of extent or intensity can result in land degradation or even the complete transformation of the ecosystem. In addition to their impacts on the carbon cycle, such events, usually called as megafires because of their size, reduce the amount of living biomass, affect species composition, affect water and nutrient cycles, increase flood risk and soil erosion, and threaten local livelihoods by burning agricultural lands and homes. In addition, these fires have devastating impacts on local wildlife, as animals either are unable to escape from the fires or become threatened by the loss of their habitat, food and shelter.
Climate change [5] and the wildland–urban interfaces (WUIs) [6] have increased the frequency and devastating impacts of wildfires. The effects of global climate change have led to a rise in temperature and a fall in precipitation, shaping a prolonged dry and warm period that favours the ignition and spread of wildfires [5]. Radeloff et al. [6] stated that the upsurge of new housing development in WUI areas, specifically near forest regions, generally increases the likelihood of wildfire occurrence. The combination of the aforementioned conditions converts wildfires into megafires. A megafire is an extraordinary fire that devastates a large area. Megafires are notable for their physical characteristics including intensity, size, duration, and uncontrollable dimension, as well as their social characteristics, including suppression cost, damage, and fatalities [7].
Forest fires recur periodically in Malaysia due to many factors, such as human negligence [8,9], topography [10], and meteorology [11]. In the last two years [12,13,14], haze and forest fires caused serious environmental problems in Malaysia and its neighbouring countries. Forests play a critical role in sustaining the human environment. Most forest fires not only destroy the natural environment and ecological balance but also seriously threaten the security of life and property. Thus, the early discovery and forecasting of forest fires are both urgent and necessary for forest fire control, and they have become one of the nation’s interests.
Forest fires and the resultant smoke-haze are not relatively new experiences in Malaysia. Despite improved management, wildfires have not been completely eradicated and seem to be increasing in intensity and periodically recurring due to many factors, e.g., climatic factors, improper peatland management, traditional slash and burn activities, and poor water management. In 2019, haze and forest fires caused a serious environmental problem for Malaysia and its neighbouring countries, including Indonesia, Singapore and Brunei. The forests and peatlands in Pahang caught fire in early February 2019 [15]. In August 2019, the forest fires in Riau shrouded the entire Klang valley with dense haze. Additionally, some major cities and towns in the state of Sarawak, including Kuching, were also affected by the haze resulting from the Kalimantan wildfire. Subsequently, the air quality in Kuala Baram and Miri reached hazardous levels that led to Malaysia activating its National Action Plan for Open Burning and its existing National Haze Action Plan on 14 August 2019. Many states were shrouded, including Pahang, Kuala Lumpur, Negeri Sembilan, Penang, Putrajaya, Selangor, Sabah and Sarawak, by the haze [16,17,18]. Subsequently, 2.4 hectares (ha) of forest were also burned in Johor in August 2019 [19]. Historical data have shown that the incidence of forest fires are more severe in Sabah [20] and Sarawak [9] than in Peninsular Malaysia. The worst fire in Sabah happened from 1983 to 1985 [21] due to the severe drought caused by the El Nino phenomenon [22]. About one million ha in mostly over-logged forests disappeared [20]. An uncontrolled forest fire can alter forest ecosystems and lead to social, economic, and environmental losses. Moreover, pollution from fires leads to respiratory problems in people living hundreds of kilometres away.
From the global perspective, the explosion of machine learning and artificial intelligence had undoubtedly inspired researchers to adopt machine learning and deep learning algorithms to combat the issues of forest fires [23,24]. However, most studies have utilised independent sets of methodology focussing on particular regions, thus preventing the replication of experiments. Since each fire incident may be triggered or promoted by different topologies, climates, weather, forest structures, or landcover conditions [25,26], solutions should be fine-tuned based on the study location to effectively tackle fires.
To the best of our knowledge, a comprehensive review and analysis has yet to be conducted in Malaysia. For this reason, all relevant forest fire efforts from 1989 to 2021 for Malaysia are described in Section 2 of this manuscript. The predominant aim of this review is to provide future researchers with a foundation to streamline, progress, and advance research on forest fires in Malaysia. Subsequently, all data that were exploited by the works performed in Malaysia are compiled and reviewed in Section 3. Following the rapid increase in the availability of public satellite data motivated by open data policies [27], traditional computing platforms may not be able to process and analyse the newfound petabytes of data. Additionally, the adoption of big data platforms such as Open Data Cube [28], Google Earth Engine [29], and Planetary Computer [30] to conduct geospatial analysis also promotes and encourages experimental reproducibility through script sharing [27]. Hence, Section 3.1 features a short discussion on the presently available big data platforms. Through the review deliberated in Section 2, we show that no previously published works exploited the advantage of machine learning for forest fire management in Malaysia. Consequently, Section 4 presents a discussion of some of the notable machine learning and deep learning approaches used to resolve the issue of forest fires from a global perspective. Based on all the presented discussions, some challenges, future directions, and open research questions are described in Section 5 for future researchers that wish to venture into the journey of combating forest fires in Malaysia. A general methodology utilising remote sensing data to perform forest fire research is also described in Section 6. Additionally, a discussion of the need for a forest fire benchmark dataset and general techniques of forest fire detection are elaborated in Section 7 and Section 8. Towards the end of the manuscript, some commonly employed fire spread models that have yet to be adopted in Malaysia are presented in Section 9. Finally, Section 10 provides the concluding remarks for this entire review.

2. Related Forest Fire Studies in Malaysia

Though several reviews have previous been conducted [23,24,31,32,33], none of them were dedicated to forest fires in Malaysia. Hence, a detailed description for each of the published works is provided three subsections based on their primary objectives followed by an in-depth review of each of the efforts. The first subsection discusses the initial research directions, which is intended to reveal the root causes and impacts of forest fires. The main objective of the second subsection is to generate a fire susceptibility map for predicting or locating fire incidents by utilising remote sensing information. In the third subsection, some of the efforts closely associated with forest fires such as estimating burnt areas, assessing the amount of pollutants discharged from forest fires, and analysing the relationship between haze events and mortality rate are discussed. To reiterate, the reviews provided in this section only encompass the efforts that have been performed in Malaysia.

2.1. Root Causes and Impacts of Forest Fire

The 1983 El Nino Southern Oscillation phenomenon caused a severe drought condition that ignited horrendous wildfires in the tropical forests of Borneo [22]. Despite the dry scenario precipitated by El Nino, Woods [21] mentioned that a large-scale forest fire was not triggered when severe droughts were previously encountered. He speculated this disastrous fire might have been caused by forest logging, which resulted in the forest becoming more fire prone. Approximately one million ha of forest were burnt in Sabah, Malaysia, according to Beaman et al. [20]. The incident sparked interest in researchers and communities around the world to measure the severity of the disaster. Additionally, several studies have also been conducted to theoretically investigate the root causes of forest fires.
Woods [21] studied the effect and impact of forest fires on primary tropical forests and over-logged forests in Sabah. He reported that the tree mortality rate in a logged forest is higher than in a primary forest. Regarding the recovery of forest structure, a primary forest can recover from fires but a logged forest’s structure recovery greatly depends on the secondary tree species grown across the burnt areas.
Following the devastating forest fire that occurred in 1997 and 1998, the International Tropical Timber Organisation Mission visited in September 1998 to review the causes and implications of the forest fires in Kalimantan, Indonesia, and Sarawak, Malaysia [9]. They reported that primary forests (i.e., undisturbed natural forests) were considerably less likely to ignite than logged forests and industrial plantations in the possession and control of humans. They reported an estimated 6~7 million ha of land and 800 thousand ha of forests were burnt in the incident. A total financial damage of approximate 5~6 billion US dollars was assessed. Apart from the economic damage, the health of the communities in Malaysia, Indonesia, and neighbouring countries was also severely affected due to the air pollution caused by the smoke discharged from the forest fires. Haze events occurred in neighbouring countries during that period, and the atmospheric pollution index was higher than 850 for certain locations in Malaysia and Indonesia. It should be noted that an air pollutant index value exceeding 300 is considered hazardous to humans based on the standard air pollutant index in Malaysia [34]. The importance of utilising remote sensing technology to detect and predict forest fire activity was also highlighted and stressed.
Abdullah et al. [8] investigated plausible factors instigating forest fires that occurred from 1991 to 2001 in Peninsular Malaysia. The researchers identified that most of the incidents were caused by human activity such as smoking, hunting, and land preparation by farmers involving open burning. Intensified by the elongated draught condition, a fire broke out at each of the specified locations. In their study, they discovered there was no correlation between natural events and each of the forest fire incidents. The authors also emphasised that peat swamp forests were more susceptible to fire due to their unique characteristics. One possible reason deduced by them was the formation of thick humus layers in the ground that materialised over several years, becoming a potentially suitable fire fuel. From 1991 to 2001, the Selangor State of Malaysia was reported have the highest frequency of forest fire incidents.
Musa and Parlan [35] further studied the rationalisation suggested by Abdullah et al. [8] regarding the primary factor accountable for forest fires, i.e., human activity. Some of the activities mentioned include land operations to prepare for agricultural plantations and recreational activities such as hunting, picnicking, and camping. Musa and Parlan [35] also considered other natural phenomenon factors such as lightning and combustion. Akin to the observation disclosed by Woods [21], Musa and Parlan [35] wrote that primary forests were rarely affected by fires and that rates of fire spread were low even when they were affected. The authors backed their observations with the following three reasons: (i) the lower presence of fuel due to efficient ecological recycling, (ii) the availability of diversified plants, and (iii) the higher level of humidity in primary forests. Additionally, they also described three categories of fire: underground fires, surface fires and crown fires. Of these, underground and surface fires commonly occurred in Malaysian forests. They expressed that underground fires usually occur in peat swamp areas and that the detection of such fire activity is very challenging since such fires will burn and spread out very slowly through the underground. By the time a fire can be observed by a nearby community, the fire might have spread across the entire region and require huge resources to extinguish.
Diemont et al. [36] aimed to learn the root causes of forest fires for peat forests (i.e., peat swamp areas) in Southeast Asia, and they proposed some solutions to resolve the issue. Although their study location was not fixated on Malaysia, it was interesting that the authors explored the problem from a different perspective. Undeniably, several of the studies mentioned in this subsection showed that most forest fire incidents originate from human negligence. Diemont et al. [36] further investigating human activity related to land clearing associated with agriculture, and they discovered that most peat fires transpired near poor communities in Southeast Asia. Hence, international funding was suggested by the authors to replace the income of the communities from peat forests to curb forest fire incidents.
Table 1 summarises the initial related works that primarily focus on examining the effect and root causes of forest fires in Malaysia. According to the literature discussed in this subsection, it is obvious that human activity is the principal factor leading to forest fires. However, it is uncertain whether environmental conditions could advance the likelihood of forest fire occurrence in Malaysia. Thus, the next subsection on literature will be supplemented with information on related work that utilised remote sensing to understand forest fire incidents in Malaysia.

2.2. Fire Susceptibility Mapping Utilising Remote Sensing

Remote sensing is defined as the procurement of information about an object without requiring any kind of physical contact [37]. In the geoscience domain, it is commonly referred to as the acquisition of data from satellites (i.e., remote sensing imagery). A Geographic Information System (GIS) is a software tool that exploits a computer’s capability of storing and processing a large amount of data to capture, store, retrieve, analyse, and display spatial information [38,39]. Some frequently used GIS software include proprietary Esri Products (e.g., ArcMap, ArcGIS Pro, and ArcView) [40] and the opensource QGIS software [41].
GIS, in conjunction with remote sensing data and machine modelling, has been commonly adopted for the task of forest fire detection [10,38]. Remote sensing imagery (i.e., satellite data) provides additional information such as vegetation, land-cover types, topography (e.g., elevation, aspect, and slope), historical hotspot data, and meteorological information to cost-effectively analyse forest fire incidents [38]. By utilising GIS technology and remote sensing data, a fire susceptibility map can be generated to suggest whether a region falls in a highly fire-prone zone or a lowly fire-prone zone. When combined with meteorological information (i.e., weather information), such a model may be able to deliver superior forecast accuracy. Early warning prediction modelling allows an authority to allocate resources for battling fires depending on the location and severity of the forecasted fire incident [11]. In this subsection, all efforts to analyse or detect forest fire through fire susceptibility mapping in Malaysia are reviewed.
Setiawan et al. [10] proposed a spatially weighted fire susceptibility model by combining or aggregating the risk score of several factors affecting forest fires in Pekan, Pahang. They considered the five following elements: land use, distance to road, slope, aspect, and elevation. For each of the factors, the authors categorised them into four different risk levels, whereby a higher level of risk score indicates a greater risk of fire hazard. For instance, the risk score was set to four if the distance from the forest to the road fell between 0 and 500 m, a risk score justified by the fact that convenient accessibility may indicate a higher rate of human activity. Once the fire risk map was generated, the authors validated it according to the hotspot occurrences in 1997 in the study location. Setiawan et al. [10] learned that most of the locations that were classified as very high or high-risk regions by the model were also recognised as actual fire hotspots in 1997. Thus, they concluded that the model was able to effectively generate a fire risk map, and they recommended it to be adopted in other areas by considering other factors in the model at the same time.
The first work of Dymond et al. [42] involved mapping and classifying fuel into eight types and two soil modifiers for Malaysia and western Indonesia by utilising land-cover [43] and tree-cover [44] information. The reclassified eight fuel types were grassland, seasonal agriculture, shrublands, slash from land clearing, slash from agroforestry, secondary forest, forest plantation, and primary forest, and the two soil modifiers were mineral and peat.
Following their previous work, Dymond et al. [45] attempted to calibrate the Fine Fuel Moisture Code and fire weather index parameters from the Canadian Forest Fire Weather Index System (CFFWIS) components in the Canadian Forest Fire Danger Rating System (CFFDRS) [46] to generate a fire danger rating system in Malaysia and Western Indonesia. Fine-tuning the original index was necessary because most of the fire models were developed based on a particular region that is affected by distinct physiographic or environmental factors that contribute to the tragedy of forest fires [25]. The study of Dymond et al. [45] was probably the first effort to incorporate meteorological data to generate a fire rating system for proactively detecting fires in Malaysia and Indonesia. They validated their models by verifying the occurrence of hotspots detected from the Along Track Scanning Radiometer (ATSR) World Fire Atlas [47] in 2001. It is worth pointing out that the index proposed in this work does not consider human activities such as distance from road.
Peng et al. [48] aimed to resolve the issue of the imprecise meteorological data required to calculate the relative humidity parameters in the fire weather index from the CFFDRS [46]. The authors mentioned that if one meteorological station was located more than 20 km away from an adjacent station, standard interpolation techniques may be ineffective for delivering precise meteorological information for the regions between each of the stations [49]. To tackle this problem, they proposed the utilisation of remote sensing information from MODIS levels 1 and 2 to estimate the relative humidity parameter. Because they validated the estimated results with relative humidity data obtained from 10 meteorological stations in Peninsular Malaysia for 30 days in August 2004, with a mean absolute error of only 5%, it is safe to assume that the employed technique is suitable for performing such estimations. Hence, in the absence of meteorological stations, particularly in remote areas, the proposed method can be used as an alternative to evaluate relative humidity.
Patah et al. [11] developed a forest fire risk index model that considered the topographic danger index, weather danger index, and fuel danger index. The topographic danger index can be calculated by using the slope, aspect, and elevation parameters, while the fuel type risk index was adopted from the Indonesia “Forest Fires Prevention and Control Project” [50]. For instance, grassland with scrub was assigned an extreme fire index, while the natural and manmade forest was assigned a lower fire index. Apart from the topographic and fuel index, the authors also accounted for vegetation density to compute the fuel hazard index since a greater density of vegetation implies a larger availability of fuel. Due to the absence of complete weather information, the weather danger index only considers the temperature and relative humidity. It was calculated by taking the mean temperature of the month, dividing it by the relative humidity of the month, and multiplying it by 100. The calculated weather danger index was further categorised into five groups, in which lower values denote lower risks and higher values indicate higher risks of fire occurrence. By adding the value of the fuel hazard index (static elements) and the weather danger index (dynamic element), the forest risk index was evaluated and can be subsequently used to construct a fire susceptibility map. The model was applied in Kuala Selangor, Selangor, for data obtained in June 1999. The authors highlighted the flexibility of the model, in which dynamic information (e.g., weather data) can be accordingly altered to manipulate the model output depending on the supplied meteorological information.
Pradhan et al. [51] built a forest fire risk index model based on a frequency ratio (i.e., likelihood ratio) statistical approach in Sungai Karang and Raja Muda Musa Forest Reserve in the Selangor State. A higher frequency ratio between the hotspot location and each of the forest fire factors implies a larger correlation between the hotspot and each factor, while a lower ratio signifies a lower correlation. The risk index was computed by accumulating each of the factors’ frequency ratios, whereby a higher risk index denotes that a forest is more susceptible to fire incidents. Advanced Very-High Resolution Radiometer (AVHRR) National Oceanic and Atmospheric Administration (NOAA) remote sensing images were employed to identify the historical forest fire occurrence in the two-study locations in Selangor State from 2000 to 2005. The factors scrutinised in the authors’ work included (i) land cover (extracted from Landsat-7), (ii) NDVI (processed from Landsat-7), (iii) slope (processed from Digital Elevation Map (DEM)), (iv) aspect (processed from DEM), and (v) soil map (extracted from agroclimate dataset obtained from MACRES). They reported that the model was able to achieve 73.18% accuracy, a preeminent result for fire risk mapping. However, it should be noted that the validation procedure to attain the prediction accuracy was not made available by the authors in the manuscript.
Due to the limitations of the CFFWIS, Peng et al. [52] devised a fire risk index that considers forest-cover types by exploiting the concept of pre-ignition heat energy [53] and can be calculated using the woody fuel moisture content (FMC) and fuel temperature parameters. In their work, they measured the ignition probabilities by estimating the amount of heat energy essential to flare up a fuel from its current temperature. With the five-thermal spectrum in Advanced Spaceborne Thermal Emission Reflectance Radiometer (ASTER), the authors were able to estimate the live land surface temperature (LST) parameter needed to compute the FMC. The model was tested over nine days before the fire incidents arose with the hotspots detected from ASTER in 2004 and 2005 in Peninsular Malaysia. According to the results, the proposed fire risk index significantly increased four days before the fire, demonstrating that the model was able to provide an early warning (i.e., four days) before the fire broke out.
De Groot et al. [54] were the first team of researchers to deploy a fully functional fire danger rating system (FDRS) in Malaysia and Southeast Asia in 1999, and the system is still in operation today; the system can be directly accessed from the Malaysia Meteorological Department website [55,56]. Akin to the work in Dymond et al. [45], De Groot et al. [54] calibrated the CFFWIS specifically for grass and peat fuel types, as both of them can be abundantly found across the Southeast Asia region [57]. The modified FDRS preserved a similar structure to that of the original CFFWIS. The FDRS fire weather index provides a numerical value to assess fire ignition risk, and it can be computed with the Initial Spread Index and Buildup Index. The Initial Spread Index takes the Fine Fuel Moisture Code (comprising temperature, relative humidity, wind speed, and rain) as the input parameters to anticipate the rate of fire spread, while the Duff Moisture Code and Drought Code are provided for the Buildup Index to evaluate the available combustible fuel. Because the system relies on weather information, present meteorological data will affect the generated fire risk maps. Depending on the availability of forecasted weather data, the FDRS can be used as a fire forecasting system by employing the forecasted data as the input data to the model. The accuracy of this forecasting model to provide an early warning heavily relies on the reliability of the forecasted weather information. The authors pointed out that the FDRS can be adopted as a decision-making tool to assist fire managers in planning resources before a fire is instigated.
Ainuddin and Ampun [58] adopted the Keetch-Byram Drought Index (KDBI) proposed by Keetch and Byram [59] as an alternative index to the CFFWIS. While the CFFWIS combines the weather, fuel, and topography to predict the occurrence of forest fires, the KDBI measures the soil moisture deficit (i.e., the volume of water required to maximise the soil moisture capacity) to achieve the same goal. A larger KDBI value implies a higher deficit of soil moisture, i.e., it denotes that the amount of water present in the soil for evaporation or plant transpiration is lesser [60]. On the other hand, a high KDBI value implies that the soil is very dry and may increase the probability of wildfires. In this study, the authors utilised the daily maximum temperature and total rainfall (i.e., precipitation) data obtained from the Malaysia Meteorological Department as the input parameters to compute the KDBI value. They employed the model and tested it in four weather stations located in different states in Malaysia, namely, (i) Kota Bahru, Kelantan; (ii) Kuching, Sarawak; (iii) Sandakan, Sabah; and (iv) Subang, Selangor. The four regions were selected as they represent the distinct climate and weather variations in Malaysia. Furthermore, forest fire incidents have also been reported in the vicinities of the selected areas. They presented the results of model for five years from 1 January 1990 to 31 December 1995. Based on the results, they stated that the highest mean KBDI value was recorded in the month of January in Kota Bahru, Kelantan (i.e., the region is more susceptible to forest fire in January). The authors highlighted that this was the first work to adopt the KDBI in Malaysia for the task of forest fire detection.
Similar to the work in Peng et al. [52], Pradhan [61] adopted the fire susceptibility index based on the concept of pre-ignition heat energy designed by Dasgupta, Qu and Hao [53]. In addition to the LST and FMC parameters necessary for computing the original index, Pradhan [61] further enhanced the model by incorporating other remote sensing data (e.g., fuel maps) and weather information (e.g., temperature and relative humidity) to evaluate the risk index. As opposed to the work of Peng et al. [52], Pradhan [61] estimated the LST parameter by utilising MODIS instead of ASTER. Additionally, Pradhan [61] also considered live FMC and dry/dead FMC, while Peng et al. [52] only accounted for dry woody FMC. Furthermore, an enhanced vegetation index and fuel map extracted from MODIS were further integrated to fine-tune the fire risk index to reflect the true phenomenon in accordance with the local parameters. Then, the fire susceptibility map could finally be generated based on the computed risk index. The author validated the fire risk map with the hotspots collected from ASEAN Specialised Meteorological Center (ASMC), and they discovered that most of the hotspots were identified in high risk (i.e., a risk index of greater than 20) regions of the fire risk map while no/low risk regions were recognised as urban areas and dense forests. Pradhan [61] speculated that the model had effectively assimilated the multiple parameters, and the model was deemed to have a significant spatial sensitivity and accuracy.
Mahmud et al. [62] used the analytic hierarchy process (AHP) [63] in GIS software to weigh and rank the factors influencing forest fires in Pekan, Pahang. The primary goal of this study was to generate a simple interface in ArcView software to enable inexperienced GIS users to seamlessly use and navigate the tools. Hence, the authors designed an additional menu bar inclusive of several buttons for the users to straightforwardly add and modify the parameters. To apply the AHP, users were required to supply the weight of each class/class range in each of the factors (attributes) by using the reclassify geoprocessing tools (i.e., the reclassifying factors menu bar added by the authors). Once all of them were weighted, the users could use the overlaying geoprocessing tools (i.e., overlaying factors menu bar) that utilise the AHP to produce a fire susceptibility map. It is worth pointing out that no validation or testing results were presented by the authors as the main intention of the work was to provide a user-friendly interface for users with limited knowledge of GIS software to use the tool for producing fire risk maps.
Razali et al. [64] proposed a fire susceptibility index considering fuel maps, road buffers, and canal buffers for a peat swamp forest in Batu Enam, Pahang. Instead of employing the NDVI vegetation index, the authors adopted Tasseled Cap (TC) transformation on a Landsat TM image retrieved on 3 April 1999 before performing supervised classification to categorise the land cover into nine distinct classes because the authors believed that TC was more effective at detecting peat swamp regions. Additionally, Ramsey III et al. [65] substantiated that TC was an effective algorithm to detect forest transformation resulting from fires. The authors found that the overall classification accuracy of detecting land cover was 94.63%. To incorporate human activity into the proposed index, Razali et al. [64] included the road buffer (i.e., distance to road) and canal buffer parameters. They subsequently assigned a risk index to each of the class/class ranges for the fuel map, distance to road, and canal buffers. For instance, a road buffer value between 0 and 50 m was assigned a risk index of 5, implying an extreme fire risk. This was reasonable because a nearer distance of a road to a forest would denote a higher rate of human activity since such forest is more easily accessible. The fire risk index was then calculated by summing up the risk of each pixel for all three of the factors. By utilising the index, a fire susceptibility map could then be generated. To validate the effectiveness of the model, the authors validated their results with the hotspot datasets retrieved from NOAA AVHRR in 1998, and the results suggested that the model was able to accurately detect most of the lower risk fire region. It should be noted that an acute degraded peat swamp forest fire was sparked in the study location on 12 March 1998.
Ismail et al. [66] utilised a fire risk index based on the peat depth, stand density, bulk density, moisture content, dryness index, water table, and species composition to produce a fire map. Northern Selangor, Kuala Langar, and the Southeastern Pahang peatland region were selected because they are very susceptible to forest fires, with several fire incidents reported in each region. Although it is interesting that the authors considered so many factors contributing to forest fires, it should be noted that the process of integrating various factors to compute the risk index was not delineated by the authors.
Hyer et al. [67] analysed the fire distribution patterns obtained from the product of Wildfire Automated Biomass Burning (WFABBA) from Multifunction Transport Satellite (MTSAT) and the results from MODIS MOD14 in Malaysia and Indonesia by comparing 34 months of historical data in both satellites from September 2008 to July 2011. They observed broadly similar fire pattern activity across both products. While MTSAT WFABBA’s overall detection was lower than that of MODIS MOD14, it was able to pick up some of the “missing fire” in Sarawak, Malaysia, that was not recognised in MODIS MOD14. As the MTSAT was a geostationary satellite, it can provide near-real-time imagery covering Southeast Asia and Australia. Encouraged by their results, the authors concluded that the MTSAT WFABBA was a promising product for describing a real-time fire activity pattern in Southeast Asia. Hyer et al. [67] highlighted that further enhancements of the MTSAT WFABBA were obstructed by the pre-processed MTSAT data.
Analogous to the work of Mahmud et al. [62], Suliman et al. [68] also adopted the AHP mathematical model to weigh the factors influencing forest fires. While Mahmud et al. [62] aimed to build a user-friendly system, Suliman et al. [68] were devoted to weighting the potential factors (i.e., criteria) and classes (i.e., sub-criteria) through a questionnaire survey completed by three domain specialists from the Fire and Rescue Department Malaysia. Topography (e.g., slope and aspect), fuel map (e.g., eight land-cover and two soil types), and human activity (e.g., distance to road) parameters were the factors weighted by the experts. Details of the weighting and ranking can be found in the authors’ initial work written in Bahasa Malaysia by Mohd and Mastura [69]. Once the weighting was evaluated by the specialist, the authors employed the AHP to produce a fire susceptibility map and subsequently disseminated the map through a WebGIS application. Suliman et al. [68] tested the model in Selangor, Malaysia, since a number of forest fire incidents had been identified over the last two decades in the study location. Based on the model, a total area of 32.83 km2 in Selangor was recognised as region with an extreme fire risk, e.g., Raja Muda Musa Forest Reserve and Kuala Langat Forest Reserve were identified as potential fire locations. The authors also pointed out most of the high-risk areas were in regions with peat soils.
Ash’aari and Badrunsham [70] employed the ATSR World Atlas Fire data to explore the spatial and temporal distribution of fire incidents in Malaysia. Aggregated monthly hotspots generated from Algorithm 2 for ATSR World Fire Atlas from 1997 to 2008 were collected by the authors. To understand the temporal distribution, the monthly aggregated hotspots (i.e., number of fires) for 12 years were input onto a map of Malaysia. According to the results, a total of three minor (June–December, July–November, and September–October), and one major (January–April) El Nino events were observed. The authors also reported the month of April to have the highest number of fires. To realise the spatial pattern of fire occurrence in Malaysia, the states were distributed into six groups by adopting clustering analysis. Some of the notable clusters included (i) a Sabah cluster containing the highest number of fire incidents and (ii) a Selangor cluster with the lowest number of fire incidents. The authors justified the vast number of fires in Sabah as being due to biomass burning sighted in the vicinity of Indonesia. According to the literature described previously in this section, we recognise that a lot of research has exploited Selangor State as the study location since many fire incidents have been sparked there in the past. Therefore, it is speculated that the cluster analysis performed by Ash’aari and Badrunsham [70] might have been impacted by the total area of each state, as Selangor was distinguished in the cluster with the lowest number of fire incidents.
While Ash’aari and Badrunsham [70] devoted themselves to understanding the temporal and spatial distribution of fire incidents in the entirety of Malaysia, Leewe et al. [71] employed a similar technique (i.e., frequency analysis) to analyse the temporal and spatial trends of fire activity for the state of Sabah from 2006 to 2010. Instead of ASTR, Leewe et al. [71] retrieved the MODIS hotspot data from the Fire Information for Resource Management System [72]. The authors studied the monthly and annual areas of fire distribution by using the hotspot data. The highest number of hotspots were reported at 1082 in 2010, 518 in March (five-year average), and 1159 for the interior region (five-year average). Leewe et al. [71] stated that the fire distribution differed by year, month and region. By understanding the patterns of hotspots, resources can be accordingly allocated by authorities to confront fires in advance.
Jamaruppin et al. [73] utilised the raw data in thermal band 10 from Landsat 8 to estimate the temperature (i.e., Celsius) before (28 January), during (1 March), and after (17 March) the 2014 fire incidence for Pekan, Pahang. The temperature was then categorised into five distinct temperature classes depending on the temperature range. For instance, a temperature higher than 34 degrees Celsius was assigned as very high risk, while a temperature below 16 degrees Celsius was appointed as very low risk. A fire risk map was then produced by utilising the categorised temperature risk. When comparing the fire susceptibility map before and during the fire incident, it could be observed that most of the very low-risk regions had progressed to an advanced risk, as 0 km2 was reported for the very low-risk region during the fire. The authors also evaluated the temperature changes between pre-fire and during-fire stages, as well as between during-fire and after-fire stages. They observed that most of the pixels in the studied region had a significant temperature increase during the transition from pre-fire to during-fire stages, while most of the pixels recorded a 100% decrease in temperature for the shift from during- to post-fire stages.
Miettinen et al. [74] studied the temporal and spatial distribution of peatland fire in Malaysia and Indonesia (Sumatra and Borneo Island) by utilising the MODIS hotspot detection count retrieved from the Fire Information for Resource Management System in 2015. They selected the study locations because a severe fire was ignited there in 2015 [75,76,77], and the fire was further aggravated by the drought conditions caused by El Nino. Based on the authors’ previous work [78], they discovered that the land cover of the study locations was vastly affected by deforestation activities from 1999 to 2015 (i.e., peat swamp forests covered up 75% of the peatlands in 1999, while only 29% of peat swamp forests covered the study location in 2015). To analyse the relationship of peatland (i.e., peat soil type) with the distinct land cover (i.e., managed peatland areas, undeveloped degraded peatlands, and degraded peat swamp forest), Miettinen et al. [74] employed a peatland land-cover map created before the fire began in 2015 [78] to evaluate the fire severity in each peatland land-cover type. Two metrics, (i) the number of hotspots and (ii) fire density (i.e., fire counts relative to the area, as measured by the number of hotspots identified per 1000 km2), were utilised by the authors to compare the fire counts between peatland and mineral soil, as well as to pinpoint the locations with high fire concentration activities. They revealed that more of the fires occurred in deforested, undeveloped peatlands (~831 hotspots per 1000 km2) compared with pristine (i.e., undisturbed) peat swamp forests (30 hotspots per 1000 km2). Additionally, fire density was reported to be from approximately four to ten times higher in peatland areas in contrast to mineral soils for all the studied locations. To shrink the risk of forest fire disaster in degraded undeveloped peatland, Miettinen, Shi and Liew [74] recommended rewetting and rehabilitation (e.g., canal drainage blocking [79]) as the solutions to preserve a consistent water level for maintaining the soil moisture. The authors stated that these options were more desired than the solution involving the conversion of area to a managed agricultural. It should be noted that the authors excluded Singapore and Brunei from their work since both countries were relatively small and rarely confronted by acute fire incidents.
All the studies in this subsection are summarised and chronologically sorted based on the publication year in Table 2. Discussions in this subsection advocate the idea that the application of remote sensing to detect forest fire in Malaysia is not new since many researchers have attempted to utilise these technologies to provide unique solutions. However, the solutions presented in this section can be further enhanced and improved by adopting more advanced techniques that will be elaborated on in Section 4.

2.3. Other Efforts Associated with Forest Fire

Though most researchers were motivated to locate or predict fire-prone regions, some of the works discussed in this section used a distinct approach to conduct research associated with forest fires in Malaysia.
Mahmud [81] estimated the pollutants discharged from vegetation burning (i.e., agriculture waste burning) by using the emission equation and emission factors devised by Joyner [82]. To obtain the necessary input parameters for the formula, the author utilised the number of hotspots retrieved from NOAA AVHRR to perform spatial analysis while employing the Moran Index, nearest neighbour index, and nearest neighbour hierarchical spatial clustering from February 2002 to March 2002 in Peninsular Malaysia. Selangor, Perak, and Pahang states were observed to have higher rates of fire activities in contrast to other states in the spatial analysis. Based on the information acquired from the analysis, Mahmud [81] estimated the air pollutant emissions (e.g., particulates, carbon monoxide, non-methane hydrocarbons, nitrogen oxides, sulphur dioxides, and particulate matter) and greenhouse gases (e.g., carbon dioxide, methane, nitrous dioxide, and carbon). The author discovered that the estimated carbon dioxide emission was much higher than nitrous oxides or methane. Additional validation was recommended by the author to corroborate the estimation evaluated in their work.
To evaluate the area of peat swamp burned in 1998 for Klias Peninsula located in the State of Sabah, Phua et al. [83] applied the image differencing technique to Landsat imagery before the fire (2 October 1997) and after the fire (7 December 1999) by utilising three vegetation indexes, specifically the (i) normalised burn ratio, (ii) normalised difference water index, and (iii) normalised difference vegetation index. Among the three indices, image differencing in conjunction with a normalised burn ratio enabled the most accurate estimation of the burned area. Understanding the changes that happened in the peat swamp forests (i.e., reduction in peat swamp forest area) allowed the authors to conclude that better approaches can be devised to more effectively confront fires.
Ainuddin and Goh [84] investigated the impacts of forest fires on the forest structures in Raja Musa Forest Reserve, Selangor from September 2001 to June 2002. The study location was selected by the authors because it had encountered fires since 1996. They revealed that the composition of flora species and forest structure were greatly affected by the forest fire incidents. For instance, the tree diameters in the unburnt areas were larger (10.1–20.0 cm) than the trees from burnt areas (5.1–10.0 cm). On the contrary, a total of 22 plant species were found in the unburnt region, while only 10 plant species were identified in the burnt region.
Bin Suliman et al. [85] adopted the random spread model of Serra [86] to understand the propagation of forest fires in Selangor State from 2001 to 2004. To formulate the model, they utilised fuel and spread rate maps (i.e., Southeast Asia FDRS that built upon the Initial Spread Index and Buildup Index [54]) as the primary input parameters to the model. They tested the model, and it correctly predicted most of the burnt scars in the study location. In this model, the authors assumed that there were no human interactions involved to put out fires.
Sahani et al. [87] investigated the relationship between mortality rate and forest fire haze events in the Klang Valley region by utilising the daily concentration of particulate matter (PM10) and daily mortality rate from 1 January 2000 to 31 December 2007 retrieved from the Department of Statistics, Malaysia. A total of 88 days were identified as haze days (i.e., PM10 concentration greater than 100 μg/m3) in the seven studied years, and the root cause of 8.56% of natural mortality was recorded to be associated with respiratory mortality. They found that there was a significant relationship between haze and respiratory mortality, and a higher mortality rate was recorded due to exposure to haze. For instance, respiratory mortality was reported to be increasing for all males, elderly males, and adult females.
Fisal et al. [88] used a social science approach to study the forest fire awareness of the community in Klias Forest Reserves, Sabah. They highlighted that the community living near the vicinity of the forest were not fully equipped with the essential knowledge to prevent fires in the peat swamp forests. Such a lack of awareness may subsequently lead to forest fire incidents. However, positive feedback was acquired from the community to work together with authorities to prevent and extinguish forest fires.
Instead of estimating the emission of pollutants by using remote sensing information, as conducted by Mahmud [81], Smith et al. [89] performed an on-site study utilising open-path transform infrared spectroscopy to assess the pollutants discharged by peat swamp forest fires in Pekan Pahang in 2005 and North Selangor in 2006. The plumes (i.e., smoke) collected from the aforementioned technique were further analysed to measure the emission factors (i.e., concentration) for 12 gas types: carbon dioxide, carbon monoxide, methane, ammonia, acetic acid, hydrogen cyanide, methanol, ethylene, ethane, formaldehyde, formic acid, and acetylene. The authors presented the first study to explain the large variability of gases in each of the plumes. They recommended the emission factors discovered from this work to be used for future peat fire emission models as a reliable alternative to the results from earlier laboratory studies.
Musri et al. [90] presented the results of post-fire restoration and rehabilitation through a case study in Raja Musa Forest Reserve, Selangor. The studied location had been repeatedly affected by fire incidence in the past decades. In the post-fire restoration process, the authors found that the Selangor State Forestry Department rewetted the soil and raised the water level of the degraded peat swamp forest by installing a check dam, canal block, clay dyke, and high-density polyethylene pipe. Subsequently, over 250,000 saplings of pioneer tree species were planted from 2009 to 2014 in the rehabilitation site of Raja Musa Forest Reserve. With the raised in water level and the regeneration of new plants, the number of forest fire occurrences has been significantly lowered [90]. The authors also introduced four basic principles to manage peat swamp forests: (i) prevention (e.g., awareness campaign), (ii) preparedness (e.g., maintenance and installation of equipment), (iii) response (e.g., immediate action to suppress small fires), and (iv) recovery (e.g., restoration and rehabilitation efforts). Furthermore, the national strategies for fire management and rehabilitation of degraded peat swamps in Malaysia were also discussed by Parish, Lew and Mohd Hassan [91].
Instead of relying on human observations, Sali et al. [92] adopted an Internet of Things (IoT) approach to monitor the condition of the Raja Musa Forest Reserve, Selangor. By deploying an IoT monitoring system, real-time data including soil temperature, soil humidity, water level, wind speed, rain precipitation, ambient humidity, and ambient temperature information could be collected. In their studies, they collected and analysed data obtained from 2020 January to March 2020.
Table 3 summarises the research works associated with forest fires, excluding studies related to fire susceptibility mapping. In this subsection, several works that were closely associated with forest fire incidents are reviewed. While fire susceptibility mapping is one of the predominant research directions, we would like to highlight some of the distinct directions such as locating regions burnt by forest fires, analysing the pollutant emissions, and post-fire management.

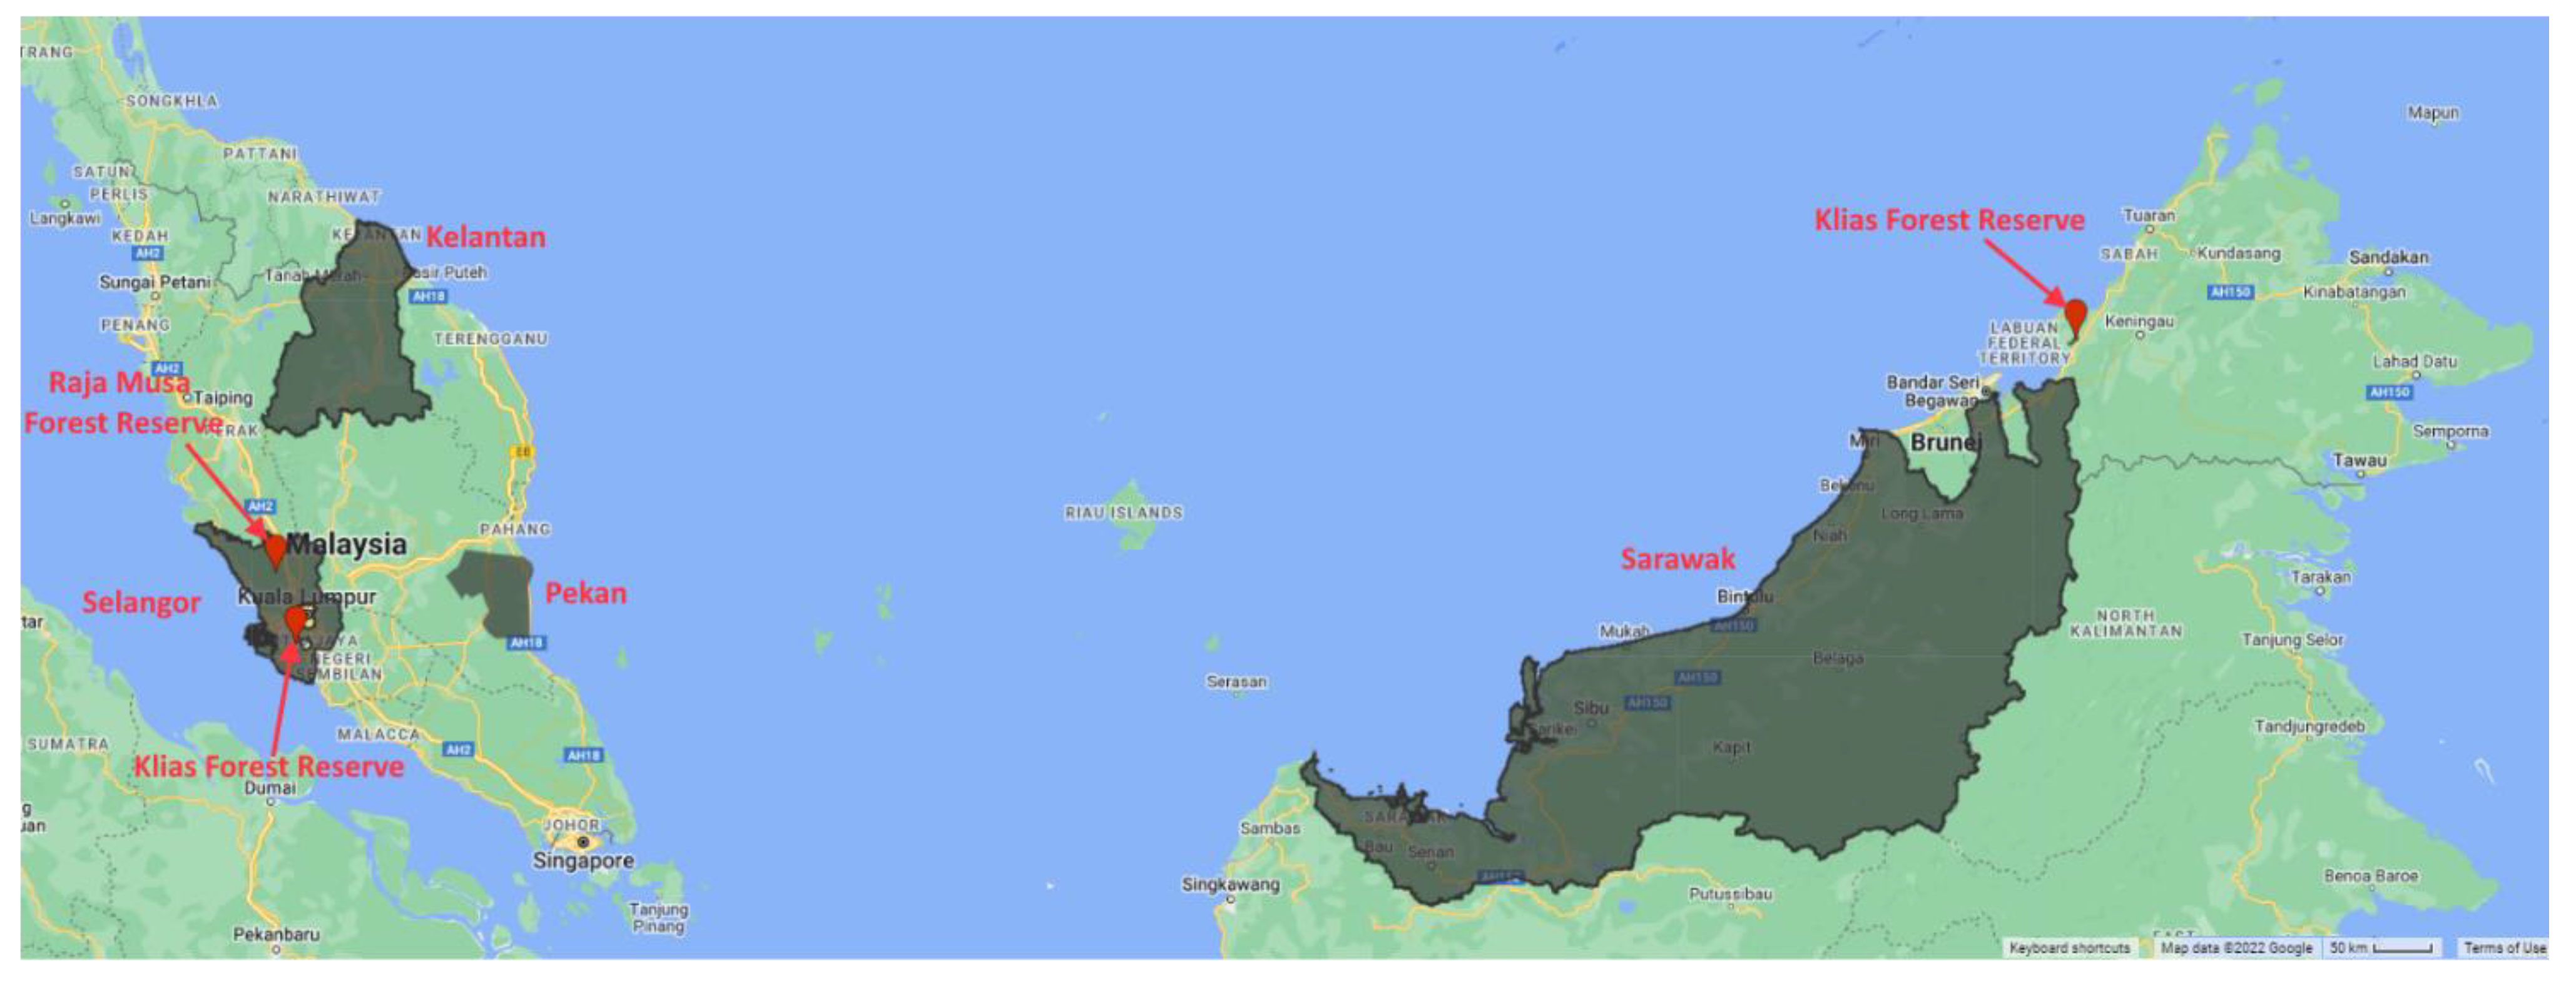
2.4. Hotspot Locations in Malaysia Based on Previous Studies

A summary of the works in Malaysia from 1989 to 2021 categorised by each of the states is shown in Table 4. From the table, it can be seen that most of the studies were performed in three main states, which were Sabah (5 out of 26), Selangor (12 out of 26) and Pahang (6 out of 26). It should be noted that the tabulated information excludes all the works that focused on Peninsular Malaysia or the entirety of Malaysia. The hotspot locations based on historical fire incidents in Malaysia are described in Figure 1.
To further substantiate the severity of forest fires in the three states, we also searched through the local news reports in Malaysia. According to several reports, several fire incidents had also been recently reported in the selected three locations, i.e., Pekan, Pahang [16,93,94,95,96]; Selangor [12,13,97,98]; and Klias, Sabah [14,99,100]. Thus, the selected locations are postulated to be suitable for conducting experimental studies related to forest fires in the future.

2.5. Factors Affecting Forest Fire in Malaysia

Most of the forest fire incidents in Malaysia were speculated to be principally associated with human factors [9]. However, it was unclear whether the environmental variables (i.e., land cover, topography, and meteorology) could intensify fire tragedies. A comprehensive review of the general factors constituting forest fires was presented in [101]. A few of the factors that have been utilised in the past to generate a fire susceptibility model in Malaysia are as follows: land cover, meteorological variables (i.e., temperature and humidity), topology variables (i.e., digital elevation model, aspect, and slope), and human factors (i.e., distance to road and population).
Though there are various factors contributing to forest fires in Malaysia, a rigorous and thorough analysis has yet to be completed to date in the literature. To broaden the understanding of fire incidents, subsequent analyses utilising various sources of data are necessary. Hence, all the data that were exploited by the previous studies will be described in the next section. By combining or integrating results from the previous studies with presently available data and technologies, more works can be anticipated to expand the results presented in the current literature.

3. Type of Data Utilised for Forest Fire Risk Modelling in Malaysia

In this section, the types of data are categorised into two distinct groups: public data (i.e., satellite data) and Malaysia government-centric data. The primary purpose of this section is to provide an overview of the data that have been explored in Malaysia. To ease future researchers, the accessibility for each of the satellite data and government data are also described in Table 5 and Table 6.
All the derived products and the satellite versions employed by the previous studies discussed earlier in this manuscript are summarised and tabulated in Table 5. According to the table, it is obvious that the derived products from the Landsat, MODIS, and AVHRR NOAA satellites have been widely exploited.
In addition to the satellite data, some of the Malaysian government data including topography, meteorological, and population information that have been adopted in the past are also shown in Table 6. However, it should be noted that most of the mentioned data are not publicly accessible. Users that desire to obtain and use the data may need to directly request them from each of the relevant departments, and most of the applications will be subject to the approval of the department directors.
From the presented summaries, it can be seen that only limited satellite data have been applied to the task of forest fire detection in Malaysia. Following the work of previous researchers, future researchers that plan to perform similar studies in Malaysia can consider adopting Sentinel-1 Synthetic Aperture Radar [102] and Sentinel-2 imagery [103] to develop advanced fire models.
Table 5. Summary of remote sensing data utilised by previous studies in Malaysia and their accessibility.
Derived ProductSatellite Version/
Data Source
Previous ApplicationAccessibility
Land Cover or Fuel Type
Normalized Burn Ratio (NBR)
Normalized Difference Water Index (NDWI)
Normalized Vegetation Index (NDVI)
Landsat Thematic Mapper (TM)—version not mentioned[10,64,85]Public [104]
access from USGS Earth Explorer)
Landsat-5 TM[11,83]
Landsat-7 ETM[51,68,69,83,105]
Landsat 8[73]
Land Cover (classified) for
Malaysia and Indonesia
Landsat 7 Enhanced Thematic Mapper (ETM) and Landsat 8 Operational Land Imager (OLI) [78,106][67]Private
(The classified land cover is not available publicly)
Precipitable Water Vapor for
Relative Humidity
MODIS Level-1 (MACRES)[48]Public [107,108,109]
Land Surface Temperature
Surface Air Temperature for Relative Humidity
Precipitable Water for Relative Humidity
MODIS Level-2[61]Public [110,111]
MODIS MCD14ML Collection 5 Active Fire (hotspots)NASA’s Fire Information for Resource Management System[67,71,74]Public [112]
Land Surface Temperature-[52]Public [113]
World Fire Atlas (hotspots)-[45,70]Public [114]
Historical Forest Fire Data (hotspots)AVHRR NOAA (not specified)[64,81,85]Public [115]
AVHRR NOAA 12[51,61,105]
AVHRR NOAA 16[51,61,105]
Application of Wildfire Biomass Burning Algorithm (Hotspots)-[67]Public [116]
Table 6. Summary of Malaysia government data utilised by previous studies in Malaysia and their accessibility.
Type of DataDerived ProductData SourcePrevious ApplicationAccessibility
TopographyContour
Administrative Boundaries
Water Resources
Settlement
Transportation Infrastructure
Department of National Mapping and Survey (JUPEM)[51,61,105]Private (apply and pay) [117]
Price List [118]
Digital Contours
Digital Elevation Model
Slope Gradient
Slope Aspect
[11]
Aspect
Elevation
Slope
Not Mentioned[10]-
-Hotspots Prone Area
Fire Occurrence Map
Peat Swamp Map
Soil Map
Malaysia Centre of Remote Sensing (MACRES)
Known as Malaysia Space Agency (since 2019)
[51,61,105]Private (apply and pay) [119]
Price list [120]
Local students/universities may request some data for free for research and educational purposes [119]
Raw format of the relevant data (MODIS, NOAA, LANDSAT TM, and SPOT 1–5) can be obtained from Public MYSA archive data [121]
Population DataPopulation Data
Socio-economic Data
Department of Statistics Malaysia[51,105]Public/Available Data [122,123]
Additional data requests can be sent to the Director of the Department of Statistics Malaysia
Meteorological DataTemperature
Relative Humidity
Fire Danger Rating System (FDRS)
Malaysian Meteorological Services Department[11,51,54,61,105]Only the future 7-day forecasted weather data were made available in the official portal [124].

Archive data not available; contact Malaysia Meteorological department to request [125]
Daily Air Temperature
Total Daily Rainfall
Malaysian Meteorological Services Department[58]
Daily Weather DataTemperature
Relative Humidity
Wind Speed
National Climatic Data Center[45]Public [126]
-Land-use/cover mapsDepartment of Forestry and Department of Agriculture[11]Private (apply and pay) [127]
-Record of Past Fire Occurrences/Forest Fire ReportsForestry Department of Peninsular Malaysia (JPSM)[11,51,61,105]Not Available
An initiative by National Geospatial Centre Malaysia (G2G) [128]Malaysia Government Unit/Local Public University in Malaysia can apply for freeNational Geospatial Centre Malaysia-Private (requests can be sent to Malaysia Government Body and Malaysia Public University only) [128]

3.1. Discussion on the Application of Data for Forest Fire Detection

Though some satellite data, such as those of Landsat and Sentinel-2, have been made freely available to the public [27], some of them (e.g., Sentinel-2) have yet to be adopted for the task of detecting forest fires in Malaysia. With the use of vast computing resources and data, machine learning classification techniques such as logistic regression, decision trees, support vector machines, and deep learning can be incorporated to improve the performance of forest fire detection in Malaysia [23,24].

Big Data Platform for Satellite Data

Gomes et al. [27] defined big data platforms as “computational solutions that provide functionalities for big Earth Observation (EO) data management, storage and access, which allow the processing on the server side without having to download big amounts of EO data sets”. Motivated by the advancement of technologies and the adoption of open data policies supported by government and space agencies, an extensive amount of geospatial data (i.e., Earth observation data) produced from Earth observation satellites have been increasingly made freely available to researchers and societies in the past decades. For instance, approximately 5 petabytes (~equivalent to 5000 terabytes) of open data were generated from Landsat-7, Landsat-8, MODIS, Sentinel-1, Sentinel-2, and Sentinel-3 in 2019 [129]. The datasets’ tremendous volume makes it challenging to store, distribute, process, and analyse them using traditional approaches. Thus, several big data platforms for EO data have been developed, e.g., Google Earth Engine [29], Open Data Cube [28], JEODPP [129], OpenEO [130], pipsCloud [131], System for Earth Observation Data Access, Processing and Analysing for Land Monitoring (SEPAL) [132], and Sentihub Hub [133]. A comprehensive review for each of the platforms was performed in [27]. It should be noted that most of the acquisition methods performed by the researchers in Section 2 focused on the individual file of geospatial data distribution through web services and portals (i.e., http or ftp).
Apart from the mentioned platforms, Microsoft also recently released its variation of a big data platform for satellite data called Planetary Computer [30]. It is worth noting that at the point of writing this manuscript, Planetary Computer also provides a hub that supplies computational resources with several options for the development environment; the five distinct options are: (i) Python environment with 4-core CPU and 32 GB of RAM; (ii) R environment with 8-core CPU and 64 GB of RAM; (iii) PyTorch environment with 4-core CPU, 28 GB of RAM and T4 GPU; (iv) TensorFlow environment with 4-core CPU, 28 GB of RAM, and T4 GPU; and (v) QGIS environment with 4-core CPU and 32 GB of RAM. To gain access to the platforms, users are required to fill in the application form provided on the Planetary Computer home page.
Considering that big EO data platforms permit some of the computational processing to be performed on the server side, future researchers should consider employing big data platforms to alleviate some processing resources from the client side. In addition, the complicated data access procedure described in our previous work [134] can be eased by utilising the big data platforms. This is made possible by the ability of most big data platforms to access publicly available datasets through their data catalogues and APIs.

4. Global View of Machine Learning and Forest Fire

From the literature reviewed in Section 2, it can be clearly recognised that the application of machine learning has not been extended to the domain of forest fires in Malaysia. However, utilising machine learning techniques in aiding forest fire detection, analysis, and prediction is not new [23,24,135,136,137,138], and these techniques have been successfully adopted in many other countries as they have been gaining more attention in recent years. Hence, this is probably a potential research direction to be delved into in the near future.
Although traditional fire detection systems such as the CFFDRS [45], FDRS [54], and Slovenia Environment Agency fire detection system [139] have been proven to be very feasible for the task of fire detection, it is plausible to improve their detection and prediction abilities by building machine learning models with a fire database containing the historical fire occurrences and all contributing factors of forest fires.
Bui et al. [140] examined forest fire susceptibility through a hybrid artificial intelligent approach that combined the usage of a neural fuzzy inference system (NF) and particle swarm optimization (PSO) in Vietnam. This hybrid approach was named Particle Swarm Optimized Neural Fuzzy (PSO-NF). The spatial information of tropical forest fire susceptibility was extracted and modelled with the adoption of PSO-NF. The forest fire model was retrieved from NF, and the best parameter values were selected through the PSO. The authors created a GIS forest fire database based on 10 factors associated with forest fires, i.e., slope, aspect, elevation, land use, NDVI, distance to road, distance to residence area, temperature, wind speed, and rainfall. Most of the factors were derived from the Landsat-8 remote sensing data, and the climatic data (i.e., temperature, wind speed and rainfall) were extracted from the National Climatic Data Center (NDCC) [126]. They also compared their proposed algorithm (PSO-NF) with random forest and support vector machine algorithms, and the classification accuracy attained by the PSO-NF (85.8%) surpassed the other two notable classifiers (85.2% and 84.9%, respectively). Later, Bui et al. [141] proposed a new hybrid methodology by amalgamating Multivariate Adaptive Regression Splines (MARS) and Differential Flower Pollination (DFP) into a new methodology named MARS-DFP. DFP was appended to the MARS as a feature extractor to retrieve the spatial patterns of forest fire severity. The proposed algorithm attained a classification accuracy of 86.57%.
Fire kernel density was utilised to detect forest fires by Monjarás-Vega et al. [142], who extracted the spatial patterns of fire occurrence at the regional and national levels in Mexico by utilising geographically weighted regression (GWR) to predict fire density. The fire kernel density was calculated by using two different approaches, which are regular grid density and kernel density, over spatial resolutions ranging from 5 to 50 km on both the dependent and the independent variables captured from human and environmental candidates.
The element of forest fire susceptibility was also exploited by Moayedi et al. [143] in a high fire-prone region in Iran. An ensemble fuzzy method was proposed by aggregating the results retrieved from an adaptive neuro-fuzzy inference system (ANFIS) with genetic algorithm (GA), PSO, and differential evolution (DE) evolutionary algorithms. The GIS forest fire database was built based on 15 ignition factors, i.e., elevation, slope aspect, wind speed, plan curvature, soil type, temperature, distance to river, distance from road, distance from village, land use, slope degree, rainfall, topographic wetness index, evaporation, and NDVI. It should be noted that the authors did not specify the source for each of the mentioned factors. The best performance results were attained by ANFIS-GA, with which the area under receiver operating characteristics (AUROC) was calculated as 0.8503 and the mean squared error (MSE) was calculated as 0.1638.
Instead of predicting forest fire incidents akin to many other works, Sevinc et al. [144] sought to predict the probability of an event that triggered a forest fire by utilising a Bayesian network model. The primary motivation of the authors was to investigate the reason behind each forest fire incident, as the probable causes for almost 54% of forest fires were disclosed to be unknown in the location of study. The empirical testing was conducted in the Mugla Regional Directorate of Forestry area located southwest of Turkey. To assemble the Bayesian network model for each of the causes of fire occurrence, the authors incorporated wind speed, month, distance from settlement, amount of burnt area, relative humidity, temperature, distance from agricultural land, distance from road, and tree species. Sevinc et al. [144] reported an AUC score of 0.91 for hunting, indicating that hunting is the most plausible ignition factor for forest fires that happened between 2008 and 2018.
Table 7 summarises the related works discussed in this section. A thorough review associated with machine learning techniques in the task of forest fire detection or prediction as presented in [23,24].

Deep Learning and Forest Fire

Deep learning techniques, which are gaining popularity in recent years, have also been adopted to improve the models in the forest fire domain. Due to their success in the field of image processing and handling spatial information [145], researchers from the fire domain have also exploited similar techniques by utilising satellite remote sensing data, satellite imageries, unmanned aerial vehicle (UAV) images (e.g., drone), and surveillance camera footage.
Zhang et al. [146] proposed a deep convolutional neural network (CNN) to automatically annotate the fire regions in an image by using bounding boxes. To improve the fire patch localisation annotation, the authors designed a two-level (cascaded) CNN where the first CNN model was trained with the full image to identify whether the image contained at least one fire patch and the second CNN model was trained with the fire patches to accurately locate the fire regions in the image. A total of 25 videos from a fire detection dataset [147] were utilised to build their dataset. The authors then extracted one image from every five frames and resized them to 240 × 320, followed by the manual annotations of fire boundaries with 32 × 32 bounding boxes. A subset of the data comprising 178 training images (12,460 patches) and 59 testing images (4130 patches) was used to evaluate the CNN models. A comparison of the performance of the proposed CNN against the support vector machine linear classifier showed that the CNN achieved a detection accuracy of 90.1% and the support vector machine only achieved a detection accuracy of 89% on the testing dataset.
A fine-tuned CNN trained with a CCTV surveillance camera containing 68,457 images was devised by Muhammad, Ahmad and Baik [148]. The proposed algorithm was able to detect fire in images with distinct indoor and outdoor environments. The authors emphasised that the model could process 17 frames/s, and the performance of the model in terms of precision, recall, and f-measure were recorded at 0.82, 0.98, and 0.89, respectively.
Hodges and Lattimer [149] presented a Deep Convolutional Inverse Graphic Network (DCIGN) that combined both CNN and transpose convolutional layers to estimate the spread of wildfires after ignition from 6 h to 24 h. The authors exploited 13 fire attributes, such as aspect, fuel model, slope, moisture, and canopy height, to train the model. A precision of 0.97, sensitivity of 0.92, and f-measure of 0.93 were found when using the proposed technique.
An AlexNet CNN model with modified adaptive pooling combined with traditional image processing was proposed by Wang et al. [150] to automatically locate fire pixels from images obtained from the Corsica Fire Database. The authors stated that the present studies only applied CNN directly to the fire images without considering colour features. Thus, they segregated the fire regions in the images by utilising the colour features before training the CNN model. Subsequently, the best classification accuracy of 90.7% was reported by the authors when they trained and evaluated the model using only the segmented images instead of the full original images.
Zhang et al. [151] adopted 14 influencing fire factors—elevation, slope, aspect, average temperature, average precipitation, surface roughness, average wind speed, maximum temperature, specific humidity, precipitation rate, forest coverage ratio, NDVI, distance to roads, and distance to rivers—to train a CNN algorithm to forecast a spatial prediction map. Data from 2002 to 2010 collected from the Yunnan Province of China were used in the study. The authors also applied feature selection techniques such as multicollinearity analysis and information gain ratio to evaluate the importance of each fire attribute. Additionally, an oversampling technique was employed to resolve the issue of the imbalance class while proportional stratified sampling was also utilised to fairly compare the performance of the CNN with other benchmark classifiers such as random forest, support vector machine, multi-layer perceptron (MLP), and kernel logistic regression. The authors reported that a high AUC of 0.86 was attained by the proposed CNN.
To benefit from the real-time aerial images captured from UAVs, a low-power CNN deep learning algorithm based on YOLOv3 was devised by Jiao et al. [152] to improve the accuracy and speed of detection. The authors utilised the UAVs’ internal computing resources to determine whether any fire pixels were detected from studied footage. They justified that the transmission of a large amount of data from the UAVs to the cloud services was not feasible. At the same time, contents in the videos or images may be susceptible to privacy issues. To resolve these concerns, only the results (i.e., fire or no fire detected) were sent from the UAVs to the cloud services. It should be highlighted that the YOLOv3 model was trained on a desktop computer before embedding it onto the UAVs for evaluation and testing purposes. A precision of 0.82, recall of 0.79, and f1-score of 0.81 were achieved by the proposed model.
Ban et al. [102] proposed a deep learning framework based on a CNN to automatically identify burnt regions by training the model with the Sentinel-1 Synthetic Aperture Radar (SAR) images. The experiments were conducted based on two fire incidents in Canada and one fire incident in America. The authors emphasised the feasibility of SAR images in wildfire monitoring as SAR is an active sensor that can produce microwave signals and receive the returned signals (i.e., backscattered). In other words, SAR does not need to rely on the availability of sunlight, so it can capture all images during the day and night-time. By training the CNN model with SAR images containing the VV and VH polarisation, the model was able to detect the progression of wildfires in all three of the study locations. When comparing the proposed CNN against the traditional log-ratio method, Ban et al. [102] reported a considerable improvement in terms of the Kappa metrics, which were improved by 0.11, 0.27, and 0.30 for the three respective incidents.
Similar to the work of Jiao et al. [152], Wang et al. [153] developed a lightweight YOLO and MobileNetv3 integrated with a pruned network and knowledge distillation process to improve the speed and accuracy of real-time detection on a UAV. They pretrained their models with the MSCOCO dataset before training the models utilising a fire dataset. A total of 1069 fire and 775 non-fire images were supplied to allow the model to learn the characteristics of fire regions. The proposed model was able to achieve a recall of 98.41%, precision of 88.57%, and accuracy of 96.11%. While the performance of the proposed model was on par with other baseline models, the authors emphasised that the proposed technique was able to reduce the inference (i.e., testing) time required from 153.8 ms (YOLOv4 model) to 37.4 ms (proposed model). This was enabled by tremendous reductions in model parameters resulting in an approximate 95.87% inference time reduction compared with the YOLOv4 model.
Table 8 summarises all the deep learning algorithms adopted in the forest fire domain. Among the eight pieces of literature reviewed in this section, five studies utilised images from UAV or CCTV to perform image recognition and three studies exploited the availability of remote sensing information to perform relevant fire detection tasks.

5. Challenges and Future Direction of Forest Fire Efforts in Malaysia

To exploit the potential of machine learning for the task of forest fire detection in Malaysia, the first necessary step is to collect remote sensing data and any other ground data. However, there are various challenges involved in the data acquisition process. Though there are a tremendous amount of remote sensing data available, it remains challenging to collect and utilise them effectively to produce significant research results. Additionally, data from the Malaysian government may be restricted to their department’s internal usage. An additional manual application is mandatory to obtain access to some data (e.g., historical forest fire data). In a situation when the historical forest fire data cannot be obtained from the government department, researchers need to perform data validation of the fire location and fire occurrence time through other approaches (e.g., satellite imagery validation and newspaper validation). Data validation is vital because the performance of a model greatly relies on the precision of annotated data labels.
As the works related to understanding the factors of fire occurrence in Malaysia remain limited, it is crucial to study the attributes of forest fires by correlating the fire incidents with various remote sensing data and ground data. Subsequently, machine learning or deep learning algorithms can be adopted by utilising all remote sensing data and ground data collected to either predict fire pixels on spatial maps or to forecast future spatial fire maps. Alternatively, researchers can also consider tackling the issue of forest fires from the perspective of optical sensors (e.g., digital camera and UAV) [32,33], wireless sensor networks [154,155,156], or satellite imagery fire pixel classification [102].
It is also worth pointing out that several researchers have identified that most intense forest fires have arisen in peat swamp forests [8,35,85]. They have highlighted that fires in peat swamp forests cannot be easily detected as they unnoticeably spread through the underground. Thus, investigating the factors of forest fires in peat swamp forests is definitely a worthy future research direction.

Open Research Questions

Based on the reviewed literature, we formulated four research questions for future studies to address, which will be further discussed in the following paragraphs.
Research Question #1: What are the influencing factors of forest fires in Malaysia? To understand the elements constituting forest fires in Malaysia, it is necessary to perform a thorough investigation of the historical forest fire incidents by utilising remote sensing data. Though several similar studies have been performed in Central Kalimantan, the Mediterranean region of Europe, and the North America continent [157,158,159], it is still extremely vital to perform this type of analysis to examine the local influencing factors of each fire occurrence because the factors contributing to fires may vary depending on location since each region is influenced by distinct climates, temperatures, weather, local fuels, topography, etc. [25].
Research Question #2: How can remote sensing data (i.e., satellite data) be used to build a machine learning model in Malaysia for the task of forest fire detection? Unlike any other field of study, a general machine modelling technique cannot be deployed in the task of forest fire detection because of the variation in training data collected from different regions [26,138]. In other words, it is not feasible to build a fire model by using the data attained from a region in Australia and subsequently implement it in the country of Malaysia since fires might be affected by different factors. Thus, the analysis results following Research Question #1 can be further exploited to build a forest fire dataset specifically for the country of Malaysia. Once the dataset has been established, a few machine classifiers can then be employed to evaluate its usability (i.e., utility).
Research Question #3: Can forest fire incidents be identified earlier to prevent disastrous fire tragedies? Once the model from Research Question #2 has been devised, it is feasible to forecast the risk or the occurrence of fires at certain locations by utilising the forecasted data (e.g., wind speed and land surface temperature) from satellites or meteorology stations to the machine model. For a forecasted fire region, analysts or domain experts can further analyse the fire factors and undertake appropriate measures to prevent fire incident. For example, peat swamp fires tend to be triggered in prolonged drought scenarios [8]. Ideally, if the detected land surface temperature and drought level are relatively high, authorities can then increase the water table level of the peat swamp region to prevent fire incidents [160]. To aid the task of factor analysis, we recommend exploring the use of fuzzy cognitive maps [161] or Bayesian networks for discovering the causal relationships between each factor and fire occurrence. Based on the relationship presented by the model, analysts and domain experts can certainly gain a more in-depth understanding of fire occurrence.
Research Question #4: Can the models and experiments be made reproducible and scalable to a global level? In past works related to forest fires in Malaysia, researchers have been required to access and pre-process satellite data before importing them into GIS software to perform further analysis. The inconsistency of the pre-processing and analysis steps may hinder the experiments’ potential to be reproduced and scaled. With the availability of a big data platform for EO data, researchers can seamlessly access satellite data to perform their analysis. Since the same datasets are exploited by researchers, experiments can be easily reproduced through code sharing. To accommodate the model on a global scale, some platforms would just require simple tweaks to their code. For instance, Open Data Cube [28], which is an open-source software, can be used if the local computing resources can accommodate the analysis task. However, in a scenario with a lack of computing resources, the Google Earth Engine [29] and Planetary Computer [30] platforms can be exploited to alleviate the local computing resources as some of the heavy processing can be performed on their servers.

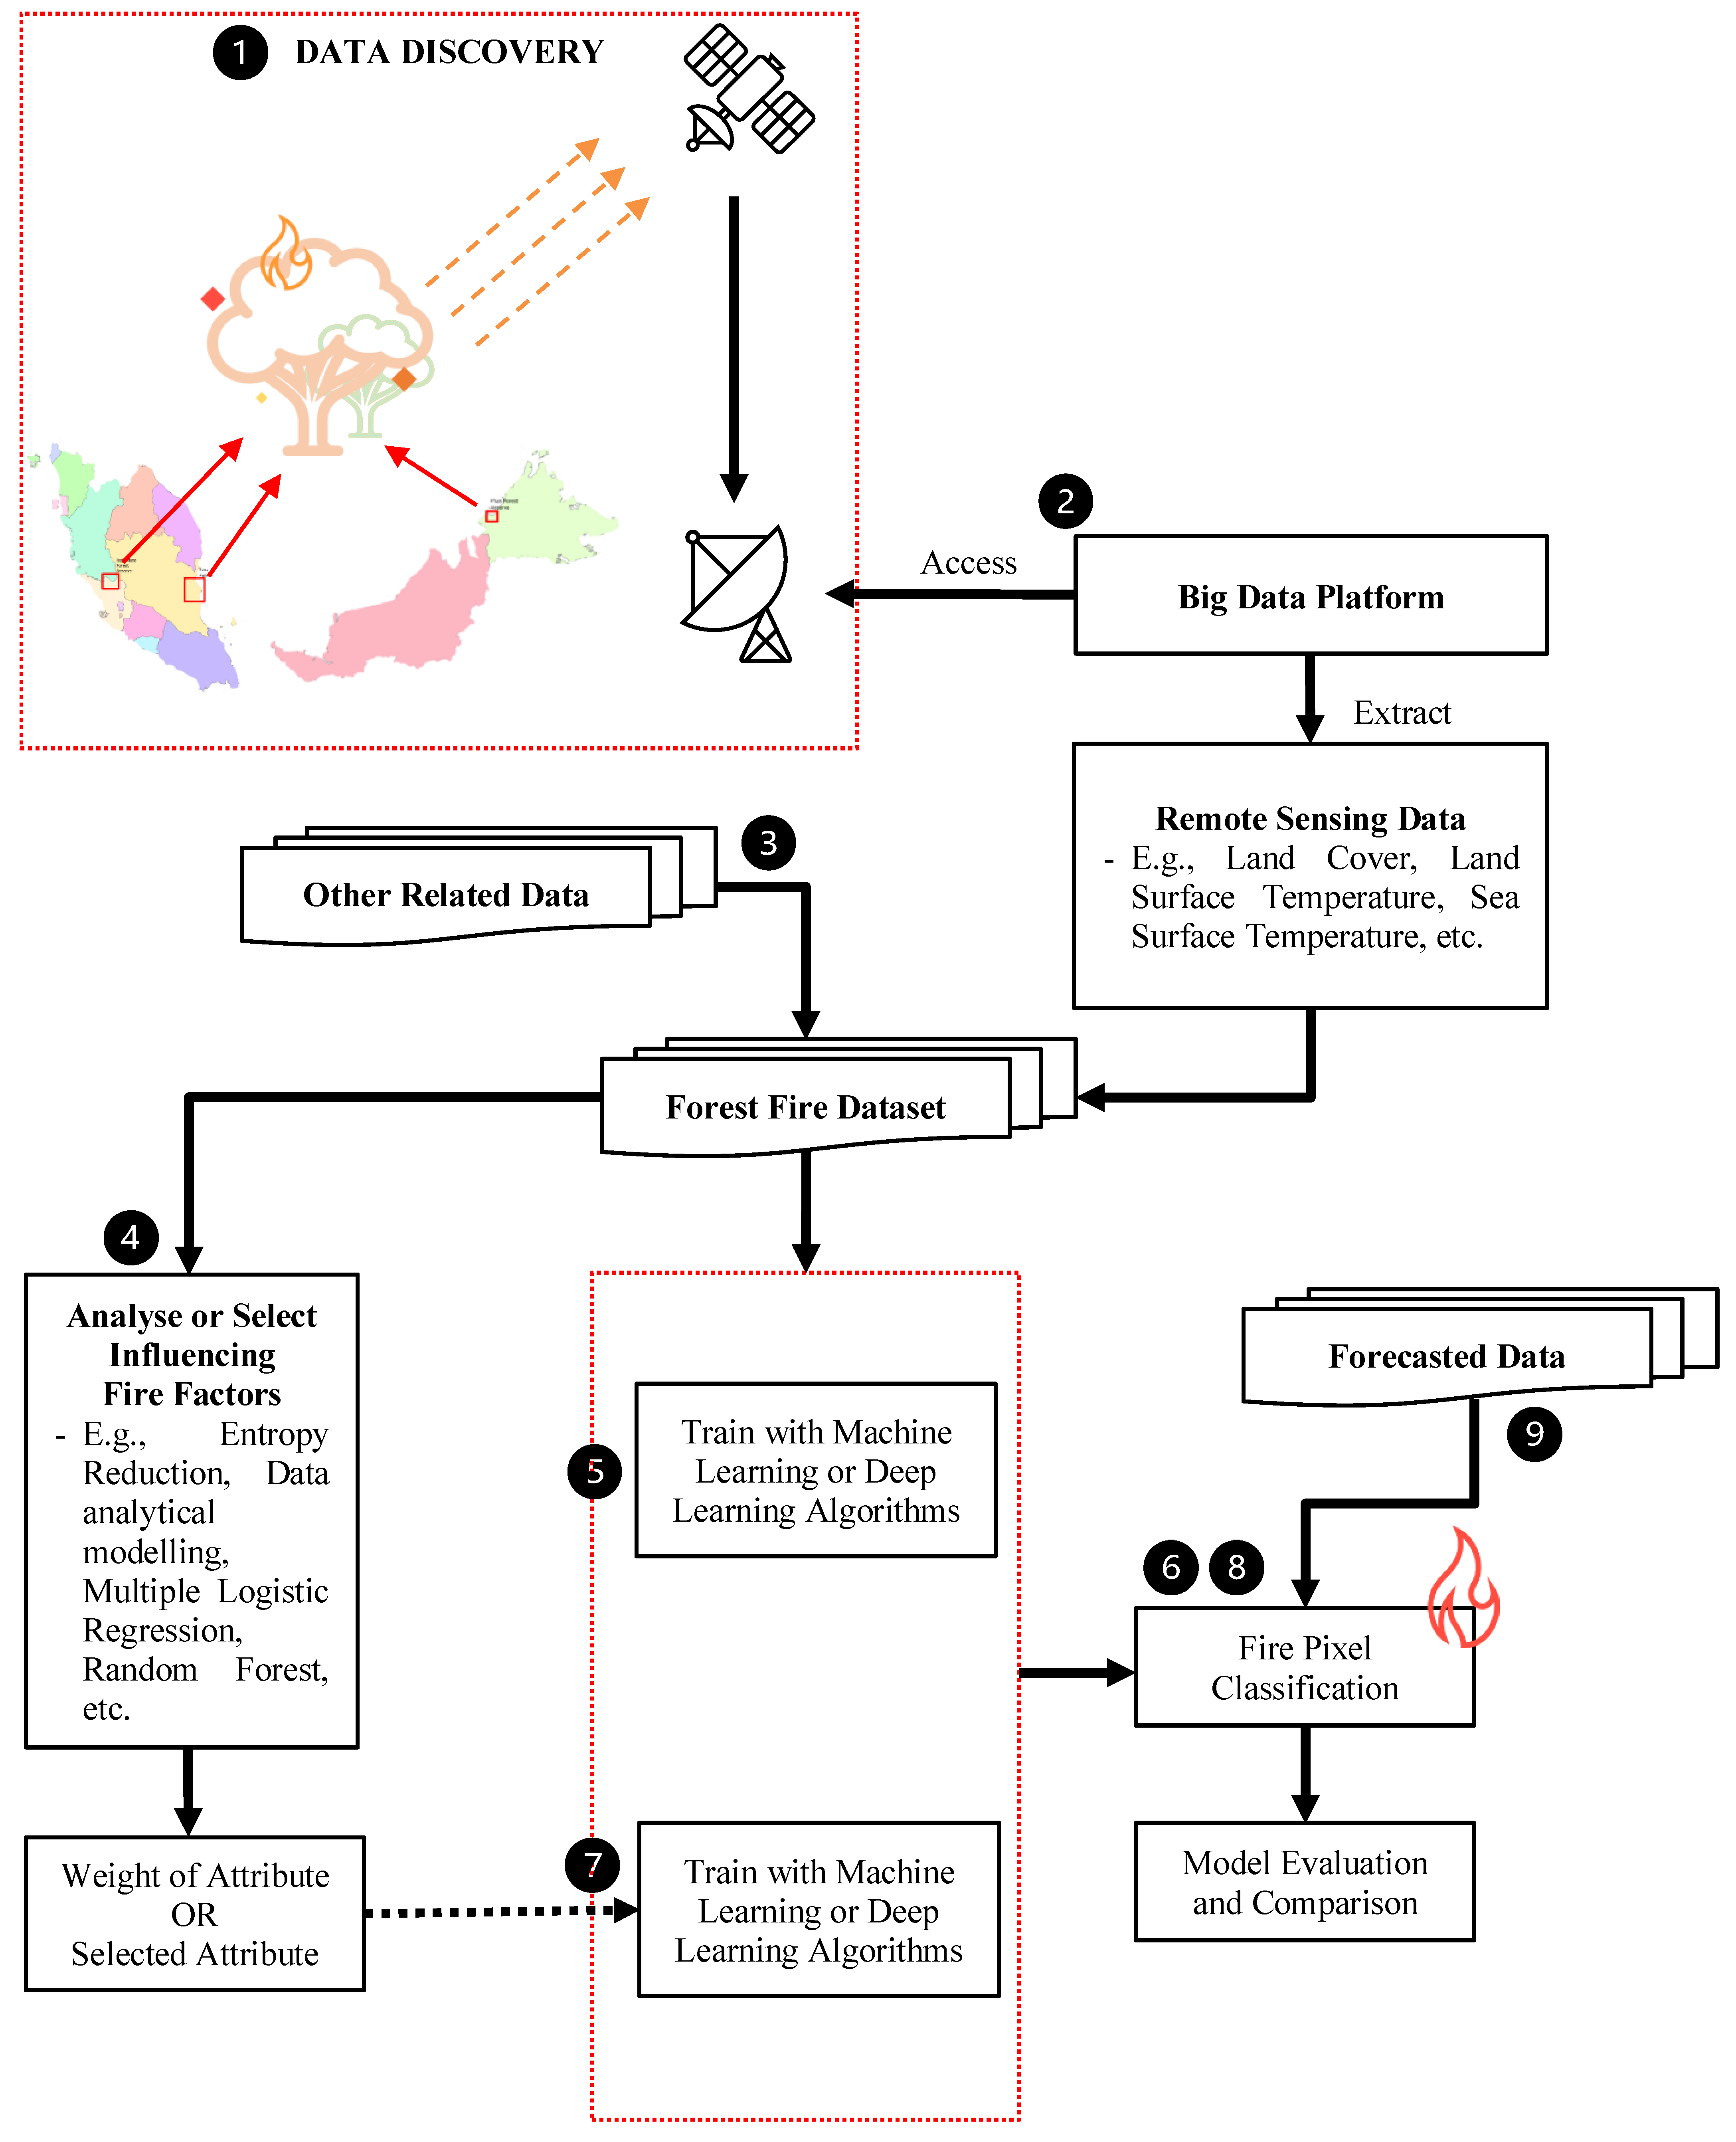
6. Proposed General Methodology to Utilise Remote Sensing Data for Forest Fire Efforts in Malaysia

The proposed methodology to utilise remote sensing data for forest fire efforts is succinctly deliberated in this section as a solution proposed to address the arising research questions described in Section 5. Figure 2 presents the general flow of the overall works that can be undertaken in the future. Each of the steps numbered in the figure will be elaborated to offer a better insight into the proposed research methodology. It is postulated that the proposed methodology can also be applied to other locations or countries, as well as other research problems in the geoscience domain.
Step 1: Data Discovery. Firstly, the study locations must be selected in this phase. The preferred locations are forests that have dealt with fire incidents in the past. Based on the historical fire incidence data provided in Table 4, (i) Pekan, Pahang; (ii) Raja Musa Forest Reserve, Selangor; and (iii) Klias, Sabah are the most suitable locations to be studied and investigated. To obtain the necessary information (i.e., statistics, area burnt, and location of forest fire) related to the selected locations, a request can be sent to the Forestry Department of Peninsular Malaysia (JPSM) for Peninsular Malaysia or Sabah Forestry Department for the state of Sabah. In the absence of historical fire incident information from government departments, MODIS active fire product hotspots [112] can be substituted as historical fire spots. It should be noted that the hotspots from MODIS have been exploited in several works related to a forest fire in the literature [159,162,163].
Step 2: Remote Sensing Data Extraction. Once the locations and historical fire incidents or hotspots have been identified, a big data platform for satellite data or direct access from a data provider (e.g., NASA) can be utilised to access and extract all the relevant remote sensing data from various satellite sensors. For instance, slope, aspect, elevation, land cover, land surface temperature, and sea surface temperature can be obtained or derived from extracted data. It should be remarked that some of the information might be required to undergo further processing procedures before it can be utilised to build the forest fire dataset. The utilisation of big data platforms such as Open Data Cube [28], Google Earth Engine [29], and Planetary Computer [30] will undoubtedly facilitate and improve the process of satellite data acquisition.
Step 3: Forest Fire Datasets Establishment. In addition to the remote sensing data mentioned in Step 2, other related data such as distance to road, distance to residential area, distance to river, population density, and socioeconomic information can also be assimilated as the influencing factors to create the forest fire dataset. Some of these data can be obtained or accessed from the Malaysia government portal, as described in Table 6.
Step 4: Feature Analysis and Selection. After building the forest fire datasets, statistical analysis can then be exploited to assess the relationship between each attribute and forest fire incident. Some of the works in the literature adopted entropy reduction [144] and data analytical modelling in GIS [159] to discover the most significant influencing forest fire factors. Once the importance of each attribute has been evaluated, the metrics can be fine-tuned as the weight of each attribute and subsequently supplied to the machine classifiers. On the other hand, feature selection techniques through machine classifiers such as multiple logistic regression [157] and random forest [157] have also been carried out by researchers to select the primary affecting attributes to build their models.
Steps 5 and 6: Machine Learning Training and Evaluation without Attribute Weighting and Feature Selection. Machine learning classification models (e.g., random forest, support vector machine, and decision tree) or other deep learning models can then be adopted to build the model using the forest fire datasets. Once the models have been trained, they can then be used as predictors to measure the likelihood of a certain pixel being a fire pixel or a normal pixel.
Steps 7 and 8: Machine Learning Training and Evaluation with Attribute Weighting and Feature Selection. To assess the impacts of attribute weighting or feature selection obtained in Step 4, a similar experimental procedure as described in Steps 5 and 6 can be repeated by incorporating the weighted attributes or only the selected features to build the model. Some evaluation metrics (e.g., classification accuracy) can then be used to evaluate the improvement or degradation effects resulting from the application of attribute weighting or feature selection.
Step 9: Forecasting Future Fire Incidence. Generally, three methods can be used to predict future fire incidents; the first strategy requires the forecasted data from satellite or weather station to be extracted and supplied as the testing data. For example, the next seven days of meteorological data (e.g., rainfall, temperature, and wind speed) can be provided to the trained models in Step 5 or 7 to foresee whether the location will be identified as a fire-prone pixel. On the other hand, advanced analysis techniques such as trend analysis or hotspot analysis schemes can be employed to visualise and forecast the future trends of fires. Alternatively, fuzzy cognitive mapping models can be exploited to uncover the causal relationships between the factors and fire incidents.

7. Forest Fire Benchmark Datasets

In the machine learning community, a benchmark dataset representing a real-world data science problem is commonly utilised to discover the best solution for a specific problem by measuring the performance of different machine learning models [164]. Generally, a classifier trained by tabular data (e.g., breast cancer [165]) or images (e.g., ImageNet [166]) can be used to perform prediction tasks. Unlike the typical machine learning field, the general geoscience domain must deal with a tremendous volume of remote sensing data to create a benchmark dataset. Before building such a dataset, it is also necessary to study the relevant factors contributing to the problem to extract the relevant attributes. For instance, land-cover types, temperature, humidity, and digital elevation models are some of the critical factors in forest fire occurrence based on previous studies, e.g., by Ganteaume et al. [101]. Additionally, the use of validation data from previous field studies (i.e., verifying forest fire locations from a field study) is also essential to enhance the credibility of a dataset. Furthermore, a prediction task in the geoscience domain can span from the present to several minutes, months, or even years.
Though it is not an easy task to create a benchmark dataset, particularly in the geoscience domain, several weather and climate benchmark datasets have been created and are directly accessible from http://mldata.pangeo.io/ (accessed on 10 August 2022). For example, the WeatherBench [167] benchmark dataset can be exploited with a machine learning algorithm to forecast 3–5 days of global weather patterns. Presently, there are only two publicly accessible forest fire datasets [135,168]. Cortez and Morais [135] focused on the regression problem to predict the burnt area regions in Portugal by exploiting 13 attributes and 517 instances, while Sayad et al. [168] attempted to classify fire and non-fire pixels in Canada by utilising three influencing attributes and a total of 1713 instances. Both of the datasets only utilised a small number of attributes and instances. Referring to the geoscience benchmark dataset criteria set forth by Dueben et al. [164], it can be concluded that no standard benchmark dataset for a forest fire is publicly available to date. Hence, we recommend utilising a big data platform in conjunction with the benchmark dataset guidelines as described by Dueben et al. [164] to create a forest fire benchmark dataset, starting from the country of Malaysia.

Forest Fire Validation Data

As mentioned earlier in Section 5, historical forest fire data can be requested from local government agencies. In a scenario in which such data cannot be obtained, the validation of the fire scene can be rendered with satellite imagery or newspaper articles. Alternatively, post-fire burned area products from the Copernicus Emergency Management Service (EMS) [169] and European Forest Fire Information System (EFFIS) [170] can also be exploited to validate fire activity data. However, these products do not contain any record of fire activity in the country of Malaysia. Therefore, satellite-based, post-fire burned products such as FireCGI51 [171] or MCD64A1 [172,173] can be substituted to recognise burnt areas and to perform the validation of fire incident data.

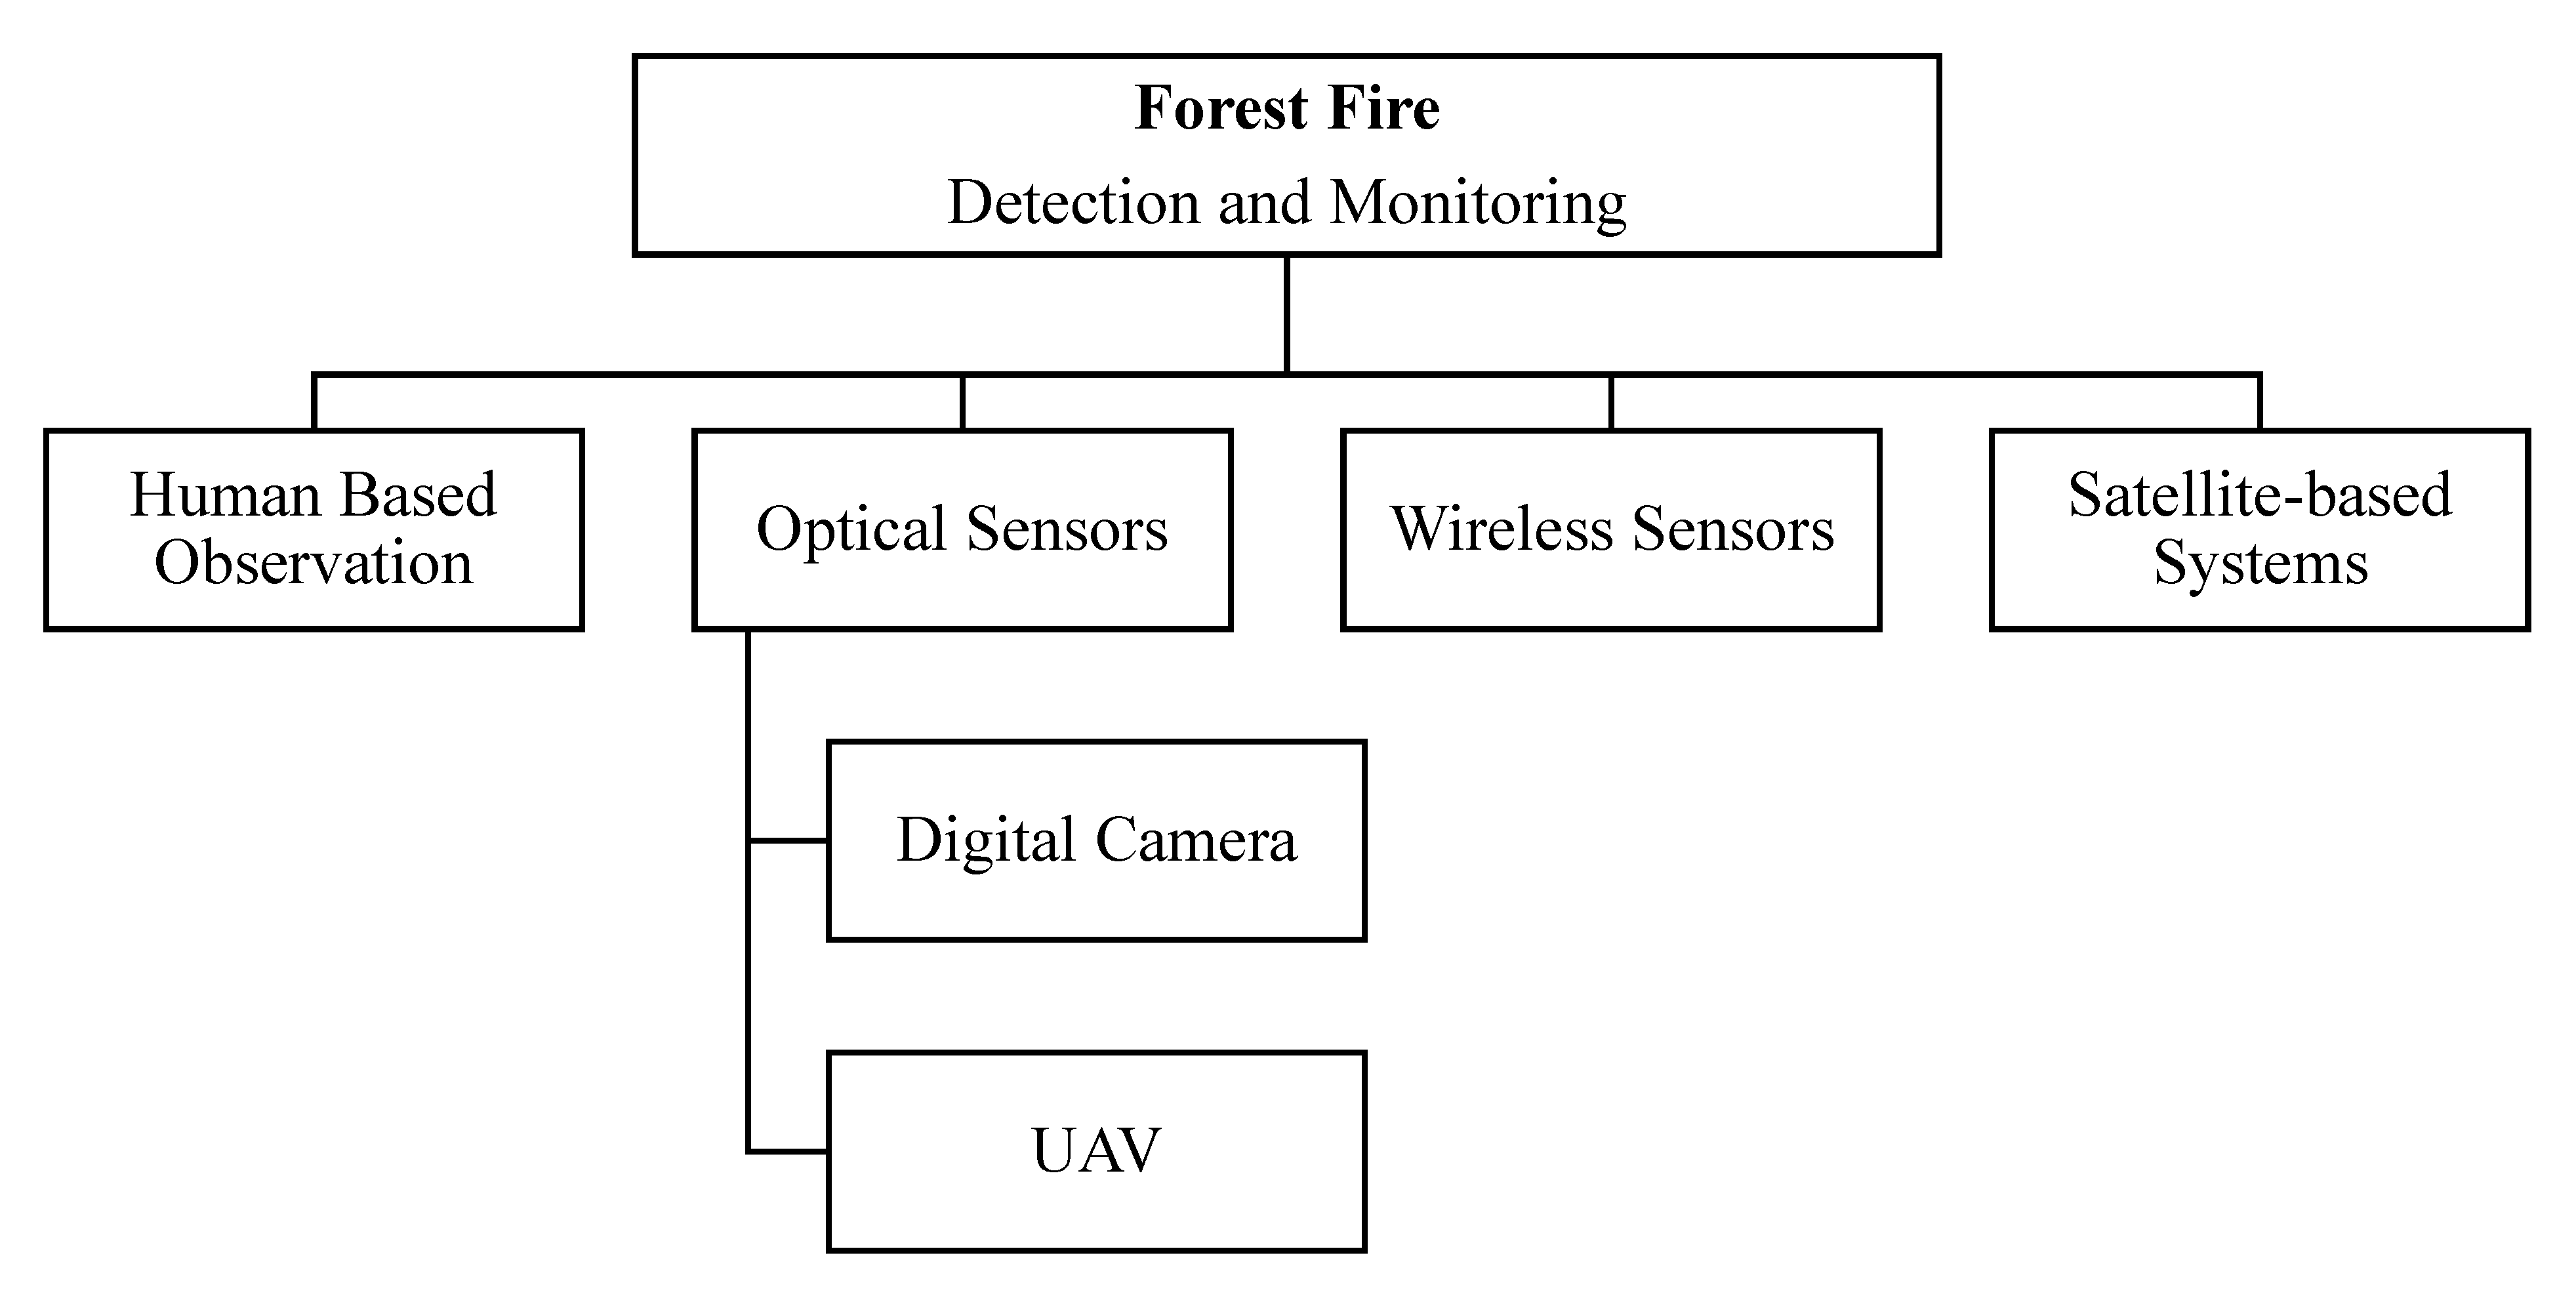
8. Overview of Forest Fire Detection and Monitoring

Traditionally, human-based observation, either from the public or patrol staff, was utilised to discover the occurrence of forest fires. However, such an approach is not feasible in the sense that the fire incidents will only be reported once they are visible. Additionally, the surveillance time is limited to a certain period of the day. Thus, optical sensors such as digital camera surveillance systems are designed to replace human observation. Though digital cameras can effectively detect fires with a low number of false alarms, the deployment of such systems is very expensive as it requires communication infrastructure and a camera tower to establish them. Recently, UAV vision-based system detection has also been developed by several authors [33]. It should be noted that most optical sensor approaches require image processing techniques, along with machine learning or deep learning algorithms, to determine whether a fire occurs in an image.
Alternatively, several works based on wireless sensor networks have also been developed to detect the occurrence of a fire before it is triggered [154,155,156]. Generally, a sensor will collect and analyse parameters such as pressure, humidity, temperature, carbon dioxide, and nitrogen dioxide to determine the presence of a fire. A detailed survey of the variation of fire detection techniques was presented in [32,174].
On the other hand, satellite-based systems such as AVHRR or VIIRS [115] and MODIS Active Fire Products [112] have been employed to determine the potential fire hotspots. The primary disadvantage of this mechanism is its inability to detect a fire in real time because the detection of a location is based on the cycle time of a satellite to return to the same location. With the advancement of technology, one recent research study was focused on uncovering the burnt area from a forest fire by performing deep learning image classification from SAR images [102]. To draw out the strength of the satellite remote sensing data, researchers have also exploited remote sensing data to forecast fire maps [151]. The availability of the public and an enormous amount of remote sensing data [27] have undoubtedly motivated researchers to utilise them in various applications. We refer to [23,24] for reviews of the application of machine learning to build forest fire prediction and detection systems. Figure 3 provides a general overview of forest fire detection and monitoring technology.

9. Other Relevant Studies Commonly Employed in Forest Fire Domain

In contrast to all the works presented in this manuscript, several research fields related to fire spread models commonly employed around the world have also yet to be adopted in Malaysia. Some of these include physical-based models [175,176], computational fluid dynamics (CFD) models [177,178,179], geometrical models [180,181], and cellular automata models [182,183,184]. The fundamentals of a physical model involve the chemistry and/or physics of combustion to simulate fire spread [175]. For example, Koo et al. [176] simulated fire spread activity by utilising the concepts of energy conversation and heat transfer. From their experiments, they discovered that wind and slope attributes were some influencing factors. The advancement of computational power has encouraged the usage of physical models exploiting the computational model to predict the spread of fire [178]. For instance, William et al. [179] utilised CFD to solve a three-dimensional time-dependant equation considering fluid motion, combustion, and heat transfer in order to develop the Wildland Fire Dynamic Simulator. Geometrical modelling is focussed on the application of physical, mathematical and/or computational methods to study the geometry (i.e., shape) of a flame in different scenarios. To illustrate, Lin et al. [180] studied flame geometry in terms of horizontal flame length, vertical flame height, flame base drag, and flame tilt angle in an experiment utilising propane as fuel for four distinct dimensions of gaseous burners with varying air speed (i.e., wind speed) conditions. A cellular automata model is a local grid-based stochastic modelling technique [183]. For example, such a model will split an entire forest into multiple smaller cells, and each cell changes state (e.g., no fuel, contain fuel but not burning, burning, and burnt) depending on the state of the neighbouring cells and time-steps [183]. Hence, researchers may also consider developing the aforementioned models from the physics, chemistry, or mathematics perspectives to build fire spread models.

10. Conclusions

This manuscript predominantly summarises background information for forest fire research in Malaysia. It begins with an exploration of forest-fire-associated research works performed in Malaysia. Then, some of the influencing forest fire factors are briefly discussed. The procurement of data, especially public remote sensing (i.e., satellite date) data that have been utilised in Malaysia, is provided in Section 3. It should be highlighted that only a small amount of satellite data has been adopted in Malaysia. In addition, a small discussion related to big data platforms for accessing remote sensing information is also provided. It is necessary to understand the different acquisition procedures to access the data because these remote sensing data are vital for the establishment of a machine learning-based forest fire dataset in Malaysia.
Section 4 is mainly devoted to exploring the utilisation of machine learning to detect forest fires from a global perspective. From the presented literature, it can be recognised that the application of machine learning for fire detection tasks is definitely not new. However, a finding from the review presented in Section 2 shows that no one has exploited the potential of a machine learning algorithm for forest-fire-related tasks in Malaysia. Subsequently, some of the challenges to utilising machine classifiers for the task of forest fire detection in Malaysia are also discussed in Section 5. Additionally, some future directions and research questions are also contemplated in the same section to provide future researchers in Malaysia avenues for the extension of the literature in the forest fire domain. A general methodology to apply machine learning by making use of remote sensing data and ground data for the task of forest fire detection in Malaysia is proposed in Section 6. In view of technology advancement, it is postulated that the application of machine learning or deep learning algorithms will undoubtedly improve fire monitoring and detection in Malaysia. It can be certain that the ability to accurately detect or forecast fires will assist authorities to efficiently allocate fire-fighting resources to reduce the severity of forest fire incidents. Next, Section 7 highlights that there are no presently available forest fire benchmark datasets, and some general recommendations to create a standard benchmark dataset are also provided in this section. An overview of forest fire detection and monitoring solutions such as human observation, optical sensors, and wireless sensors are briefly discussed in Section 8. Towards the end of the manuscript, some of the methods and techniques associated with fire spread models from the perspectives of mathematics, chemistry, and/or physics are presented in Section 9. It is important to emphasise that these models have been commonly exploited across other countries, but the adoption of these models is still very rare in Malaysia.
In conclusion, research in the forest fire domain in Malaysia comprises discovering the causes of fires, revealing the impacts of fires, and generating fire risk maps by utilising remote sensing data. From this review, it can be speculated that human activity and negligence are the predominant factors in instigating forest fires in Malaysia. To fathom whether environmental variables were some of the influencing fire factors, researchers have also exploited various remote sensing data in conjunction with fire activity information to reveal the relationship between them. Specifically, temperature and precipitation have been shown to exhibit a high correlation with most fire activity. While machine learning has not been utilised in Malaysia, our review suggests that the adoption of machine learning or deep learning techniques will definitely aid in the task of fire prediction or detection in Malaysia. In summation, this review paper aspires to serve as an avenue to facilitate future researchers in their initial stage of exploration for the battle against forest fires in Malaysia.

Author Contributions

Conceptualization, Y.J.C.; Investigation, Y.J.C.; Methodology, Y.J.C.; Writing—Original Draft, Y.J.C.; Funding Acquisition, S.Y.O.; Project Administration, S.Y.O.; Supervision, S.Y.O., Y.H.P. and K.-S.W.; Writing—Review and Editing, S.Y.O., Y.H.P. and K.-S.W. All authors have read and agreed to the published version of the manuscript.

Funding

This research work was supported by a Fundamental Research Grant Schemes (FRGS) under the Ministry of Education and Multimedia University, Malaysia (Project ID: FRGS/1/2020/ICT02/MMU/02/2), and Chey Institute for Advanced Studies (ISEF).

Data Availability Statement

Data sharing is not applicable to this article as no new data were created or analysed in this study.

Acknowledgments

We would like to thank two anonymous reviewers for taking the time and effort necessary to review the manuscript. We sincerely appreciate all valuable comments and suggestions, which helped us to improve the quality of the manuscript.

Conflicts of Interest

The authors declare no conflict of interest.

References

  1. Stefanidis, S.; Alexandridis, V.; Spalevic, V.; Mincato, R.L. Wildfire Effects on Soil Erosion Dynamics: The Case of 2021 Megafires in Greece. Agric. For. 2022, 68, 49–63. [Google Scholar]
  2. Efthimiou, N.; Psomiadis, E.; Panagos, P. Fire Severity and Soil Erosion Susceptibility Mapping Using Multi-Temporal Earth Observation Data: The Case of Mati Fatal Wildfire in Eastern Attica, Greece. Catena 2020, 187, 104320. [Google Scholar] [CrossRef] [PubMed]
  3. Stefanidis, S.; Alexandridis, V.; Ghosal, K. Assessment of Water-Induced Soil Erosion as a Threat to Natura 2000 Protected Areas in Crete Island, Greece. Sustainability 2022, 14, 2738. [Google Scholar] [CrossRef]
  4. Köninger, J.; Panagos, P.; Jones, A.; Briones, M.J.I.; Orgiazzi, A. In Defence of Soil Biodiversity: Towards an Inclusive Protection in the European Union. Biol. Conserv. 2022, 268, 109475. [Google Scholar] [CrossRef]
  5. Goss, M.; Swain, D.L.; Abatzoglou, J.T.; Sarhadi, A.; Kolden, C.A.; Williams, A.P.; Diffenbaugh, N.S. Climate Change Is Increasing the Likelihood of Extreme Autumn Wildfire Conditions across California. Environ. Res. Lett. 2020, 15, 94016. [Google Scholar] [CrossRef]
  6. Radeloff, V.C.; Helmers, D.P.; Kramer, H.A.; Mockrin, M.H.; Alexandre, P.M.; Bar-Massada, A.; Butsic, V.; Hawbaker, T.J.; Martinuzzi, S.; Syphard, A.D. Rapid Growth of the US Wildland-Urban Interface Raises Wildfire Risk. Proc. Natl. Acad. Sci. USA 2018, 115, 3314–3319. [Google Scholar] [CrossRef]
  7. Buckland, M.K. What Is a Megafire? Defining the Social and Physical Dimensions of Extreme US Wildfires (1988–2014). Ph.D. Thesis, University of Colorado, Boulder, CO, USA, 2019. [Google Scholar]
  8. Abdullah, M.J.; Ibrahim, M.R.; Abdul Rahim, A.R. The Incidence of Forest Fire in Peninsular Malaysia: History, Root Causes, Prevention and Control. Prev. Control. Fire Peatl. 2002, 27–34. [Google Scholar]
  9. Chandrasekharan, C. The Mission on Forest Fire Prevention and Management to Indonesia and Malaysia (Sarawak). Trop. For. Fire. Prev. Control. Rehabil. Trans-Bound. Issues 1998, 14, 1–79. [Google Scholar]
  10. Setiawan, I.; Mahmud, A.R.; Mansor, S.; Shariff, A.R.M.; Nuruddin, A.A. GIS-grid-based and Multi-criteria Analysis for Identifying and Mapping Peat Swamp Forest Fire Hazard in Pahang, Malaysia. Disaster Prev. Manag. An. Int. J. 2004, 13, 379–386. [Google Scholar] [CrossRef]
  11. Patah, N.A.; Mansor, S.; Mispan, M.R. An Application of Remote Sensing and Geographic Information System for Forest Fire Risk Mapping. Malays. Cent. Remote Sens. 2006, 54–67. [Google Scholar]
  12. Bernama 80 Hektar Hutan Simpan Kuala Langat Terbakar. Available online: https://www.bharian.com.my/berita/kes/2020/04/679541/80-hektar-hutan-simpan-kuala-langat-terbakar (accessed on 2 August 2021).
  13. Bernama Lebih 40 Hektar Hutan Simpan Kuala Langat Selatan Terbakar. Available online: https://www.bharian.com.my/berita/nasional/2021/03/791876/lebih-40-hektar-hutan-simpan-kuala-langat-selatan-terbakar (accessed on 2 August 2021).
  14. Berita Harian Kegiatan Memancing Disyaki Punca Kebakaran Hutan. Available online: https://www.bharian.com.my/berita/wilayah/2020/03/670625/kegiatan-memancing-disyaki-punca-kebakaran-hutan (accessed on 2 August 2021).
  15. Tang, K.H.D. Climate Change in Malaysia: Trends, Contributors, Impacts, Mitigation and Adaptations. Sci. Total Environ. 2019, 650, 1858–1871. [Google Scholar] [CrossRef]
  16. Alagesh, T.N. 40 ha of Pahang Forest, Peat Land on Fire. New Straits Times, 26 February 2019. Available online: https://www.nst.com.my/news/nation/2019/02/463995/40ha-pahang-forest-peat-land-fire-nsttv(accessed on 28 August 2022).
  17. Then, S. Forest Fires Flare up Again in Parts of Sarawak. The Star. 17 July 2019. Available online: https://www.thestar.com.my/news/nation/2019/07/17/forest-fires-flare-up-again-in-parts-of-sarawak (accessed on 28 August 2022).
  18. Tay, R. The Haze Is Making a Comeback in August, and Some Malaysian Regions Are Already Affected. 2 August 2019. Available online: https://web.archive.org/web/20190823091814/https://www.businessinsider.my/the-haze-is-making-a-comeback-in-august-and-some-malaysian-regions-are-already-affected/ (accessed on 28 August 2022).
  19. Then, S. More Hotspots in Kalimantan May Bring Widespread Transboundary Haze to S’wak. The Star. 18 August 2019. Available online: https://www.thestar.com.my/news/nation/2019/08/18/more-hotspots-in-kalimantan-may-bring-widespread-transboundary-haze-to-s039wak (accessed on 28 August 2022).
  20. Beaman, R.S.; Beaman, J.H.; Marsh, C.W.; Woods, P. V Drought and Forest Fires in Sabah in 1983. Sabah Soc. J. 1985, 8, 10–30. [Google Scholar]
  21. Woods, P. Effects of Logging, Drought, and Fire on Structure and Composition of Tropical Forests in Sabah, Malaysia. Biotropica 1989, 21, 290–298. [Google Scholar] [CrossRef]
  22. Cane, M.A. Oceanographic Events during El Nino. Science 1983, 222, 1189–1195. [Google Scholar] [CrossRef]
  23. Abid, F. A Survey of Machine Learning Algorithms Based Forest Fires Prediction and Detection Systems. Fire Technol. 2020, 57, 559–590. [Google Scholar] [CrossRef]
  24. Bot, K.; Borges, J.G. A Systematic Review of Applications of Machine Learning Techniques for Wildfire Management Decision Support. Inventions 2022, 7, 15. [Google Scholar] [CrossRef]
  25. Chuvieco, E.; Salas, J. Mapping the Spatial Distribution of Forest Fire Danger Using GIS. Int. J. Geogr. Inf. Sci. 1996, 10, 333–345. [Google Scholar] [CrossRef]
  26. Cochrane, M.A. Fire Science for Rainforests. Nature 2003, 421, 913–919. [Google Scholar] [CrossRef]
  27. Gomes, V.C.F.; Queiroz, G.R.; Ferreira, K.R. An Overview of Platforms for Big Earth Observation Data Management and Analysis. Remote Sens. 2020, 12, 1253. [Google Scholar] [CrossRef]
  28. Killough, B. Overview of the Open Data Cube Initiative. In Proceedings of the IGARSS 2018—2018 IEEE International Geoscience and Remote Sensing Symposium, Valencia, Spain, 23 July 2018; pp. 8629–8632. [Google Scholar]
  29. Gorelick, N.; Hancher, M.; Dixon, M.; Ilyushchenko, S.; Thau, D.; Moore, R. Google Earth Engine: Planetary-Scale Geospatial Analysis for Everyone. Remote Sens. Environ. 2017, 202, 18–27. [Google Scholar] [CrossRef]
  30. Microsoft Planetary Computer. Available online: https://planetarycomputer.microsoft.com/ (accessed on 24 January 2022).
  31. Joseph, S.; Anitha, K.; Murthy, M.S.R. Forest Fire in India: A Review of the Knowledge Base. J. For. Res. 2009, 14, 127–134. [Google Scholar] [CrossRef]
  32. Alkhatib, A.A.A. A Review on Forest Fire Detection Techniques. Int. J. Distrib. Sens. Netw. 2014, 2014, 597368. [Google Scholar] [CrossRef]
  33. Yuan, C.; Zhang, Y.; Liu, Z. A Survey on Technologies for Automatic Forest Fire Monitoring, Detection, and Fighting Using Unmanned Aerial Vehicles and Remote Sensing Techniques. Can. J. For. Res. 2015, 45, 783–792. [Google Scholar] [CrossRef]
  34. Ministry of Environment and Water Air Pollutant Index (API). Available online: https://www.doe.gov.my/portalv1/en/info-umum/english-air-pollutant-index-api/100 (accessed on 3 March 2021).
  35. Musa, S.; Parlan, I. The 1997/98 Forest Fire Experience in Peninsular Malaysia. Prev. Control Fire Peatl. 2002, 69–74. [Google Scholar]
  36. Diemont, W.H.; Hillegers, P.J.M.; Joosten, H.; Kramer, K.; Ritzema, H.P.; Rieley, J.; Wösten, J.H.M. Fire and Peat Forests, What Are the Solutions? In Proceedings of the Workshop on Prevention & Control of Fire in Peatlands, Kuala Lumpur, Malaysia, 19 March 2002; pp. 41–50. [Google Scholar]
  37. Schott, J.R. Remote Sensing: The Image Chain Approach, 2nd ed.; Oxford University Press on Demand: Oxford, UK, 2007. [Google Scholar]
  38. Chuvieco, E.; Congalton, R.G. Application of Remote Sensing and Geographic Information Systems to Forest Fire Hazard Mapping. Remote Sens. Environ. 1989, 29, 147–159. [Google Scholar] [CrossRef]
  39. Clarke, K.C. Advances in Geographic Information Systems. Comput. Environ. Urban Syst. 1986, 10, 175–184. [Google Scholar] [CrossRef]
  40. Esri Introducing ArcGIS Platform|Esri. Available online: https://www.esri.com/en-us/home (accessed on 13 March 2021).
  41. QGIS Development Team Welcome to the QGIS Project! Available online: https://www.qgis.org/en/site/ (accessed on 13 March 2021).
  42. Dymond, C.C.; Roswintiarti, O.; Brady, M. Characterizing and Mapping Fuels for Malaysia and Western Indonesia. Int. J. Wildl. Fire 2004, 13, 323–334. [Google Scholar] [CrossRef]
  43. Stibig, H.; Belward, A.S.; Roy, P.S.; Rosalina-Wasrin, U.; Agrawal, S.; Joshi, P.K.; Hildanus; Beuchle, R.; Fritz, S.; Mubareka, S. A Land-cover Map for South and Southeast Asia Derived from SPOT-VEGETATION Data. J. Biogeogr. 2007, 34, 625–637. [Google Scholar] [CrossRef]
  44. DeFries, R.S.; Townshend, J.R.G.; Hansen, M.C. Continuous Fields of Vegetation Characteristics at the Global Scale at 1-km Resolution. J. Geophys. Res. Atmos. 1999, 104, 16911–16923. [Google Scholar] [CrossRef]
  45. Dymond, C.C.; Field, R.D.; Roswintiarti, O. Using Satellite Fire Detection to Calibrate Components of the Fire Weather Index System in Malaysia and Indonesia. Environ. Manag. 2005, 35, 426–440. [Google Scholar] [CrossRef]
  46. Stocks, B.J.; Lynham, T.J.; Lawson, B.D.; Alexander, M.E.; Van Wagner, C.E.; McAlpine, R.S.; Dube, D.E. Canadian Forest Fire Danger Rating System: An Overview. For. Chron. 1989, 65, 258–265. [Google Scholar] [CrossRef]
  47. Arino, O.; Melinotte, J.M. Fire Index Atlas. Earth Obs. Q. 1995, 50, 11–16. [Google Scholar]
  48. Peng, G.; Li, J.; Chen, Y.; Norizan, A.P.; Tay, L. High-Resolution Surface Relative Humidity Computation Using MODIS Image in Peninsular Malaysia. Chin. Geogr. Sci. 2006, 16, 260–264. [Google Scholar] [CrossRef]
  49. Han, K.-S.; Viau, A.A.; Anctil, F. High-Resolution Forest Fire Weather Index Computations Using Satellite Remote Sensing. Can. J. For. Res. 2003, 33, 1134–1143. [Google Scholar] [CrossRef]
  50. Anderson, I.P.; Imanda, I.D.; Balai, M.; Dan, I.; Hutan, P.; Ii, W.; Kehutanan, K.; Perkebunan, D. Vegetation Fires in Sumatra, Indonesia: The Presentation and Distribution of NOAA Derived Data. In Forest Fire Prevention and Control Project; Natural Resources International Ltd. Scot Conseil: Jakarta, Indonesia, 1999. [Google Scholar]
  51. Pradhan, B.; Suliman, M.D.H.B.; Awang, M.A. Bin Forest Fire Susceptibility and Risk Mapping Using Remote Sensing and Geographical Information Systems (GIS). Disaster Prev. Manag. 2007, 16, 344–352. [Google Scholar] [CrossRef]
  52. Peng, G.-X.; Jing, L.; Chen, Y.-H.; Norizan, A.-P. A Forest Fire Risk Assessment Using ASTER Images in Peninsular Malaysia. J. China Univ. Min. Technol. 2007, 17, 232–237. [Google Scholar] [CrossRef]
  53. Dasgupta, S.; Qu, J.J.; Hao, X. Design of a Susceptibility Index for Fire Risk Monitoring. IEEE Geosci. Remote Sens. Lett. 2006, 3, 140–144. [Google Scholar] [CrossRef]
  54. De Groot, W.J.; Field, R.D.; Brady, M.A.; Roswintiarti, O.; Mohamad, M. Development of the Indonesian and Malaysian Fire Danger Rating Systems. Mitig. Adapt. Strateg. Glob. Chang. 2007, 12, 165. [Google Scholar] [CrossRef]
  55. Malaysia Meteorological Department Sistem Risiko Bahaya Kebakaran (FDRS) Malaysia. Available online: https://www.met.gov.my/iklim/fdrs/mfdrs (accessed on 9 March 2021).
  56. Malaysia Meteorological Department Sistem Risiko Bahaya Kebakaran (FDRS) ASEAN. Available online: https://www.met.gov.my/iklim/fdrs/afdrs?lang=bm (accessed on 9 March 2021).
  57. Rieley, J.; Page, S. Tropical Peatland of the World. In Tropical Peatland Ecosystems; Springer: Berlin/Heidelberg, Germany, 2016; pp. 3–32. [Google Scholar]
  58. Ainuddin, N.A.; Ampun, J. Temporal Analysis of the Keetch-Byram Drought Index in Malaysia: Implications for Forest Fire Management. J. Appl. Sci. 2008, 8, 3991–3994. [Google Scholar] [CrossRef]
  59. Keetch, J.J.; Byram, G.M. A Drought Index for Forest Fire Control; US Department of Agriculture, Forest Service, Southeastern Forest Experiment: Asheville, NC, USA, 1968; Volume 38. [Google Scholar]
  60. Finkele, K.; Mills, G.A.; Beard, G.; Jones, D.A. National Gridded Drought Factors and Comparison of Two Soil Moisture Deficit Formulations Used in Prediction of Forest Fire Danger Index in Australia. Aust. Meteorol. Mag. 2006, 55, 183–197. [Google Scholar]
  61. Pradhan, B. Hot Spot Detection and Monitoring Using MODIS and NOAA AVHRR Images for Wild Fire Emergency Preparedness. In Proceedings of the 2nd Applied Geoinformatics for Society and Environment (AGSE) Conference, Stuttgart Technology University of Applied Sciences, Stuttgart, Germany, 12–17 July 2009; pp. 53–61. [Google Scholar]
  62. Mahmud, A.; Setiawan, I.; Mansor, S.; Shariff, A.; Pradhan, B.; Nuruddin, A. Utilization of Geoinformation Tools for the Development of Forest Fire Hazard Mapping System: Example of Pekan Fire, Malaysia. Open Geosci. 2009, 1, 456–462. [Google Scholar] [CrossRef]
  63. Saaty, T.L. How to Make a Decision: The Analytic Hierarchy Process. Eur. J. Oper. Res. 1990, 48, 9–26. [Google Scholar] [CrossRef]
  64. Razali, S.M.; Nuruddin, A.A.; Malek, I.A.; Patah, N.A. Forest Fire Hazard Rating Assessment in Peat Swamp Forest Using Landsat Thematic Mapper Image. J. Appl. Remote Sens. 2010, 4, 43531. [Google Scholar] [CrossRef]
  65. Ramsey, E.W.; Hodgson, M.E.; Sapkota, S.K.; Nelson, G.A. Forest Impact Estimated with NOAA AVHRR and Landsat TM Data Related to an Empirical Hurricane Wind-Field Distribution. Remote Sens. Environ. 2001, 77, 279–292. [Google Scholar] [CrossRef]
  66. Ismail, P.; Shamsudin, I.; Khali Aziz, H. Development of Indicators for Assessing Susceptibility of Degraded Peatland Areas to Forest Fires in Peninsular Malaysia. IUFRO World Ser. 2011, 29, 67. [Google Scholar]
  67. Hyer, E.J.; Reid, J.S.; Prins, E.M.; Hoffman, J.P.; Schmidt, C.C.; Miettinen, J.I.; Giglio, L. Patterns of Fire Activity over Indonesia and Malaysia from Polar and Geostationary Satellite Observations. Atmos. Res. 2013, 122, 504–519. [Google Scholar] [CrossRef]
  68. Suliman, M.D.H.; Mahmud, M.; Reba, M.N.M. Mapping and Analysis of Forest and Land Fire Potential Using Geospatial Technology and Mathematical Modeling. IOP Conf. Ser. Earth Environ. Sci. 2014, 18, 12034. [Google Scholar] [CrossRef]
  69. Mohd, D.; Mastura, M. Analysis of Potential Forest Fires by Utilizing Geospatial and AHP Model in Selangor, Malaysia. Sains Malays. 2013, 42, 579–586. [Google Scholar]
  70. Ash’aari, Z.H.; Badrunsham, A.S. Spatial Temporal Analysis of Forest Fire in Malaysia Using ATSR Satellite Measurement. Bull. Environ. Sci. Sustain. Manag. 2014, 2, 8–11. [Google Scholar] [CrossRef]
  71. Leewe, Y.; Ahmad, A.N.; Ismail, A.; Sheriza, M.R. Analysis of Hotspot Pattern Distribution at Sabah, Malaysia for Forest Fire Management. J. Environ. Sci. Technol. 2016, 9, 291–295. [Google Scholar]
  72. Davies, D.K.; Ilavajhala, S.; Wong, M.M.; Justice, C.O. Fire Information for Resource Management System: Archiving and Distributing MODIS Active Fire Data. IEEE Trans. Geosci. Remote Sens. 2008, 47, 72–79. [Google Scholar] [CrossRef]
  73. Bin Jamaruppin, M.E.; Bayuaji, L.; Ab Ghani, N.B.; Rahman, M.A.; Akashah, F.W.; Shah, A. Forest Fire Occurrence Analysis Base on Land Brightness Temperature Using Landsat Data (Study Area: Jalan Kuantan–Pekan, Pahang, Malaysia). In Proceedings of the National Conference for Postgraduate Research, University Malaysia Pahang, Pekan, Malaysia, 24–25 September 2016; pp. 798–805. [Google Scholar]
  74. Miettinen, J.; Shi, C.; Liew, S.C. Fire Distribution in Peninsular Malaysia, Sumatra and Borneo in 2015 with Special Emphasis on Peatland Fires. Environ. Manag. 2017, 60, 747–757. [Google Scholar] [CrossRef]
  75. Tacconi, L. Preventing Fires and Haze in Southeast Asia. Nat. Clim. Chang. 2016, 6, 640–643. [Google Scholar] [CrossRef]
  76. Field, R.D.; Van Der Werf, G.R.; Fanin, T.; Fetzer, E.J.; Fuller, R.; Jethva, H.; Levy, R.; Livesey, N.J.; Luo, M.; Torres, O. Indonesian Fire Activity and Smoke Pollution in 2015 Show Persistent Nonlinear Sensitivity to El Niño-Induced Drought. Proc. Natl. Acad. Sci. USA 2016, 113, 9204–9209. [Google Scholar] [CrossRef]
  77. Huijnen, V.; Wooster, M.J.; Kaiser, J.W.; Gaveau, D.L.A.; Flemming, J.; Parrington, M.; Inness, A.; Murdiyarso, D.; Main, B.; van Weele, M. Fire Carbon Emissions over Maritime Southeast Asia in 2015 Largest since 1997. Sci. Rep. 2016, 6, 26886. [Google Scholar]
  78. Miettinen, J.; Shi, C.; Liew, S.C. Land Cover Distribution in the Peatlands of Peninsular Malaysia, Sumatra and Borneo in 2015 with Changes since 1990. Glob. Ecol. Conserv. 2016, 6, 67–78. [Google Scholar] [CrossRef]
  79. Biancalani, R.; Avagyan, A. Towards Climate-Responsible Peatlands Management. Mitig. Clim. Chang. Agric. Ser. 2014, 9, 1–117. [Google Scholar]
  80. Indonesia Meteorological Climatological and Geophysical Agency Sistem Peringatan Kebakaran Hutan Dan Lahan|BMKG. Available online: https://www.bmkg.go.id/cuaca/kebakaran-hutan.bmkg?index=fwi&wil=indonesia&day=obs (accessed on 14 March 2021).
  81. Mahmud, M. Active Fire and Hotspot Emissions in Peninsular Malaysia during the 2002 Burning Season. Geogr. J. Soc. Sp. 2005, 1, 32–45. [Google Scholar]
  82. Joyner, W.M. Compilation of Air-Pollutant Emission Factors, Volume 1, Stationary Point and Area Sources, Fourth Edition, Supplement C. United States; Environmental Protection Agency: Washington, DC, USA, 1 September 1990. [Google Scholar]
  83. Phua, M.-H.; Tsuyuki, S.; Lee, J.S.; Sasakawa, H. Detection of Burned Peat Swamp Forest in a Heterogeneous Tropical Landscape: A Case Study of the Klias Peninsula, Sabah, Malaysia. Landsc. Urban Plan. 2007, 82, 103–116. [Google Scholar] [CrossRef]
  84. Ainuddin, N.A.; Goh, K. Effect of Forest Fire on Stand Structure in Raja Musa Peat Swamp Forest Reserve, Selangor, Malaysia. J. Environ. Sci. Technol. 2010, 3, 56–62. [Google Scholar] [CrossRef]
  85. Bin Suliman, M.D.H.; Serra, J.; Mahmud, M. Prediction and Simulation of Malaysian Forest Fires by Random Spread. Int. J. Remote Sens. 2010, 31, 6015–6032. [Google Scholar] [CrossRef]
  86. Serra, J. The Random Spread Model. Complex Anal. Digit. Geom. 2006, 283–310. [Google Scholar]
  87. Sahani, M.; Zainon, N.A.; Mahiyuddin, W.R.W.; Latif, M.T.; Hod, R.; Khan, M.F.; Tahir, N.M.; Chan, C.-C. A Case-Crossover Analysis of Forest Fire Haze Events and Mortality in Malaysia. Atmos. Environ. 2014, 96, 257–265. [Google Scholar] [CrossRef]
  88. Fisal, N.S.M.; Lintangah, W.; Ismenyah, M. Community Awareness & Challenges in Forest Fire Prevention: A Case Study at Peat Swamp Forest, Klias Forest Reserve, Beaufort, Sabah, Malaysia. Int. J. Agric. For. Plant. 2017, 5, 86–91. [Google Scholar]
  89. Smith, T.E.L.; Evers, S.; Yule, C.M.; Gan, J.Y. In Situ Tropical Peatland Fire Emission Factors and Their Variability, as Determined by Field Measurements in Peninsula Malaysia. Glob. Biogeochem. Cycles 2018, 32, 18–31. [Google Scholar] [CrossRef]
  90. Musri, I.; Ainuddin, A.N.; Hyrul, M.H.I.; Hazandy, A.H.; Azani, A.M.; Mitra, U. Post Forest Fire Management at Tropical Peat Swamp Forest: A Review of Malaysian Experience on Rehabilitation and Risk Mitigation. IOP Conf. Ser. Earth Environ. Sci. 2020, 504, 12017. [Google Scholar] [CrossRef]
  91. Parish, F.; Lew, S.Y.S.; Mohd Hassan, A.H. National Strategies on Responsible Management of Tropical Peatland in Malaysia. In Tropical Peatland Eco-Management; Springer: Berlin/Heidelberg, Germany, 2021; pp. 677–723. [Google Scholar]
  92. Sali, A.; Mohd Ali, A.; Ali, B.M.; Syed Ahmad Abdul Rahman, S.M.; Liew, J.T.; Saleh, N.L.; Nuruddin, A.A.; Mohd Razali, S.; Nsaif, I.G.; Ramli, N. Peatlands Monitoring in Malaysia with IoT Systems: Preliminary Experimental Results. In Proceedings of the International Conference on Computational Intelligence in Information System, Bandar Seri Begawan, Berunei Darussalam, Brunei, 25–27 January 2021; Springer: Berlin/Heidelberg, Germany, 2021; pp. 233–242. [Google Scholar]
  93. Astro Awani Kebakaran Hutan Simpan Pekan Tak Membimbangkan (Fire in Pekan Forest Reserve Is Not a Concern). Available online: https://www.astroawani.com/berita-malaysia/kebakaran-hutan-simpan-pekan-tak-membimbangkan-186979 (accessed on 2 August 2021).
  94. Awang, A. Lebih 300 Hektar Hutan Di Pahang Terbakar (More Than 300 Hectare of Forest Burnt in Pahang). Available online: https://www.bharian.com.my/berita/wilayah/2021/03/795145/lebih-300-hektar-hutan-di-pahang-terbakar (accessed on 2 August 2021).
  95. Bernama Kebakaran Hutan Simpan Pekan: Anggota Bomba, Jabatan Perhutanan Terkandas (Fire in Pekan Forest Reserve: Fire Fighters, Forestry Department Is Stranded). Available online: https://www.utusanborneo.com.my/2018/10/01/kebakaran-hutan-simpan-pekan-anggota-bomba-jabatan-perhutanan-terkandas (accessed on 2 August 2021).
  96. Malaysia Kini Hutan Seluas 34 Hektar Terbakar Di Kuantan (A 34-Hectare Forest Burned in Kuantan). Available online: https://www.malaysiakini.com/news/339616 (accessed on 2 August 2021).
  97. Muhammad, A. 994 Kes Kebakaran Terbuka Di Selangor Sejak Januari. Available online: https://www.sinarharian.com.my/article/125841/BERITA/Semasa/994-kes-kebakaran-terbuka-di-Selangor-sejak-Januari (accessed on 2 August 2021).
  98. Idris, M.N. Kebakaran Hutan Di Selangor Meningkat—Utusan Digital. Available online: https://www.utusan.com.my/berita/2020/07/kebakaran-hutan-di-selangor-meningkat/ (accessed on 2 August 2021).
  99. Utusan Borneo Pasukan Kru Api JPS Bertungkus-Lumus Padam Kebakaran Hutan Simpan Binsuluk|Utusan Borneo Online. Available online: https://www.utusanborneo.com.my/2020/03/29/pasukan-kru-api-jps-bertungkus-lumus-padam-kebakaran-hutan-simpan-binsuluk (accessed on 2 August 2021).
  100. Berita Harian Kualiti Udara Pantai Barat Sabah Semakin Pulih. Available online: https://www.bharian.com.my/berita/nasional/2016/04/141727/kualiti-udara-pantai-barat-sabah-semakin-pulih (accessed on 2 August 2021).
  101. Ganteaume, A.; Camia, A.; Jappiot, M.; San-Miguel-Ayanz, J.; Long-Fournel, M.; Lampin, C. A Review of the Main Driving Factors of Forest Fire Ignition over Europe. Environ. Manag. 2013, 51, 651–662. [Google Scholar] [CrossRef]
  102. Ban, Y.; Zhang, P.; Nascetti, A.; Bevington, A.R.; Wulder, M.A. Near Real-Time Wildfire Progression Monitoring with Sentinel-1 SAR Time Series and Deep Learning. Sci. Rep. 2020, 10, 1322. [Google Scholar] [CrossRef] [PubMed]
  103. Gibson, R.; Danaher, T.; Hehir, W.; Collins, L. A Remote Sensing Approach to Mapping Fire Severity in South-Eastern Australia Using Sentinel 2 and Random Forest. Remote Sens. Environ. 2020, 240, 111702. [Google Scholar] [CrossRef]
  104. United States Geological Survey Earth Explorer. Available online: https://earthexplorer.usgs.gov/ (accessed on 3 April 2021).
  105. Pradhan, B.; Awang, M.A. Application of Remote Sensing and Gis for Forest Fire Susceptibility Mapping Using Likelihood Ratio Model. Proc. Map Malaysia 2007, 16, 344–352. [Google Scholar]
  106. Miettinen, J.; Liew, S.C. Degradation and Development of Peatlands in Peninsular Malaysia and in the Islands of Sumatra and Borneo since 1990. Land Degrad. Dev. 2010, 21, 285–296. [Google Scholar] [CrossRef]
  107. NASA LAADS DAAC (Archive). Available online: https://ladsweb.modaps.eosdis.nasa.gov/archive/ (accessed on 3 April 2021).
  108. NASA Find Data—LAADS DAAC. Available online: https://ladsweb.modaps.eosdis.nasa.gov/search/ (accessed on 3 April 2021).
  109. NASA LP DAAC (MODIS Download). Available online: https://e4ftl01.cr.usgs.gov/MOLA/ (accessed on 3 April 2021).
  110. NASA MODIS Web. Available online: https://modis.gsfc.nasa.gov/data/dataprod/ (accessed on 3 April 2021).
  111. NASA Moderate Resolution Imaging Spectroradiometer (MODIS)|Earthdata. Available online: https://earthdata.nasa.gov/earth-observation-data/near-real-time/download-nrt-data/modis-nrt (accessed on 3 April 2021).
  112. Fire Information for Resource Management System Archive Download—NASA|LANCE|FIRMS. Available online: https://firms.modaps.eosdis.nasa.gov/download/ (accessed on 1 April 2021).
  113. NASA/METI/AIST/Japan Spacesystems and U.S./Japan ASTER Science Team ASTER Level 2 Surface Temperature Product [Data Set]. Available online: http://lpdaac.usgs.gov/products/ast_08v003/ (accessed on 28 August 2022).
  114. European Space Agency ATSR World Fire Atlas. Available online: http://due.esrin.esa.int/page_wfa.php (accessed on 3 April 2021).
  115. Asean Specialised Meteorological Centre (ASMC) VIIRS Hotspot—Annual. Available online: http://asmc.asean.org/asmc-haze-hotspot-annual-new#Hotspot (accessed on 4 April 2021).
  116. Cooperative Institute for Meteorological Satellite Studies Wildfire Automated Biomass Burning Algorithm (WFABBA). Available online: http://wfabba.ssec.wisc.edu/index.html (accessed on 4 April 2021).
  117. JUPEM Permohonan Lesen Hak Cipta/Membeli Dokumen Geospatial Terperingkat. 2021. Available online: https://www.jupem.gov.my/jupem18a/assets/uploads/images/contents/20220406103724-6ad21-borang-1_edit.pdf (accessed on 28 August 2022).
  118. JUPEM Information Mapping Data Rate (Fi Act 1951: Fees and Payments (Services, Survey and Mapping Data and Reproduction)). 2010. Available online: https://www.jupem.gov.my/page/national-mapping-spatial-data-committee-jpdsn-1 (accessed on 28 August 2022).
  119. MYSA Remote Sensing Data Application Procedure—Malaysian Space Agency (MYSA). Available online: http://www.mysa.gov.my/remote-sensing-data-application-procedure/ (accessed on 5 April 2021).
  120. MYSA Remote Sensing Satellite Data Price List—Malaysian Space Agency (MYSA). Available online: http://www.mysa.gov.my/remote-sensing-satellite-data-price-list/ (accessed on 5 April 2021).
  121. MYSA MYSA|MYSA Free Satellites Data. Available online: http://rsopendata.mysa.gov.my/mrsa_ctlg_dld.php (accessed on 5 April 2021).
  122. Malaysia Government Portal Data Terbuka (One Stop Center for Public Data). Available online: https://www.data.gov.my/ (accessed on 5 April 2021).
  123. Department of Statistics Malaysia Department of Statistics Malaysia Open Data. Available online: https://www.dosm.gov.my/v1/index.php?r=column3/accordion&menu_id=amZNeW9vTXRydTFwTXAxSmdDL1J4dz09 (accessed on 5 April 2021).
  124. Malaysia Meteorological Department MetMalaysia: Ramalan Cuaca Negeri. Available online: https://www.met.gov.my/forecast/weather/state?lang=en (accessed on 6 April 2021).
  125. Malaysian Meteorological Department Malaysian Meteorological Department Web Service API. Available online: https://api.met.gov.my/ (accessed on 5 April 2021).
  126. National Centers for Environmental Information Daily Weather Records|Data Tools|Climate Data Online (CDO)|National Climatic Data Center (NCDC). Available online: https://www.ncdc.noaa.gov/cdo-web/datatools/records (accessed on 5 April 2021).
  127. Department of Agriculture Application of Map/Stage Geospatial Document. Available online: http://www.doa.gov.my/index.php/pages/view/361 (accessed on 5 April 2021).
  128. National Geospatial Centre Malaysia Prosedur Permohonan Data Geospatial|MyGeoportal. Available online: http://www.mygeoportal.gov.my/ms/prosedur-permohonan-data-geospatial (accessed on 5 April 2021).
  129. Soille, P.; Burger, A.; De Marchi, D.; Kempeneers, P.; Rodriguez, D.; Syrris, V.; Vasilev, V. A Versatile Data-Intensive Computing Platform for Information Retrieval from Big Geospatial Data. Futur. Gener. Comput. Syst. 2018, 81, 30–40. [Google Scholar] [CrossRef]
  130. Pebesma, E.; Wagner, W.; Schramm, M.; Von Beringe, A.; Paulik, C.; Neteler, M.; Reiche, J.; Verbesselt, J.; Dries, J.; Goor, E.; et al. OpenEO—A Common, Open Source Interface Between Earth Observation Data Infrastructures and Front-End Applications; European Commission: Viena, Austria, 2017; Volume 57. [Google Scholar]
  131. Wang, L.; Ma, Y.; Yan, J.; Chang, V.; Zomaya, A.Y. PipsCloud: High Performance Cloud Computing for Remote Sensing Big Data Management and Processing. Futur. Gener. Comput. Syst. 2018, 78, 353–368. [Google Scholar] [CrossRef]
  132. United Nations Food and Agriculture Organization Sepal Repository. Available online: https://github.com/openforis/sepal (accessed on 19 July 2021).
  133. Sinergise Sentinel Hub. Available online: https://www.sentinel-hub.com/ (accessed on 19 July 2021).
  134. Chew, Y.J.; Ooi, S.Y.; Pang, Y.H. Data Acquisition Guide for Forest Fire Risk Modelling in Malaysia. In Proceedings of the 2021 9th International Conference on Information and Communication Technology (ICoICT), Yogyakarta, Indonesia, 3–5 August 2021; pp. 633–638. [Google Scholar] [CrossRef]
  135. Cortez, P.; Morais, A. A Data Mining Approach to Predict Forest Fires Using Meteorological Data. In Proceedings of the New Trends in Artificial Intelligence, 13th EPIA 2007, Portugese Conference on Artificial Intelligence, Guimaraes, Portugal, 3–7 December 2007; pp. 512–523. [Google Scholar]
  136. Maeda, E.E.; Formaggio, A.R.; Shimabukuro, Y.E.; Arcoverde, G.F.B.; Hansen, M.C. Predicting Forest Fire in the Brazilian Amazon Using MODIS Imagery and Artificial Neural Networks. Int. J. Appl. Earth Obs. Geoinf. 2009, 11, 265–272. [Google Scholar] [CrossRef]
  137. Cheney, N.P.; Gould, J.S.; McCaw, W.L.; Anderson, W.R. Predicting Fire Behaviour in Dry Eucalypt Forest in Southern Australia. For. Ecol. Manag. 2012, 280, 120–131. [Google Scholar] [CrossRef]
  138. Pham, B.T.; Jaafari, A.; Avand, M.; Al-Ansari, N.; Dinh Du, T.; Yen, H.P.H.; Van Phong, T.; Nguyen, D.H.; Van Le, H.; Mafi-Gholami, D. Performance Evaluation of Machine Learning Methods for Forest Fire Modeling and Prediction. Symmetry 2020, 12, 1022. [Google Scholar] [CrossRef]
  139. Stojanova, D.; Panov, P.; Kobler, A.; Džeroski, S.; Taškova, K. Learning to Predict Forest Fires with Different Data Mining Techniques. In Proceedings of the Conference on Data Mining and Data Warehouses (SiKDD 2006), Ljubljana, Slovenia, 17 October 2006; pp. 255–258. [Google Scholar]
  140. Bui, D.T.; Bui, Q.-T.; Nguyen, Q.-P.; Pradhan, B.; Nampak, H.; Trinh, P.T. A Hybrid Artificial Intelligence Approach Using GIS-Based Neural-Fuzzy Inference System and Particle Swarm Optimization for Forest Fire Susceptibility Modeling at a Tropical Area. Agric. For. Meteorol. 2017, 233, 32–44. [Google Scholar]
  141. Bui, D.T.; Hoang, N.-D.; Samui, P. Spatial Pattern Analysis and Prediction of Forest Fire Using New Machine Learning Approach of Multivariate Adaptive Regression Splines and Differential Flower Pollination Optimization: A Case Study at Lao Cai Province (Viet Nam). J. Environ. Manag. 2019, 237, 476–487. [Google Scholar]
  142. Monjarás-Vega, N.A.; Briones-Herrera, C.I.; Vega-Nieva, D.J.; Calleros-Flores, E.; Corral-Rivas, J.J.; López-Serrano, P.M.; Pompa-García, M.; Rodríguez-Trejo, D.A.; Carrillo-Parra, A.; González-Cabán, A. Predicting Forest Fire Kernel Density at Multiple Scales with Geographically Weighted Regression in Mexico. Sci. Total Environ. 2020, 718, 137313. [Google Scholar] [CrossRef]
  143. Moayedi, H.; Mehrabi, M.; Bui, D.T.; Pradhan, B.; Foong, L.K. Fuzzy-Metaheuristic Ensembles for Spatial Assessment of Forest Fire Susceptibility. J. Environ. Manag. 2020, 260, 109867. [Google Scholar] [CrossRef]
  144. Sevinc, V.; Kucuk, O.; Goltas, M. A Bayesian Network Model for Prediction and Analysis of Possible Forest Fire Causes. For. Ecol. Manag. 2020, 457, 117723. [Google Scholar] [CrossRef]
  145. Jiao, L.; Zhao, J. A Survey on the New Generation of Deep Learning in Image Processing. IEEE Access 2019, 7, 172231–172263. [Google Scholar] [CrossRef]
  146. Zhang, Q.; Xu, J.; Xu, L.; Guo, H. Deep Convolutional Neural Networks for Forest Fire Detection. In Proceedings of the 2016 International Forum on Management, Education and Information Technology Application, Guangzhou, China, 30–31 January 2016; Atlantis Press: Amsterdam, The Netherlands, 2016. [Google Scholar]
  147. Bilikent SPG Computer Vision Based Fire Detection Dataset. Available online: http://signal.ee.bilkent.edu.tr/VisiFire/ (accessed on 5 November 2021).
  148. Muhammad, K.; Ahmad, J.; Baik, S.W. Early Fire Detection Using Convolutional Neural Networks during Surveillance for Effective Disaster Management. Neurocomputing 2018, 288, 30–42. [Google Scholar] [CrossRef]
  149. Hodges, J.L.; Lattimer, B.Y. Wildland Fire Spread Modeling Using Convolutional Neural Networks. Fire Technol. 2019, 55, 2115–2142. [Google Scholar] [CrossRef]
  150. Wang, Y.; Dang, L.; Ren, J. Forest Fire Image Recognition Based on Convolutional Neural Network. J. Algorithms Comput. Technol. 2019, 13, 1748302619887689. [Google Scholar] [CrossRef]
  151. Zhang, G.; Wang, M.; Liu, K. Forest Fire Susceptibility Modeling Using a Convolutional Neural Network for Yunnan Province of China. Int. J. Disaster Risk Sci. 2019, 10, 386–403. [Google Scholar] [CrossRef]
  152. Jiao, Z.; Zhang, Y.; Xin, J.; Mu, L.; Yi, Y.; Liu, H.; Liu, D. A Deep Learning Based Forest Fire Detection Approach Using UAV and YOLOv3. In Proceedings of the 2019 1st International Conference on Industrial Artificial Intelligence (IAI), Shenyang, China, 23–27 July 2019; pp. 1–5. [Google Scholar]
  153. Wang, S.; Zhao, J.; Ta, N.; Zhao, X.; Xiao, M.; Wei, H. A Real-Time Deep Learning Forest Fire Monitoring Algorithm Based on an Improved Pruned + KD Model. J. Real-Time Image Process. 2021, 18, 2319–2329. [Google Scholar] [CrossRef]
  154. Son, B.; Her, Y.; Kim, J.-G. A Design and Implementation of Forest-Fires Surveillance System Based on Wireless Sensor Networks for South Korea Mountains. Int. J. Comput. Sci. Netw. Secur. 2006, 6, 124–130. [Google Scholar]
  155. Hartung, C.; Han, R.; Seielstad, C.; Holbrook, S. FireWxNet: A Multi-Tiered Portable Wireless System for Monitoring Weather Conditions in Wildland Fire Environments. In Proceedings of the 4th International Conference on Mobile Systems, Applications and Services, Uppsala, Sweden, 19–22 June 2006; pp. 28–41. [Google Scholar]
  156. Okokpujie, K.O.; John, S.N.; Noma-Osaghae, E.; Okokpujie, I.P.; Okonigene, R.E. A Wireless Sensor Network Based Fire Protection System with Sms Alerts. Int. J. Mech. Eng. Technol. 2019, 10, 44–52. [Google Scholar]
  157. Oliveira, S.; Oehler, F.; San-Miguel-Ayanz, J.; Camia, A.; Pereira, J.M.C. Modeling Spatial Patterns of Fire Occurrence in Mediterranean Europe Using Multiple Regression and Random Forest. For. Ecol. Manag. 2012, 275, 117–129. [Google Scholar] [CrossRef]
  158. Pu, R.; Li, Z.; Gong, P.; Csiszar, I.; Fraser, R.; Hao, W.-M.; Kondragunta, S.; Weng, F. Development and Analysis of a 12-Year Daily 1-Km Forest Fire Dataset across North America from NOAA/AVHRR Data. Remote Sens. Environ. 2007, 108, 198–208. [Google Scholar] [CrossRef]
  159. Lestari, A.; Rumantir, G.; Tapper, N. A Spatio-Temporal Analysis on the Forest Fire Occurrence in Central Kalimantan, Indonesia. In Proceedings of the 20th Pacific Asia Conference on Information Systems, Chiayi, Taiwan, 27 June 2016; p. 90. [Google Scholar]
  160. Page, S.E.; Hooijer, A. In the Line of Fire: The Peatlands of Southeast Asia. Philos. Trans. R. Soc. B Biol. Sci. 2016, 371, 20150176. [Google Scholar] [CrossRef]
  161. Kosko, B. Fuzzy Cognitive Maps. Int. J. Man. Mach. Stud. 1986, 24, 65–75. [Google Scholar] [CrossRef]
  162. Yao, J.; Raffuse, S.M.; Brauer, M.; Williamson, G.J.; Bowman, D.M.J.S.; Johnston, F.H.; Henderson, S.B. Predicting the Minimum Height of Forest Fire Smoke within the Atmosphere Using Machine Learning and Data from the CALIPSO Satellite. Remote Sens. Environ. 2018, 206, 98–106. [Google Scholar] [CrossRef]
  163. Pourtaghi, Z.S.; Pourghasemi, H.R.; Aretano, R.; Semeraro, T. Investigation of General Indicators Influencing on Forest Fire and Its Susceptibility Modeling Using Different Data Mining Techniques. Ecol. Indic. 2016, 64, 72–84. [Google Scholar] [CrossRef]
  164. Dueben, P.; Schultz, M.G.; Chantry, M.; Gagne, D.J.; Hall, D.M.; McGovern, A. Challenges and Benchmark Datasets for Machine Learning in the Atmospheric Sciences: Definition, Status and Outlook. Artif. Intell. Earth Syst. 2022, 1, 1–29. [Google Scholar] [CrossRef]
  165. Mangasarian, O.L.; Wolberg, W.H. Cancer Diagnosis via Linear Programming; University of Wisconsin-Madison Department of Computer Sciences: Madison, WI, USA, 1990. [Google Scholar]
  166. Russakovsky, O.; Deng, J.; Su, H.; Krause, J.; Satheesh, S.; Ma, S.; Huang, Z.; Karpathy, A.; Khosla, A.; Bernstein, M. Imagenet Large Scale Visual Recognition Challenge. Int. J. Comput. Vis. 2015, 115, 211–252. [Google Scholar] [CrossRef]
  167. Rasp, S.; Dueben, P.D.; Scher, S.; Weyn, J.A.; Mouatadid, S.; Thuerey, N. WeatherBench: A Benchmark Data Set for Data-driven Weather Forecasting. J. Adv. Model. Earth Syst. 2020, 12, e2020MS002203. [Google Scholar] [CrossRef]
  168. Sayad, Y.O.; Mousannif, H.; Al Moatassime, H. Predictive Modeling of Wildfires: A New Dataset and Machine Learning Approach. Fire Saf. J. 2019, 104, 130–146. [Google Scholar] [CrossRef]
  169. Copernicus Emergency Management Service. Available online: https://emergency.copernicus.eu/ (accessed on 10 August 2022).
  170. European Forest Fire Information System. Available online: https://effis.jrc.ec.europa.eu/ (accessed on 10 August 2022).
  171. Lizundia-Loiola, J.; Otón, G.; Ramo, R.; Chuvieco, E. A Spatio-Temporal Active-Fire Clustering Approach for Global Burned Area Mapping at 250 m from MODIS Data. Remote Sens. Environ. 2020, 236, 111493. [Google Scholar] [CrossRef]
  172. Giglio, L.; Boschetti, L.; Roy, D.P.; Humber, M.L.; Justice, C.O. The Collection 6 MODIS Burned Area Mapping Algorithm and Product. Remote Sens. Environ. 2018, 217, 72–85. [Google Scholar] [CrossRef] [PubMed]
  173. Artés, T.; Oom, D.; De Rigo, D.; Durrant, T.H.; Maianti, P.; Libertà, G.; San-Miguel-Ayanz, J. A Global Wildfire Dataset for the Analysis of Fire Regimes and Fire Behaviour. Sci. Data 2019, 6, 296. [Google Scholar] [CrossRef] [PubMed]
  174. De, D.K.; Olawole, O.C.; Joel, E.S.; Ikono, U.I.; Oyedepo, S.O.; Olawole, O.F.; Obaseki, O.; Oduniyi, I.; Omeje, M.; Ayoola, A.A. Twenty-First Century Technology of Combating Wildfire. IOP Conf. Ser. Earth Environ. Sci. 2019, 331, 12015. [Google Scholar] [CrossRef]
  175. Sullivan, A.L. Wildland Surface Fire Spread Modelling, 1990–2007. 1: Physical and Quasi-Physical Models. Int. J. Wildl. Fire 2009, 18, 349–368. [Google Scholar] [CrossRef]
  176. Koo, E.; Pagni, P.; Woycheese, J.; Stephens, S.; Weise, D.; Huff, J. A Simple Physical Model for Forest Fire Spread. Fire Saf. Sci. 2005, 8, 851–862. [Google Scholar] [CrossRef]
  177. Coen, J. Some Requirements for Simulating Wildland Fire Behavior Using Insight from Coupled Weather—Wildland Fire Models. Fire 2018, 1, 6. [Google Scholar] [CrossRef]
  178. Yeoh, G.H.; Yuen, K.K. Computational Fluid Dynamics in Fire Engineering: Theory, Modelling and Practice; Butterworth-Heinemann: Oxford, UK, 2009; ISBN 0080570038. [Google Scholar]
  179. Mell, W.; Maranghides, A.; McDermott, R.; Manzello, S.L. Numerical Simulation and Experiments of Burning Douglas Fir Trees. Combust. Flame 2009, 156, 2023–2041. [Google Scholar] [CrossRef]
  180. Lin, Y.; Delichatsios, M.A.; Zhang, X.; Hu, L. Experimental Study and Physical Analysis of Flame Geometry in Pool Fires under Relatively Strong Cross Flows. Combust. Flame 2019, 205, 422–433. [Google Scholar] [CrossRef]
  181. Morvan, D. A Numerical Study of Flame Geometry and Potential for Crown Fire Initiation for a Wildfire Propagating through Shrub Fuel. Int. J. Wildl. Fire 2007, 16, 511–518. [Google Scholar] [CrossRef]
  182. Mutthulakshmi, K.; Wee, M.R.E.; Wong, Y.C.K.; Lai, J.W.; Koh, J.M.; Acharya, U.R.; Cheong, K.H. Simulating Forest Fire Spread and Fire-Fighting Using Cellular Automata. Chin. J. Phys. 2020, 65, 642–650. [Google Scholar] [CrossRef]
  183. Alexandridis, A.; Russo, L.; Vakalis, D.; Bafas, G.V.; Siettos, C.I. Wildland Fire Spread Modelling Using Cellular Automata: Evolution in Large-Scale Spatially Heterogeneous Environments under Fire Suppression Tactics. Int. J. Wildl. Fire 2011, 20, 633–647. [Google Scholar] [CrossRef]
  184. Ghosh, P.; Mukhopadhyay, A.; Chanda, A.; Mondal, P.; Akhand, A.; Mukherjee, S.; Nayak, S.K.; Ghosh, S.; Mitra, D.; Ghosh, T. Application of Cellular Automata and Markov-Chain Model in Geospatial Environmental Modeling—A Review. Remote Sens. Appl. Soc. Environ. 2017, 5, 64–77. [Google Scholar] [CrossRef]
Figure 1. Hotspot locations based on historical fire information from previous studies.
Forests 13 01405 g001
Figure 2. Proposed general methodology.
Forests 13 01405 g002
Figure 3. Overview of forest fire detection and monitoring technology.
Forests 13 01405 g003
Table 1. Summary of the research efforts into the causes and effects of forest fire.
Year of PublicationReferencesYear of StudiesLocationObjective
1989[21]1983–1985SabahStudy the tree mortality rate and canopy loss of forest fires in over-logged forest and primary tropical forests in Sabah.
1998[9]1997–1998Sarawak IndonesiaInternational Tropical Timber Organisation (ITTO) aimed to investigate the effects of forest fires in Indonesia and Sarawak. Human activity was found to be primary cause.
2002[8]1991–2001Peninsular MalaysiaExplore the root causes of forest fire incidents, particularly for peat swamps in Malaysia. Human negligence was the predominant factor. It was reported that Selangor, Malaysia had the highest number of forest fire incidents from 1991 to 2001.
2002[35]1992–1998Peninsular MalaysiaDiscuss the causes of the forest fires from 1992 to 1998. Human activity was the biggest element constituting forest fire incidents. It was emphasised that peatland fires (underground fires) are difficult to detect.
2002[36]-Southeast AsiaShow that peatland forest fires are a major issue in Southeast Asia, as well as reveal that most of the forest fires were ignited in the vicinity of poor communities. Authors recommended international funding as a solution to prevent forest fire incidents.
Table 2. Summary of the efforts for forest fire susceptibility map generation.
Year of PublicationReferencesYear of StudiesLocationObjective
2004[10]1997Pekan District, PahangCategorise the factors (e.g., land use, slope risk, aspect risk, elevation risk, and distance to road) into risk scores from 1 to 4. The sum of the risk score for all the factors was used to generate the fire susceptibility map.
2004[42]2000Malaysia/Western IndonesiaClassify the fuel types and soil types for Malaysia and Western Indonesia based on global vegetation data.
2005[45]1995–2001Malaysia/IndonesiaCalibrate the parameters of Fine Fuel Moisture Code (FFMC) and fire weather index (FWI) of the Canadian Forest Fire Weather Index System (CFFWIS) to provide early warnings of forest fires.
2006[48]2002–2003Peninsular Malaysia (10 Meteorological Station)Utilise MODIS level-1 and level-2 data to estimate the relative humidity parameters necessary to calculate the fire weather index from the CFFDRS.
2006[11]June 1999Kuala SelangorTo compute a fire risk index model by considering the topography, weather (atmospheric conditions), and fuel types as the input for mapping fire risk.
2007[51]2000–2005Sungai Karang, Selangor/Raja Muda Forest Reserve, SelangorEstimate the probability of forest fires by measuring the likelihood ratio (i.e., frequency ratio) between fire hotspots and forest fire factors. To compute the forest risk index, the summation of each frequency ratio for each pixel was calculated.
2007[52]2004–2005Peninsular MalaysiaDevise a fire risk index by exploiting the concept of pre-ignition heat energy that assesses the ignition probabilities by estimating the amount of heat energy necessary to burn the fuel from its current temperature.
2007[54]Implemented in 1999Southeast Asia (ASEAN)The first fire danger rating system (FDRS) was successfully implemented to provide forecasts and early warnings for fire occurrences. The FDRS is still in operation to date, and it is publicly accessible from the Malaysia Meteorological Department [55] and Indonesia Meteorological Climatological and Geophysical Agency [80].
2008[58]1990–1995Kelantan, Sarawak, Sabah, and SelangorPredict the probability of fire occurrence by measuring soil moisture (i.e., the volume of water) by adopting the Keetch–Byram Drought Index (KDBI).
2009[61]1995–1999Peninsular MalaysiaEnhance the original pre-ignition heat energy risk index model by incorporating temperature, relative humidity, vegetation index, and fuel map to generate the fire susceptibility map.
2009[62]1995–1999Pekan, PahangDevelop a system (interface) in ArcView to simplify the user–system interaction for generating a fire map. The authors employed the analytical hierarchy process (AHP) tools (i.e., overlaying geoprocessing tools) in GIS software.
2010[64]1998Batu Enam, Jalan Pekan, Kuantan, PahangDesign a fire hazard rating model integrating nine classes of fuel type and human activity parameters (e.g., distance to road and canal buffers) to classify the region into five degrees of fire severity risk. Instead of the NDVI, the Tasseled Cap (TC) transformation vegetation index was used as it was a more effective scheme for detecting peat swamps and burnt land.
2011[66]-Selangor, Kuala Langat, and PahangPropose an index that considers multiple factors affecting forest fires in peat swamps (e.g., peat depth, bulk density, and moisture content) to generate a fire map.
2013[67]September 2008–July 2011Malaysia and IndonesiaInvestigate the suitability and reliability of the application of the Wildfire Biomass Burning Algorithm (WFFABBA) from the Multifunction Transport Satellite (MTSAT) by comparing the pattern of fire activity with the results from MODIS MOD14 in Malaysia and Indonesia.
2014
2013
[68,69]-SelangorWeigh the forest fire factors essential in the analytical hierarchy process (AHP) mathematical model by conducting a survey with three domain experts from the Fire and Rescue Department Malaysia. The model was deployed in WebGIS to generate a fire risk map for Selangor, Malaysia.
2014[70]1997–2008MalaysiaUtilise the number of fires collected from the ASTR World Fire Atlas product for 12 years to understand the spatial and temporal pattern of fire activity in the entirety of Malaysia by adopting monthly frequency analysis and clustering analysis.
2016[71]2006–2010SabahPerform annual, month, and area frequency analyses using five years of fire hotspot data from the Fire Information for Resource Management System (i.e., a product of MODIS).
2016[73]2014Pekan, PahangUtilise the thermal band from Landsat 8 to estimate and classify the temperature into five distinct severities. Analyse the temperature before, during, and after a fire incident by using the five categorised temperatures and change detection mapping.
2017[74]2015Peninsular Malaysia, Sumatra, and BorneoInvestigate the relationship of fire incidents in (i) peat soil vs. mineral soil and (ii) peat soil with different land covers in Malaysia and Indonesia by using the MODIS hotspot counts obtainable from the Fire Information and Resource Management System.
Table 3. Summary of the efforts (excluding studies related to fire susceptibility mapping) associated with forest fires.
Year of PublicationReferencesYear of StudiesLocationObjective
2005[81]February to March of 2002Peninsular MalaysiaEstimate the pollutant emissions from agricultural burning by employing emission equations. Utilise remote sensing data (i.e., number of hotspots) from NOAA AVHRR to provide necessary input parameters to the formula.
2007[83]1997 and 1999Klias Peninsula, SabahEstimate the burned peat swamp region by comparing the pre-fire (1997) and post-fire (1999) Landsat satellite imagery by employing an image differencing technique utilising three vegetation indexes.
2010[84]2001–2002Raja Musa Forest Reserve, SelangorStudy the impact of forest fire on the composition of species and forest structure for the peat swamp forest.
2010[85]2001–2004SelangorAdopt the random spread model of Serra [86] to predict the area burned by forest fire by understanding the propagation of forest fires by utilising spread rates and fuel maps as the input parameters to the model.
2014[87]2000–2007Klang,
Selangor
Investigate the relationship between mortality rate and haze events in Klang Valley by analysing the daily mortality rate in conjunction with the daily particulate matter (PM10) concentration.
2017[88]-Klias Forest Reserves, SabahAssess the awareness of the neighbourhood around Klias Forest Reserves for forest fire prevention. Authors discovered that the community lacks awareness but is willing to cooperate to prevent and extinguish forest fires.
2018[89]August 2015 and July 2016Pekan, Pahang
North Selangor
Measure the emission factors (i.e., the concentration of gaseous) from the plumes collected from the peatland fires through open-path transform infrared spectroscopy.
2020[90]-Raja Musa Forest Reserve, SelangorFocus on the discussion of post-fire management through a case study in Raja Musa Forest Reserve, Selangor. Describe the restoration and rehabilitation process of degraded peat swamp forests.
2021[92]January 2020–March 2020Raja Musa Forest Reserve, SelangorAdopt an IoT approach to collect real-time environmental variables for evaluating the condition of the peat forest.
Table 4. Previous studies conducted in Malaysia grouped by state.
StateSpecific LocationYear of StudiesReferencesTotal No. of Studies
Sabah-1983–1985[21]5
-1990–1995[58]
-2006–2010[71]
Klias Peninsula1997 and 1999[83]
Klias Forest Reserves-[88]
Sarawak-1997–1998[9]2
-1990–1995[58]
PahangPekan1997[10]6
Pekan1995–1999[62]
Pekan1998[64]
--[66]
Pekan2014[73]
Pekan2015 August and 2016 July[89]
SelangorKuala Selangor1999[11]12
Sungai Karang and Raja Musa Forest Reserve2000–2005[51]
Raja Musa Forest Reserve2001–2002[84]
Raja Musa Forest Reserve-[90]
Raja Musa Forest Reserve2020[92]
Kuala Langat-[66]
Klang2000–2007[87]
Kuala Langat, North SelangorAugust 2015 and July 2016[89]
-2001–2004[85]
--[68]
[69]
-1990–1995[58]
Kelantan-1990–1995[58]1
Table 7. Summary of general machine learning classification techniques used for forest fire detection tasks.
Year of PublicationReferenceYear of StudiesDatasetObjective
2017[140]Lam Dong, VietnamGIS database built based on the 10 factors associated with forest firesTo investigate forest fire susceptibility through the combined usage of neural fuzzy inference system (NF) and particle swarm optimization (PSO).
2019[141]Lam Dong, VietnamGIS database built based on the 10 factors associated with forest fireTo produce a forest fire susceptibility map through a hybrid methodology by combining Multivariate Adaptive Regression Splines (MARS) and Differential Flower Pollination (DFP).
2020[142]MexicoGIS database built based on the 16 factors associated with forest firesTo adopt geographically weighted regression (GWR) to predict fire density.
2020[143]IranGIS point database utilising 15 forest fire factorsTo segregate the location into different fire-prone risks by combining adaptive neuro-fuzzy inference system (ANFIS) with the genetic algorithm (GA), particle swarm optimisation (PSO), or differential evolution (DE).
2020[144]TurkeyTable data including fire causes and 9 ignition factorsTo investigate the probable causes for the fires by building Bayesian networks for each fire cause along with the ignition factors.
Table 8. Summary of deep learning techniques in forest fire detection tasks.
Year of PublicationReferenceDatasetObjectiveAlgorithm
2016[146]Image: unmanned aerial vehicle (UAV)Establish computer vision/image recognitionFull image and fine-grained patch fire classifier with deep convolutional neural networks (CNNs)
2018[148]Image: CCTV surveillance cameraEstablish computer vision/image recognitionFine-tuned CNN
2019[149]Remote sensing data consists of 13 fire-influencing attributesEstimate the spread of wildfiresDeep Convolutional Inverse Graphic Network (DGIGN)—Deep CNN and transport CNN
2019[150]Image: Corsica Fire DatabaseEstablish computer vision/image recognitionConventional image processing, AlexNet CNN, and modified adaptive pooling
2019[151]Remote sensing data containing 14 fire-influencing factorsClassify fire pixelsFeature selection: multicollinearity analysis/information gain ratio and CNN
2019[152]Image: UAVEstablish computer vision/image recognition (real-time)Low-power YOLOv3 CNN
2020[102]Satellite Image: SAR Image (Sentinel-1 Synthetic Aperture Radar)Establish automatic burnt region detectionCNN
2021[153]Image: UAVEstablish computer vision/image recognitionLightweight YOLO and MobileNetV3 with pruned network and knowledge distillation
Publisher’s Note: MDPI stays neutral with regard to jurisdictional claims in published maps and institutional affiliations.

